A Study of Supply Chain Risk in the Brazilian Wind Power Projects by Interpretive Structural Modeling and MICMAC Analysis

 ,
,
Abstract
:1. Introduction
2. Literature Review
2.1. Wind Power Supply Chain Risk Factors
2.2. Interpretive Structural Modeling: Applications and Features
2.3. MICMAC Analysis
3. Materials and Methods
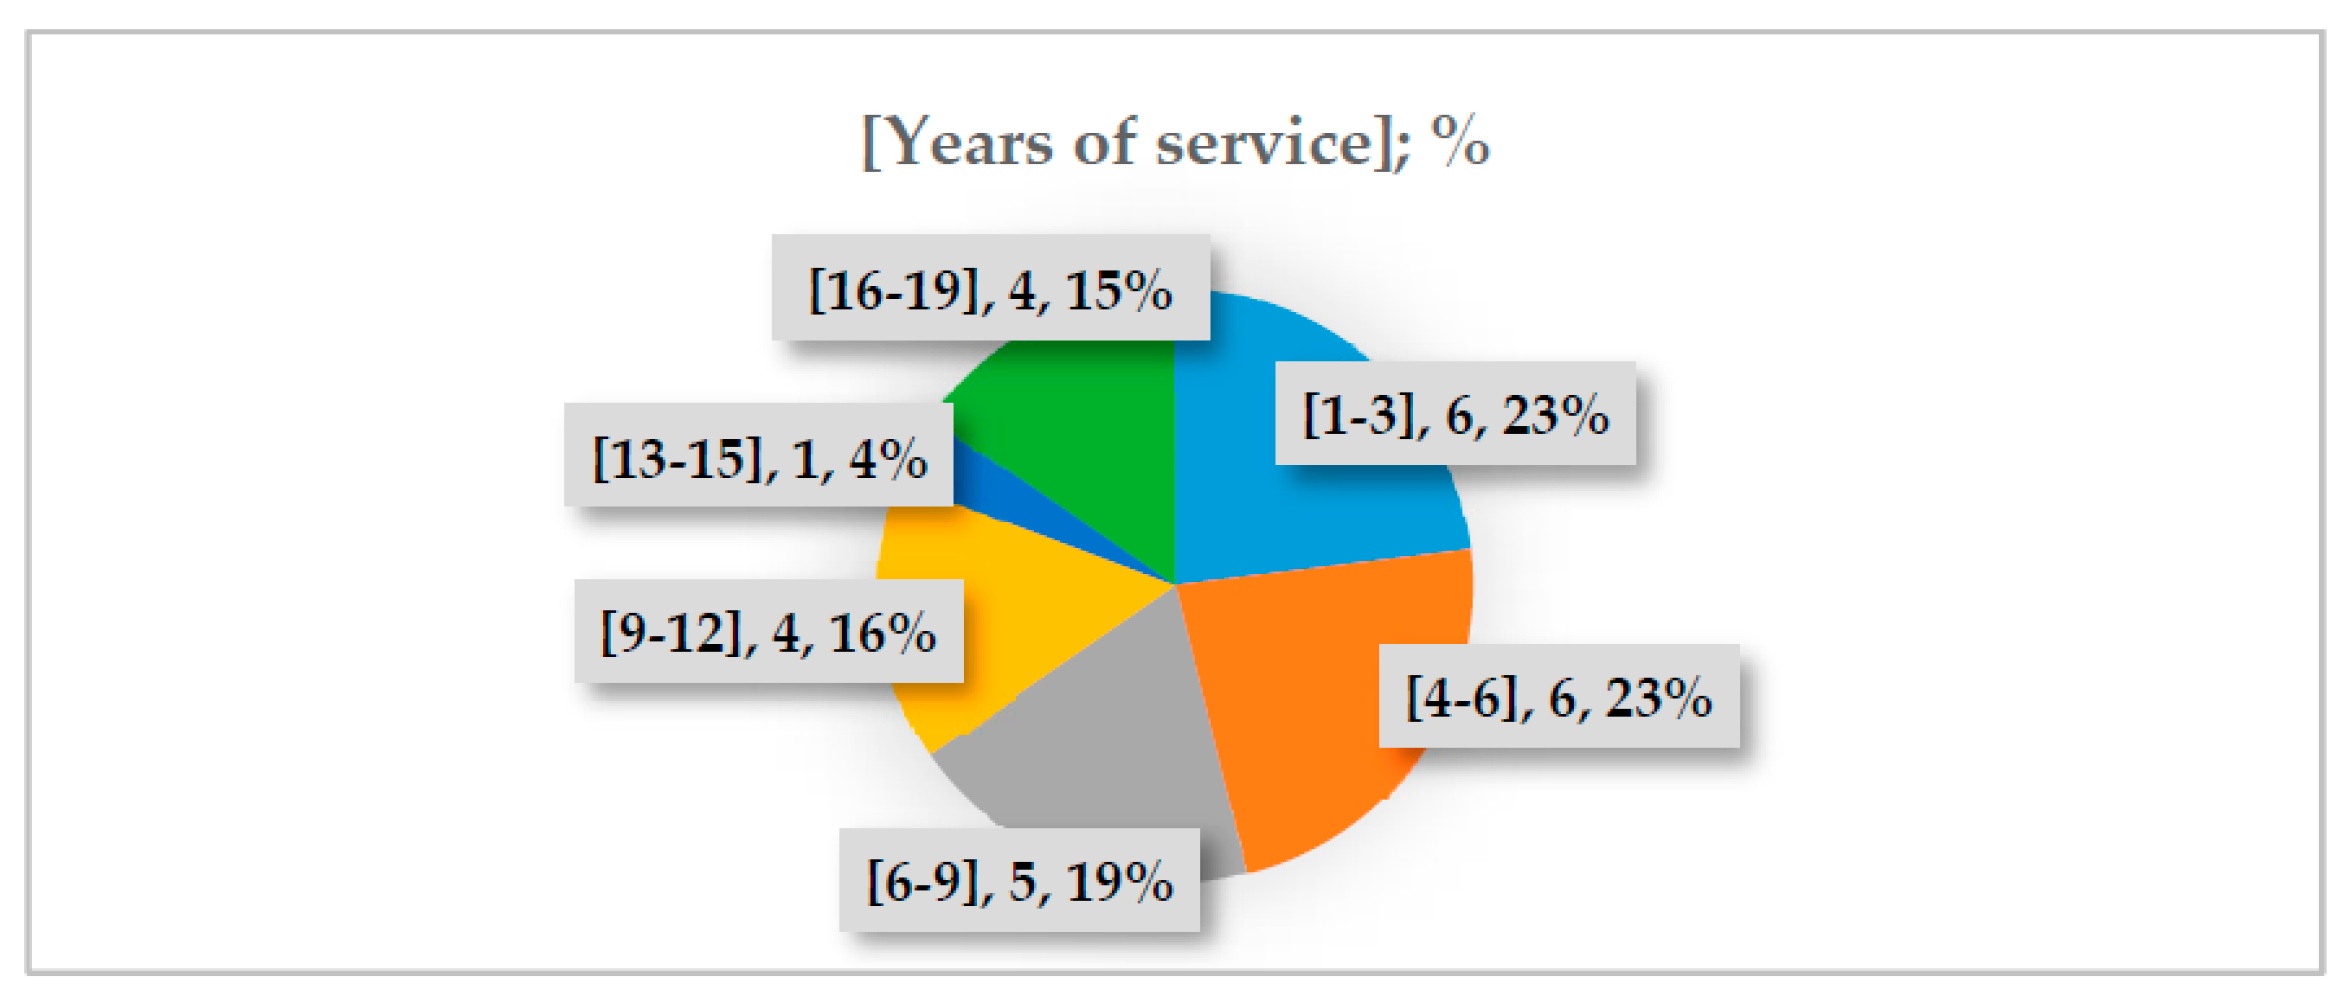
3.1. Participants and Data Collection
3.2. Interpretive Structural Modeling
- Identification of variables: a set of risk factors are identified employing techniques as literature review and experts brainstorming (risk variables are listed in Table 1).
- Contextual relationship: It was established between each pair of variables. The self-structural interaction matrix (SSIM) is constructed following the rule: “V” if the risk variable i leads to the variable j (direct relationship); “A” when the variable j leads to the variable i (inverted relationship); “X” if the relationship between risk variables are in both directions (double relationship); and “O” when does not exist relationship between the pair of variables.
- Initial reachability matrix: The SSIM matrix is transformed into a binary matrix (0 and 1’s) following this rule: a) If the variable (i,j) is V, then the variable (i,j) is 1 and the variable (j,i) is 0; b) If the variable (i,j) is A, then the variable (i,j) is 0 and the variable (j,i) is 1; c) If the variable (i,j) is X, then the variable (i,j) and the variable (j,i) takes the value of 1; and d) If the variable (i,j) is O, then the variable (i,j) and the variable (j,i) takes the value of 0.
- Final reachability matrix with transitivity check: It is a verification step of the reachability matrix. This is made by a logical analysis: If a variable A has relationship with another variable B, and, if the variable B has relationship with another C; then, it can be concluded that variables A and C have some relationship.
- Definition of levels: The final matrix is converted into a canonical relationship matrix by grouping the elements into their respective levels. The reachability and antecedent sets of variables are constructed from the final reachability matrix. Reachability sets are formed by the factors related (with value of 1) into the horizontal direction while the antecedent sets are obtained from the vertical direction from each risk factor. Intersection points are identified when the same set appears in both columns.
- Construction of the ISM model: The set of variables into their respective levels are linked according to their relationships as defined by the self-structural interaction matrix.
3.3. MICMAC Analysis
4. Results
4.1. Interpretive Structural Modeling
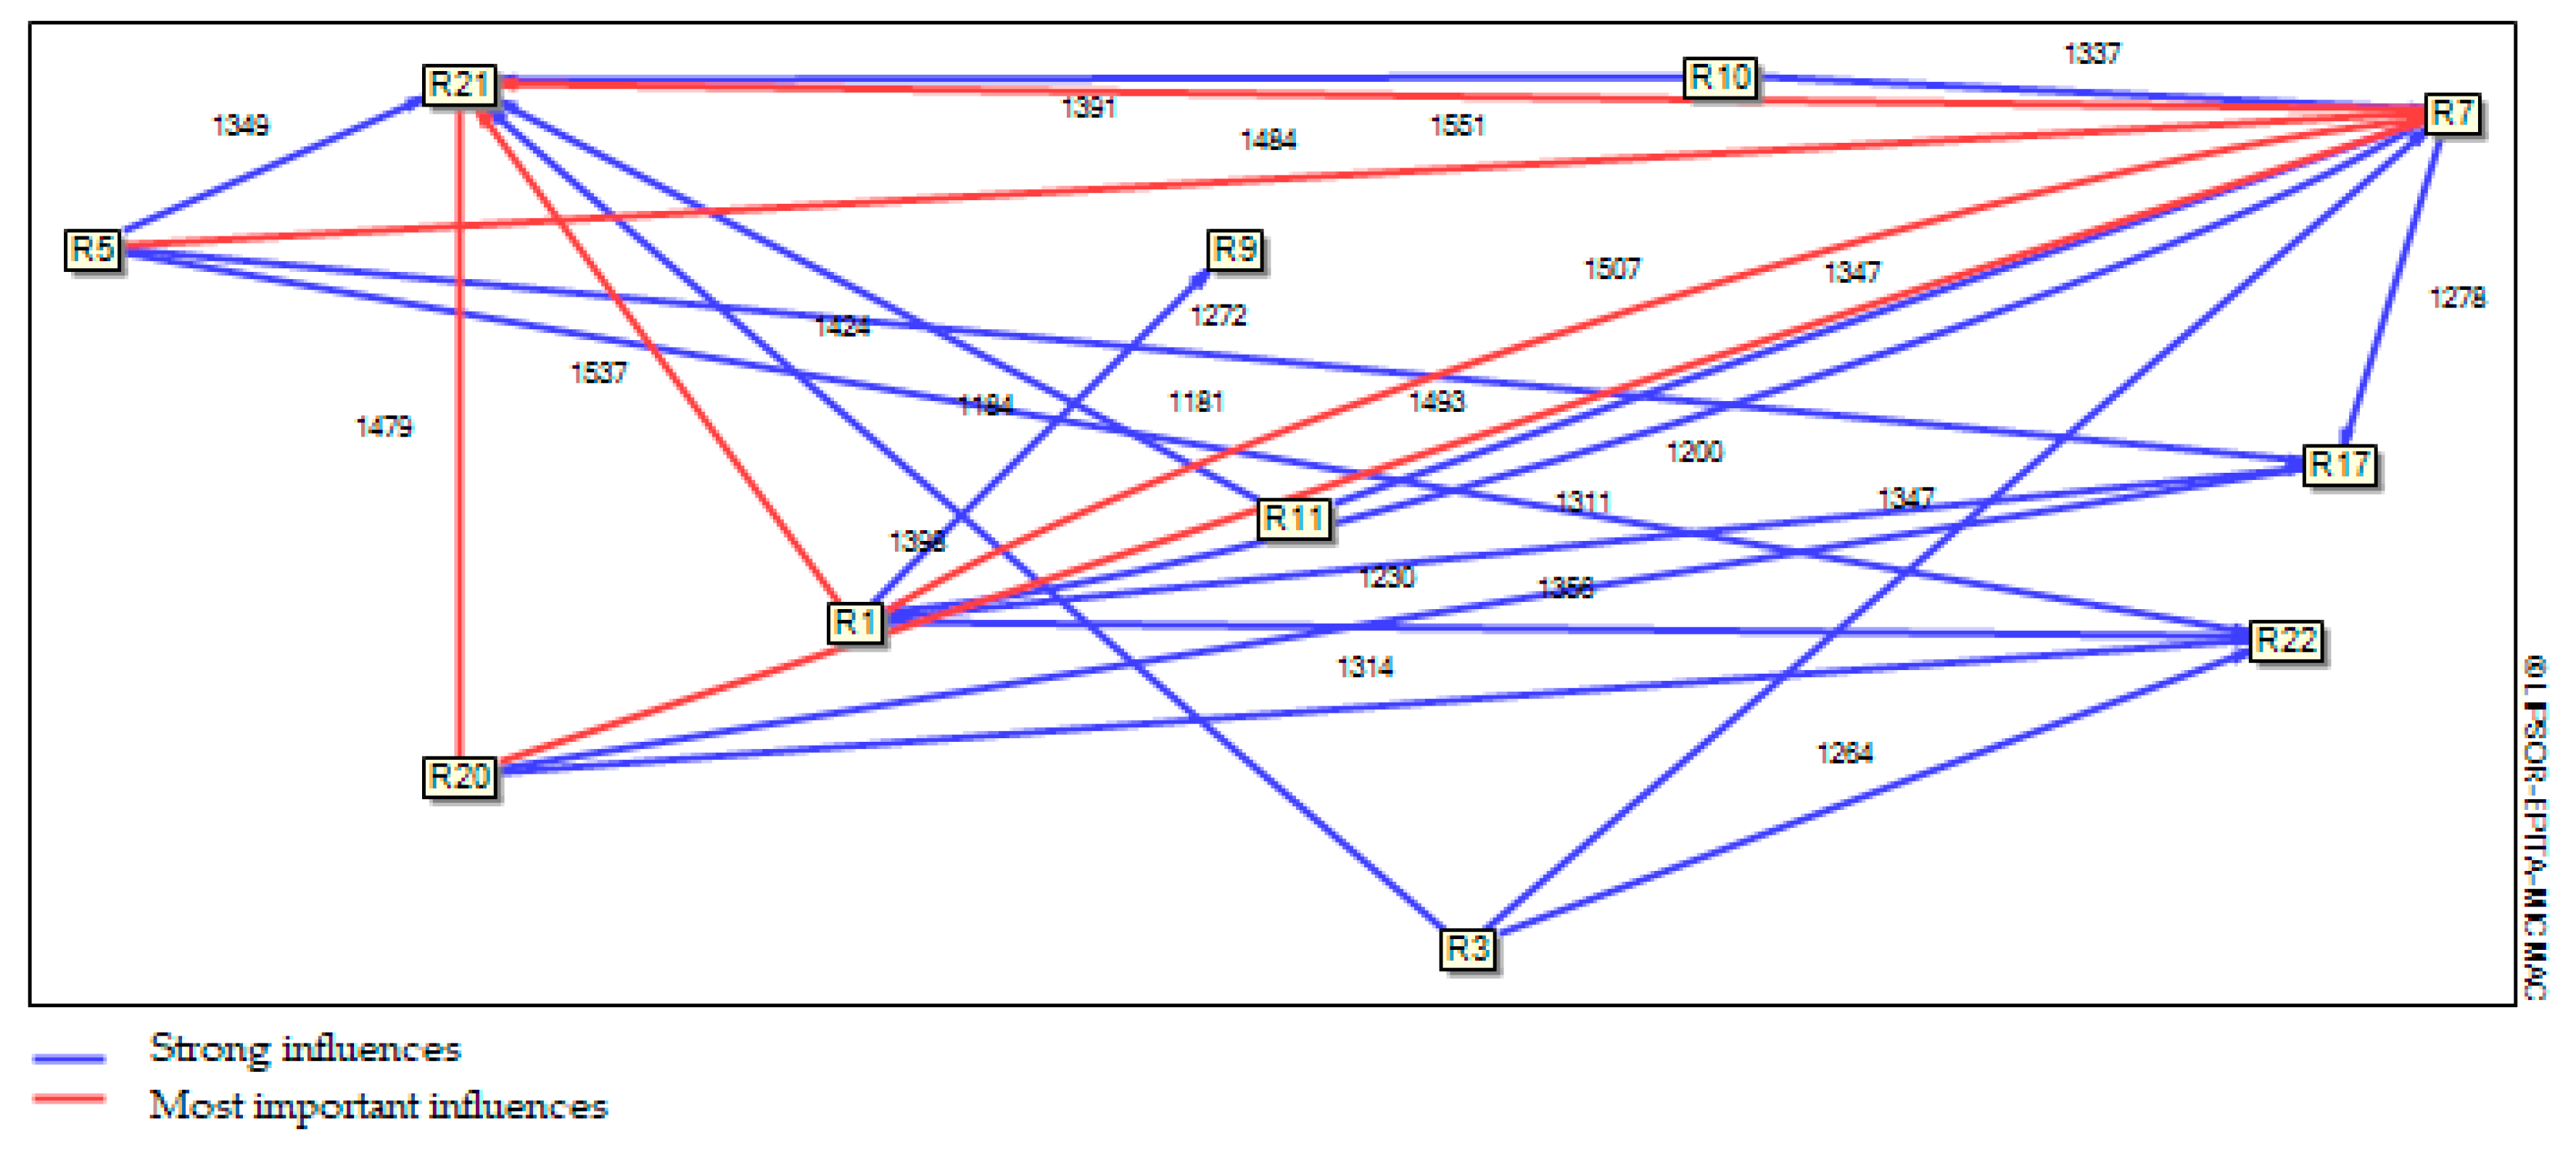
4.2. MICMAC Analysis
5. Discussion
5.1. Interpretive Structural Modeling
5.2. MICMAC Analysis
- Z1, independent factors: on this zone lies seven risk variables, around 32% of risk factors. This zone represents variables that are little dependent but most conductive. Variables on this zone are labor force unavailability risk (R2), technology and innovation risk (R3), transport risk (R6), natural hazards risk (R11), energy price variation risk (R16), ecological damage risk (R18) and public policy and regulatory risk (R20). Some transformation on those risk factors on this zone would affect the whole system. It is important to understand which variables can be prioritized to design mitigation strategies by the companies on this zone. Transportation risks (R6) and Technology and innovation risk (R3) could be monitored to implement action strategies to guarantee a better performance of the system. Variables not under control need to be supervised, in an attempt to prevent changes and improve mitigation strategies, as natural hazards (R11) and public policy and regulatory risks (R20).
- Z2, autonomous factors: this zone identified three risk factors, demand risk (R8), losses by wind quality risk (R14) and IT/communication risk (R19). Those risk factors, with less conductivity and dependence on the system, are variables that demand less attention at the current situation. The Brazilian wind power industry is expected to keep growing, which is the reason why factors such as demand, and wind quality are considered under control and do not represent considerable risk levels to the system. The wind power projects are characterized by high investment in the latest technology, including implementation of IT/communication technologies, which qualifies them as autonomous risks into the system.
- Z3, linkage factors: this zone is characterized by risk factors that are most conductive and dependent. That is, variables affected by changes into the system, and at the same time, conducting to others. Those risk variables are positioned usually in the middle of the model linking the top and bottom levels. Four risk factors (around 18%) were identified into this zone: financial risk (R1), supply risk (R5), construction risk (R7) and operation and maintenance risk (R10). A change into those risk variables leads to instability into the system.
- Z4, dependent factors: with seven risk factors (32%); public opposition (R4), delays risk (R9), legal and responsibility (R13), interconnection network failure risk (R15), third-party service risk (R17), quality risk (R21) and security risk(R22). Those risk factors are characterized by their high dependence, absorbing more easily the changes on the system, but at the same time, lower conductivity. Those variables can be followed as indicators of the stability on the system, because the observation of changes on those variables could indicate any other factor affecting the system stability.
5.3. Risk Management Implications
6. Conclusions
Author Contributions
Funding
Acknowledgments
Conflicts of Interest
Appendix A

| R1 | R2 | R3 | R4 | R5 | R6 | R7 | R8 | R9 | R10 | R11 | R12 | R13 | R14 | R15 | R16 | R17 | R18 | R19 | R20 | R21 | R22 | |
|---|---|---|---|---|---|---|---|---|---|---|---|---|---|---|---|---|---|---|---|---|---|---|
| R1 | 1 | 0 | 0 | 0 | 1 | 1 | 1 | 0 | 1 | 1 | 1 | 0 | 0 | 0 | 0 | 0 | 1 | 1 | 1 | 1 | 1 | 1 |
| R2 | 0 | 1 | 0 | 1 | 1 | 0 | 1 | 0 | 1 | 0 | 0 | 0 | 1 | 0 | 0 | 1 | 1 | 0 | 0 | 0 | 1 | 0 |
| R3 | 0 | 1 | 1 | 1 | 1 | 1 | 1 | 0 | 1 | 1 | 0 | 0 | 0 | 1 | 1 | 0 | 1 | 0 | 0 | 1 | 1 | 1 |
| R4 | 0 | 0 | 0 | 1 | 1 | 1 | 1 | 0 | 1 | 0 | 0 | 0 | 0 | 0 | 0 | 0 | 0 | 1 | 1 | 1 | 0 | 0 |
| R5 | 0 | 0 | 0 | 0 | 1 | 1 | 1 | 0 | 1 | 1 | 0 | 1 | 1 | 1 | 0 | 1 | 1 | 0 | 1 | 1 | 0 | 1 |
| R6 | 0 | 0 | 0 | 0 | 1 | 1 | 1 | 0 | 1 | 0 | 0 | 1 | 1 | 0 | 0 | 1 | 0 | 1 | 0 | 0 | 1 | 1 |
| R7 | 1 | 0 | 1 | 1 | 1 | 0 | 1 | 0 | 1 | 1 | 1 | 1 | 0 | 0 | 1 | 0 | 0 | 1 | 0 | 0 | 1 | 0 |
| R8 | 1 | 0 | 1 | 1 | 1 | 0 | 0 | 1 | 0 | 1 | 0 | 0 | 1 | 0 | 0 | 0 | 1 | 0 | 0 | 0 | 0 | 0 |
| R9 | 1 | 0 | 1 | 0 | 0 | 0 | 0 | 0 | 1 | 0 | 0 | 0 | 1 | 0 | 1 | 0 | 1 | 0 | 0 | 0 | 1 | 0 |
| R10 | 1 | 1 | 1 | 1 | 0 | 0 | 0 | 0 | 0 | 1 | 1 | 1 | 1 | 1 | 1 | 0 | 1 | 1 | 0 | 0 | 1 | 1 |
| R11 | 1 | 0 | 1 | 1 | 1 | 0 | 0 | 0 | 1 | 1 | 1 | 1 | 1 | 0 | 1 | 1 | 1 | 1 | 0 | 0 | 0 | 0 |
| R12 | 1 | 1 | 0 | 1 | 0 | 0 | 1 | 0 | 1 | 0 | 0 | 1 | 0 | 0 | 1 | 1 | 0 | 0 | 1 | 1 | 0 | 1 |
| R13 | 1 | 0 | 1 | 0 | 1 | 0 | 0 | 0 | 0 | 0 | 0 | 0 | 1 | 0 | 1 | 1 | 0 | 0 | 0 | 1 | 1 | 1 |
| R14 | 1 | 0 | 0 | 0 | 0 | 0 | 0 | 0 | 0 | 0 | 0 | 0 | 0 | 1 | 0 | 1 | 0 | 0 | 0 | 0 | 1 | 0 |
| R15 | 1 | 0 | 1 | 0 | 0 | 0 | 1 | 0 | 0 | 1 | 0 | 0 | 0 | 0 | 1 | 0 | 1 | 0 | 1 | 1 | 1 | 0 |
| R16 | 1 | 1 | 0 | 1 | 0 | 0 | 0 | 0 | 0 | 0 | 1 | 0 | 1 | 1 | 0 | 1 | 1 | 0 | 0 | 1 | 1 | 0 |
| R17 | 0 | 0 | 0 | 1 | 0 | 1 | 1 | 0 | 0 | 0 | 0 | 0 | 1 | 0 | 0 | 0 | 1 | 0 | 1 | 0 | 1 | 1 |
| R18 | 0 | 0 | 0 | 1 | 0 | 0 | 1 | 0 | 1 | 0 | 1 | 1 | 1 | 0 | 0 | 0 | 1 | 1 | 0 | 0 | 0 | 1 |
| R19 | 0 | 0 | 0 | 0 | 1 | 1 | 1 | 0 | 0 | 1 | 0 | 0 | 0 | 0 | 1 | 0 | 0 | 1 | 1 | 0 | 1 | 1 |
| R20 | 1 | 1 | 0 | 1 | 1 | 0 | 1 | 1 | 1 | 1 | 0 | 1 | 1 | 0 | 1 | 0 | 1 | 1 | 1 | 1 | 0 | 0 |
| R21 | 0 | 0 | 1 | 0 | 1 | 0 | 1 | 0 | 0 | 1 | 1 | 1 | 0 | 0 | 0 | 0 | 0 | 0 | 0 | 0 | 1 | 1 |
| R22 | 1 | 0 | 0 | 1 | 0 | 1 | 1 | 0 | 1 | 0 | 0 | 0 | 1 | 0 | 0 | 0 | 1 | 0 | 0 | 0 | 1 | 1 |
| R1 | R2 | R3 | R4 | R5 | R6 | R7 | R8 | R9 | R10 | R11 | R12 | R13 | R14 | R15 | R16 | R17 | R18 | R19 | R20 | R21 | R22 | |
|---|---|---|---|---|---|---|---|---|---|---|---|---|---|---|---|---|---|---|---|---|---|---|
| R1 | 1 | 1* | 1* | 1* | 1 | 1 | 1 | 1* | 1 | 1 | 1 | 1* | 1* | 1* | 1* | 1* | 1 | 1 | 1 | 1 | 1 | 1 |
| R2 | 1* | 1 | 1* | 1 | 1 | 0 | 1 | 0 | 1 | 1* | 1* | 1* | 1 | 1* | 1* | 1 | 1 | 1* | 1* | 1* | 1 | 1* |
| R3 | 1* | 1 | 1 | 1 | 1 | 1 | 1 | 1* | 1 | 1 | 1* | 1* | 1* | 1 | 1 | 1* | 1 | 1* | 1* | 1 | 1 | 1 |
| R4 | 1* | 1* | 1* | 1 | 1 | 1 | 1 | 1* | 1 | 1* | 1* | 1* | 1* | 1* | 1* | 1* | 1* | 1 | 1 | 1 | 1* | 1* |
| R5 | 1* | 1* | 1* | 1* | 1 | 1 | 1 | 0 | 1 | 1 | 1* | 1 | 1 | 1 | 1* | 1 | 1 | 1* | 1 | 1 | 1* | 1 |
| R6 | 1* | 1* | 1* | 1* | 1 | 1 | 1 | 0 | 1 | 1* | 1* | 1 | 1* | 1* | 1* | 1 | 1* | 1 | 1* | 1* | 1 | 1 |
| R7 | 1 | 1* | 1 | 1 | 1 | 0 | 1 | 0 | 1 | 1 | 1 | 1 | 1* | 1* | 1 | 1* | 1* | 1 | 1* | 1* | 1 | 1* |
| R8 | 1 | 1* | 1 | 1 | 1 | 1* | 1* | 1 | 0 | 1 | 1* | 1* | 1 | 1* | 1* | 1* | 1 | 1* | 1* | 1* | 1* | 1* |
| R9 | 1 | 0 | 1 | 1* | 1* | 1* | 1* | 0 | 1 | 1* | 1* | 1* | 1 | 0 | 1 | 1* | 1 | 0 | 1* | 1* | 1 | 1* |
| R10 | 1 | 1 | 1 | 1 | 1* | 1* | 1* | 0 | 1* | 1 | 1 | 1 | 1 | 1 | 1 | 1* | 1 | 1 | 1* | 1* | 1 | 1 |
| R11 | 1 | 1* | 1 | 1 | 1 | 1* | 1* | 0 | 1 | 1 | 1 | 1 | 1 | 0 | 1 | 1 | 1 | 1 | 1* | 1* | 1* | 1* |
| R12 | 1 | 1 | 1* | 1 | 1* | 1* | 1 | 1* | 1 | 1* | 1* | 1 | 1* | 1* | 1 | 1 | 1* | 1* | 1 | 1 | 1* | 1 |
| R13 | 1 | 1* | 1 | 1* | 1 | 1* | 1* | 1* | 1* | 1* | 1* | 1* | 1 | 1* | 1 | 1 | 1* | 1* | 1* | 1 | 1 | 1 |
| R14 | 1 | 1* | 1* | 1* | 1* | 0 | 1* | 0 | 0 | 1* | 1* | 1* | 1* | 1 | 0 | 1 | 1* | 0 | 0 | 1* | 1 | 0 |
| R15 | 1 | 1* | 1 | 1* | 1* | 1* | 1 | 1* | 1* | 1 | 1* | 1* | 1* | 0 | 1 | 0 | 1 | 1* | 1 | 1 | 1 | 1* |
| R16 | 1 | 1 | 1* | 1 | 1* | 1* | 1* | 1* | 1* | 1* | 1 | 1* | 1 | 1 | 1* | 1 | 1 | 1* | 1* | 1 | 1 | 1* |
| R17 | 0 | 0 | 1* | 1 | 1* | 1 | 1 | 0 | 1* | 1* | 1* | 1* | 1 | 0 | 1* | 0 | 1 | 1* | 1 | 0 | 1 | 1 |
| R18 | 1* | 0 | 0 | 1 | 0 | 1* | 1 | 0 | 1 | 0 | 1 | 1 | 1 | 0 | 0 | 0 | 1 | 1 | 0 | 0 | 1* | 1 |
| R19 | 1* | 0 | 1* | 0 | 1 | 1 | 1 | 0 | 1* | 1 | 1* | 1* | 1* | 0 | 1 | 0 | 1* | 1 | 1 | 0 | 1 | 1 |
| R20 | 1 | 1 | 0 | 1 | 1 | 0 | 1 | 1 | 1 | 1 | 0 | 1 | 1 | 0 | 1 | 0 | 1 | 1 | 1 | 1 | 0 | 0 |
| R21 | 1* | 0 | 1 | 1* | 1 | 1* | 1 | 0 | 1* | 1 | 1 | 1 | 1* | 0 | 0 | 0 | 1* | 0 | 0 | 0 | 1 | 1 |
| R22 | 1 | 0 | 0 | 1 | 0 | 1 | 1 | 0 | 1 | 0 | 0 | 0 | 1 | 0 | 0 | 0 | 1 | 0 | 0 | 0 | 1 | 1 |
| R1 | R2 | R3 | R4 | R5 | R6 | R7 | R8 | R9 | R10 | R11 | R12 | R13 | R14 | R15 | R16 | R17 | R18 | R19 | R20 | R21 | R22 | |
|---|---|---|---|---|---|---|---|---|---|---|---|---|---|---|---|---|---|---|---|---|---|---|
| R1 | 0 | 0 | 0 | 0 | 3 | 3 | 3 | 0 | 3 | 3 | 3 | 0 | 0 | 0 | 0 | 0 | 3 | 2 | 3 | 2 | 3 | 3 |
| R2 | 0 | 0 | 0 | 3 | 3 | 0 | 3 | 0 | 3 | 0 | 0 | 0 | 3 | 0 | 0 | 2 | 2 | 0 | 0 | 0 | 3 | 0 |
| R3 | 0 | 3 | 0 | 3 | 3 | 2 | 3 | 0 | 2 | 2 | 0 | 0 | 0 | 3 | 3 | 0 | 3 | 0 | 0 | 2 | 3 | 2 |
| R4 | 0 | 0 | 0 | 0 | 2 | 3 | 2 | 0 | 3 | 0 | 0 | 0 | 0 | 0 | 0 | 0 | 0 | 3 | 3 | 3 | 0 | 0 |
| R5 | 0 | 0 | 0 | 0 | 0 | 3 | 3 | 0 | 2 | 3 | 0 | 2 | 3 | 3 | 0 | 3 | 3 | 0 | 3 | 3 | 0 | 3 |
| R6 | 0 | 0 | 0 | 0 | 3 | 0 | 3 | 0 | 3 | 0 | 0 | 3 | 3 | 0 | 0 | 3 | 0 | 2 | 0 | 0 | 3 | 3 |
| R7 | 3 | 0 | 3 | 2 | 3 | 0 | 0 | 0 | 3 | 3 | 3 | 3 | 0 | 0 | 2 | 0 | 0 | 3 | 0 | 0 | 3 | 0 |
| R8 | 3 | 0 | 2 | 3 | 3 | 0 | 0 | 0 | 0 | 1 | 0 | 0 | 3 | 0 | 0 | 0 | 3 | 0 | 0 | 0 | 0 | 0 |
| R9 | 3 | 0 | 2 | 0 | 0 | 0 | 0 | 0 | 0 | 0 | 0 | 0 | 3 | 0 | 2 | 0 | 3 | 0 | 0 | 0 | 2 | 0 |
| R10 | 3 | 3 | 2 | 1 | 0 | 0 | 0 | 0 | 0 | 0 | 2 | 3 | 3 | 2 | 3 | 0 | 3 | 3 | 0 | 0 | 3 | 3 |
| R11 | 3 | 0 | 2 | 2 | 3 | 0 | 0 | 0 | 3 | 2 | 0 | 3 | 3 | 0 | 1 | 3 | 3 | 3 | 0 | 0 | 0 | 0 |
| R12 | 1 | 3 | 0 | 2 | 0 | 0 | 3 | 0 | 2 | 0 | 0 | 0 | 0 | 0 | 3 | 3 | 0 | 0 | 2 | 2 | 0 | 2 |
| R13 | 3 | 0 | 2 | 0 | 3 | 0 | 0 | 0 | 0 | 0 | 0 | 0 | 0 | 0 | 3 | 1 | 0 | 0 | 0 | 2 | 2 | 2 |
| R14 | 3 | 0 | 0 | 0 | 0 | 0 | 0 | 0 | 0 | 0 | 0 | 0 | 0 | 0 | 0 | 3 | 0 | 0 | 0 | 0 | 3 | 0 |
| R15 | 2 | 0 | 2 | 0 | 0 | 0 | 2 | 0 | 0 | 3 | 0 | 0 | 0 | 0 | 0 | 0 | 3 | 0 | 3 | 3 | 3 | 0 |
| R16 | 3 | 2 | 0 | 3 | 0 | 0 | 0 | 0 | 0 | 0 | 3 | 0 | 1 | 3 | 0 | 0 | 2 | 0 | 0 | 3 | 3 | 0 |
| R17 | 0 | 0 | 0 | 2 | 0 | 3 | 3 | 0 | 0 | 0 | 0 | 0 | 2 | 0 | 0 | 0 | 0 | 0 | 2 | 0 | 2 | 3 |
| R18 | 0 | 0 | 0 | 3 | 0 | 0 | 3 | 0 | 2 | 0 | 3 | 2 | 3 | 0 | 0 | 0 | 3 | 0 | 0 | 0 | 0 | 3 |
| R19 | 0 | 0 | 0 | 0 | 3 | 3 | 2 | 0 | 0 | 2 | 0 | 0 | 0 | 0 | 3 | 0 | 0 | 1 | 0 | 0 | 3 | 3 |
| R20 | 2 | 2 | 0 | 3 | 3 | 0 | 3 | 3 | 3 | 3 | 0 | 2 | 2 | 0 | 3 | 0 | 3 | 1 | 1 | 0 | 0 | 0 |
| R21 | 0 | 0 | 3 | 0 | 1 | 0 | 3 | 0 | 0 | 3 | 3 | 3 | 0 | 0 | 0 | 0 | 0 | 0 | 0 | 0 | 0 | 3 |
| R22 | 3 | 0 | 0 | 3 | 0 | 3 | 2 | 0 | 2 | 0 | 0 | 0 | 2 | 0 | 0 | 0 | 3 | 0 | 0 | 0 | 3 | 0 |
| Indirect influences: Strong (3), Moderate (2), Weak (1). | ||||||||||||||||||||||
Appendix B
| Variable | Reachability Set | Antecedent Set | Intersection | Level |
|---|---|---|---|---|
| R1 | 1,2,3,4,5,6,7,8,9,10,11,12,13,14,15,16,17,18,19,20,21,22 | 1,2,3,4,5,6,7,8,9,10,11,12,13,14,15,16,18,19,20,21,22 | 1,2,3,4,5,6,7,8,9,10,11,12,13,14,15,16,18,19,20,21,22 | |
| R2 | 1,2,3,4,5,6,7,9,10,11,12,13,14,15,16,17,18,19,20,21,22 | 1,2,3,4,5,6,7,8,10,11,12,13,14,15,16,20 | 1,2,3,4,5,6,7,10,11,12,13,14,15,16,20 | |
| R3 | 1,2,3,4,5,6,7,8,9,10,11,12,13,14,15,16,17,18,19,20,21,22 | 1,2,3,4,5,6,7,8,9,10,11,12,13,14,15,16,17,19,21, | 1,2,3,4,5,6,7,8,9,10,11,12,13,14,15,16,17,19,20,21,22 | |
| R4 | 1,2,3,4,5,6,7,8,9,10,11,12,13,14,15,16,17,18,19,20,21,22 | 1,2,3,4,5,6,7,8,9,10,11,12,13,14,15,16,17,18,20,21,22 | 1,2,3,4,5,6,7,8,9,10,11,12,13,14,15,16,17,18,20,21,22 | |
| R5 | 1,2,3,4,5,6,7,9,10,11,12,13,14,15,16,17,18,19,20,21,22 | 1,2,3,4,5,6,7,8,9,10,11,12,13,14,15,16,17,19,20,21 | 1,2,3,4,5,6,7,9,10,11,12,13,14,15,16,17,19,20,21 | |
| R6 | 1,2,3,4,5,6,7,9,10,11,12,13,14,15,16,17,18,19,20,21,22 | 1,2,3,4,5,6,8,9,10,11,12,13,15,16,17,18,19,21,22 | 1,2,3,4,5,6,9,10,11,12,13,15,16,17,18,19,21,22 | |
| R7 | 1,2,3,4,5,7,9,10,11,12,13,14,15,16,17,18,19,20,21,22 | 1,2,3,4,5,6,7,8,9,10,11,12,13,14,15,16,17,18,19,20,21,22 | 1,2,3,4,5,7,9,10,11,12,13,14,15,16,17,18,19,20,21,22 | L1 |
| R8 | 1,2,3,4,5,6,7,8,10,11,12,13,14,15,16,17,18,19,20,21,22 | 1,3,4,8,12,13,15,16,20 | 1,3,4,8,12,13,15,16,20 | |
| R9 | 1,3,4,5,6,7,9,10,11,12,13,15,16,17,19,20,21,22 | 1,2,3,4,5,6,7,9,10,11,12,13,15,16,17,18,19,20,21,22 | 1,3,4,5,6,7,9,10,11,12,13,15,16,17,19,20,21,22 | L1 |
| R10 | 1,2,3,4,5,6,7,9,10,11,12,13,14,15,16,17,18,19,20,21,22 | 1,2,3,4,5,6,7,8,9,10,11,12,13,14,15,16,17,19,20,21 | 1,2,3,4,5,6,7,9,10,11,12,13,14,15,16,17,19,20,21 | |
| R11 | 1,2,3,4,5,6,7,9,10,11,12,13,15,16,17,18,19,20,21,22 | 1,2,3,4,5,6,7,8,9,10,11,12,13,14,15,16,17,18,19,21 | 1,2,3,4,5,6,7,9,10,11,12,13,15,16,17,18,19,21 | |
| R12 | 1,2,3,4,5,6,7,8,9,10,11,12,13,14,15,16,17,18,19,20,21,22 | 1,2,3,4,5,6,7,8,9,10,11,12,13,14,15,16,17,18,19,20,21 | 1,2,3,4,5,6,7,8,9,10,11,12,13,14,15,16,17,18,19,20,21 | |
| R13 | 1,2,3,4,5,6,7,8,9,10,11,12,13,14,15,16,17,18,19,20,21,22 | 1,2,3,4,5,6,7,8,9,10,11,12,13,14,15,16,17,18,19,20,21,22 | 1,2,3,4,5,6,7,8,9,10,11,12,13,14,15,16,17,18,19,20,21,22 | L1 |
| R14 | 1,2,3,4,5,7,10,11,12,13,14,16,17,20,21 | 1,2,3,4,5,6,7,8,10,12,13,14,16 | 1,2,3,4,5,7,10,12,13,14,16 | |
| R15 | 1,2,3,4,5,6,7,8,9,10,11,12,13,15,17,18,19,20,21,22 | 1,2,3,4,5,6,7,8,9,10,11,12,13,15,16,17,19,20 | 1,2,3,4,5,6,7,8,9,10,11,12,13,15,17,19,20 | |
| R16 | 1,2,3,4,5,6,7,8,9,10,11,12,13,14,15,16,17,18,19,20,21,22 | 1,2,3,4,5,6,7,8,9,10,11,12,13,14,16 | 1,2,3,4,5,6,7,8,9,10,11,12,13,14,16 | |
| R17 | 3,4,5,6,7,9,10,11,12,13,15,17,18,19,21,22 | 1,2,3,4,5,6,7,8,9,10,11,12,13,14,15,16,17,18,19,20,21,22 | 3,4,5,6,7,9,10,11,12,13,15,17,18,19,21,22 | L1 |
| R18 | 1,4,6,7,9,11,12,13,17,18,21,22 | 1,2,3,4,5,6,7,8,10,11,12,13,15,16,17,18,19,20 | 1,4,6,7,11,12,13,17,18 | |
| R19 | 1,3,5,6,7,9,10,11,12,13,15,17,18,19,21,22 | 1,2,3,4,5,6,7,8,9,10,11,12,13,15,16,17,19,20 | 1,3,5,6,7,9,10,11,12,13,15,17,19 | |
| R20 | 1,2,4,5,7,8,9,10,12,13,15,17,18,19,20 | 1,2,3,4,5,6,7,8,9,10,11,12,13,14,15,16,20 | 1,2,4,5,7,8,9,10,12,13,15,20 | |
| R21 | 1,3,4,5,6,7,9,10,11,12,13,17,21,22 | 1,2,3,4,5,6,7,8,9,10,11,12,13,14,15,16,17,18,19,21,22 | 1,3,4,5,6,7,9,10,11,12,13,17,21,22 | L1 |
| R22 | 1,4,6,7,9,13,17,21,22 | 1,2,3,4,5,6,7,8,9,10,11,12,13,15,16,17,18,19,21,22 | 1,4,6,7,9,13,17,21,22 | L1 |
| Variable | Reachability Set | Antecedent Set | Intersection | Level |
|---|---|---|---|---|
| R1 | 1,2,3,4,5,6,8,10,11,12,14,15,16,18,19,20 | 1,2,3,4,5,6,8,10,11,12,14,15,16,18,19,20 | 1,2,3,4,5,6,8,10,11,12,14,15,16,18,19,20 | L2 |
| R2 | 1,2,3,4,5,6,10,11,12,14,15,16,18,19,20 | 1,2,3,4,5,6,8,10,11,12,14,15,16,20 | 1,2,3,4,5,6,10,11,12,14,15,16,20 | |
| R3 | 1,2,3,4,5,6,8,10,11,12,14,15,16,18,19,20 | 1,2,3,4,5,6,8,10,11,12,14,15,16,19 | 1,2,3,4,5,6,8,10,11,12,14,15,16,19,20 | |
| R4 | 1,2,3,4,5,6,8,10,11,12,14,15,16,18,19,20 | 1,2,3,4,5,6,8,10,11,12,14,15,16,18,20 | 1,2,3,4,5,6,8,10,11,12,14,15,16,18,20 | |
| R5 | 1,2,3,4,5,6,10,11,12,14,15,16,18,19,20 | 1,2,3,4,5,6,8,10,11,12,14,15,16,19,20 | 1,2,3,4,5,6,10,11,12,14,15,16,19,20 | |
| R6 | 1,2,3,4,5,6,10,11,12,14,15,16,18,19,20 | 1,2,3,4,5,6,8,10,11,12,15,16,18,19 | 1,2,3,4,5,6,10,11,12,15,16,18,19 | |
| R8 | 1,2,3,4,5,6,8,10,11,12,14,15,16,18,19,20 | 1,3,4,8,12,15,16,20 | 1,3,4,8,12,15,16,20 | |
| R10 | 1,2,3,4,5,6,10,11,12,14,15,16,18,19,20 | 1,2,3,4,5,6,8,10,11,12,14,15,16,19,20 | 1,2,3,4,5,6,10,11,12,14,15,16,19,20 | |
| R11 | 1,2,3,4,5,6,10,11,12,15,16,18,19,20 | 1,2,3,4,5,6,8,10,11,12,14,15,16,18,19 | 1,2,3,4,5,6,10,11,12,15,16,18,19 | |
| R12 | 1,2,3,4,5,6,8,10,11,12,14,15,16,18,19,20 | 1,2,3,4,5,6,8,10,11,12,14,15,16,18,19,20 | 1,2,3,4,5,6,8,10,11,12,14,15,16,18,19,20 | L2 |
| R14 | 1,2,3,4,5,10,11,12,14,16,20 | 1,2,3,4,5,6,8,10,12,14,16 | 1,2,3,4,5,10,12,14,16 | |
| R15 | 1,2,3,4,5,6,8,10,11,12,15,18,19,20 | 1,2,3,4,5,6,8,10,11,12,15,16,19,20 | 1,2,3,4,5,6,8,10,11,12,15,19,20 | |
| R16 | 1,2,3,4,5,6,8,10,11,12,14,15,16,18,19,20 | 1,2,3,4,5,6,8,10,11,12,14,16 | 1,2,3,4,5,6,8,10,11,12,14,16 | |
| R18 | 1,4,6,11,12,18 | 1,2,3,4,5,6,8,10,11,12,15,16,18,19,20 | 1,4,6,11,12,18 | L2 |
| R19 | 1,3,5,6,10,11,12,15,18,19 | 1,2,3,4,5,6,8,10,11,12,15,16,19,20 | 1,3,5,6,10,11,12,15,19 | |
| R20 | 1,2,4,5,8,10,12,15,18,19,20 | 1,2,3,4,5,6,8,10,11,12,14,15,16,20 | 1,2,4,5,8,10,12,15,20 |
| Variable | Reachability Set | Antecedent Set | Intersection | Level |
|---|---|---|---|---|
| R2 | 2,3,4,5,6,10,11,14,15,16,19,20 | 2,3,4,5,6,8,10,11,14,15,16,20 | 2,3,4,5,6,10,11,14,15,16,20 | |
| R3 | 2,3,4,5,6,8,10,11,14,15,16,19,20 | 2,3,4,5,6,8,10,11,14,15,16,19 | 2,3,4,5,6,8,10,11,14,15,16,19,20 | L3 |
| R4 | 2,3,4,5,6,8,10,11,14,15,16,19,20 | 2,3,4,5,6,8,10,11,14,15,16,20 | 2,3,4,5,6,8,10,11,14,15,16,20 | |
| R5 | 2,3,4,5,6,10,11,14,15,16,19,20 | 2,3,4,5,6,8,10,11,14,15,16,19,20 | 2,3,4,5,6,10,11,14,15,16,19,20 | L3 |
| R6 | 2,3,4,5,6,10,11,14,15,16,19,20 | 2,3,4,5,6,8,10,11,15,16,19 | 2,3,4,5,6,10,11,15,16,19 | |
| R8 | 2,3,4,5,6,8,10,11,14,15,16,19,20 | 3,4,8,15,16,20 | 3,4,8,15,16,20 | |
| R10 | 2,3,4,5,6,10,11,14,15,16,19,20 | 2,3,4,5,6,8,10,11,14,15,16,19,20 | 2,3,4,5,6,10,11,14,15,16,19,20 | L3 |
| R11 | 2,3,4,5,6,10,11,15,16,19,20 | 2,3,4,5,6,8,10,11,14,15,16,19 | 2,3,4,5,6,10,11,15,16,19 | |
| R14 | 2,3,4,5,10,11,14,16,20 | 2,3,4,5,6,8,10,14,16 | 2,3,4,5,10,14,16 | |
| R15 | 2,3,4,5,6,8,10,11,15,19,20 | 2,3,4,5,6,8,10,11,15,16,19,20 | 2,3,4,5,6,8,10,11,15,19,20 | L3 |
| R16 | 2,3,4,5,6,8,10,11,14,15,16,19,20 | 2,3,4,5,6,8,10,11,14,16 | 2,3,4,5,6,8,10,11,14,16 | |
| R19 | 3,5,6,10,11,15,19 | 2,3,4,5,6,8,10,11,15,16,19,20 | 3,5,6,10,11,15,19 | L3 |
| R20 | 2,4,5,8,10,15,19,20 | 2,3,4,5,6,8,10,11,14,15,16,20 | 2,4,5,8,10,15,20 |
| Variable | Reachability Set | Antecedent Set | Intersection | Level |
|---|---|---|---|---|
| R2 | 2,4,6,11,14,16,20 | 2,4,6,8,11,14,16,20 | 2,4,6,11,14,16,20 | L4 |
| R4 | 2,4,6,8,11,14,16,20 | 2,4,6,8,11,14,16,20 | 2,4,6,8,11,14,16,20 | L4 |
| R6 | 2,4,6,11,14,16,20 | 2,4,6,8,11,16 | 2,4,6,11,16 | |
| R8 | 2,4,6,8,11,14,16,20 | 4,8,16,20 | 4,8,16,20 | |
| R11 | 2,4,6,11,16,20 | 2,4,6,8,11,14,16 | 2,4,6,11,16 | |
| R14 | 2,4,11,14,16,20 | 2,4,6,8,14,16 | 2,4,14,16 | |
| R16 | 2,4,6,8,11,14,16,20 | 2,4,6,8,11,14,16 | 2,4,6,8,11,14,16 | |
| R20 | 2,4,8,20 | 2,4,6,8,11,14,16,20 | 2,4,8,20 | L4 |
| Variable | Reachability Set | Antecedent Set | Intersection | Level |
|---|---|---|---|---|
| R6 | 6,11,14,16 | 6,8,11,16 | 6,11,16 | |
| R8 | 6,8,11,14,16 | 8,16 | 8,16 | |
| R11 | 6,11,16 | 6,8,11,14,16 | 6,11,16 | L5 |
| R14 | 11,14,16 | 6,8,14,16 | 14,16 | |
| R16 | 6,8,11,14,16 | 6,8,11,14,16 | 6,8,11,14,16 | L5 |
| Variable | Reachability Set | Antecedent Set | Intersection | Level |
|---|---|---|---|---|
| R6 | 6,14 | 6,8 | 6 | |
| R8 | 6,8,14 | 8 | 8 | |
| R14 | 14 | 6,8,14 | 14 | L6 |
| Variable | Reachability Set | Antecedent Set | Intersection | Level |
|---|---|---|---|---|
| R6 | 6 | 6,8 | 6 | L7 |
| R8 | 6,8 | 8 | 8 | L8 |
References
- Pottmaier, D.; Melo, C.R.; Sartor, M.N.; Kuester, S.; Amadio, T.M.; Fernandes, C.A.H.; Marinha, D.; Alarcon, O.E. The Brazilian energy matrix: From a materials science and engineering perspective. Renew. Sustain. Energy Rev. 2013, 19, 678–691. [Google Scholar] [CrossRef]
- Martins, F.R.; Pereira, E.B. Enhancing information for solar and wind energy technology deployment in Brazil. Energy Pol. 2011, 39, 4378–4390. [Google Scholar] [CrossRef]
- Lappe, M.; Spang, K. Investments in project management are profitable: A case study-based analysis of the relationship between the costs and benefits of project management. Int. J. Proj. Manag. 2014, 32, 603–612. [Google Scholar] [CrossRef]
- Chopra, S.; Meindl, P. Supply Chain Management: Strategy, Planning, and Operation, Global Edition, 6th ed.; Pearson: London, UK, 2015. [Google Scholar]
- Da Silva, N.F.; Rosa, L.P.; Freitas, M.A.V.; Pereira, M.G. Wind energy in Brazil: From the power sector’s expansion crisis model to the favorable environment. Renew. Sustain. Energy Rev. 2013, 22, 686–697. [Google Scholar] [CrossRef]
- Schmidt, J.; Cancella, R.; Junior, A.O.P. The effect of windpower on long-term variability of combined hydro-wind resources: The case of Brazil. Renew. Sustain. Energy Rev. 2016, 55, 131–141. [Google Scholar] [CrossRef]
- Gatzert, N.; Kosub, T. Risks and risk management of renewable energy projects: The case of onshore and offshore wind parks. Renew. Sustain. Energy Rev. 2016, 60, 982–998. [Google Scholar] [CrossRef]
- Jin, X.; Zhang, Z.; Shi, X.; Ju, W. A review on wind power industry and corresponding insurance market in China: Current status and challenges. Renew. Sustain. Energy Rev. 2014, 38, 1069–1082. [Google Scholar] [CrossRef]
- Liebreich, M. Financing RE: Risk management in financing renewable energy projects. Refocus 2005, 6, 18–20. [Google Scholar] [CrossRef]
- Montes, G.M.; Martín, E.P. Profitability of wind energy: Short-term risk factors and possible improvements. Renew. Sustain. Energy Rev. 2007, 11, 2191–2200. [Google Scholar] [CrossRef]
- Malhotra, Y. Advancing Cyber Risk Insurance Underwriting Model Risk Management Beyond VaR to Pre-Empt and Prevent the Forthcoming Global Cyber Insurance Crisis; Social Science Research Network: Rochester, NY, USA, 2017. [Google Scholar]
- Carreño, M.L.; Cardona, O.D.; Barbat, A.H. A disaster risk management performance index. Nat. Hazards 2007, 41, 1–20. [Google Scholar] [CrossRef]
- Thomalla, F.; Boyland, M.; Johnson, K.; Ensor, J.; Tuhkanen, H.; Gerger Swartling, Å.; Han, G.; Forrester, J.; Wahl, D. Transforming development and disaster risk. Sustainability 2018, 10, 1458. [Google Scholar] [CrossRef]
- Teller, J.; Kock, A.; Gemünden, H.G. Risk management in project portfolios is more than managing project risks: A contingency perspective on risk management. Proj. Manag. J. 2014, 45, 67–80. [Google Scholar] [CrossRef]
- Belluz, D.D.B. Operational risk management. In Enterprise Risk Management; Wiley-Blackwell: Hoboken, NJ, USA, 2011; pp. 279–301. ISBN 978-1-118-26708-0. [Google Scholar]
- Park, C.; Han, S.; Lee, K.-W.; Lee, Y.; Park, C.Y.; Han, S.H.; Lee, K.-W.; Lee, Y.M. Analyzing drivers of conflict in energy infrastructure projects: Empirical case study of natural gas pipeline sectors. Sustainability 2017, 9, 2031. [Google Scholar] [CrossRef]
- Pfohl, H.-C.; Köhler, H.; Thomas, D. State of the art in supply chain risk management research: Empirical and conceptual findings and a roadmap for the implementation in practice. Logist. Res. 2010, 2, 33–44. [Google Scholar] [CrossRef]
- Crouhy, M.; Mark, R.; Galai, D. Risk Management, 1st ed.; McGraw-Hill Education: New York, NY, USA, 2000; ISBN 978-0-07-135731-9. [Google Scholar]
- Lee, H.L.; Whang, S. Higher supply chain security with lower cost: Lessons from total quality management. Int. J. Produc. Econ. 2005, 96, 289–300. [Google Scholar] [CrossRef] [Green Version]
- Simchi-Levi, D.; Vassiliadis, C.G.; Kyratzoglou, I.M. MIT Forum for Supply Chain Innovation Report 2013: Supply Chain and Risk Management. Available online: http://supplychain.mit.edu/events/Forum-PwC-Report (accessed on 15 March 2016).
- Jüttner, U.; Peck, H.; Christopher, M. Supply chain risk management: Outlining an agenda for future research. Int. J. Logist. Res. Appl. 2003, 6, 197–210. [Google Scholar] [CrossRef] [Green Version]
- Christopher, M.; Peck, H. Building the resilient supply chain. Int. J. Logist. Manag. 2004, 15, 1–14. [Google Scholar] [CrossRef] [Green Version]
- Chopra, S.; Sodhi, M.S. Supply-chain breakdown. MIT Sloan Manag. Rev. 2004, 46, 53–61. [Google Scholar]
- Xinyao, J.; Yongjun, H.; Fuchao, L. Research on the evaluation of wind power projects of investment risk. Procedia Comput. Sci. 2017, 111, 388–398. [Google Scholar] [CrossRef]
- Neto, D.P.; Domingues, E.G.; Calixto, W.P.; Alves, A.J. Methodology of investment risk analysis for wind power plants in the brazilian free market. Electr. Power Compon. Syst. 2018, 46, 316–330. [Google Scholar] [CrossRef]
- Li, H.; Wu, L. Analysis of financial support efficiency for China’s wind power industry. Energy Sources Part B Econ. Plan. Policy 2016, 11, 1035–1041. [Google Scholar] [CrossRef]
- Simas, M.; Pacca, S. Assessing employment in renewable energy technologies: A case study for wind power in Brazil. Renew. Sustain. Energy Rev. 2014, 31, 83–90. [Google Scholar] [CrossRef]
- Goudarzi, N.; Zhu, W.D. A review on the development of wind turbine generators across the world. Int. J. Dyn. Control 2013, 1, 192–202. [Google Scholar] [CrossRef] [Green Version]
- Madavar, M.D.; Nezhad, M.H.G.; Aslani, A.; Naaranoja, M. Analysis of generations of wind power technologies based on technology life cycle approach. Distrib. Gener. Altern. Energy J. 2017, 32, 52–79. [Google Scholar] [CrossRef]
- Gorayeb, A.; Brannstrom, C.; de Andrade Meireles, A.J.; de Sousa Mendes, J. Wind power gone bad: Critiquing wind power planning processes in northeastern Brazil. Energy Res. Soc. Sci. 2018, 40, 82–88. [Google Scholar] [CrossRef]
- Juárez, A.A.; Araújo, A.M.; Rohatgi, J.S.; de Oliveira Filho, O.D.Q. Development of the wind power in Brazil: Political, social and technical issues. Renew. Sustain. Energy Rev. 2014, 39, 828–834. [Google Scholar] [CrossRef]
- Poulsen, T.; Lema, R. Is the supply chain ready for the green transformation? The case of offshore wind logistics. Renew. Sustain. Energy Rev. 2017, 73, 758–771. [Google Scholar] [CrossRef]
- Prostean, G.; Badea, A.; Vasar, C.; Octavian, P. Risk variables in wind power supply Chain. Procedia Soc. Behav. Sci. 2014, 124, 124–132. [Google Scholar] [CrossRef]
- AbdelWarith, K.A.; Anastasopoulos, P.C.; Richardson, W.; Fricker, J.D.; Haddock, J.E. Design of local roadway infrastructure to service sustainable energy facilities. Energy Sustain. Soc. 2014, 4, 14. [Google Scholar] [CrossRef] [Green Version]
- Gonzalez, E.; Nanos, E.M.; Seyr, H.; Valldecabres, L.; Yürüşen, N.Y.; Smolka, U.; Muskulus, M.; Melero, J.J. Key performance indicators for wind farm operation and maintenance. Energy Procedia 2017, 137, 559–570. [Google Scholar] [CrossRef]
- Chou, J.-S.; Ou, Y.-C.; Lin, K.-Y.; Wang, Z.-J. Structural failure simulation of onshore wind turbines impacted by strong winds. Eng. Struct. 2018, 162, 257–269. [Google Scholar] [CrossRef]
- Kandil, K.S.A.; Saudi, G.N.; Eltaly, B.A.-A.; El-khier, M.M.A. Seismic response of a full-scale wind turbine tower using experimental and numerical modal analysis. Int. J. Adv. Struct. Eng. 2016, 8, 337–349. [Google Scholar] [CrossRef] [Green Version]
- Laouti, N.; Othman, S.; Alamir, M.; Sheibat-Othman, N. Combination of model-based observer and support vector machines for fault detection of wind turbines. Int. J. Autom. Comput. 2014, 11, 274–287. [Google Scholar] [CrossRef]
- Ren, G.; Liu, J.; Wan, J.; Guo, Y.; Yu, D. Overview of wind power intermittency: Impacts, measurements, and mitigation solutions. Appl. Energy 2017, 204, 47–65. [Google Scholar] [CrossRef]
- de Lucena, A.F.P.; Szklo, A.S.; Schaeffer, R.; Dutra, R.M. The vulnerability of wind power to climate change in Brazil. Renew. Energy 2010, 35, 904–912. [Google Scholar] [CrossRef]
- Liu, X.; Xu, Z.; Wong, K.P. Recent advancement on technical requirements for grid integration of wind power. J. Mod. Power Syst. Clean Energy 2013, 1, 216–222. [Google Scholar] [CrossRef] [Green Version]
- Skarin, A.; Nellemann, C.; Rönnegård, L.; Sandström, P.; Lundqvist, H. Wind farm construction impacts reindeer migration and movement corridors. Landsc. Ecol. 2015, 30, 1527–1540. [Google Scholar] [CrossRef] [Green Version]
- Valença, R.B.; Bernard, E. Another blown in the wind: Bats and the licensing of wind farms in Brazil. Nat. Conservação 2015, 13, 117–122. [Google Scholar] [CrossRef]
- Xiang, Y.; Wang, L.; Liu, N. Coordinated attacks on electric power systems in a cyber-physical environment. Electr. Power Syst. Res. 2017, 149, 156–168. [Google Scholar] [CrossRef]
- Olsen, S.A. Interpretive structural modeling. In Group Planning and Problem Solving Methods in Engineering Management; John Wiley and Sons, Inc.: New York, NY, USA, 1982. [Google Scholar]
- Sushil, S. Interpreting the interpretive structural model. Glob. J. Flex. Syst. Manag. 2012, 13, 87–106. [Google Scholar] [CrossRef]
- Chandramowli, S.; Transue, M.; Felder, F.A. Analysis of barriers to development in landfill communities using interpretive structural modeling. Habitat Int. 2011, 35, 246–253. [Google Scholar] [CrossRef]
- Manuj, I.; Mentzer, J.T. Global supply chain risk management strategies. Int. J. Phys. Distrib. Logist. Manag. 2008, 38, 192–223. [Google Scholar] [CrossRef] [Green Version]
- Pfohl, H.-C.; Gallus, P.; Thomas, D. Interpretive structural modeling of supply chain risks. Int. J. Phys. Distrib. Logist. Manag. 2011, 41, 839–859. [Google Scholar] [CrossRef]
- Tummala, R.; Schoenherr, T. Assessing and managing risks using the supply chain risk management process (SCRMP). Supply Chain Manag. Int. J. 2011, 16, 474–483. [Google Scholar] [CrossRef]
- Nishat Faisal, M.; Banwet, D.K.; Shankar, R. Supply chain risk mitigation: Modeling the enablers. Bus. Process Manag. J. 2006, 12, 535–552. [Google Scholar] [CrossRef]
- Olson, D.L.; Wu, D. Risk management models for supply chain: A scenario analysis of outsourcing to China. Supply Chain Manag. Int. J. 2011, 16, 401–408. [Google Scholar] [CrossRef]
- Saxena, J.P.; Vrat, P. Impact of indirect relationships in classification of variables—A micmac analysis for energy conservation. Syst. Res. 1990, 7, 245–253. [Google Scholar] [CrossRef]
- Dubey, R.; Ali, S.S. Identification of flexible manufacturing system dimensions and their interrelationship using total interpretive structural modelling and fuzzy MICMAC analysis. Glob. J. Flex. Syst. Manag. 2014, 15, 131–143. [Google Scholar] [CrossRef]
- Ravi, V.; Shankar, R. Analysis of interactions among the barriers of reverse logistics. Technol. Forecast. Soc. Chang. 2005, 72, 1011–1029. [Google Scholar] [CrossRef]
- Lamming, R.; Hampson, J. The environment as a supply chain management issue. Br. J. Manag. 1996, 7, S45–S62. [Google Scholar] [CrossRef]
- Gorane, S.J.; Kant, R. Supply chain management: Modelling the enablers using ISM and fuzzy MICMAC approach. Int. J. Logist. Syst. Manag. 2013, 16, 147–166. [Google Scholar] [CrossRef]
- Bag, S.; Anand, N. Modeling green supply chain management framework using ISM and MICMAC analysis. Afr. J. Bus. Manag. 2014, 8, 1053–1065. [Google Scholar] [CrossRef]
- Khan, S.; Haleem, A.; Khan, M.; Abidi, M.; Al-Ahmari, A.; Khan, S.; Haleem, A.; Khan, M.I.; Abidi, M.H.; Al-Ahmari, A. Implementing traceability systems in specific supply chain management (SCM) through critical success factors (CSFs). Sustainability 2018, 10, 204. [Google Scholar] [CrossRef]
- Brüggen, E.; Willems, P. A Critical comparison of offline focus groups, online focus groups and E.-Delphi. Int. J. Mark. Res. 2009, 51, 1–15. [Google Scholar] [CrossRef]
- Hasson, F.; Keeney, S.; McKenna, H. Research guidelines for the Delphi survey technique. J. Adv. Nurs. 2000, 32, 1008–1015. [Google Scholar] [CrossRef] [PubMed]
- Linstone, H.A.; Turoff, M. The Delphi Method; Addison-Wesley Reading: Boston, MA, USA, 1975. [Google Scholar]
- Loveridge, D. Experts and foresight: Review and experience. Int. J. Foresight Innov. Policy 2004, 1, 33. [Google Scholar] [CrossRef]
- La Prospective: Downloading the Applications. Available online: http://en.laprospective.fr/methods-of-prospective/downloading-the-applications/download/YREUj6TAZ56msz0v0VS7/johan.veltmeyer@bigpond.com (accessed on 3 August 2018).


| Code | Risk Factor | Examples of Sources (But Not Limited to) | Source (s) |
|---|---|---|---|
| R1 | Financial Risk | Lack and/or loss of capital. Exchange rate variation. Cost volatility. | [24,25,26] |
| R2 | Labor force unavailability risk | Lack of trained human resources. Delays due to lack of management expertise. Including unavailability due to occupational risk exposure. | [27] |
| R3 | Technology and innovation risk | Inaccuracies in capacity definition. Technological obsolescence. Damage and breakage attributable to design or project sizing. | [28,29] |
| R4 | Public opposition risk | Potential changes in public opinion. Disagreement to construction. Conflicts over land use restrictions. Changes in public policies affecting nearby communities. | [30,31] |
| R5 | Supply risk | Delays in delivery of local suppliers. Delays on importation. Price variation of materials and components. | [32] |
| R6 | Transport risk | Breaks during transportation. Accidents. Thefts. Damages. Natural disasters affecting transportation stage. | [33,34] |
| R7 | Construction risk | Lack of special equipment as cranes. Machine break. Delays in supplies (materials and services). Accidents. | [7] |
| R8 | Demand risk | Changes in projects plan. Uncertainty in demand for parts and components. Service demand uncertainty. | [33] |
| R9 | Delays risk | Project schedule delays. Coordination failure between third-party companies. | [7] |
| R10 | Operation and maintenance risk | Facility damages. Machine breakdown. Negligence. Accidents. Failure on stock of parts to maintenance. Failures/technological inefficiency. | [35] |
| R11 | Natural hazard risk | Severe weather conditions. Storms. Earthquakes. | [36,37] |
| R12 | Serial damage risk | Defects or breakdowns in parts, components or installations with collateral damage. | [38] |
| R13 | Legal and responsibility risk | Liability to third-party companies. Legal disputes. Contractual risks. Complexity in legislation. Delays in the approval process. | [7] |
| R14 | Loses by wind quality risk | Uncertainty in wind forecast. Wind picks with enough quality. Failure in capacity planning. | [39,40] |
| R15 | Interconnexion network failure risk | Network infrastructure. Interconnection lines maintenance failure. Losses and/or lower project profitability due to connection failures. | [41] |
| R16 | Energy price variation risk | Uncertainty in rates of future electricity auctions. Seasonality. Revenue impacts. | [7] |
| R17 | Third-party service risk | Non-compliance of outsourced services. Breach or lack of financing of contracted and subcontracted suppliers. | [35] |
| R18 | Ecological damage risk | Interruptions in operations caused by ecological issues. Interference in habitats of endangered species. | [42,43] |
| R19 | IT/Communication risk | Interruptions of operation due to communication failure. Cyber-attacks. Information theft. | [7,35] |
| R20 | Public policy and regulatory risk | Uncertainties in energy policy. Potential changes in specific support policies. Regulations on renewable energy investments.Complexity in the approval processes. | [7] |
| R21 | Quality risk | Materials, parts and components without quality to fit standards. Delays due to replacements attributed to quality. | [28,29] |
| R22 | Security risk | Terrorism. Attacks on installations. Equipment theft. Vandalism. Assaults. | [44] |
| R22 | R21 | R20 | R19 | R18 | R17 | R16 | R15 | R14 | R13 | R12 | R11 | R10 | R9 | R8 | R7 | R6 | R5 | R4 | R3 | R2 | |
|---|---|---|---|---|---|---|---|---|---|---|---|---|---|---|---|---|---|---|---|---|---|
| R1 | X | V | X | V | V | V | A | A | A | A | A | X | X | X | A | X | V | V | O | O | O |
| R2 | O | V | A | O | O | V | X | O | O | V | A | O | A | V | O | V | O | V | V | A | - |
| R3 | V | X | V | O | O | V | O | X | V | A | O | A | X | X | A | X | V | V | V | - | - |
| R4 | A | O | X | V | X | A | A | O | O | O | A | A | A | V | A | X | V | V | - | - | - |
| R5 | V | A | X | X | O | V | V | O | V | X | V | A | V | V | A | X | X | - | - | - | - |
| R6 | X | V | O | A | V | A | V | O | O | V | V | O | O | V | O | V | - | - | - | - | - |
| R7 | A | X | A | A | X | A | O | X | O | O | X | V | V | V | O | - | - | - | - | - | - |
| R8 | O | O | A | O | O | V | O | O | O | V | O | O | V | O | - | - | - | - | - | - | - |
| R9 | A | V | A | O | A | V | O | V | O | V | A | A | O | - | - | - | - | - | - | - | - |
| R10 | V | X | A | A | V | V | O | X | V | V | V | X | - | - | - | - | - | - | - | - | - |
| R11 | O | A | O | O | X | V | X | V | O | V | V | - | - | - | - | - | - | - | - | - | - |
| R12 | V | A | X | V | A | O | V | V | O | O | - | - | - | - | - | - | - | - | - | - | - |
| R13 | X | V | X | O | A | A | X | V | O | - | - | - | - | - | - | - | - | - | - | - | - |
| R14 | O | V | O | O | O | O | X | O | - | - | - | - | - | - | - | - | - | - | - | - | - |
| R15 | O | V | X | X | O | V | O | - | - | - | - | - | - | - | - | - | - | - | - | - | - |
| R16 | O | V | V | O | O | V | - | - | - | - | - | - | - | - | - | - | - | - | - | - | - |
| R17 | X | V | A | V | A | - | - | - | - | - | - | - | - | - | - | - | - | - | - | - | - |
| R18 | V | O | A | A | - | - | - | - | - | - | - | - | - | - | - | - | - | - | - | - | - |
| R19 | V | V | A | - | - | - | - | - | - | - | - | - | - | - | - | - | - | - | - | - | - |
| R20 | O | O | - | - | - | - | - | - | - | - | - | - | - | - | - | - | - | - | - | - | - |
| R21 | X | - | - | - | - | - | - | - | - | - | - | - | - | - | - | - | - | - | - | - | - |
© 2018 by the authors. Licensee MDPI, Basel, Switzerland. This article is an open access article distributed under the terms and conditions of the Creative Commons Attribution (CC BY) license (http://creativecommons.org/licenses/by/4.0/).
Share and Cite
Troche-Escobar, J.A.; Lepikson, H.A.; Freires, F.G.M. A Study of Supply Chain Risk in the Brazilian Wind Power Projects by Interpretive Structural Modeling and MICMAC Analysis. Sustainability 2018, 10, 3442. https://doi.org/10.3390/su10103442
Troche-Escobar JA, Lepikson HA, Freires FGM. A Study of Supply Chain Risk in the Brazilian Wind Power Projects by Interpretive Structural Modeling and MICMAC Analysis. Sustainability. 2018; 10(10):3442. https://doi.org/10.3390/su10103442
Chicago/Turabian StyleTroche-Escobar, Jorge Arnaldo, Herman Augusto Lepikson, and Francisco Gaudêncio Mendonça Freires. 2018. "A Study of Supply Chain Risk in the Brazilian Wind Power Projects by Interpretive Structural Modeling and MICMAC Analysis" Sustainability 10, no. 10: 3442. https://doi.org/10.3390/su10103442
APA StyleTroche-Escobar, J. A., Lepikson, H. A., & Freires, F. G. M. (2018). A Study of Supply Chain Risk in the Brazilian Wind Power Projects by Interpretive Structural Modeling and MICMAC Analysis. Sustainability, 10(10), 3442. https://doi.org/10.3390/su10103442