Article

Relative Importance of Climatic and Anthropogenic Drivers on the Dynamics of Aboveground Biomass across Agro-Ecological Zones on the Mongolian Plateau

Graduate School of Environmental Studies, Nagoya University, Nagoya 464-8601, Japan
*
Author to whom correspondence should be addressed.
Sustainability 2018, 10(10), 3435; https://doi.org/10.3390/su10103435
Submission received: 29 June 2018 / Revised: 7 September 2018 / Accepted: 22 September 2018 / Published: 26 September 2018
(This article belongs to the Section Environmental Sustainability and Applications)

Abstract

:
The dynamics of aboveground biomass (AGB) are driven by both climate variation and anthropogenic modification, however, few studies have evaluated the relative importance of these two drivers, especially in a heterogeneous landscape. Taking the Mongolian Plateau as a case study and employing the vegetation optical depth retrieval as a proxy of AGB, this study aimed to determine the relative importance of climatic and anthropogenic drivers on the dynamics of AGB in Mongolia (ML) and the Inner Mongolia Autonomous Region (IM), China. Spatial panel data model specific to each agro-ecological zone was employed to fulfill the task. The results revealed that: (1) Since the socio-institutional transition in the early 1990s, AGB declined in most parts of the grazing zone of Mongolia. The reduction of precipitation, the rise of temperature and the intensification of livestock grazing were the major drivers behind it. Ranked by their relative importance, the order in the grazing zone with relatively humid climate was: Precipitation ≈ temperature > livestock grazing; the order in the grazing zone with relatively arid climate was: Precipitation > temperature > livestock grazing; (2) Since the implementation of a series of ecological restoration programs in the early 2000s, AGB increased in most parts of the grazing zone of IM, and the increase of precipitation was the dominant driver behind it; (3) Since the early 2000s, AGB increased in most parts of the grazing-farming zone of IM. The increase of precipitation, the decline of temperature and the intensification of grain production were the major drivers behind it. Ranked by their relative importance, the order was: Precipitation > grain production > temperature; (4) Since the early 2000s, AGB increased in most parts of the farming zone of IM. The increase of precipitation and the intensification of grain production were the major drivers behind it. Ranked by their relative importance, the order was: Grain production > precipitation.

Graphical Abstract

1. Introduction

Comprising ~40% of the Earth’s total land surface (excluding Greenland and Antarctica), grasslands store approximately 10% of the organic carbon in global terrestrial ecosystems and support the livelihoods of ~1 billion people worldwide [1,2,3,4]. Due to accelerated climate change and intensified human disturbance, global grasslands have undergone significant degradation over the past half century, which has posed a great threat to the sustainability of grassland ecosystems and livelihoods of herders [1,5,6]. To develop effective and actionable adaptation strategies, it is essential to understand the drivers and mechanisms of grassland dynamics at large spatial scales [7,8].
Green aboveground biomass (AGB hereinafter, and standing dead biomass is not included in this study), which refers to all living vegetal matter above the soil, is a key indicator of grassland condition and has a wide range of applications in multiple fields of grassland ecology. Typically, the amount of AGB determines carbon storage capacity and its variation will cause carbon emissions or sequestration [9]. While in animal husbandry, the amount of AGB determines forage availability and hence constrains herbivore carrying capacity [10,11]. Grassland AGB is spatially and temporally highly variable [12], and climate variation and anthropogenic modification have been identified as the major drivers behind it [13,14,15,16]. Regarding climatic drivers, previous studies have investigated the single and combined effects of rising temperature, changing precipitation and radiation on the dynamics of grassland AGB at different spatial and temporal scales. According to the approaches adopted, these studies can be roughly divided into multifactorial ecosystem manipulation experiments [17,18,19], systematic field sampling [20,21] and recently, spatial-temporal modelling based on Earth observation data [13,14]. With respect to anthropogenic drivers, previous studies have mainly focused on the effects of grazing regimes and intensities on the dynamics of AGB in different grassland ecosystems by conducting systematic field investigation [22,23,24] or performing large-scale spatial analysis [25]; on this basis, some recent studies have also evaluated the impacts of agricultural expansion and settlement activities on the dynamics of grassland AGB [12,15]. Notably, most of the above-mentioned studies just examined the single influence of climatic or anthropogenic factors on the dynamics of grassland AGB, and to date, an integrated framework to assess the relative importance of these two drivers is still seldom reported [7,26].
The Mongolian Plateau (MP), located in the hinterland of temperate Asia, is a main component of the Eurasian Steppe and plays a significant role in global biogeochemical cycles and livestock production [27]. Geographically, the plateau comprises the entire territory of Mongolia (ML) and the Inner Mongolia Autonomous Region (IM), China. These two administrative divisions share similar ecological features but are very different in population density, socioeconomic background and institutional system [7,27]. In ML, livestock grazing under approximately natural conditions has long been the predominant agricultural activity and provides the main source of income for rural households there. While in IM, agriculture has been significantly diversified due to China’s massive land reclamation for centuries, which has also altered the original grassland landscapes and generated several distinct agro-ecological zones [11,28]. Over the past decades, climate on MP experienced an adverse change for vegetation growth, which manifested as a significant reduction in precipitation and a remarkable rise in temperature [29,30,31,32]. Simultaneously, livestock populations on MP underwent an explosive increase, especially since the historic socio-institutional transitions in IM and ML in the early 1980s and 1990s respectively [7,8]. These notable trends in natural and human systems have raised great concerns among scientists, herders and government about grassland degradation on the plateau. As a response, a series of ecological restoration programs (ERPs) have been proposed and implemented in the grazing zone of IM by the central government of China since the early 2000s. By comparison, similar action has not yet been taken in the counterpart of ML. This significant difference in grassland governance and utilization strategy across the border provides a good opportunity for examining the relative roles of climatic and anthropogenic factors in grassland degradation and restoration. Meanwhile, the heterogeneous landscape of IM provides a chance for exploring the divergent responses of agro-ecological zones to the implementation of ERPs.
Previously, large-scale monitoring of AGB dynamics was commonly based on change detection of multi-temporal AGB maps, which were generated from empirical statistical models built on paired observations from optical remote sensing imagery and field inventory data [33]. Recently, the emergence and advance of microwave remote sensing provide an alternative solution. Specifically, Liu, et al. [34] developed a global long-term vegetation optical depth (VOD) dataset by assimilating observations from a series of passive microwave instruments onboard different satellites. Different from traditional optical remote sensing-based vegetation indices like normalized difference vegetation index (NDVI) that can only provide a measure of chlorophyll abundance in plant canopy through band ratios, this new passive microwave-based VOD retrieval is sensitive to vegetation water content in the aboveground component of plants and can provide a direct measure of AGB [13,14,34,35].
In this study, we employed VOD as a proxy of AGB [13]. The overall objective is to evaluate the relative importance of climatic and anthropogenic drivers on the dynamics of AGB across agro-ecological zones in ML and IM, which is achieved by estimating spatial panel data model specific to each agro-ecological zone under a hypothesized and simplified conceptual framework. Beforehand, we analyzed the trends in AGB, climatic and anthropogenic drivers as well as their interrelationships across space using non-parametric statistical techniques. Specifically, we determined 1993–2012 and 2000–2012 as the study period for ML and IM respectively since these two regions underwent their most recent socio-institutional transformation influencing AGB dynamics in the early 1990s and 2000s.

2. Materials and Methods

2.1. Study Area

MP spans roughly from 85° E to 130° E longitude and 35° N to 55° N latitude and occupies a territory of 2.74 million km2, of which ML and IM constitute 57% and 43% respectively (Figure 1). Administratively, ML is divided into 22 aimags (including the capital Ulaanbaatar), which are in turn subdivided into 329 soums. Correspondingly, IM is divided into 12 prefectures (including the capital Hohhot), which are further divided into 101 counties (Figure 1 and Figure 2).
Grasslands are the predominant land cover on MP, which make up 66.5% of the area of ML and 55.2% of IM based on the MODIS land cover product (2012). Spatially, grasslands are primarily distributed in the eastern and northern part of the plateau. Gobi and desert with thin vegetation layers are also the main land covers on MP, which make up 28.1% of the area of Mongolia and 22.5% of IM and are primarily distributed in south ML and west IM. Additionally, in IM, forest and croplands occupy a considerable proportion of the territory (10.6% and 11.2% respectively) and are mainly distributed in the northeastern and southern part of the region (Figure 1).
Dominated by the East Asian monsoon, MP has an arid/semi-arid continental climate with an annual rainfall of 233 mm and an annual mean temperature of 1.9 °C. Due to the limited water availability, precipitation has been widely identified as the main spatial determinant of vegetation growth on the plateau [36,37]. Regarding temperature, controversial findings have been reported: Some studies found that temperature has a significant negative impact on vegetation growth in some parts of MP [8,31] while some others did not find similar correlations in other parts [7,29]. Besides, livestock grazing and grain production have been identified as the main human factors that also have significant impacts on vegetation changes in specific areas of ML and IM [7,25,27].

2.2. Agro-Ecological Zoning on MP

Agro-ecological zoning refers to the division of a region into smaller zones with similar combinations of potentials and constraints for agricultural production [38]. Over the past decades, this approach has been widely applied in estimation of agricultural productivity and assessment of livestock-forage balance [39]. In these applications, agro-ecological zones are mainly defined on the basis of combinations of soil properties, climatic characteristics and land covers. In this study, as to examine the relative effects of climatic and anthropogenic factors on AGB dynamics across space, we categorized soums in ML and counties in IM into different agro-ecological zones following four specific criteria.
  • We calculated the areal proportions of different land covers within each soum and county based on the MODIS land cover product (2012) (Figure 1). Those divisions primarily covered by forest, gobi and desert were masked out from this study as these land covers play limited roles in livestock and grain production, which are the major human forces driving AGB dynamics on MP.
  • We obtained an agricultural zoning map of IM from published official documents [11]. On this map, 101 counties in IM were classified into five agricultural zones (grazing, grazing-farming, farming, forestry and urban/built-up) on the basis of dominance of different sectors in local agriculture. In this study, only the grazing, grazing-farming and farming zones were retained for detailed analysis (Figure 2). For ML, as livestock grazing is the predominant agricultural activity throughout the whole country, we categorized the remaining soums as the grazing zone.
  • Considering grassland AGB responds to climate variation differently along a precipitation gradient [23,37], we subdivided the grazing zones of ML and IM by the 250 mm isohyet: The subzone with relatively humid climate (>250 mm) was defined as the Grazing-H zone; correspondingly, the subzone with relatively arid climate (<250 mm) was defined as the Grazing-A zone (Table 1). This precipitation criterion is suggested by Ellis and Swift [40] and has been applied in several empirical studies on MP [7,23].
  • We excluded those soums and counties with incomplete agricultural statistics from the study.
Figure 2 and Table 1 show the spatial distribution and descriptive statistics of categorized agro-ecological zones in ML and IM.

2.3. Conceptual Framework

Based on a literature review and panel discussion, we proposed a simplified conceptual framework and made a series of assumptions about the interrelationships between AGB, climatic and anthropogenic factors for each agro-ecological zone in ML and IM (Figure 3). The details of selected variables were as shown in Table 2.
For the grazing zone of ML, as suggested by previous studies, we hypothesized that grassland AGB is positively affected by precipitation and negatively affected by temperature [25,31]. Specifically, as livestock in ML are locally grazed and directly dependent on natural forage, we assumed that livestock grazing has a significant negative impact on grassland AGB (Figure 3a).
For the grazing zone of IM, we made similar hypotheses about the relationships between grassland AGB and climatic factors. However, regarding anthropogenic factors, we modified our assumptions proposed for ML. In the grazing zone of IM, due to the implementation of ERPs, open grazing was prohibited by local government in specific areas and seasons since the early 2000s. As a result, local herders started to import fodder and hay from neighboring farming areas as supplementary using the subsidy provided by government [7]. Consequently, a considerable proportion of domestic animals there were not directly dependent on natural forage. Based on this, we hypothesized that the significant negative correlation between grassland AGB and livestock stocking rates might be undermined in the grazing zone of IM (Figure 3b).
For the grazing-farming zone of IM, we assumed that AGB consists of grass and crop components, although their spatial allocation could not be determined in this study. For grass AGB, we hypothesized it is positively affected by precipitation and negatively affected by temperature; for crop AGB, we assumed it is primarily determined by grain yields, which are in turn positively affected by precipitation and negatively affected by temperature. Spatially, due to the difference in food source, domestic livestock in the grazing-farming zone of IM can be roughly divided into two types: Locally-grazed (depending on natural forage) and stall-fed (depending on grain and crop residue). As their relative proportions could not be determined, we could not make any assumptions in advance (Figure 3c).
For the farming zone of IM, we assumed that AGB is primarily determined by grain yields, which are in turn positively affected by precipitation and negatively affected by temperature. However, due to the long-term irrigation practice there, we hypothesized that the correlations between grain yields (crop AGB) and climatic factors might be largely undermined, especially for those counties located along the Yellow River (Figure 1). Besides, as domestic livestock in the farming zone of IM were primarily stall-fed and isolated from natural environment, we did not examine the role of livestock production in AGB dynamics within this zone (Figure 3d).

2.4. Data Acquisition and Processing

2.4.1. VOD Dataset

VOD is a dimensionless vegetation parameter (ranging from 0 to roughly 1.3) which provides a direct measure of AGB in virtue of the attenuation of vegetation (transmissivity Г) on microwave radiation emitted by the underlying soils and the vegetation itself [35,41]. Specifically, when the microwave emissions transmit through the vegetation layer, it is attenuated due to the absorption of water in AGB, which consists of both the photosynthetic and non-photosynthetic components of plants.
Γ = exp ( VOD )
In those areas with a thin vegetation layer (e.g., gobi and desert), there is little vegetation attenuation on the microwave emissions of soils, thus the vegetation transmissivity approximately equals 1 and the corresponding VOD is close to 0 [34]. VOD increases with vegetation (AGB) density and reaches the maximum in areas with dense vegetation (e.g., forest).
In this study, we obtained the VOD dataset ranging from 1993 to 2012 with monthly interval and 0.25° spatial resolution from the data archive of Department of Eco-Hydrology at the VU University Amsterdam. Employing the Land Parameter Retrieval Model, the VOD retrievals were firstly derived from the observations of three satellite-based passive microwave instruments: The Special Sensor Microwave Imager (1993–1997), the Tropical Rainfall Measuring Mission’s Microwave Imager (1998–June 2002) and the Advanced Microwave Scanning Radiometer (July 2002–2012) [34,42]; afterwards, these retrievals were merged into a harmonized product [34]. Prior to detailed analysis, annual maximum VOD composite was generated through use of the map algebra (Figure 4). This metric was selected as the proxy of annual AGB in this study as it demonstrably showed the highest correlation with on site AGB measurements in herbaceous plant communities [35]. In addition, as to be compatible with anthropogenic variables in subsequent analysis, the annual maximum VOD composites were spatially aggregated to soum-level in ML and county-level in IM using the area weighting method (Table 2).

2.4.2. Climatic Data

Climatic data employed in this study comprised of monthly precipitation and temperature (Table 2). Specifically, three open-access precipitation products with monthly interval and 0.5° spatial resolution were downloaded from the data archives of Center for Climatic Research (CCR), Climatic Research Unit (CRU) and Global Precipitation Climatology Centre (GPCC). Averages of these products were utilized in this study as to avoid any potential bias existing in a single product. Similarly, two temperature products were acquired from the data archives of CCR and CRU and composited into monthly averages. On this basis, as to be compatible with anthropogenic variables in subsequent analysis, the monthly precipitation and temperature averages were also spatially aggregated to soum-level in ML and county-level in IM using the area weighting method.
On MP, growing season generally starts from April or May, and annual maximum AGB commonly appears in July or August. In light of some previous studies, cumulative precipitation from the start of growing season to the peak of annual AGB is most crucial to the accumulation of AGB in dryland areas like MP [25,43]. However, due to the significant ecological gradients, the starting month of the growing season and the peak month of annual AGB vary considerably across MP. To address this issue, for a specific soum/county, we calculated the Spearman’s correlation coefficients between annual maximum AGB and different specific cumulative precipitation (April–July, April–August, May–July, May–August, June–July, June–August, July–August) and selected the one showing the highest correlation with the former as the precipitation variable (optimal cumulative precipitation hereinafter, abbreviated as PREC, see Supplementary Materials Figure S1) for this soum/county used in subsequent analysis, including spatial analysis and spatial panel data models. Similar procedure was also applied to generate optimal cumulative temperature (abbreviated as TEMP, see Supplementary Materials Figure S2) for each soum/county.

2.4.3. Agricultural Statistics

Agricultural statistics used in this study included livestock numbers at soum-level in ML during 1993–2012, livestock numbers and grain yields at county-level in IM during 2000–2012. These statistics were firstly compiled from the statistical yearbooks of ML and IM at yearly intervals and then normalized by total area of each soum/county to generate livestock densities (abbreviated as LIVE, Table 2) and grain yields per unit area (abbreviated as GRAIN, Table 2).

2.4.4. Non-Parametric Statistical Techniques

Non-parametric statistical techniques used in this study included the Mann-Kendall trend test, Sen’s slope estimator and Spearman’s rank correlation. Compared to parametric statistical techniques, these methods do not require any assumption on the distribution of dataset and are less sensitive to outliers, thus are more suitable for analyzing time series of ecological, hydrological and climatic data [44]. Specifically, the Mann-Kendall trend test is used to statistically evaluate if a variable of interest exhibits a monotonic upward or downward trend over time, regardless of whether the trend is linear or not [45]. Sen’s slope estimator is commonly employed along with the Mann-Kendall trend test as to provide a robust estimate of slope for the trend [46]. Spearman’s rank correlation is used to measure strength and direction of association between two variables that have been ranked in specific orders [47].
In this study, we firstly applied the Mann-Kendall trend test to detect monotonic trends in time series of AGB, climatic and anthropogenic drivers; afterwards, Sen’s slope estimator was used to estimate the slopes of these trends. In addition, before performing spatial panel analysis, we explored the correlations between annual AGB and independent variables over time in each soum and county using Spearman’s rank correlation.

2.4.5. Spatial Panel Data Models

Spatial panel data models commonly refer to statistical models built on spatial panels which contain time series observations (t = 1, …, T) of a number of spatial units (i = 1, …, N) [48,49]. From the perspective of data structure, spatial panel data models are the combination of conventional cross-sectional and time series data models (Figure 5) and thus have higher degrees of freedom and more sample variability, which can improve the accuracy and efficiency of parameter estimation [49,50]. The standard model for spatial panels with spatial specific and interaction effects is defined as Equation (2) [51].
y i t = δ j = 1 N w i j y j t + X i t β + u i + ε i t
where δ is called the spatial autoregressive coefficient, which represents the spatial dependency (interaction) among neighboring spatial units [48]; wij is an element of a spatial weight matrix w, which measures the proximity of neighboring spatial unis [7]; β is a vector of regression coefficients of independent variables X; μi is called the spatial fixed effect of spatial unit i, which represents the impacts of all space-specific time-invariant variables whose omissions can bias the estimation results (typically, in cross-sectional studies) [51]; εit is an independently and identically distributed error term for spatial unit i at time t.
Due to the advantages and strengths over cross-sectional and time series data models [52], spatial panel data models have been widely applied in the fields such as urban economics [53], environmental economics [54] and regional inequality [55]. Recently, the models have also been demonstrated to be promising options for modelling land use/land cover changes [56] and vegetation dynamics [7,26]. In this study, we firstly employed spatial panel data models with spatial fixed and interaction effects [51] to diagnose the major drivers (p < 0.05) of AGB dynamics within each agro-ecological zone:
AGB i t = δ j = 1 n w i j AGB j t + β 1 PREC i t + β 2 TEMP i t + [ β 3 LIVE i t ] + [ β 4 GRAIN i t ] + μ i + ε i t
the definitions of abbreviated variables are as shown in Table 2. In this study, the incorporation of the spatial interaction effect δ posits that AGB in one soum/county tends to be affected by AGB in its neighbors. For instance, if one soum/county is surrounded by neighbors with high AGB, then this soum/county tends to have better ground water availability and suffer less from wind erosion, both of which are favorable for AGB accumulation [7]. Meanwhile, the incorporation of the spatial fixed effect μi in this study posits that some space-specific variables, such as soil fertility and local geomorphology, are temporally constant but play important roles in determining AGB distribution [26]. Before estimating the spatial panel data models, the dependent and independent variables, as well as the spatial weight matrix (generated using the inverse distance weighting method in this study), were normalized to the range of 0–1 using the Min-Max scaling method [57].
After identifying the major drivers of AGB dynamics within each agro-ecological zone, we iteratively regressed each of these drivers against AGB to show their respective explanatory power and to compare the relative importance of climatic and anthropogenic drivers. Specifically, the overall coefficient of determination (R2) was selected to measure the explanatory power of estimated spatial panel data models [58].

3. Results

3.1. Trends in AGB across Agro-Ecological Zones

Figure 6 and Table 3 illustrate that grasslands in ML underwent an extensive decline in AGB during 1993–2012. Specifically, in the Grazing-H zone, grasslands underwent a dramatic, moderate and slight decrease in AGB that accounted for 16.8%, 39.4% and 37.0% of the territory respectively (the grading criteria are as shown in Table 3); by contrast, grasslands experienced an increase in AGB that only occupied 6.8% of the territory. In the Grazing-A zone, grasslands underwent a dramatic, moderate and slight decrease in AGB that accounted for 11.1%, 30.0% and 58.3% of the territory respectively, and few grasslands experienced an increase in AGB (Table 3). Spatially, grasslands in central and northeast ML experienced the largest decrease in AGB (Figure 6).
During 2000–2012, a positive trend in AGB was observed over the entire IM (Figure 6, Table 3). In the Grazing-H zone, grasslands underwent a slight increase in AGB that occupied a large proportion of the territory (61.5%) and were mainly distributed in the central IM prefecture of Xilin Gol; simultaneously, grasslands experienced a slight decrease in AGB that also occupied a considerable areal proportion (29.0%) and were primarily distributed in the northern IM prefecture of Hulunbuir (Figure 6, Table 3). In the Grazing-A zone, an overwhelming majority of the grasslands (83.5%) underwent a slight increase in AGB; by comparison, only 4.7% of the grasslands experienced a decrease in AGB (Table 3). In the grazing-farming zone, areas showing a slight, moderate and dramatic increase in AGB accounted for 44.5%, 38.2% and 9.4% of the territory respectively; spatially, the largest increase occurred in the eastern IM prefecture of Tongliao and western prefecture of Ordos (Figure 6, Table 3). In the farming zone, areas showing a slight, moderate and dramatic increase in AGB accounted for 44.0%, 28.0% and 6.7% of the territory respectively; spatially, the increase was especially pronounced in the eastern part of Ordos and southern part of the eastern IM prefecture of Chifeng. Notably, areas showing a negative trend also occupied a considerable areal proportion (21.4%) and were primarily distributed in the central IM prefecture of Ulaan Chab (Figure 6, Table 3).

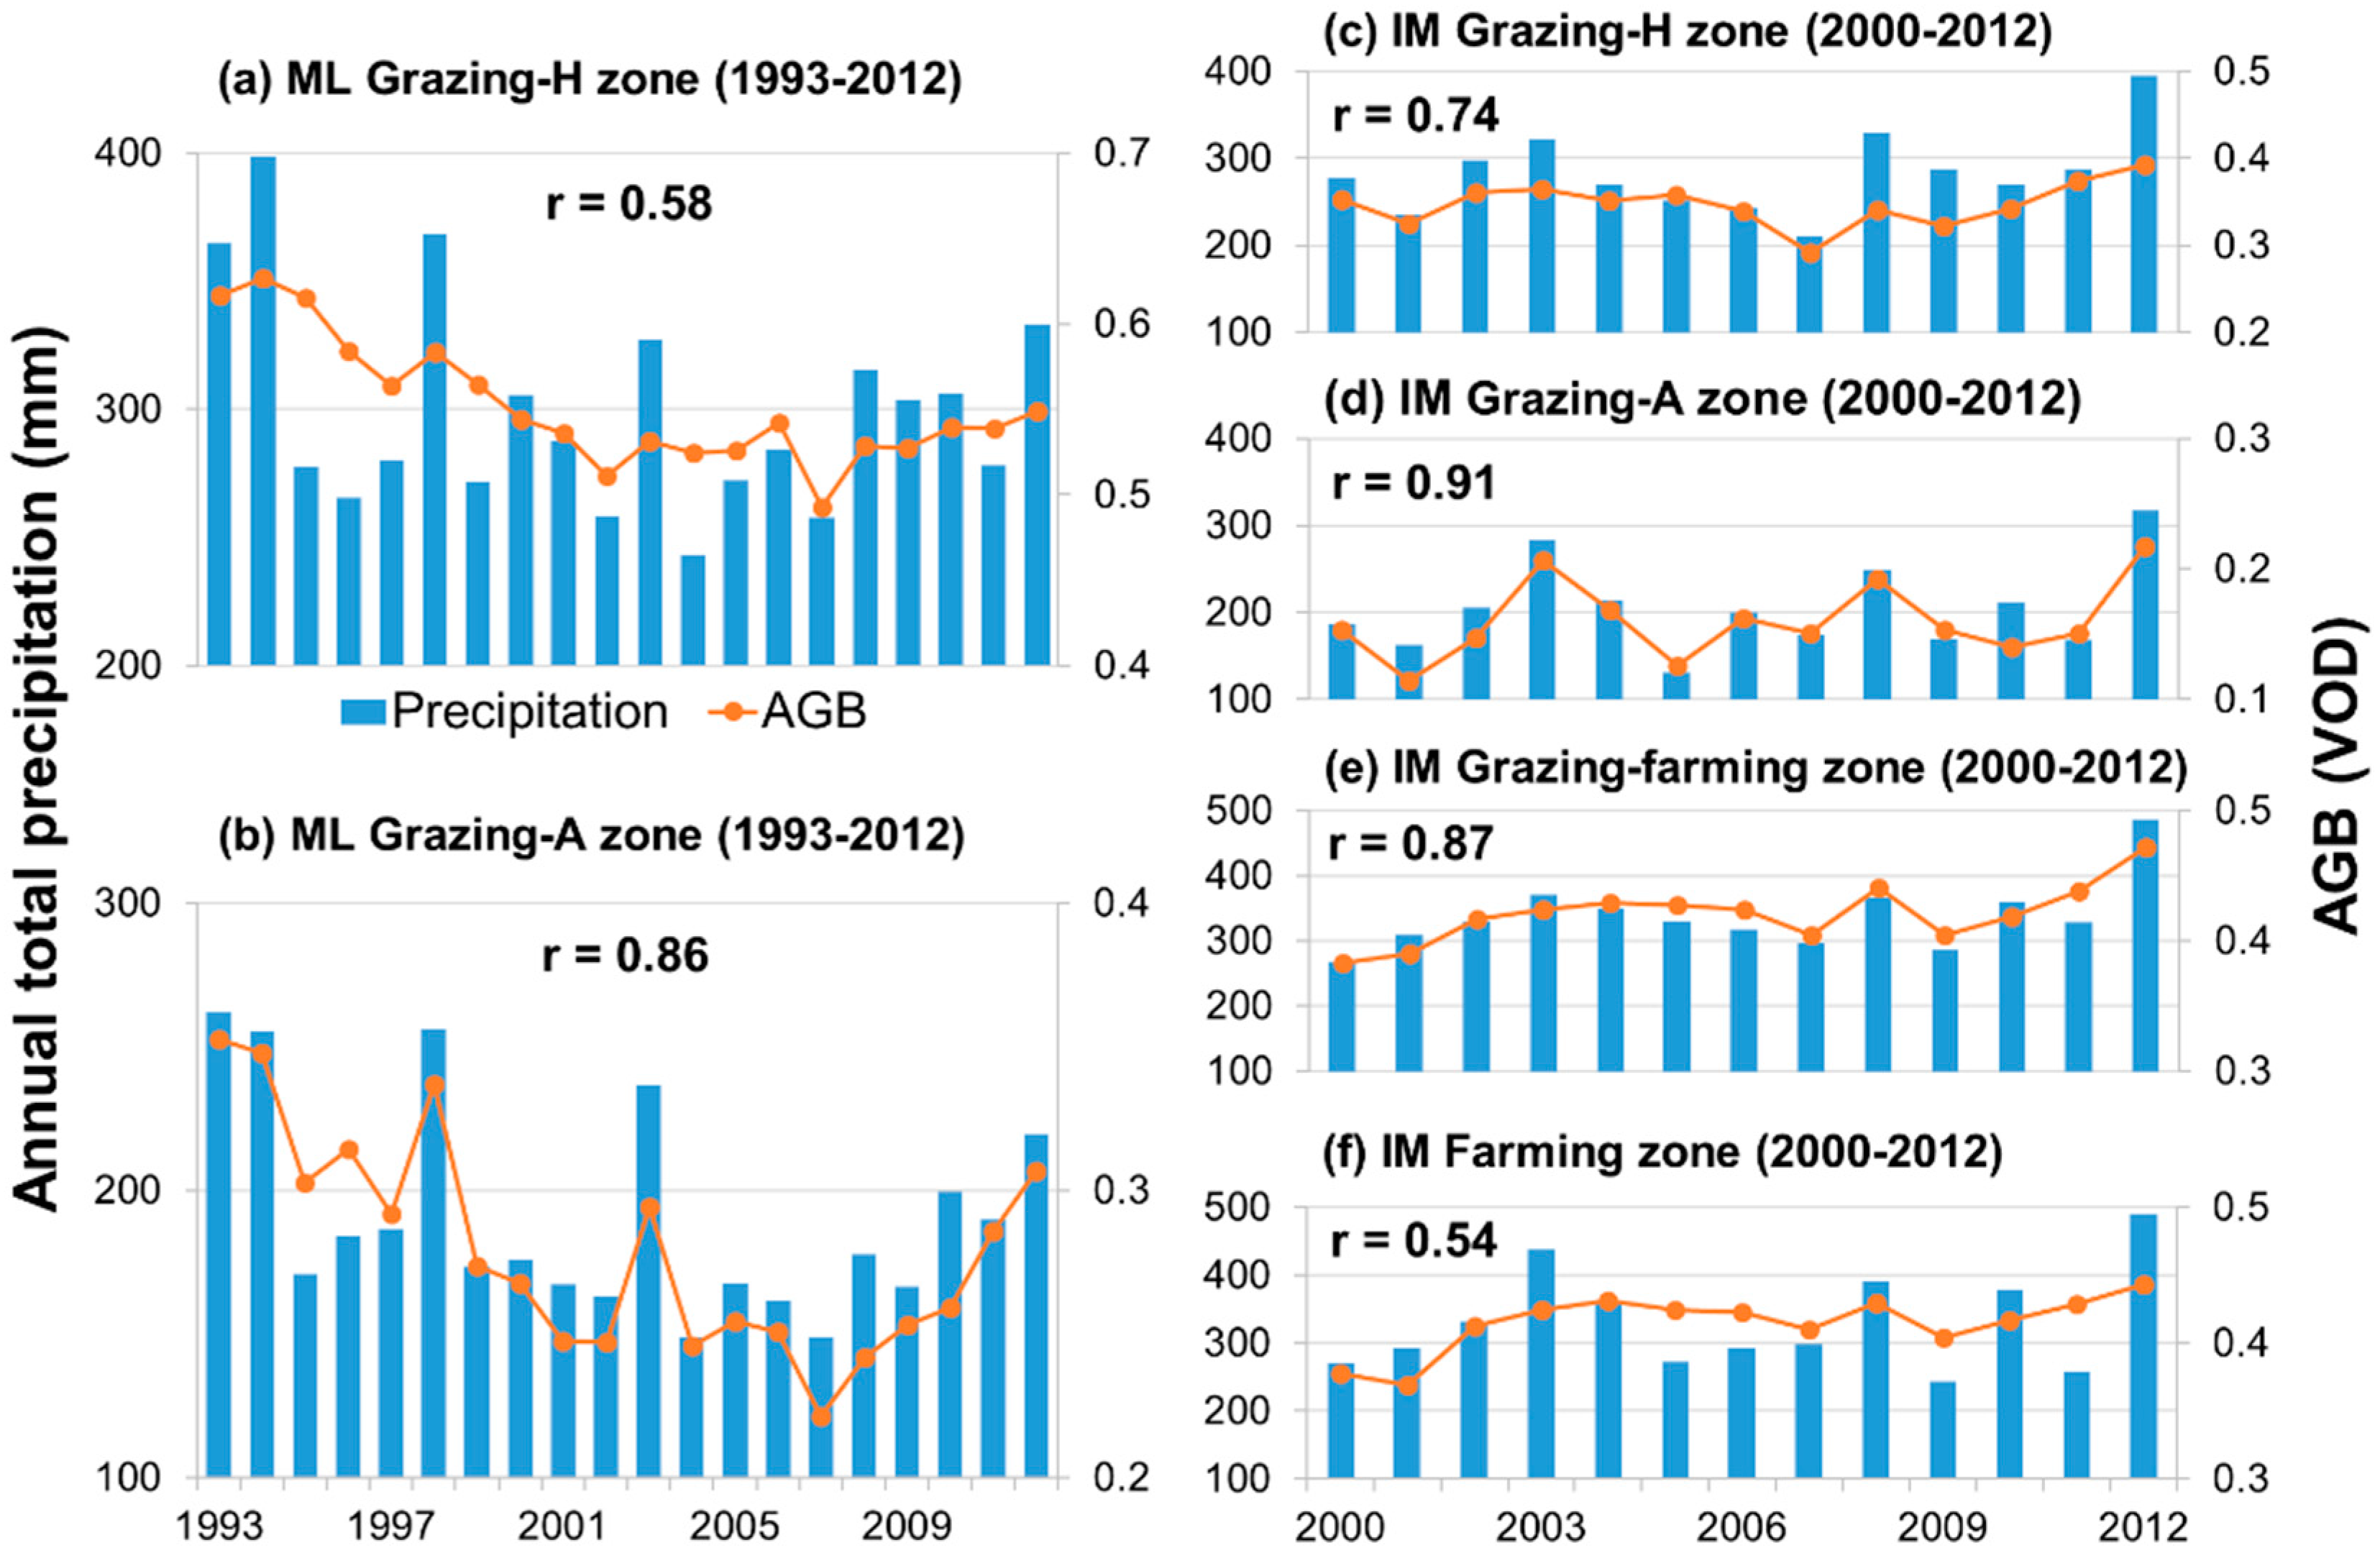
3.2. Trends in Climatic Drivers and Their Correlations with AGB

To better illustrate how AGB responds to precipitation year-by-year, Figure 7 shows the inter-annual variation of annual total precipitation and AGB at agro-ecological zone-level in ML during 1993–2012 and IM during 2000–2012. Specifically, annual total precipitation was aggregated from monthly averages and noteworthily, it was not the precipitation variable used in subsequent analyses (optimal cumulative precipitation instead). Figure 7a,b illustrates that from 1993 to 2012, annual total precipitation in both the Grazing-H and Grazing-A zone of ML exhibited an overall decreasing trend, which led to a concurrent decline in AGB in these two zones. The correlation analysis revealed that in ML, the decline of AGB was more attributable to the decrease of annual total precipitation in the Grazing-A zone than in the Grazing-H zone. Figure 7c–f shows that from 2000 to 2012, annual total precipitation exhibited an overall increasing trend in all agro-ecological zones of IM, which caused a concurrent increase in AGB in these zones. The correlation analysis revealed that in IM, the increase of AGB was more attributable to the increase of annual total precipitation in the Grazing-A zone than in the Grazing-H zone; meanwhile, the analysis revealed that AGB in the farming zone showed the weakest response to the increase of annual total precipitation among all agro-ecological zones of IM.
Figure 8a illustrates that at soum-level, optimal cumulative precipitation decreased in most parts of ML during 1993–2012. Spatially, the largest decrease occurred in northeast and west ML. The correlation analysis confirmed that AGB decreased with lower precipitation (p < 0.10) in most parts of ML, except for those soums located in the northernmost aimag of Khuvsgul. Spatially, the correlation was also largely higher in the Grazing-A zone than in the Grazing-H zone (Figure 8b).
Figure 8c illustrates that at county-level, variation in optimal cumulative precipitation varied across IM during 2000–2012 but the trend was largely positive. The correlation analysis confirmed that AGB increased with higher precipitation (p < 0.10) in most parts of IM, except for those counties located along the Yellow River. Spatially, the correlation was lowest in the farming zone and highest in the Grazing-A zone (Figure 8d).
Figure 9a illustrates that at soum-level, optimal cumulative temperature rose across the whole ML during 1993–2012. The correlation analysis revealed that AGB declined with higher temperature (p < 0.10) in most parts of ML with few exceptions (Figure 9b).
Figure 9c illustrates that at county-level, optimal cumulative temperature declined in most parts of IM during 2000–2012. The correlation analysis revealed that AGB increased with lower temperature (p < 0.10) in most parts of IM, except for some farming and grazing-farming counties located along the Yellow River and some grazing counties in north IM (Hulunbuir) (Figure 9d).

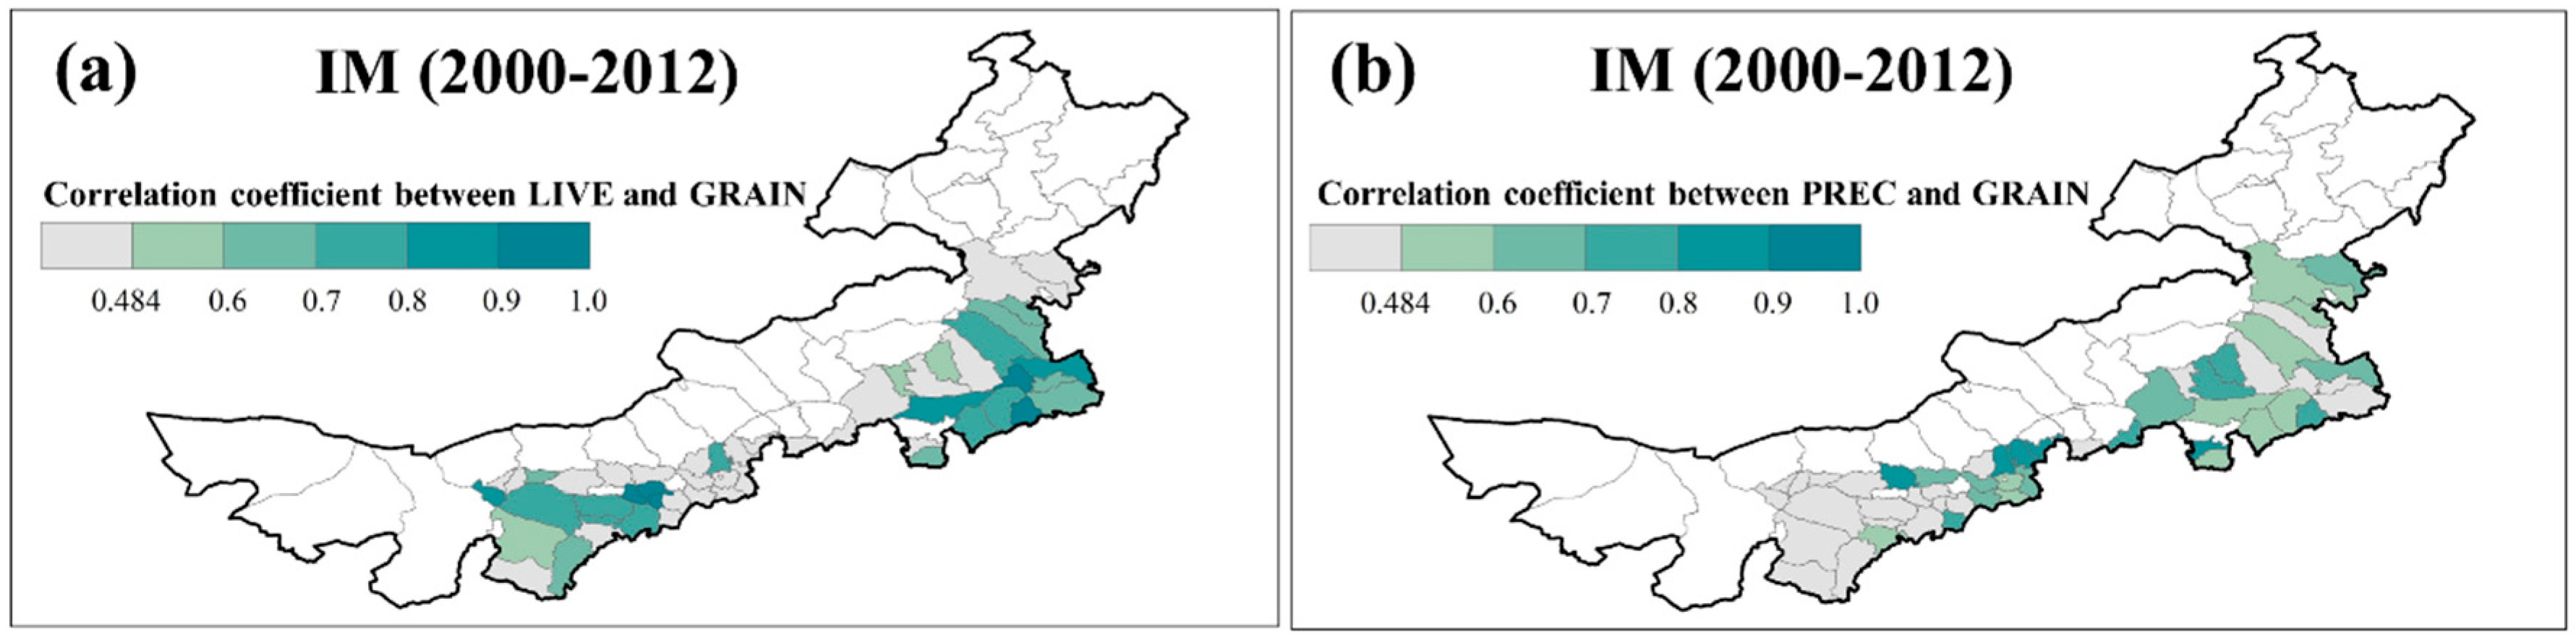
3.3. Trends in Anthropogenic Drivers and Their Correlations with AGB

Figure 10a illustrates that an overwhelming majority of grazing soums (90.0%) in ML underwent an increase in livestock densities during 1993–2012. Spatially, the largest increase occurred in central ML. Among two grazing zones, the increasing rate of livestock densities was much higher in the Grazing-H zone than in the Grazing-A zone (Figure 10a). Figure 10b reveals that the correlation between livestock densities and AGB differed considerably between two grazing zones: In the Grazing-H zone, AGB declined with higher livestock densities (p < 0.10) in 56.3% of the soums; in the Grazing-A zone, AGB decreased with higher livestock densities (p < 0.10) in 30.7% of the soums. Overall, AGB declined more remarkably under intensified livestock grazing in the former than in the latter. Spatially, the soums showing a significant negative correlation between livestock densities and AGB (p < 0.10) were mainly distributed in central and northeast ML (Figure 10b).
Figure 10c illustrates that at county-level, changes in livestock densities varied considerably across agro-ecological zones in IM during 2000–2012. In the grazing zone, livestock densities declined in 68.8% of the counties, which were mainly distributed in the central prefecture of Xilin Gol; simultaneously, livestock densities increased in 31.3% of the counties, which were primarily distributed in the northern prefecture of Hulunbuir. In the grazing-farming and farming zone, livestock densities increased in 82.6% and 92.9% of the counties respectively. Spatially, the increase was especially pronounced in the eastern prefectures of Tongliao and Chifeng and western prefectures of Ordos and Hohhot (Figure 10c). Figure 10d reveals that the correlation between livestock densities and AGB was statistically insignificant in most parts of IM (p > 0.10).
Figure 11a illustrates that a majority of grazing-farming (87.0%) and farming counties (71.4%) in IM underwent an increase in grain yields during 2000–2012. Spatially, the largest increase occurred in the eastern prefectures of Tongliao and Chifeng. Notably, a considerable proportion of farming counties (28.6%) underwent a decrease in grain yields and spatially, these counties were mainly distributed in the central prefecture of Ulaan Chab. Figure 11b reveals that AGB increased with higher grain yields (p < 0.10) in most grazing-farming (78.3%) and farming (82.1%) counties of IM.

3.4. Estimates of the Spatial Panel Data Models for AGB Dynamics

Table 4 illustrates that in the grazing zone of ML, precipitation had a significant positive relationship with AGB while temperature and livestock densities had a significant negative relationship with AGB, all of which were in conformity with the assumptions made above (Figure 3a). More specifically, in the Grazing-H zone, precipitation and temperature had approximately equal explanatory power for AGB dynamics; by contrast, the explanatory power of livestock densities was relatively lower but nonnegligible. In the Grazing-A zone, precipitation had the greatest and overwhelming explanatory power for AGB dynamics, followed by temperature and livestock densities (Table 5). Furthermore, the comparison between two grazing zones illustrates that precipitation had greater explanatory power for AGB dynamics in the Grazing-A zone than in the Grazing-H zone, while livestock densities were the opposite (Table 5).
In the grazing zone of IM, precipitation was the only factor that had a statistically significant relationship with AGB (Table 4), and the positive signs were in line with the hypothesis proposed above (Figure 3b). Temperature was negatively correlated with AGB in both of the grazing zones, but unexpectedly, the relationships were statistically insignificant. Livestock densities were also negatively correlated with AGB and the relationships were also statistically insignificant, but both of these coincided exactly with our predefined hypotheses (Figure 3b). Moreover, the comparison between two grazing zones of IM also demonstrates that precipitation had greater explanatory power for AGB dynamics in the Grazing-A zone than in the Grazing-H zone (Table 5).
In the grazing-farming zone of IM, precipitation and grain yields per unit area had a significant positive relationship with AGB while temperature had a significant negative relationship with AGB (Table 4), all of which were in accordance with the assumptions made above (Figure 3c). Livestock densities were negatively correlated with AGB, but the relationship was statistically insignificant. Table 5 illustrates that precipitation had the greatest explanatory power for AGB dynamics in the grazing-farming zone of IM, followed by grain yields per unit area and temperature, but the differences were not remarkable, especially between the former two.
In the farming zone of IM, precipitation and grain yields per unit area had a significant positive relationship with AGB. Meanwhile, although temperature was negatively correlated with AGB as expected, the relationship was statistically insignificant (Table 4). Table 5 illustrates that grain yields per unit area had greater explanatory power for AGB dynamics than precipitation in the farming zone of IM, which was broadly in line with our expectation (Figure 3d).
Overall, as indicated by the values of overall R2, the spatial panel data models estimated in this study had moderate/high explanatory power for AGB dynamics (43.06–77.15% of the variance could be explained) within each agro-ecological zone, which were comparable to the results of similar studies [26,56]. Besides, all of the spatial autoregressive coefficients of these models were statistically significant and positive at the 0.001 level, which demonstrated that spatial dependence existed among neighboring soums and counties (Table 4).

4. Discussion

4.1. Relative Effects of Climatic and Anthropogenic Drivers on Grassland Degradation in ML

The extensive decline of AGB indicated that grasslands in ML underwent a widespread degradation since the historic socio-institutional transition in the early 1990s. In this process, the adverse change of regional climate, which manifested as a reduction in precipitation and a rise in temperature, played a major role. Simultaneously, the rapid growth of livestock stocking rates, which was mainly induced by livestock privatization and market factors as reported by previous studies [8,27,31], also played a considerable role. These findings conformed to existing knowledge that vegetation dynamics in typical drylands are more controlled by climatic drivers rather than human forces [7,36]. However, in some specific parts of ML, grassland degradation was partly attributable to overgrazing.
This study also revealed that the effects of climate variation and livestock grazing on grassland degradation varied across ML. Spatially, along a precipitation gradient, precipitation played a more significant role in grassland degradation in the Grazing-A zone than that in the Grazing-H zone. This pattern could be largely explained by the higher sensitivity of vegetation response to precipitation under lower moisture conditions, which has also been demonstrated by a number of previous studies [59,60]. By contrast, along the precipitation gradient, livestock grazing had stronger impact on grassland degradation in the Grazing-H zone than in the Grazing-A zone. A similar pattern has also been reported by some previous studies [23,36] and to the best of our knowledge, this could be largely attributed to two factors. First, in the Grazing-H zone of ML, the climate is relatively less variable and the major vegetation type is meadow steppe with high forage availability for livestock grazing [7], thus, herders there tend to utilize certain pasture continuously and have low mobility; while in the Grazing-A zone, the climate is relatively more variable and the major vegetation type is typical and desert steppe with low forage availability, thus, herders there tend to move periodically and have high mobility [61]. This difference in local grazing regime put different levels of pressure on grasslands, thus, might have contributed to the difference in grazing-induced degradation between the two grazing zones. Second, also due to the differences in climate variability and forage availability, herders in the Grazing-H zone tend to keep a much larger number of livestock than their counterparts in the Grazing-A zone (Figure 10a), which might also have contributed to the difference in grazing-induced degradation.

4.2. Relative Effects of Climatic and Anthropogenic Drivers on Grassland Restoration in IM

The extensive increase of AGB suggested that grasslands in the grazing zone of IM experienced a restoration since the implementation of ERPs in the early 2000s. In this process, the increase of precipitation played a dominant role. This coincided with the findings of some previous studies that within this water-limited region, precipitation is the most crucial factor that contributes to grassland restoration [36,62,63]. Simultaneously, as revealed by this study, the negative impact of livestock production on grassland AGB was largely diminished in the grazing zone of IM. To the best of our knowledge, this could be attributed to two main factors. First, as mentioned above, the import of fodder and hay from neighboring farming areas, which was mainly induced by grazing prohibition in specific areas and seasons, contributed to weakening the dependence of domestic livestock on natural forage in the grazing zone of IM [7]. Second, the extensive decrease of livestock stocking rates (Figure 10c), which was mainly motivated by government subsidy, contributed to relieving the grazing pressure on grasslands [43,64]. Based on these, it can be concluded that the major contribution of China’s ERPs in the grazing zone of IM was excluding human disturbance for herbaceous plant communities to recover.
This study also revealed that along a precipitation gradient, precipitation played a more significant role in grassland restoration in the Grazing-A zone than that in the Grazing-H zone. This was consistent with existing knowledge: In regions with less water availability, rainfall is generally more crucial to the vegetation growth [60,65].

4.3. Relative Effects of Climatic and Anthropogenic Drivers on Agricultural Intensification in IM

The extensive increase of AGB indicated that the grazing-farming and farming zone of IM underwent significant vegetation growth since the early 2000s, which mainly manifested as the intensification of grain production. Figure 12a illustrates that within these two zones, livestock densities increased with higher grain yields (p < 0.10) in 56.5% and 46.4% of the counties respectively, which basically verified our predefined hypotheses that grain and crop residue constituted a considerable proportion of food source for stall-fed domestic animals in these two zones during 2000–2012. Exceptions mainly occurred in the central IM prefectures of Hohhot and Ulaan Chab with high population densities (Figure 12a), thus, we inferred that a larger proportion of grain yields in these two prefectures were devoted to feed humans rather than livestock.
The rapid intensification of grain production and its significant correlation with livestock populations have important implications. Since the implementation of ERPs, livestock grazing was strictly regulated by local government in the grazing zone of IM. Simultaneously, the demand for livestock products in international and domestic markets did not decline but continued to grow, especially after China’s admission into the World Trade Organization in 2001 [8]. As a result, the neighboring grazing-farming and farming zone became the hotspot of livestock production, meanwhile, confined feeding became the main operation mode of animal husbandry in IM. To produce sufficient food for a rapidly increasing number of stall-fed livestock, grain production within these two zones were hence intensified. Meanwhile, a considerable proportion of the grain yields were also exported to the neighboring grazing counties as mentioned above.
This study also revealed that climate played a more significant role in agricultural intensification in the grazing-farming zone than in the farming zone. This largely resulted from the difference in dependence of crop growth on climate between the two zones (Figure 12b). In the grazing-farming zone, croplands are largely unirrigated thus the growth of planted crops there depends heavily on climate. While in the farming zone, a considerable proportion of croplands are well irrigated (primarily by the Yellow River), hence the growth of planted crops there is less dependent on climate. These findings were in conformity with the predefined assumptions.

4.4. Implications for Regional Sustainability

As revealed in this study, climate is the main determinant of vegetation changes in the grazing areas of MP. In the next decades, as predicted by a number of research groups, climate change on MP will accelerate and be characterized by a remarkable rise in temperature and an alteration in intra-annual precipitation pattern [66,67]. Also, the frequency and magnitude of extreme events, like drought and dzud (extremely cold winter), are projected to increase with accelerated climate change. Consequently, the grassland ecosystem in MP will be subject to higher uncertainties. In this context, proper adaptation strategies in livestock and grassland management are urgently required. The grassland restoration practice in IM implies that reducing livestock stocking rates might be an option. In ML, since 2012 (the end of study period in this study), livestock populations increased unceasingly at an annual rate of 10.1% [68], and by far, there is still no specific national plan to curb this trend. Meanwhile, due to increasing sedentarization, herders in some specific areas commonly utilize certain pasture continuously, which might cause irreversible damage to the latter [43]. Typically, in central ML, the rapid increase of livestock stocking rates and sedentarization have significantly undermined the response of grassland ecosystem to rainfall. Therefore, for policymakers, reducing livestock stocking rates and preventing certain pasture from excessive utilization might be practical and actionable measures to promote the sustainability of grassland ecosystem and animal husbandry under a changing climate.
Additionally, as revealed in this study, agricultural intensification and expansion occurred in some parts of IM since the early 2000s. Although they could contribute to improving AGB locally, some previous studies have demonstrated that reclamation for cultivation in arid and semi-arid environments could potentially lead to land degradation through degrading soil properties [69,70] and lowering groundwater levels [71]. Therefore, this issue should also be sufficiently emphasized and properly addressed in the future.

4.5. Limitations of This Study

A number of limitations exist in the present study. First, the estimated spatial panel data models have relatively lower explanatory power for AGB dynamics in the Grazing-H zones of ML and IM. One possible reason is that this study did not consider the impact of wildfires, which were demonstrably of frequent occurrence within these two zones [25,72]. Second, the estimated models also have relatively lower explanatory power in the farming zone of IM, possibly because the effects of settlement expansion, which occurred extensively within this zone since the early 2000s [73], were not clearly addressed in the present study. Third, because of the inherent features of passive microwave instruments, VOD has a relatively coarse spatial resolution and is unable to provide comparable spatial details to optical remote sensing products [34]. Next, this study compared the relative effects of climatic and human drivers on AGB dynamics at agro-ecological zone-level, but noteworthily, the relative effects also varied considerably within each agro-ecological zone. In future research, a more sophisticated modelling approach is required to determine the relative effects of these two drivers on AGB dynamics at local scale and to identify areas that overgrazing has severely weaken or deprive grassland’s ability to recover or to respond to rain events. Finally, this study only focused on inter-annual variation of AGB and its response to climate variability and human activities, by contrast, the analysis at monthly intervals is largely neglected, which can also be considered as a direction for future research.

5. Conclusions

By employing VOD as a proxy of AGB, this study first analyzed the trends in AGB, climatic and anthropogenic drivers as well as their interrelationships across MP using non-parametric statistical techniques. Afterwards, by estimating spatial panel data model specific to each agro-ecological zone in ML and IM under a hypothesized and simplified conceptual framework, this study identified the major drivers of AGB dynamics within each agro-ecological zone and determined the relative importance of climatic and anthropogenic drivers. The main conclusions were summarized as follows:
  • AGB declined in most parts of the grazing zone of ML during 1993–2012. The reduction of precipitation, the rise of temperature and the intensification of livestock grazing were the major drivers behind it. Ranked by their relative importance, the order in the grazing zone with relatively humid climate was: Precipitation ≈ temperature > livestock grazing; the order in the grazing zone with relatively arid climate was: Precipitation > temperature > livestock grazing.
  • In the grazing zone of ML, the contribution of precipitation to the decline of AGB increased with aridity. By contrast, the contribution of livestock grazing to the decline of AGB increased with humidity.
  • AGB increased in most parts of the grazing zone of IM since the implementation of ERPs in the early 2000s. The increase of precipitation was the dominant driver behind it. China’s ERPs contributed indirectly to the increase of AGB by diminishing the negative impact of livestock production on grasslands.
  • In the grazing zone of IM, the contribution of precipitation to the increase of AGB increased with aridity.
  • AGB increased in most parts of the grazing-farming zone of IM since the early 2000s. The increase of precipitation, the decline of temperature and the intensification of grain production were the major drivers behind it. Ranked by their relative importance, the order was: Precipitation > grain production > temperature.
  • AGB increased in most parts of the farming zone of IM since the early 2000s. The increase of precipitation and the intensification of grain production were the major drivers behind it. Ranked by their relative importance, the order was: Grain production > precipitation.

Supplementary Materials

The following are available online at https://www.mdpi.com/2071-1050/10/10/3435/s1, Figure S1: Period of cumulative precipitation showing highest correlation with annual AGB at soum-level in ML (1993–2012) (a) and county-level in IM (2000–2012) (b), Figure S2: Period of cumulative temperature showing highest correlation with annual AGB at soum-level in ML (1993–2012) (a) and county-level in IM (2000–2012) (b).

Author Contributions

X.Z. and Y.Y. conceived and designed the study; X.Z. analyzed the data; X.Z. and Y.Y. interpreted the results; X.Z. prepared the manuscript; Y.Y. revised the manuscript.

Funding

This research was funded by JSPS KAKENHI (Grant No. 16H02703).

Acknowledgments

The authors would like to thank Miyasaka, Nagoya University for his valuable discussion and suggestions.

Conflicts of Interest

The authors declare no conflict of interest.

References

  1. White, R.; Murray, S.; Rohweder, M. Pilot Analysis of Global Ecosystems (PAGE): Grassland Ecosystems; World Resources Institute (WRI): Washington, DC, USA, 2000; p. 100. [Google Scholar]
  2. Ma, A.; He, N.P.; Yu, G.R.; Wen, D.; Peng, S.L. Carbon storage in Chinese grassland ecosystems: Influence of different integrative methods. Sci. Rep. 2016, 6, 21378. [Google Scholar] [CrossRef] [PubMed] [Green Version]
  3. O’Mara, F.P. The role of grasslands in food security and climate change. Ann. Bot. 2012, 110, 1263–1270. [Google Scholar] [CrossRef] [PubMed] [Green Version]
  4. Kemp, D.R.; Han, G.D.; Hou, X.Y.; Michalk, D.L.; Hou, F.J.; Wu, J.P.; Zhang, Y.J. Innovative grassland management systems for environmental and livelihood benefits. Proc. Natl. Acad. Sci. USA 2013, 110, 8369–8374. [Google Scholar] [CrossRef] [PubMed] [Green Version]
  5. Ma, Z.Y.; Liu, H.Y.; Mi, Z.R.; Zhang, Z.H.; Wang, Y.H.; Xu, W.; Jiang, L.; He, J.S. Climate warming reduces the temporal stability of plant community biomass production. Nat. Commun. 2017, 8, 15378. [Google Scholar] [CrossRef] [PubMed] [Green Version]
  6. Lambin, E.F.; Geist, H.J.; Helmut, J. Land-Use and Land-Cover Change: Local Processes and Global Impacts; Springer: Berlin, Germany, 2006. [Google Scholar]
  7. Wang, J.; Brown, D.G.; Chen, J.Q. Drivers of the dynamics in net primary productivity across ecological zones on the Mongolian Plateau. Landsc. Ecol. 2013, 28, 725–739. [Google Scholar] [CrossRef]
  8. Chen, J.Q.; John, R.; Shao, C.L.; Fan, Y.; Zhang, Y.Q.; Amarjargal, A.; Brown, D.G.; Qi, J.G.; Han, J.J.; Lafortezza, R.; et al. Policy shifts influence the functional changes of the CNH systems on the Mongolian plateau. Environ. Res. Lett. 2015, 10, 085003. [Google Scholar] [CrossRef] [Green Version]
  9. Liu, Y.Y.; van Dijk, A.; de Jeu, R.A.M.; Canadell, J.G.; McCabe, M.F.; Evans, J.P.; Wang, G.J. Recent reversal in loss of global terrestrial biomass. Nat. Clim. Chang. 2015, 5, 470–474. [Google Scholar] [CrossRef]
  10. Yang, Y.H.; Fang, J.Y.; Pan, Y.D.; Ji, C.J. Aboveground biomass in Tibetan grasslands. J. Arid Environ. 2009, 73, 91–95. [Google Scholar] [CrossRef]
  11. Da, L.; Zheng, Y. True or false overgrazing? An empirical study in the Inner Mongolian grasslands. Chin. Rural Econ. 2012, 5, 4–18. [Google Scholar]
  12. Brinkmann, K.; Dickhoefer, U.; Schlecht, E.; Buerkert, A. Quantification of aboveground rangeland productivity and anthropogenic degradation on the Arabian Peninsula using Landsat imagery and field inventory data. Remote Sens. Environ. 2011, 115, 465–474. [Google Scholar] [CrossRef]
  13. Liu, Y.Y.; van Dijk, A.; McCabe, M.F.; Evans, J.P.; de Jeu, R.A.M. Global vegetation biomass change (1988-2008) and attribution to environmental and human drivers. Glob. Ecol. Biogeogr. 2013, 22, 692–705. [Google Scholar] [CrossRef]
  14. Andela, N.; Liu, Y.Y.; van Dijk, A.; de Jeu, R.A.M.; McVicar, T.R. Global changes in dryland vegetation dynamics (1988–2008) assessed by satellite remote sensing: Comparing a new passive microwave vegetation density record with reflective greenness data. Biogeosciences 2013, 10, 6657–6676. [Google Scholar] [CrossRef] [Green Version]
  15. Allington, G.R.H.; Li, W.; Brown, D.G. Urbanization and environmental policy effects on the future availability of grazing resources on the Mongolian Plateau: Modeling socio-environmental system dynamics. Environ. Sci. Policy 2017, 68, 35–46. [Google Scholar] [CrossRef]
  16. Miao, F.H.; Guo, Z.G.; Xue, R.; Wang, X.Z.; Shen, Y.Y. Effects of grazing and precipitation on herbage biomass, herbage nutritive value, and yak performance in an alpine meadow on the Qinghai-Tibetan Plateau. PLoS ONE 2015, 10. [Google Scholar] [CrossRef] [PubMed]
  17. Dieleman, W.I.J.; Vicca, S.; Dijkstra, F.A.; Hagedorn, F.; Hovenden, M.J.; Larsen, K.S.; Morgan, J.A.; Volder, A.; Beier, C.; Dukes, J.S.; et al. Simple additive effects are rare: A quantitative review of plant biomass and soil process responses to combined manipulations of CO2 and temperature. Glob. Chang. Biol. 2012, 18, 2681–2693. [Google Scholar] [CrossRef] [PubMed]
  18. Densmore-McCulloch, J.A.; Thompson, D.L.; Fraser, L.H. Short-term effects of changing precipitation patterns on shrub-steppe grasslands: Seasonal watering is more important than frequency of watering events. PLoS ONE 2016, 11. [Google Scholar] [CrossRef] [PubMed]
  19. Bloor, J.M.G.; Pichon, P.; Falcimagne, R.; Leadley, P.; Soussana, J.F. Effects of warming, summer drought, and CO2 enrichment on aboveground biomass production, flowering phenology, and community structure in an upland grassland ecosystem. Ecosystems 2010, 13, 888–900. [Google Scholar] [CrossRef]
  20. Ma, W.H.; Yang, Y.H.; He, J.S.; Hui, Z.; Fang, J.Y. Above- and belowground biomass in relation to environmental factors in temperate grasslands, Inner Mongolia. Sci. China Ser. C 2008, 51, 263–270. [Google Scholar] [CrossRef] [PubMed]
  21. Scurlock, J.M.O.; Johnson, K.; Olson, R.J. Estimating net primary productivity from grassland biomass dynamics measurements. Glob. Chang. Biol. 2002, 8, 736–753. [Google Scholar] [CrossRef] [Green Version]
  22. Li, W.; Cao, W.X.; Wang, J.L.; Li, X.L.; Xu, C.L.; Shi, S.L. Effects of grazing regime on vegetation structure, productivity, soil quality, carbon and nitrogen storage of alpine meadow on the Qinghai-Tibetan Plateau. Ecol. Eng. 2017, 98, 123–133. [Google Scholar] [CrossRef]
  23. Fernandez-Gimenez, M.E.; Allen-Diaz, B. Testing a non-equilibrium model of rangeland vegetation dynamics in Mongolia. J. Appl. Ecol. 1999, 36, 871–885. [Google Scholar] [CrossRef] [Green Version]
  24. Liu, J.H.; Wu, J.J.; Su, H.B.; Gao, Z.H.; Wu, Z.T. Effects of grazing exclusion in Xilin Gol grassland differ between regions. Ecol. Eng. 2017, 99, 271–281. [Google Scholar] [CrossRef]
  25. Liu, Y.Y.; Evans, J.P.; McCabe, M.F.; de Jeu, R.A.M.; van Dijk, A.; Dolman, A.J.; Saizen, I. Changing climate and overgrazing are decimating Mongolian steppes. PLoS ONE 2013, 8. [Google Scholar] [CrossRef] [PubMed]
  26. Chen, H.B.; Shao, L.Q.; Zhao, M.J.; Zhang, X.; Zhang, D.J. Grassland conservation programs, vegetation rehabilitation and spatial dependency in Inner Mongolia, China. Land Use Policy 2017, 64, 429–439. [Google Scholar] [CrossRef]
  27. John, R.; Chen, J.Q.; Kim, Y.; Ou-yang, Z.T.; Xiao, J.F.; Park, H.; Shao, C.L.; Zhang, Y.Q.; Amarjargal, A.; Batkhshig, O.; et al. Differentiating anthropogenic modification and precipitation-driven change on vegetation productivity on the Mongolian Plateau. Landsc. Ecol. 2016, 31, 547–566. [Google Scholar] [CrossRef]
  28. Wu, J.G.; Zhang, Q.; Li, A.; Liang, C.Z. Historical landscape dynamics of Inner Mongolia: Patterns, drivers, and impacts. Landsc. Ecol. 2015, 30, 1579–1598. [Google Scholar] [CrossRef]
  29. Zhao, X.; Hu, H.F.; Shen, H.H.; Zhou, D.J.; Zhou, L.M.; Myneni, R.B.; Fang, J.Y. Satellite-indicated long-term vegetation changes and their drivers on the Mongolian Plateau. Landsc. Ecol. 2015, 30, 1599–1611. [Google Scholar] [CrossRef]
  30. Jiang, L.G.; Yao, Z.J.; Huang, H.Q. Climate variability and change on the Mongolian Plateau: Historical variation and future predictions. Clim. Res. 2016, 67, 1–14. [Google Scholar] [CrossRef]
  31. Hilker, T.; Natsagdorj, E.; Waring, R.H.; Lyapustin, A.; Wang, Y.J. Satellite observed widespread decline in Mongolian grasslands largely due to overgrazing. Glob. Chang. Biol. 2014, 20, 418–428. [Google Scholar] [CrossRef] [PubMed]
  32. Wang, J.; Brown, D.G.; Agrawal, A. Climate adaptation, local institutions, and rural livelihoods: A comparative study of herder communities in Mongolia and Inner Mongolia, China. Glob. Environ. Chang.-Hum. Policy Dimens. 2013, 23, 1673–1683. [Google Scholar] [CrossRef]
  33. Lu, D.S. The potential and challenge of remote sensing-based biomass estimation. Int. J. Remote Sens. 2006, 27, 1297–1328. [Google Scholar] [CrossRef]
  34. Liu, Y.Y.; de Jeu, R.A.M.; McCabe, M.F.; Evans, J.P.; van Dijk, A. Global long-term passive microwave satellite-based retrievals of vegetation optical depth. Geophys. Res. Lett. 2011, 38. [Google Scholar] [CrossRef] [Green Version]
  35. Tian, F.; Brandt, M.; Liu, Y.Y.; Verger, A.; Tagesson, T.; Diouf, A.A.; Rasmussen, K.; Mbow, C.; Wang, Y.J.; Fensholt, R. Remote sensing of vegetation dynamics in drylands: Evaluating vegetation optical depth (VOD) using AVHRR NDVI and in situ green biomass data over West African Sahel. Remote Sens. Environ. 2016, 177, 265–276. [Google Scholar] [CrossRef] [Green Version]
  36. John, R.; Chen, J.Q.; Giannico, V.; Park, H.; Xiao, J.F.; Shirkey, G.; Ouyang, Z.T.; Shao, C.L.; Lafortezza, R.; Qi, J.G. Grassland canopy cover and aboveground biomass in Mongolia and Inner Mongolia: Spatiotemporal estimates and controlling factors. Remote Sens. Environ. 2018, 213, 34–48. [Google Scholar] [CrossRef]
  37. Bai, Y.F.; Wu, J.G.; Xing, Q.; Pan, Q.M.; Huang, J.H.; Yang, D.L.; Han, X.G. Primary production and rain use efficiency across a precipitation gradient on the Mongolia plateau. Ecology 2008, 89, 2140–2153. [Google Scholar] [CrossRef] [PubMed]
  38. FAO. Agro-Ecological Zoning Guidelines; Food and Agriculture Organization of the United Nations: Roma, Italy, 1996. [Google Scholar]
  39. Fischer, G.; Shah, M.; Tubiello, F.N.; van Velhuizen, H. Socio-economic and climate change impacts on agriculture: An integrated assessment, 1990–2080. Philos. Trans. R. Soc. B-Biol. Sci. 2005, 360, 2067–2083. [Google Scholar] [CrossRef] [PubMed] [Green Version]
  40. Ellis, J.; Swift, D. Stability of African postoral ecosystems: Alternate paradigms and implications for development. J. Range Manag. 1988, 41, 450–459. [Google Scholar] [CrossRef]
  41. Jones, M.O.; Jones, L.A.; Kimball, J.S.; McDonald, K.C. Satellite passive microwave remote sensing for monitoring global land surface phenology. Remote Sens. Environ. 2011, 115, 1102–1114. [Google Scholar] [CrossRef]
  42. Owe, M.; de Jeu, R.; Walker, J. A methodology for surface soil moisture and vegetation optical depth retrieval using the microwave polarization difference index. IEEE Trans. Geosci. Remote Sens. 2001, 39, 1643–1654. [Google Scholar] [CrossRef] [Green Version]
  43. Li, A.; Wu, J.G.; Huang, J.H. Distinguishing between human-induced and climate-driven vegetation changes: A critical application of RESTREND in inner Mongolia. Landsc. Ecol. 2012, 27, 969–982. [Google Scholar] [CrossRef]
  44. Hamed, K.H. Trend detection in hydrologic data: The Mann-Kendall trend test under the scaling hypothesis. J. Hydrol. 2008, 349, 350–363. [Google Scholar] [CrossRef]
  45. Yue, S.; Pilon, P.; Cavadias, G. Power of the Mann-Kendall and Spearman’s rho tests for detecting monotonic trends in hydrological series. J. Hydrol. 2002, 259, 254–271. [Google Scholar] [CrossRef]
  46. Gocic, M.; Trajkovic, S. Analysis of precipitation and drought data in Serbia over the period 1980–2010. J. Hydrol. 2013, 494, 32–42. [Google Scholar] [CrossRef]
  47. McDonald, J.H. Handbook of Biological Statistics, 3rd ed.; Sparky House Publishing: Baltimore, MD, USA, 2014; p. 210. [Google Scholar]
  48. Elhorst, J.P. Spatial Econometrics: From Cross-Sectional Data to Spatial Panels; Springer: Heidelberg/Berlin, Germany, 2014. [Google Scholar]
  49. Elhorst, J.P. Specification and estimation of spatial panel data models. Int. Reg. Sci. Rev. 2003, 26, 244–268. [Google Scholar] [CrossRef]
  50. Hsiao, C. Panel data analysis—Advantages and challenges. Test-Spain 2007, 16, 1–22. [Google Scholar] [CrossRef]
  51. Elhorst, J.P. Spatial panel data models. In Handbook of Applied Spatial Analysis: Software Tools, Methods and Applications; Fischer, M.M., Getis, A., Eds.; Springer: Berlin, Germany, 2010; pp. 377–407. [Google Scholar]
  52. Elhorst, J.P. Spatial panel data analysis. In Encyclopedia of GIS, 2nd ed.; Shekhar, S., Xiong, H., ZHou, X., Eds.; Springer International Publishing: Cham, Switzerland, 2017; pp. 2050–2058. [Google Scholar]
  53. Deng, X.Z.; Huang, J.K.; Rozelle, S.; Uchida, E. Growth, population and industrialization, and urban land expansion of China. J. Urban Econ. 2008, 63, 96–115. [Google Scholar] [CrossRef]
  54. Auffhammer, M.; Carson, R.T. Forecasting the path of China’s CO2 emissions using province-level information. J. Environ. Econ. Manag. 2008, 55, 229–247. [Google Scholar] [CrossRef]
  55. Rodriguez-Pose, A.; Tselios, V. Education and income inequality in the regions of the European Union. J. Reg. Sci. 2009, 49, 411–437. [Google Scholar] [CrossRef]
  56. Zhang, Z.H.; Su, S.L.; Xiao, R.; Jiang, D.W.; Wu, J.P. Identifying determinants of urban growth from a multi-scale perspective: A case study of the urban agglomeration around Hangzhou Bay, China. Appl. Geogr. 2013, 45, 193–202. [Google Scholar] [CrossRef]
  57. Xu, J. Mathematical Methods in Contemporary Geography; Higher Education Press: Beijing, China, 2002. [Google Scholar]
  58. Belotti, F.; Hughes, G.; Mortari, A.P. Spatial panel-data models using Stata. Stata J. 2017, 17, 139–180. [Google Scholar] [CrossRef]
  59. Piao, S.L.; Mohammat, A.; Fang, J.Y.; Cai, Q.; Feng, J.M. NDVI-based increase in growth of temperate grasslands and its responses to climate changes in China. Glob. Environ. Chang.-Hum. Policy Dimens. 2006, 16, 340–348. [Google Scholar] [CrossRef]
  60. Nemani, R.R.; Keeling, C.D.; Hashimoto, H.; Jolly, W.M.; Piper, S.C.; Tucker, C.J.; Myneni, R.B.; Running, S.W. Climate-driven increases in global terrestrial net primary production from 1982 to 1999. Science 2003, 300, 1560–1563. [Google Scholar] [CrossRef] [PubMed]
  61. Okayasu, T.; Okuro, T.; Jamsran, U.; Takeuchi, K. Threshold distinctions between equilibrium and nonequilibrium pastoral systems along a continuous climatic gradient. Rangel. Ecol. Manag. 2011, 64, 10–17. [Google Scholar] [CrossRef]
  62. Hao, L.; Sun, G.; Liu, Y.Q.; Gao, Z.Q.; He, J.J.; Shi, T.T.; Wu, B.J. Effects of precipitation on grassland ecosystem restoration under grazing exclusion in Inner Mongolia, China. Landsc. Ecol. 2014, 29, 1657–1673. [Google Scholar] [CrossRef]
  63. Tian, H.J.; Cao, C.X.; Chen, W.; Bao, S.N.; Yang, B.; Myneni, R.B. Response of vegetation activity dynamic to climatic change and ecological restoration programs in Inner Mongolia from 2000 to 2012. Ecol. Eng. 2015, 82, 276–289. [Google Scholar] [CrossRef]
  64. Zhuo, L.; Cao, X.; Chen, J.; Chen, Z.; Shi, P. Assessment of grassland ecological restoration project in Xilingol Grassland. Acta Geogr. Sin. 2007, 62, 471–480. [Google Scholar]
  65. Fang, J.Y.; Piao, S.L.; Zhou, L.M.; He, J.S.; Wei, F.Y.; Myneni, R.B.; Tucker, C.J.; Tan, K. Precipitation patterns alter growth of temperate vegetation. Geophys. Res. Lett. 2005, 32, L21411. [Google Scholar] [CrossRef]
  66. Asian Development Bank (ADB). Making Grasslands Sustainable in Mongolia: Adapting to Climate and Environmental Change; Asian Development Bank (ADB): Mandaluyong, Philippines, 2013; p. 8. [Google Scholar]
  67. Intergovernmental Panel on Climate Change (IPCC). Climate Change 2014: Impacts, Adaptation, and Vulnerability. Part A: Global and Sectoral Aspects. Contribution of Working Group II to the Fifth Assessment Report of the Intergovernmental Panel on Climate Change; Cambridge University Press: Cambridge, UK, 2014; p. 1132. [Google Scholar]
  68. National Statistics Office of Mongolia (NSOM). Mongilian Statistical Yearbook 2017; National Statistics Office of Mongolia (NSOM): Ulaanbaatar, Mongolia, 2017. [Google Scholar]
  69. Qi, Y.C.; Dong, Y.S.; Peng, Q.; Xiao, S.S.; He, Y.T.; Liu, X.C.; Sun, L.J.; Jia, J.Q.; Yang, Z.J. Effects of a conversion from grassland to cropland on the different soil organic carbon fractions in Inner Mongolia, China. J. Geogr. Sci. 2012, 22, 315–328. [Google Scholar] [CrossRef] [Green Version]
  70. Jiao, Y.; Xu, Z.; Zhao, J. Effects of grassland conversion to cropland and forest on soil organic carbon and dissolved organic carbon in the farming-pastoral ecotone of Inner Mongolia. Acta Ecol. Sin. 2009, 29, 150–154. [Google Scholar] [CrossRef]
  71. Ó Dochartaigh, B.E.; MacDonald, A.M.; Darling, W.G.; Hughes, A.G.; Li, J.X.; Shi, L.A. Determining groundwater degradation from irrigation in desert-marginal northern China. Hydrogeol. J. 2010, 18, 1939–1952. [Google Scholar] [CrossRef] [Green Version]
  72. Jia, X.; Gao, Y.; Qi, H.G.J.; Wei, B.C.; Cui, X.X.; Meng, Z.J.; Tang, G.D. MODIS-based spatio-temporal distribution of wildfire in Inner Mongolia. Chin. J. Eco-Agric. 2017, 25, 127–135. [Google Scholar]
  73. Park, H.; Fan, P.; John, R.; Chen, J. Urbanization on the Mongolian Plateau after economic reform: Changes and causes. Appl. Geogr. 2017, 86, 118–127. [Google Scholar] [CrossRef]
Figure 1. Geographical location and land covers (2012) of the Mongolian Plateau (MP).
Sustainability 10 03435 g001
Figure 2. Spatial distribution of categorized agro-ecological zones in Mongolia (ML) and Inner Mongolia (IM).
Sustainability 10 03435 g002
Figure 3. Hypothesized interrelationships between AGB (aboveground biomass), climatic and anthropogenic factors within grazing zone in ML (a), grazing (b), grazing-farming (c) and farming (d) zones in IM (the definitions of abbreviated variables are as shown in Table 2).
Sustainability 10 03435 g003
Figure 4. Mean annual maximum AGB (VOD, vegetation optical depth) of ML during 1993–2012 (a) and IM during 2000–2012 (b).
Sustainability 10 03435 g004
Figure 5. Examples of data structure of spatial panel data models (a), cross-sectional data models (b) and time series data models (c).
Sustainability 10 03435 g005
Figure 6. Spatial patterns of AGB dynamics at soum-level in ML (1993–2012) (a) and county-level in IM (2000–2012) (b).
Sustainability 10 03435 g006
Figure 7. Annual total precipitation and AGB (VOD) at agro-ecological zone-level in ML (1993–2012) (a,b) and IM (2000–2012) (cf) (r is the Spearman correlation coefficient between annual total precipitation and AGB).
Sustainability 10 03435 g007
Figure 8. Trends in optimal cumulative precipitation (PREC) and their correlations with AGB at soum-level in ML (1993–2012) (a,b) and county-level in IM (2000–2012) (c,d) (regarding correlations, only the soums and counties statistically significant at the 0.10 level are colored).
Sustainability 10 03435 g008
Figure 9. Trends in optimal cumulative temperature (TEMP) and their correlations with AGB at soum-level in ML (1993–2012) (a,b) and county-level in IM (2000–2012) (c,d) (regarding correlations, only the soums and counties statistically significant at the 0.10 level are colored).
Sustainability 10 03435 g009
Figure 10. Trends in livestock densities (LIVE) and their correlations with AGB at soum-level in ML (1993–2012) (a,b) and county-level in IM (2000–2012) (c,d).
Sustainability 10 03435 g010
Figure 11. Trends in grain yields per unit area (GRAIN) (a) and their correlations with AGB (b) at county-level in IM (2000–2012) (regarding correlations, only the counties statistically significant at the 0.10 level are colored).
Sustainability 10 03435 g011
Figure 12. Correlations between LIVE and GRAIN (a), PREC and GRAIN (b) at county-level in IM (2000–2012) (only the counties statistically significant at the 0.10 level are colored).
Sustainability 10 03435 g012
Table 1. Summary of categorized agro-ecological zones in ML and IM.
RegionAgro-Ecological ZoneNumber of Soums/CountiesTotal Area (thousand km2)
MLGrazing-H87342.44
Grazing-A153640.75
IMGrazing-H10188.20
Grazing-A6152.75
Grazing-farming23253.07
Farming28100.57
Note: Grazing-H denotes the grazing zone with relatively humid climate; Grazing-A denotes the grazing zone with relatively arid climate (same below).
Table 2. Variables used in the spatial panel data models for AGB dynamics.
VariableDefinitionUnit
AGBAnnual maximum green aboveground biomassNull
PRECOptimal cumulative precipitationmm
TEMPOptimal cumulative temperature°C
LIVELivestock densitiesheads km−2
GRAINGrain yields per unit areatons km−2
SPATIAL (δ)Spatial autoregressive termNull
Table 3. Areal proportions of different AGB trends across agro-ecological zones in ML (1993–2012) and IM (2000–2012).
AGB Trend (10−3 yr−1)ML (1993–2012)IM (2000–2012)
Grazing-HGrazing-AGrazing-HGrazing-AGrazing-FarmingFarming
DecreaseDramatic (<−8)16.811.10.00.00.00.0
Moderate (−8~−4)39.430.03.40.00.22.4
Slight (−4~0)37.058.329.04.77.919.0
IncreaseSlight (0~4)6.80.761.583.544.544.0
Moderate (4~8)0.00.06.211.838.228.0
Dramatic (>8)0.00.00.00.09.46.7
Table 4. Estimates of the spatial panel data models for AGB dynamics using normalized variables.
VariableML (1993–2012)IM (2000–2012)
Grazing-HGrazing-AGrazing-HGrazing-AGrazing-FarmingFarming
PREC0.1631 **0.3012 **0.3255 **0.4374 **0.1924 **0.1304 **
TEMP−0.1194 **−0.0645 **−0.0400−0.0922−0.1690 **−0.0205
LIVE−0.0718 **−0.0190 *−0.0327−0.0104−0.0043
GRAIN 0.2616 **0.3576 **
SPATIAL0.9619 **0.9188 **0.7753 **0.5545 **0.6355 **0.8999 **
Overall R20.56370.64180.45670.77150.57130.4306
Significance level: **, 0.001; *, 0.05.
Table 5. Coefficients of determination (R2) of the spatial panel data models: Iteratively regressing each of the independent variables (p < 0.05) against AGB to show their respective explanatory power.
VariableML (1993–2012)IM (2000–2012)
Grazing-HGrazing-AGrazing-HGrazing-AGrazing-FarmingFarming
PREC0.27910.57230.44760.76300.38470.1630
TEMP0.27880.3000 0.2549
LIVE0.11430.0481
GRAIN 0.34120.3459
Overall0.56370.64180.45670.77150.57130.4306

