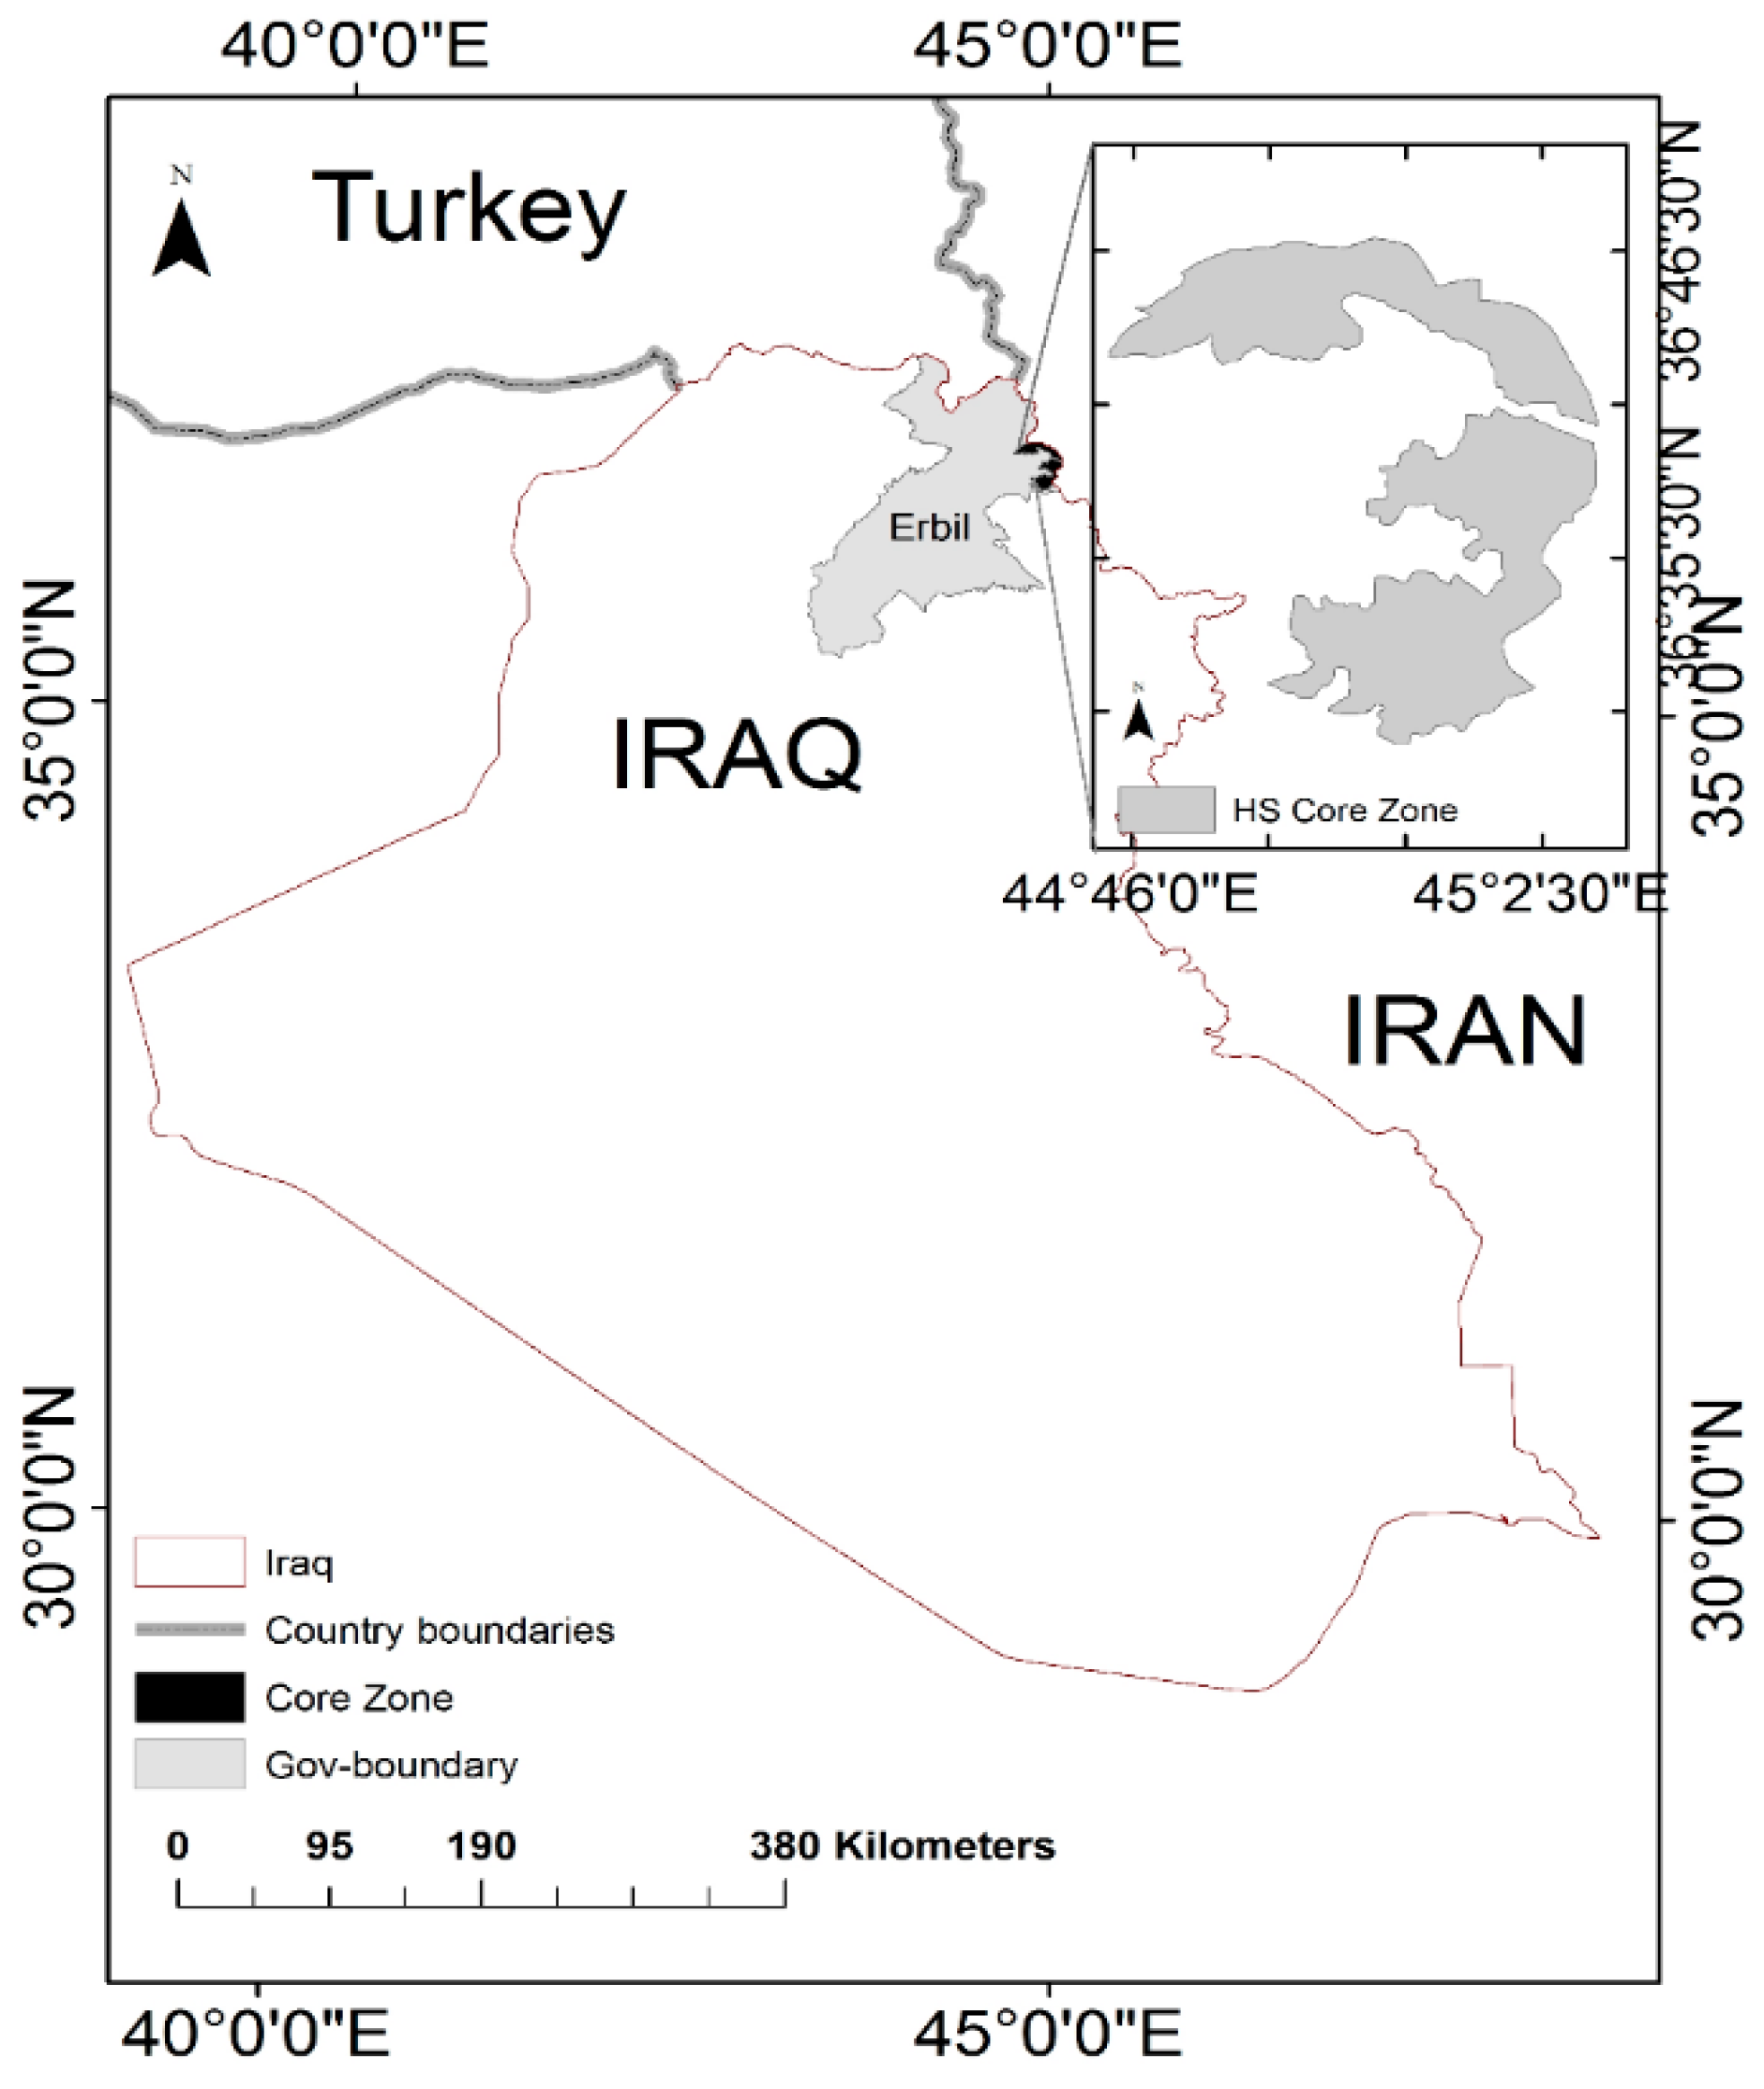
Figure 1.
Geographical location of Halgurd-Sakran Core Zone.
Figure 1.
Geographical location of Halgurd-Sakran Core Zone.
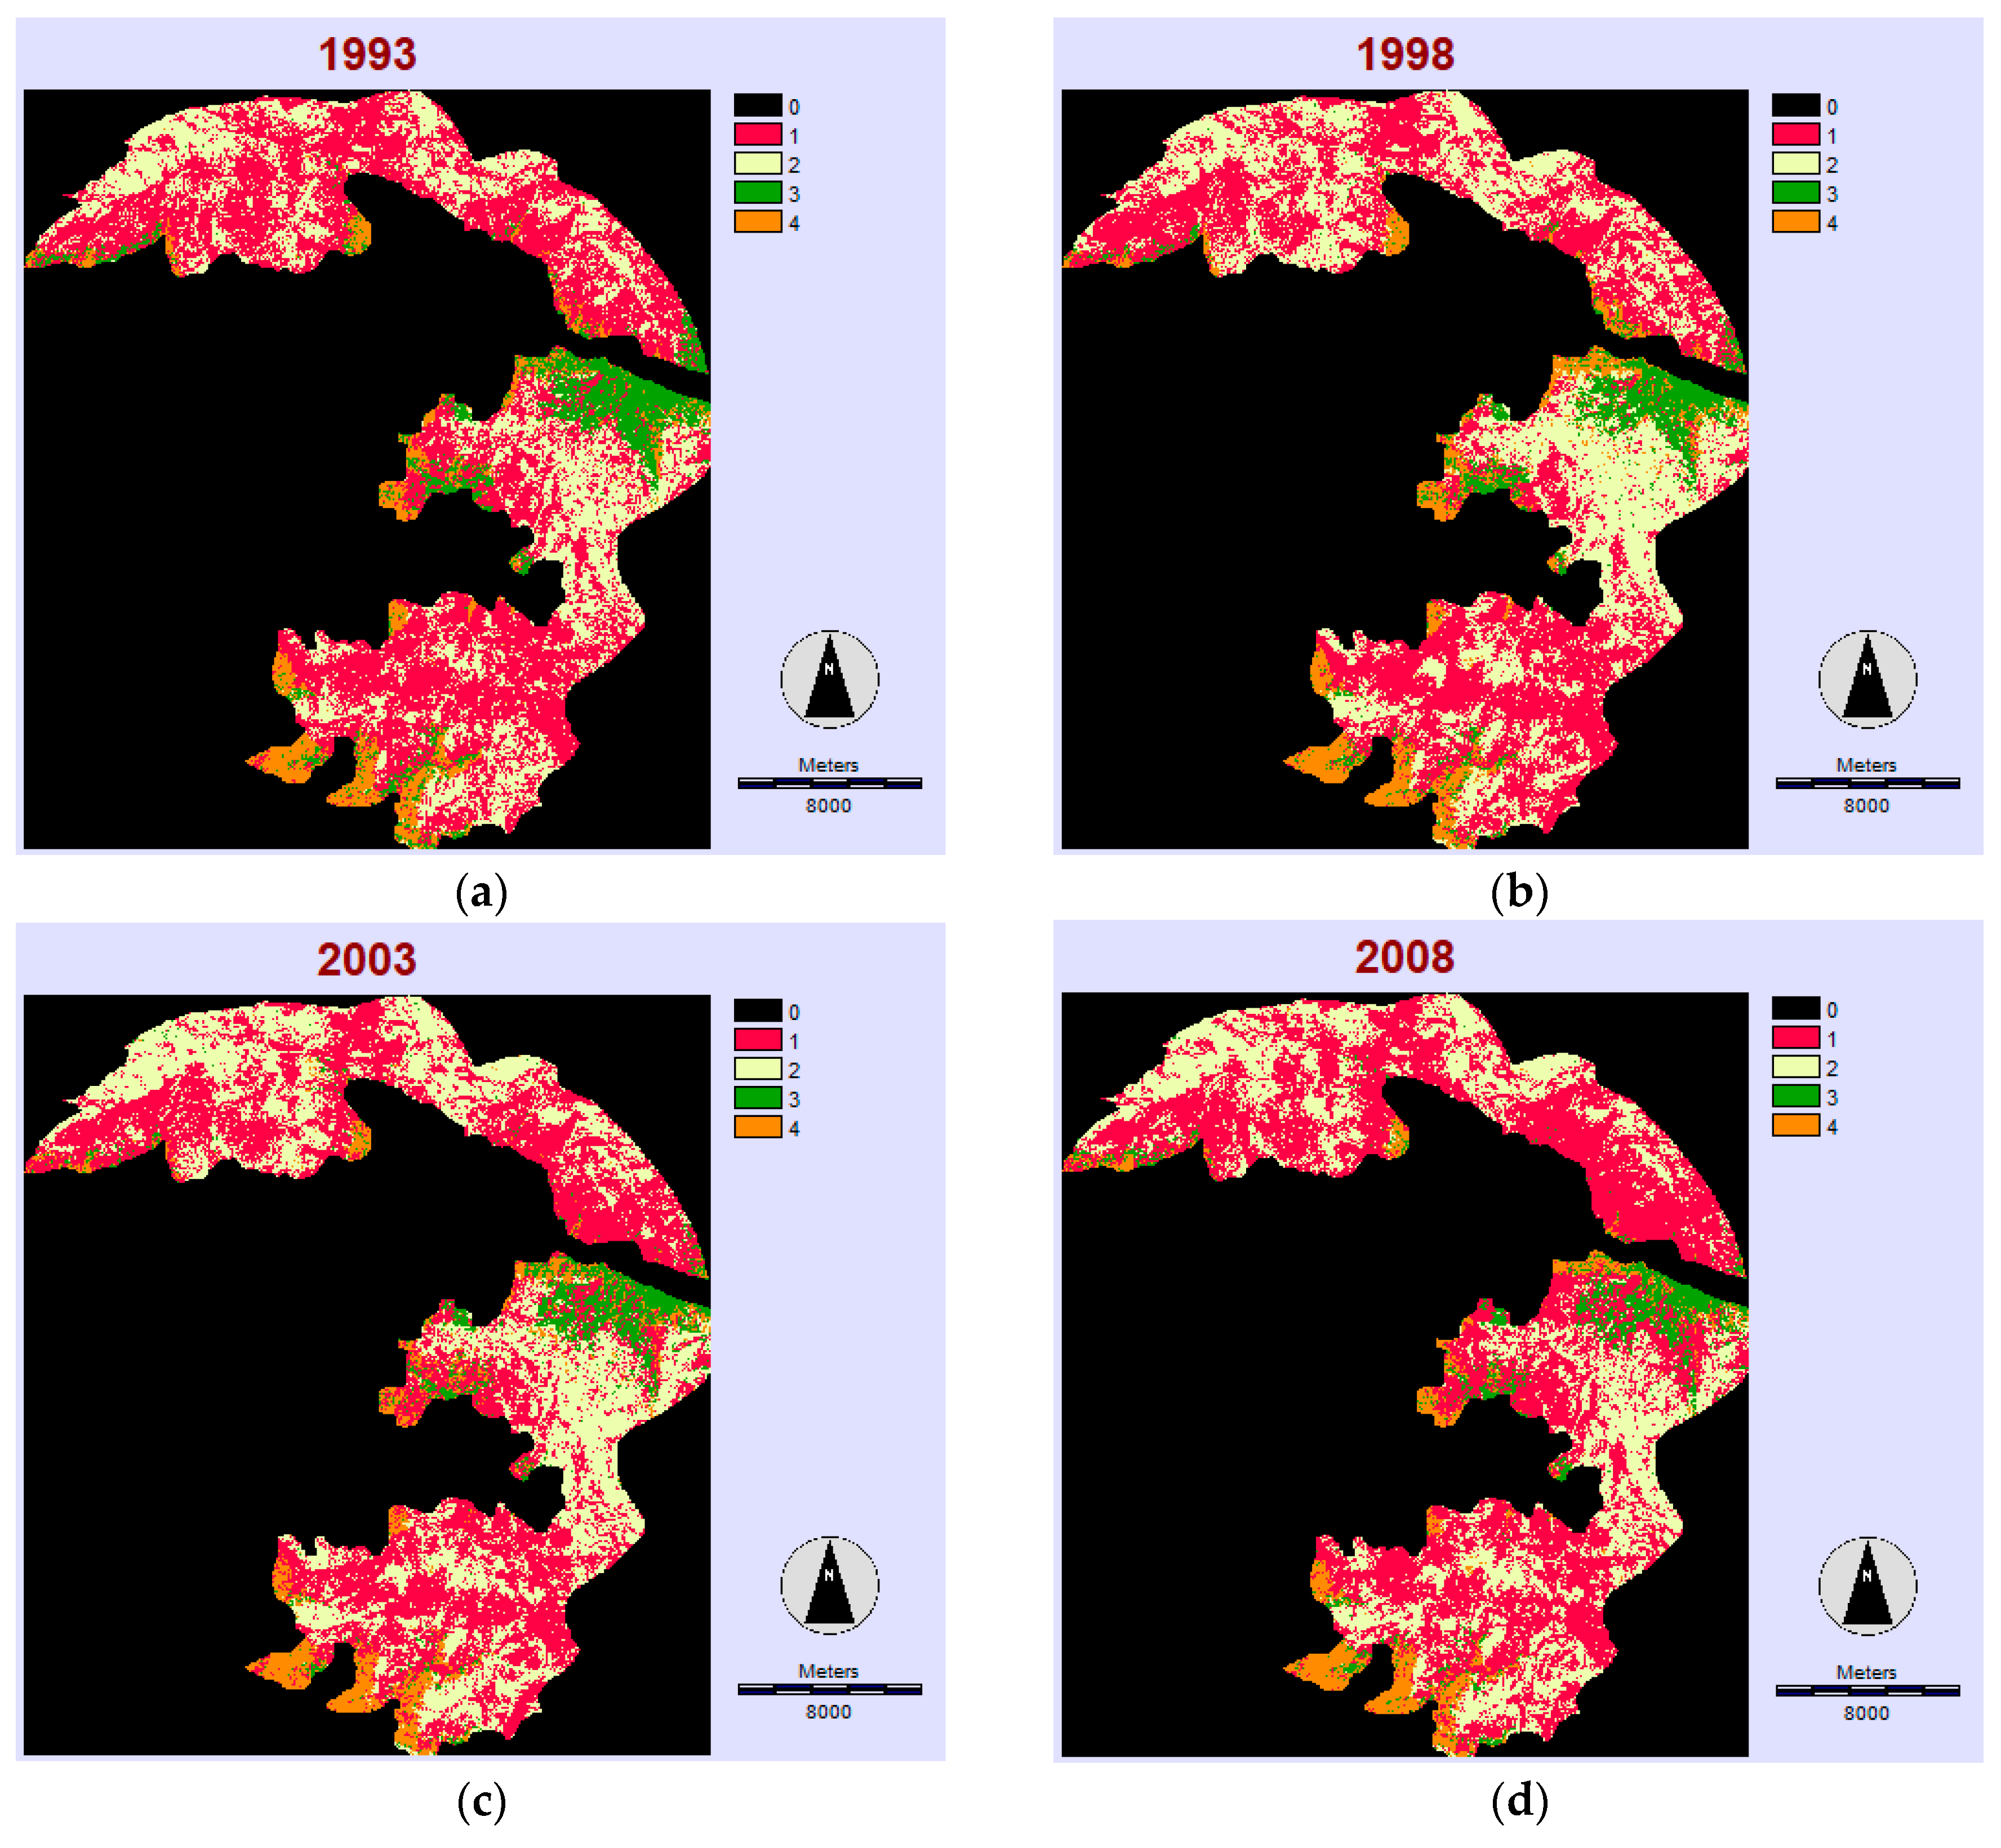
Figure 2.
Land use/land cover distribution maps of HSCZ from classification using the random forest package in R with all spectral bands, elevation, slope, aspect and NDVI band input and training data for each class of Landsat images in five different periods: (a) 1993 (TM 5); (b) 1998 (TM 5); (c) 2003 (TM 5); (d) 2008 (TM 5) and (e) 2017 (OLI 8).
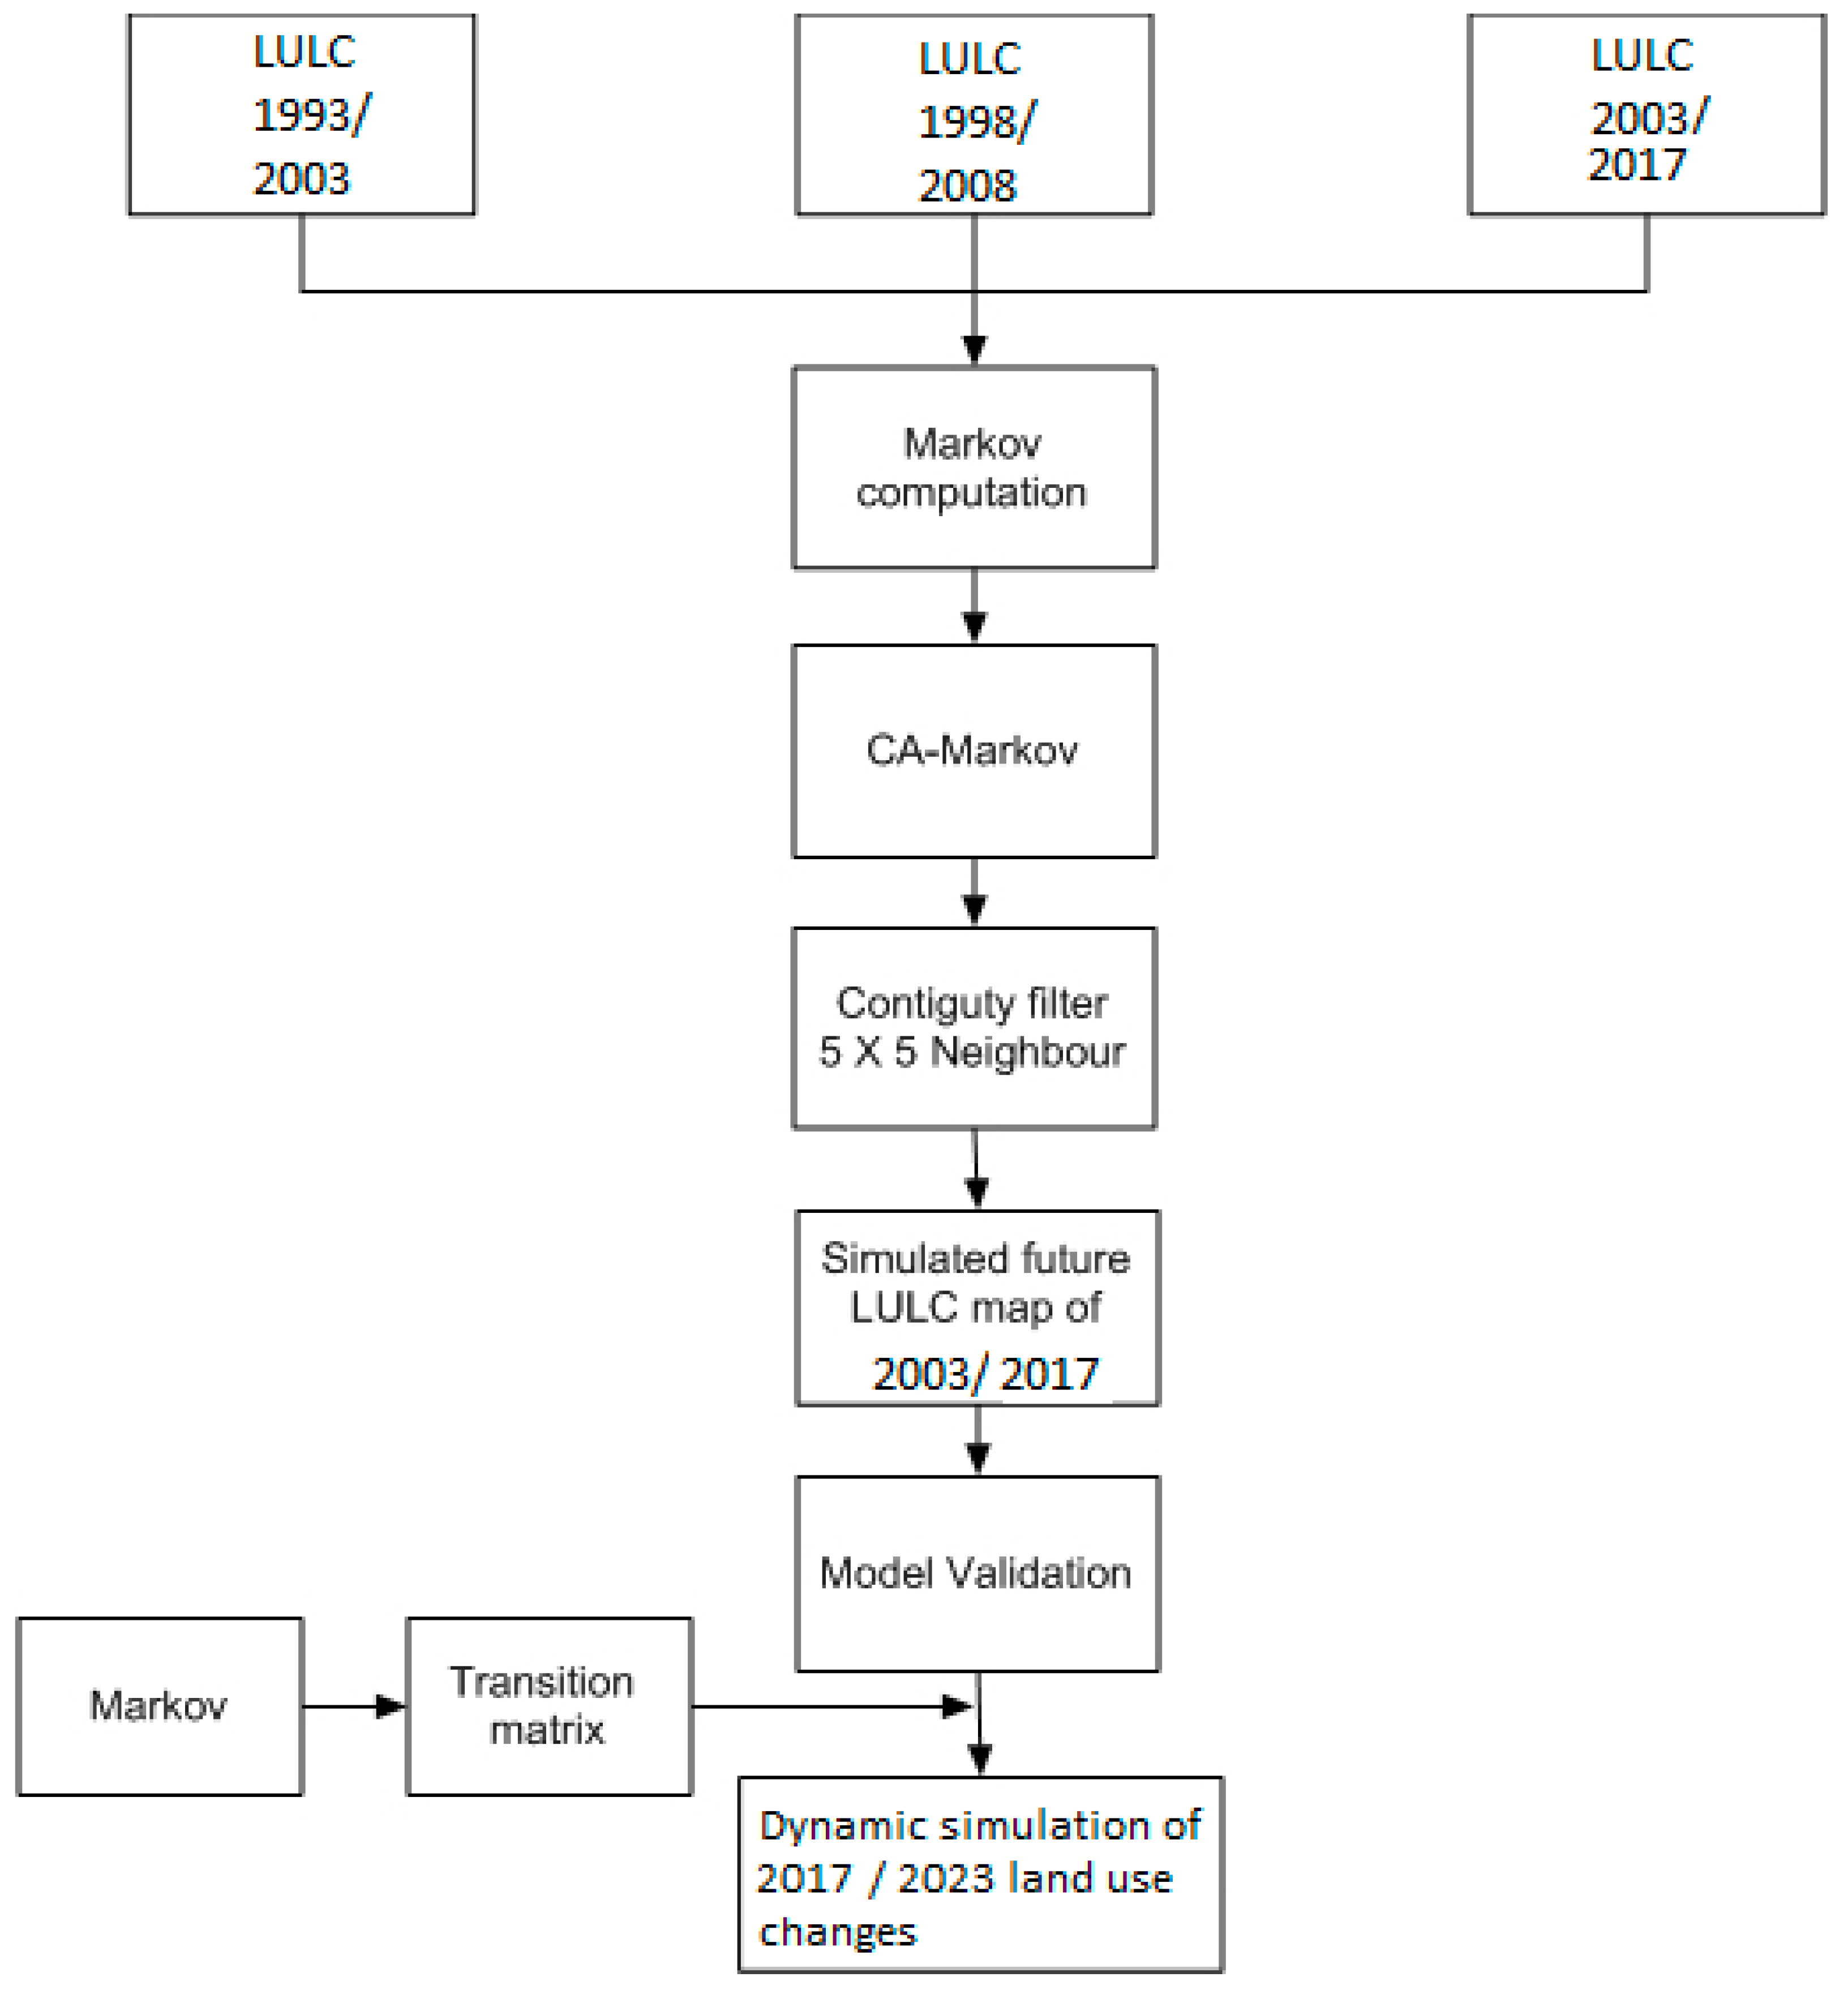
Figure 3.
Flowchart of the methodology implemented for first and second scenarios.
Figure 3.
Flowchart of the methodology implemented for first and second scenarios.
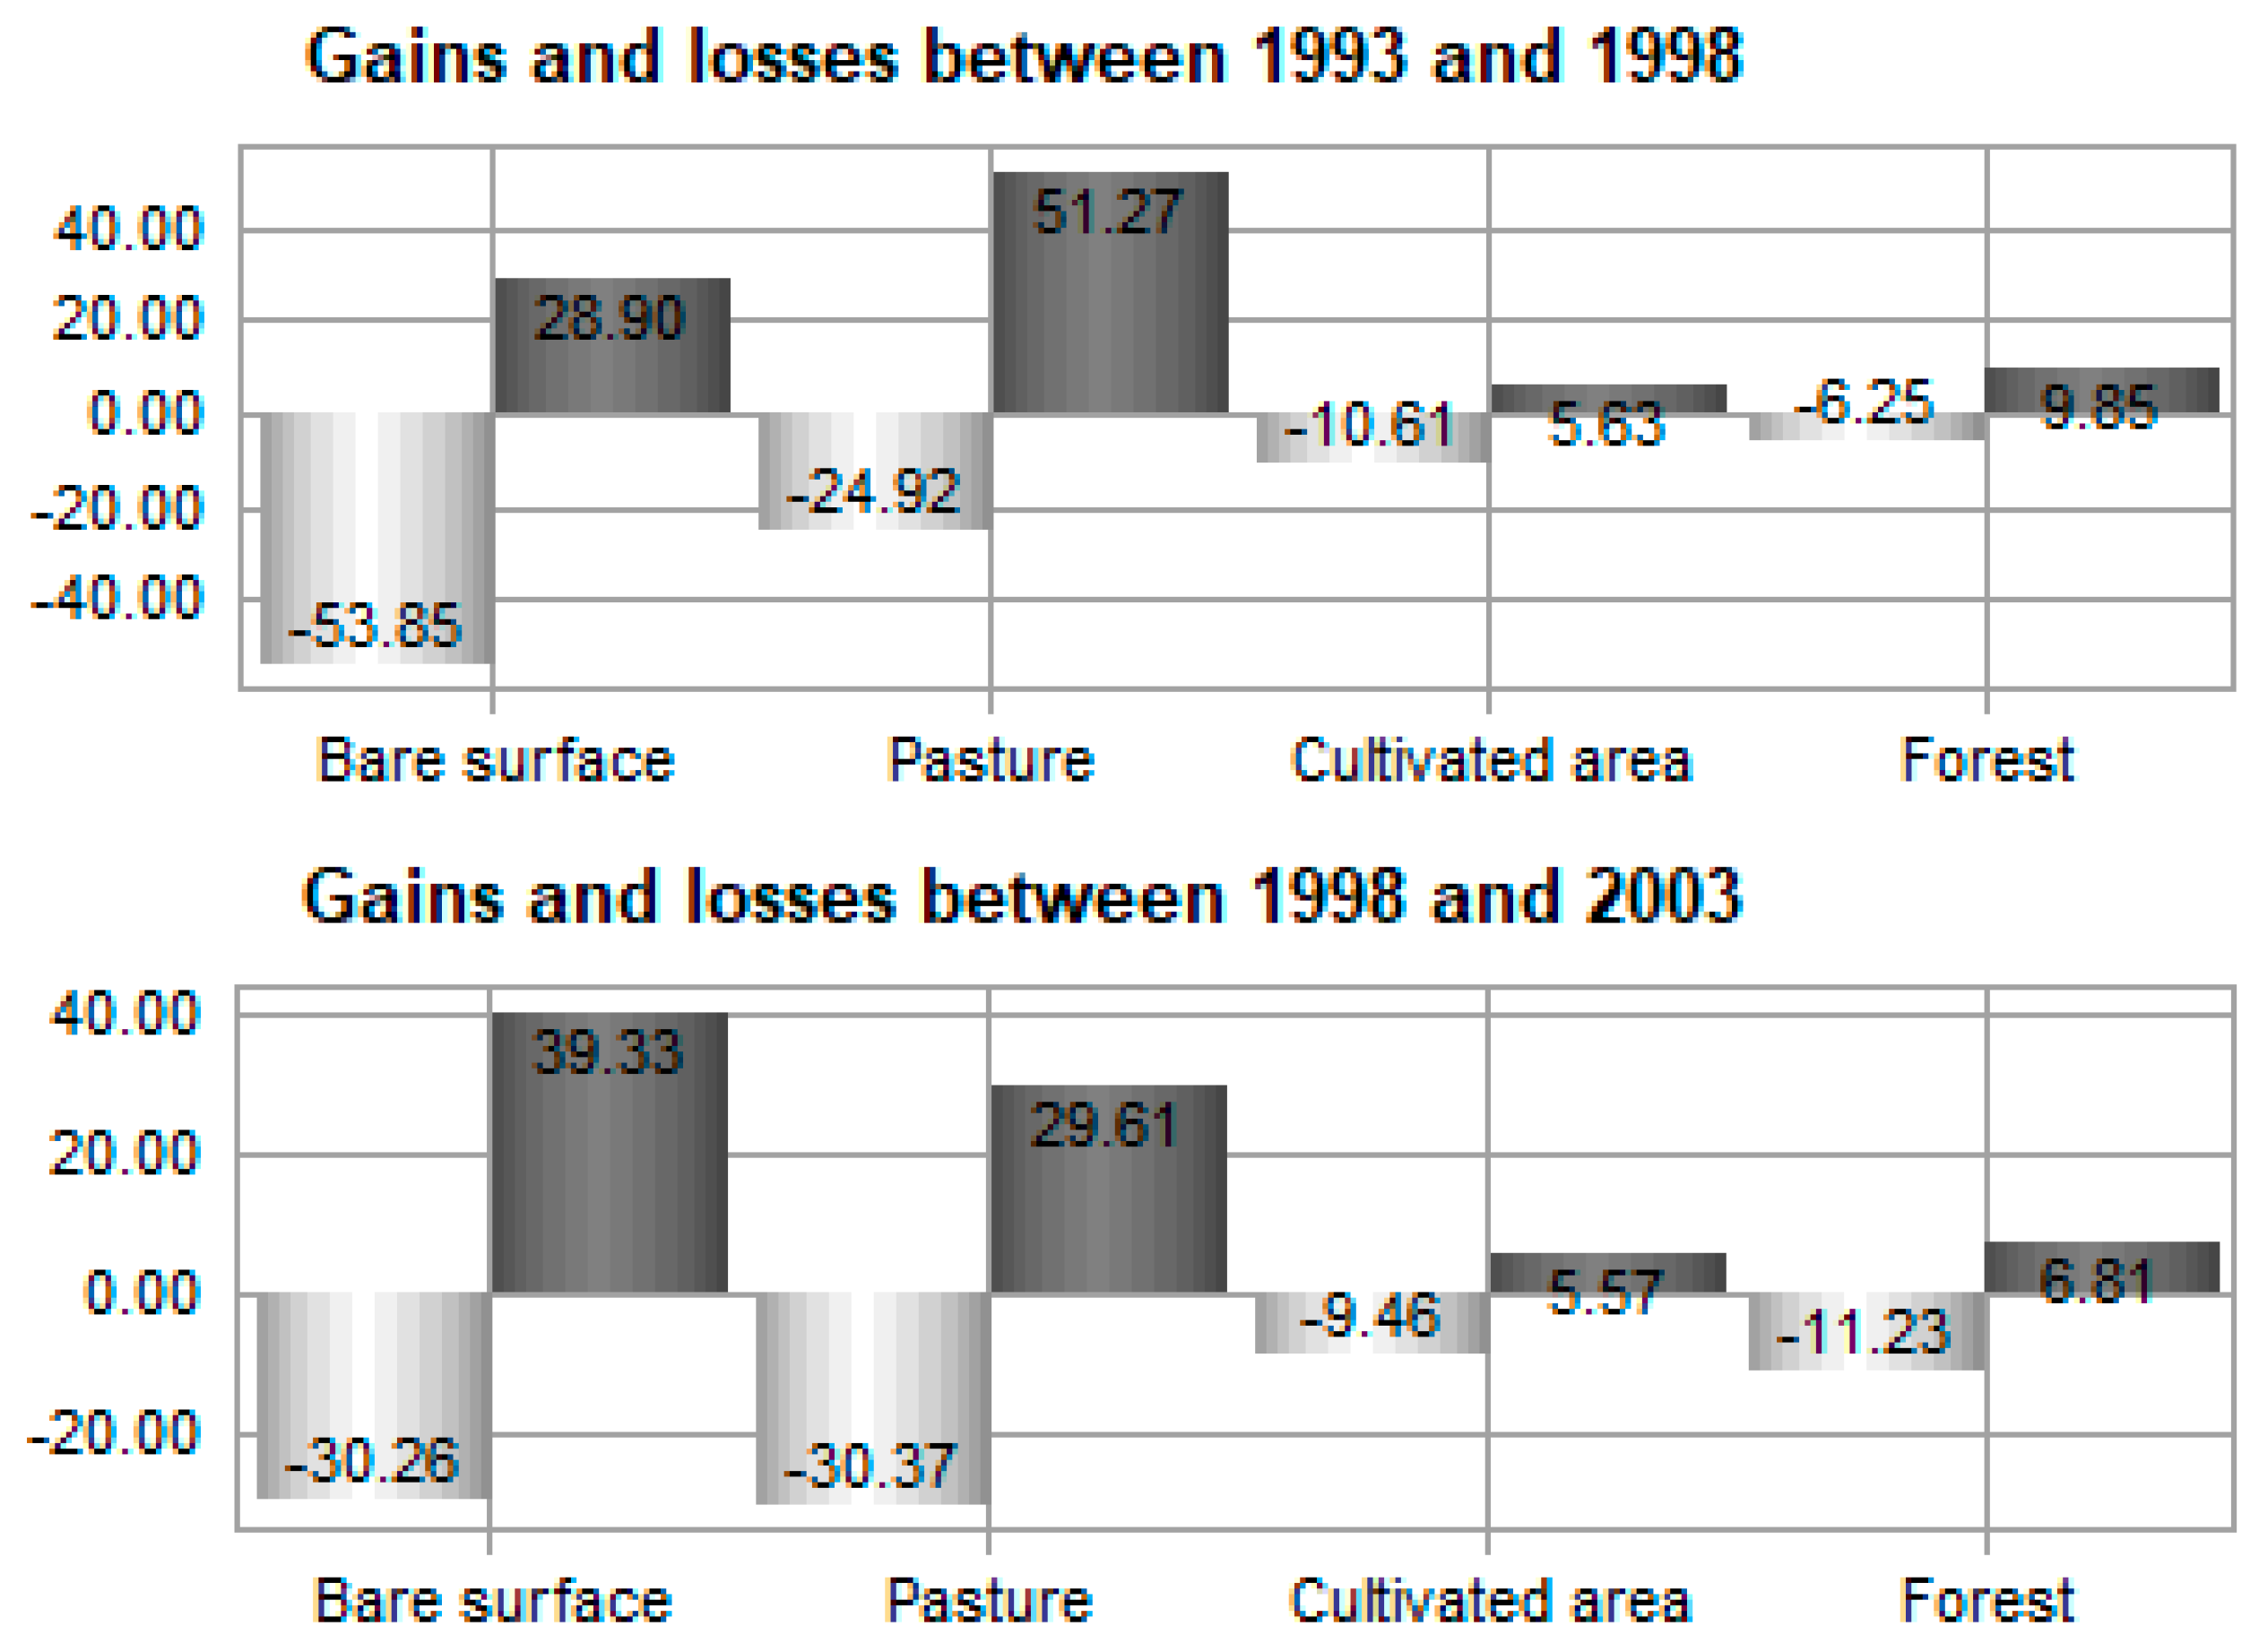
Figure 4.
Gains and losses in km2 of LULC by category in different time periods. Dark and light grey are indication of gain and loss respectively.
Figure 4.
Gains and losses in km2 of LULC by category in different time periods. Dark and light grey are indication of gain and loss respectively.
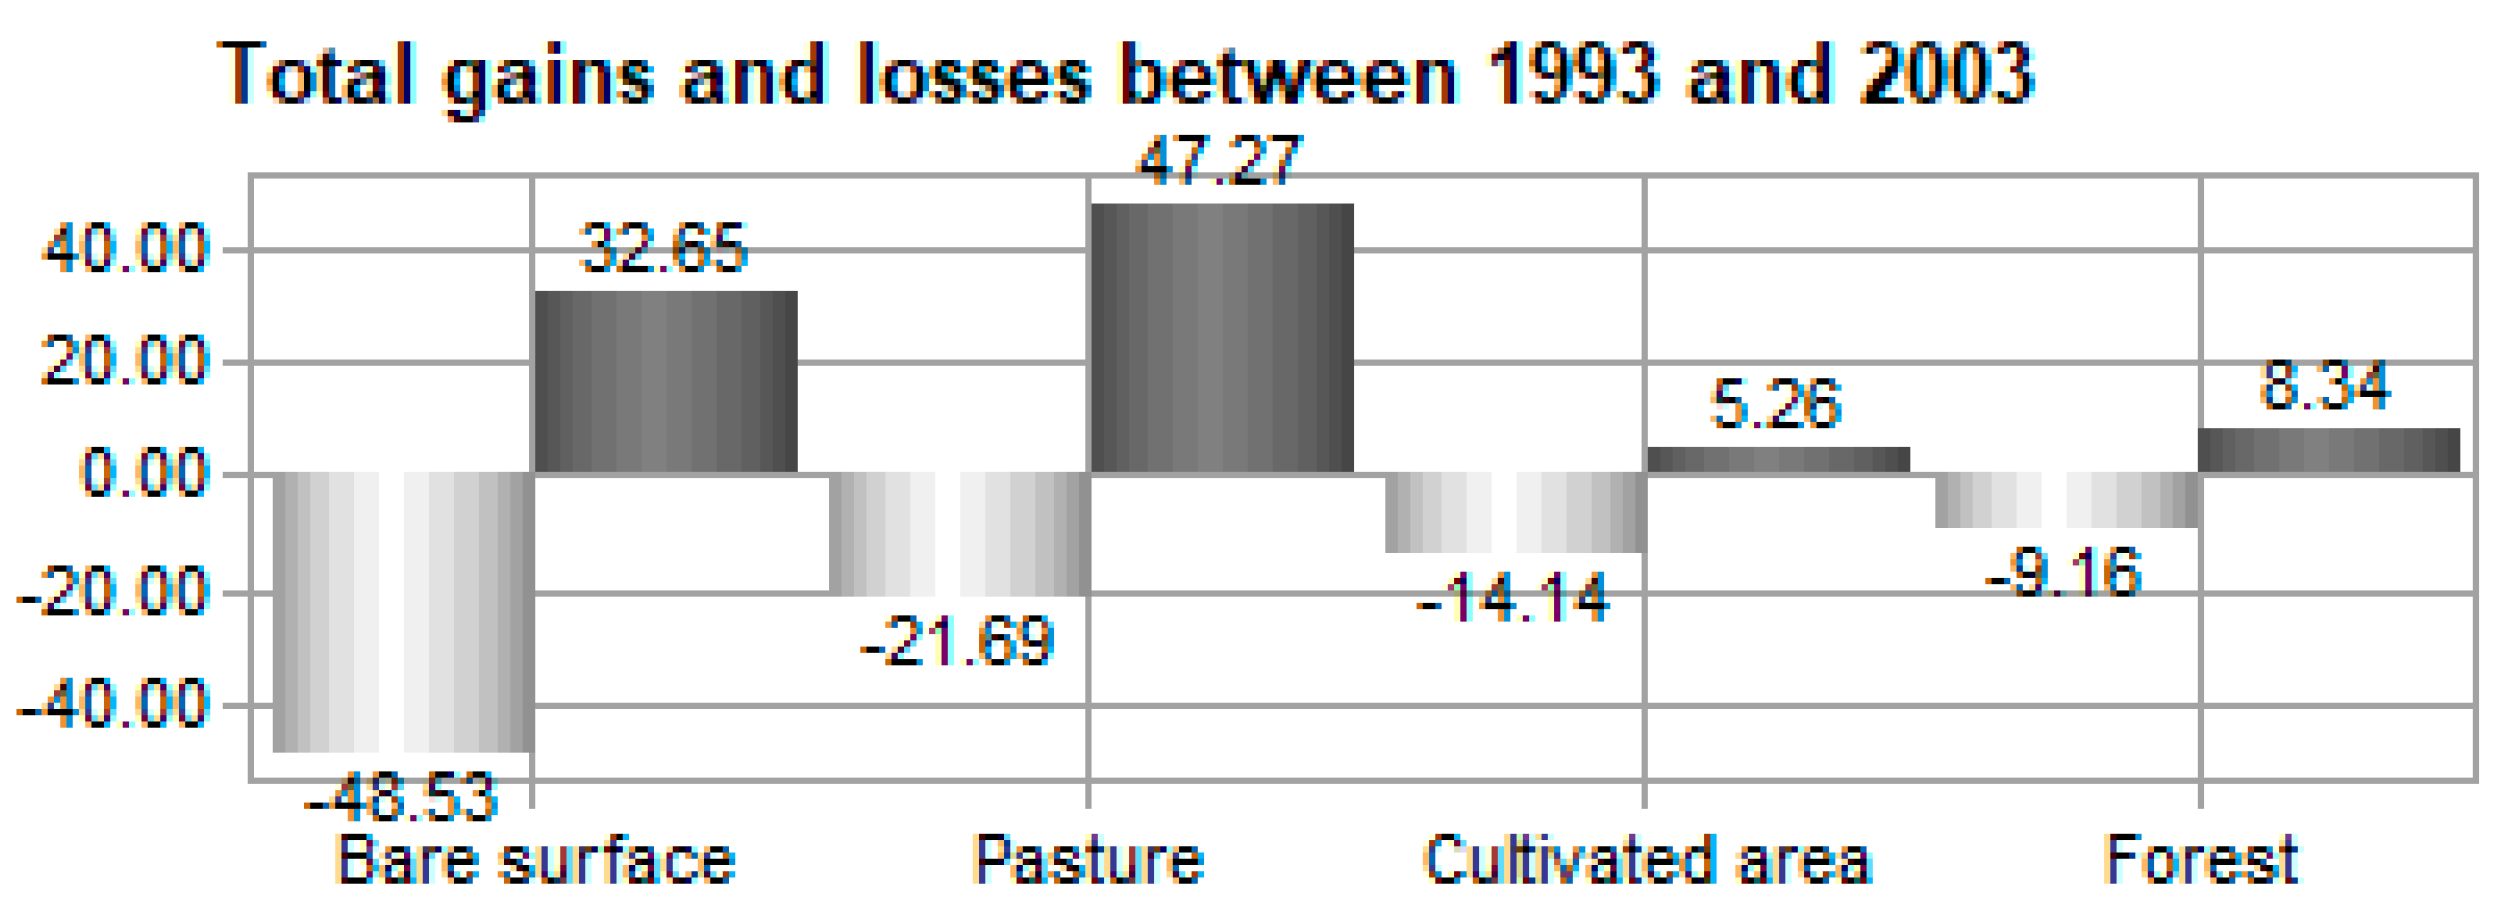
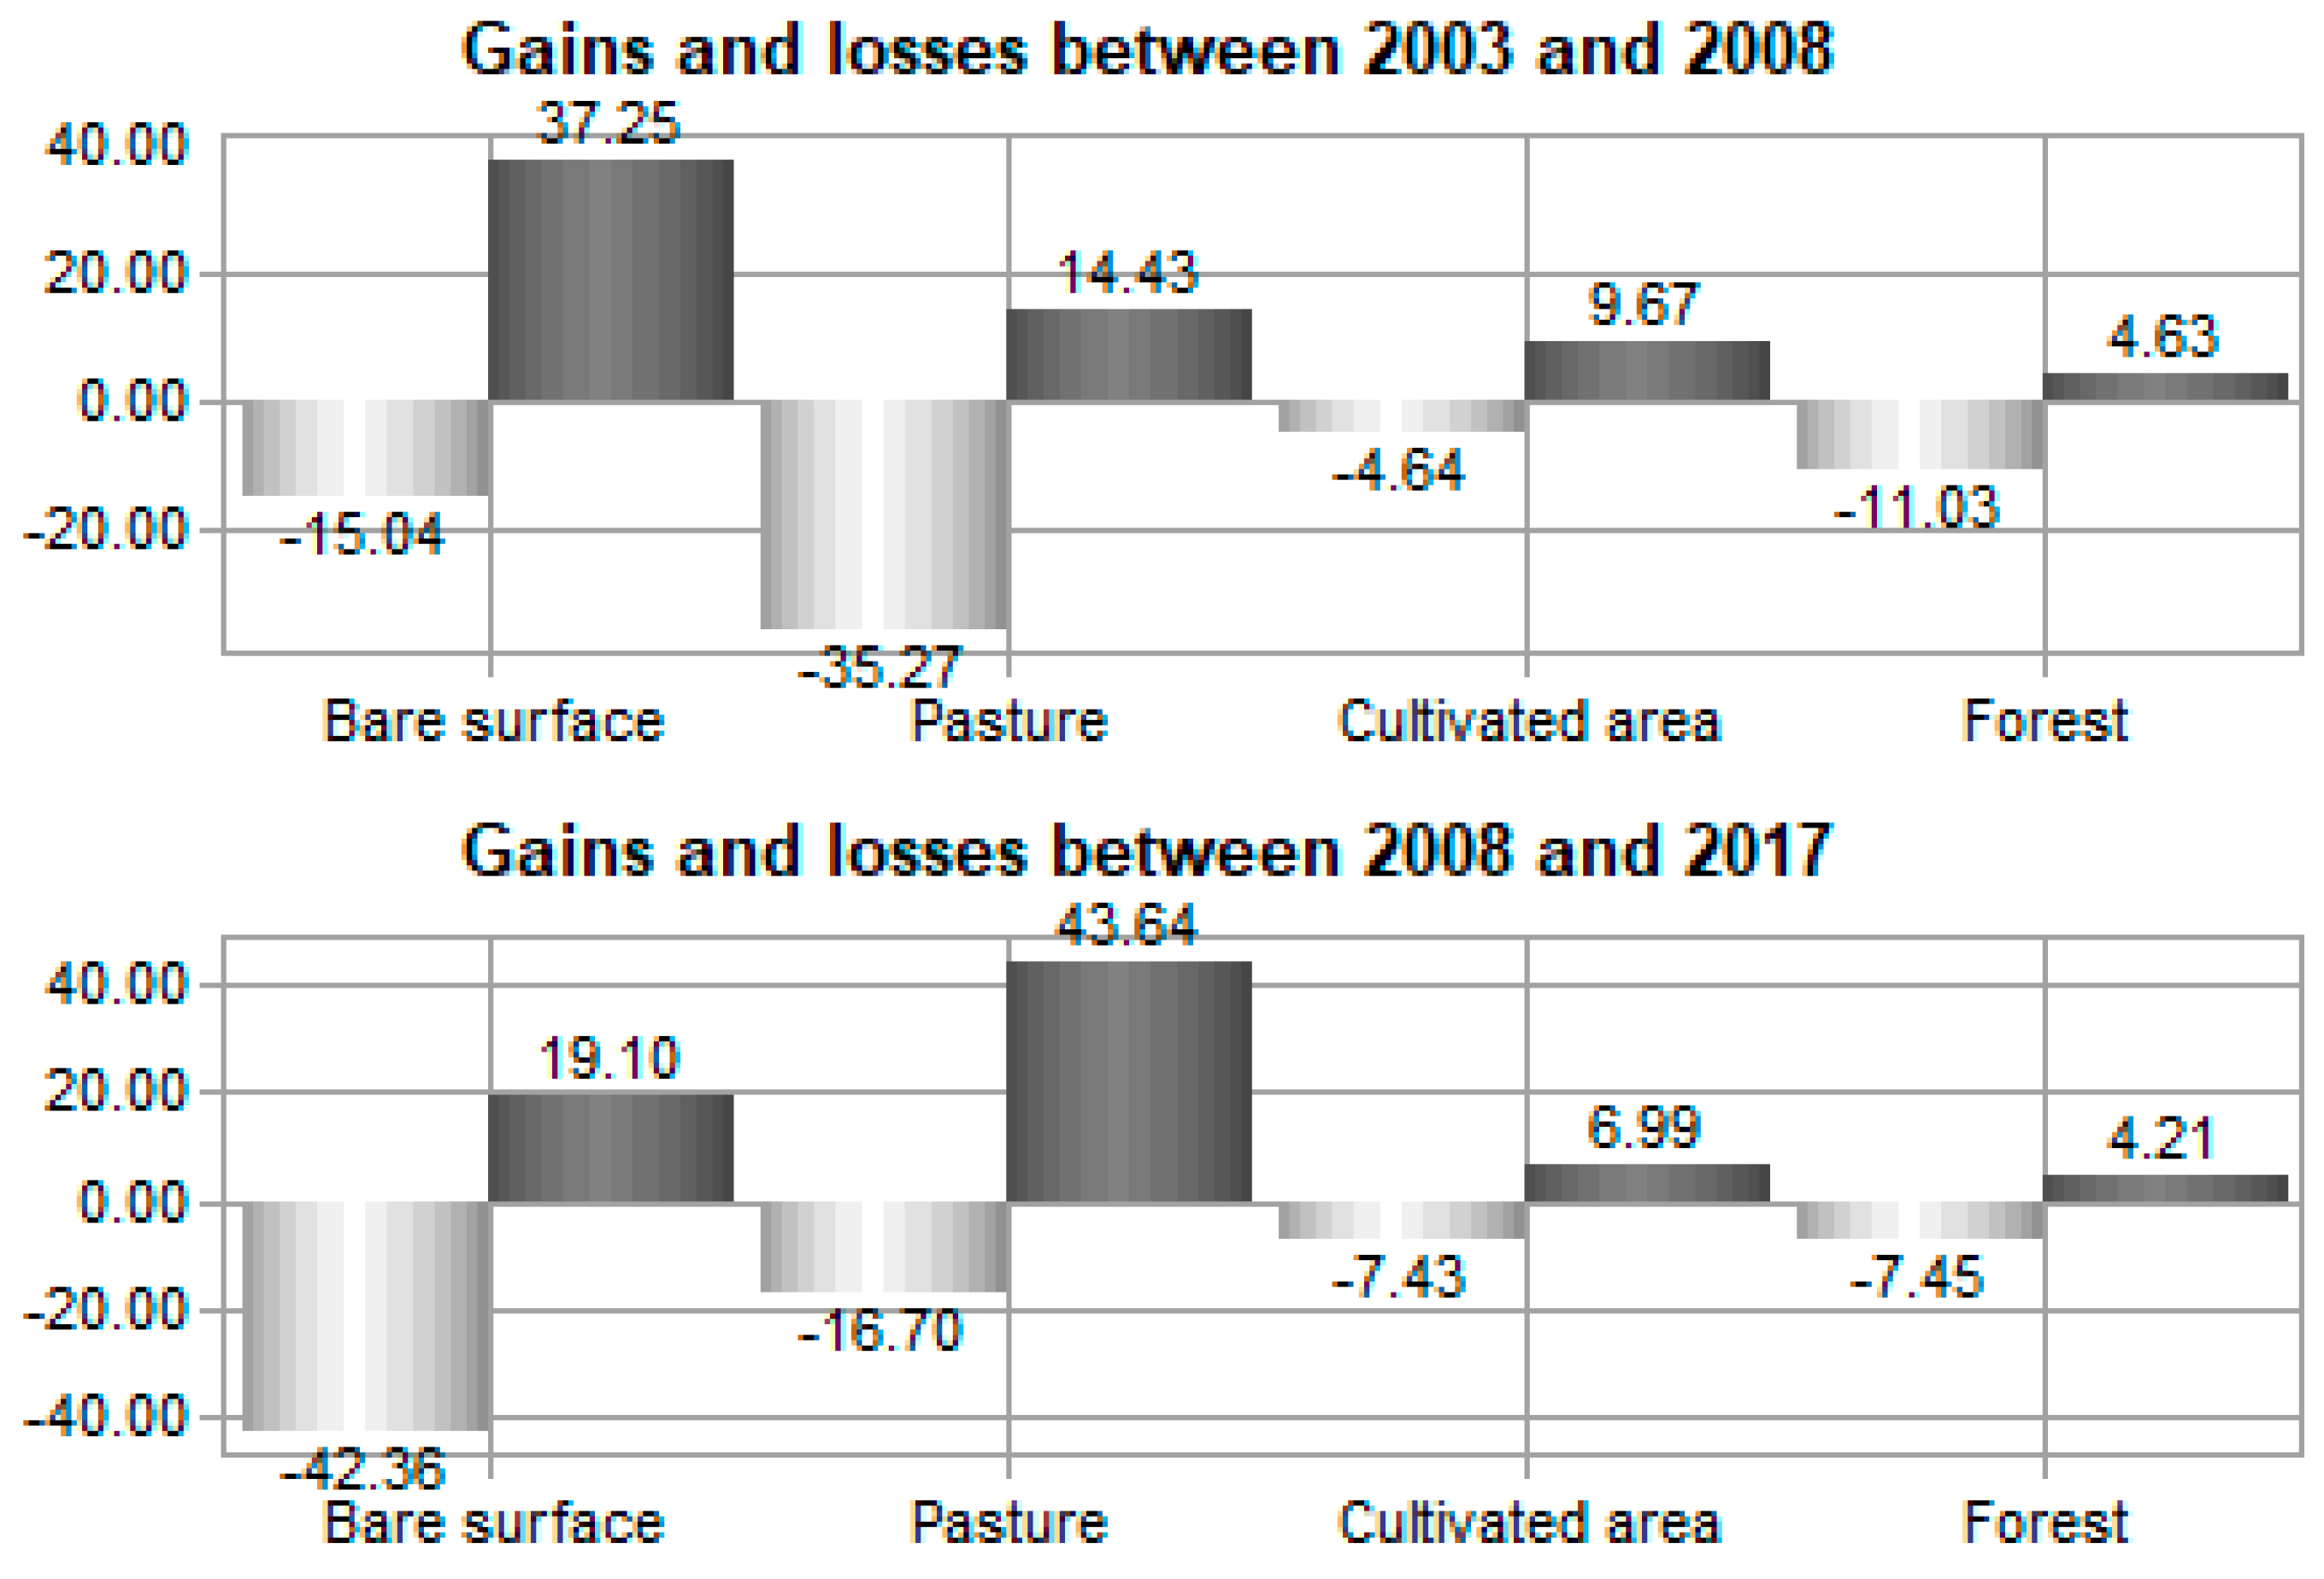
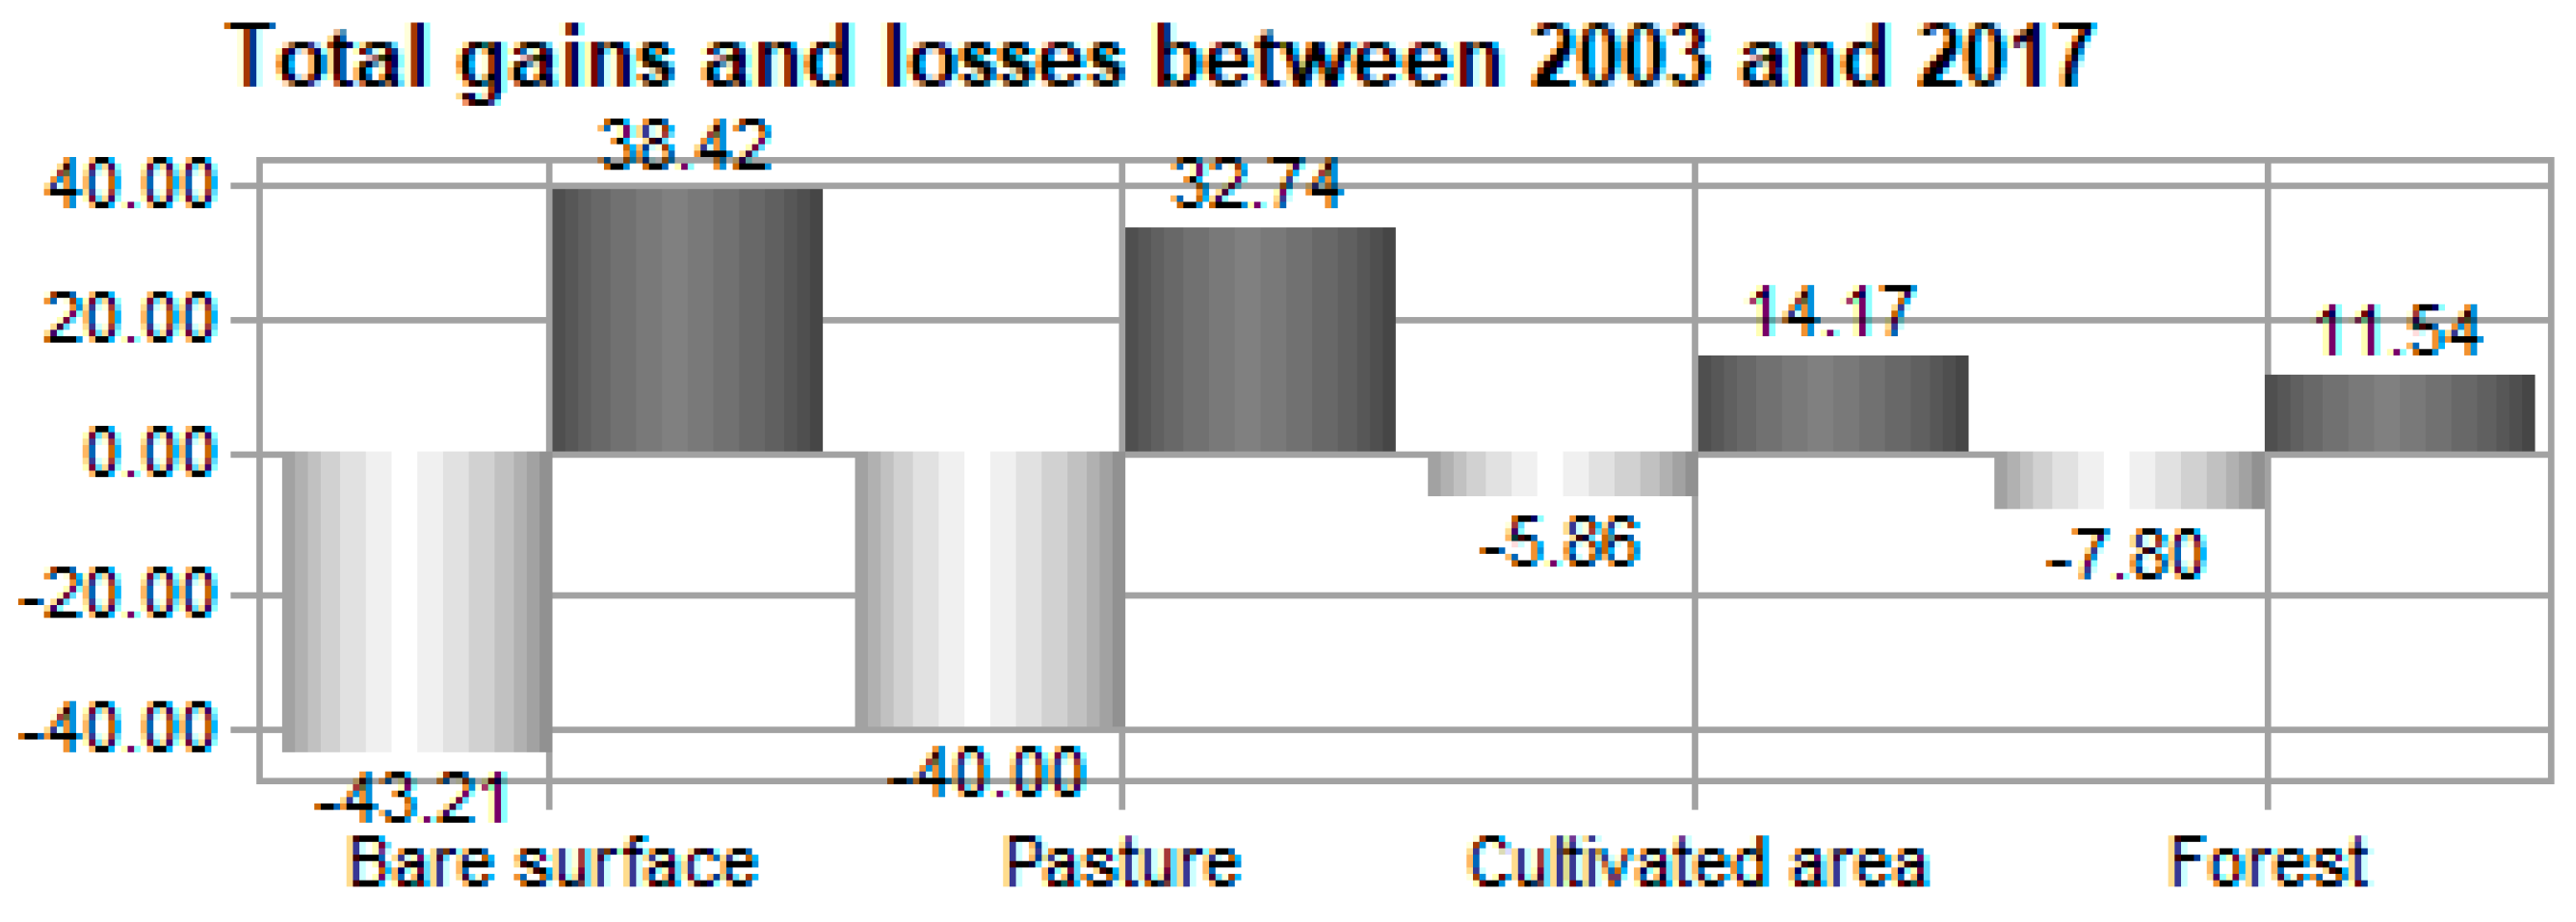
Figure 5.
Gains and losses in km2 of LULC by category in different time periods. Dark and light grey are indication of gain and loss respectively.
Figure 5.
Gains and losses in km2 of LULC by category in different time periods. Dark and light grey are indication of gain and loss respectively.
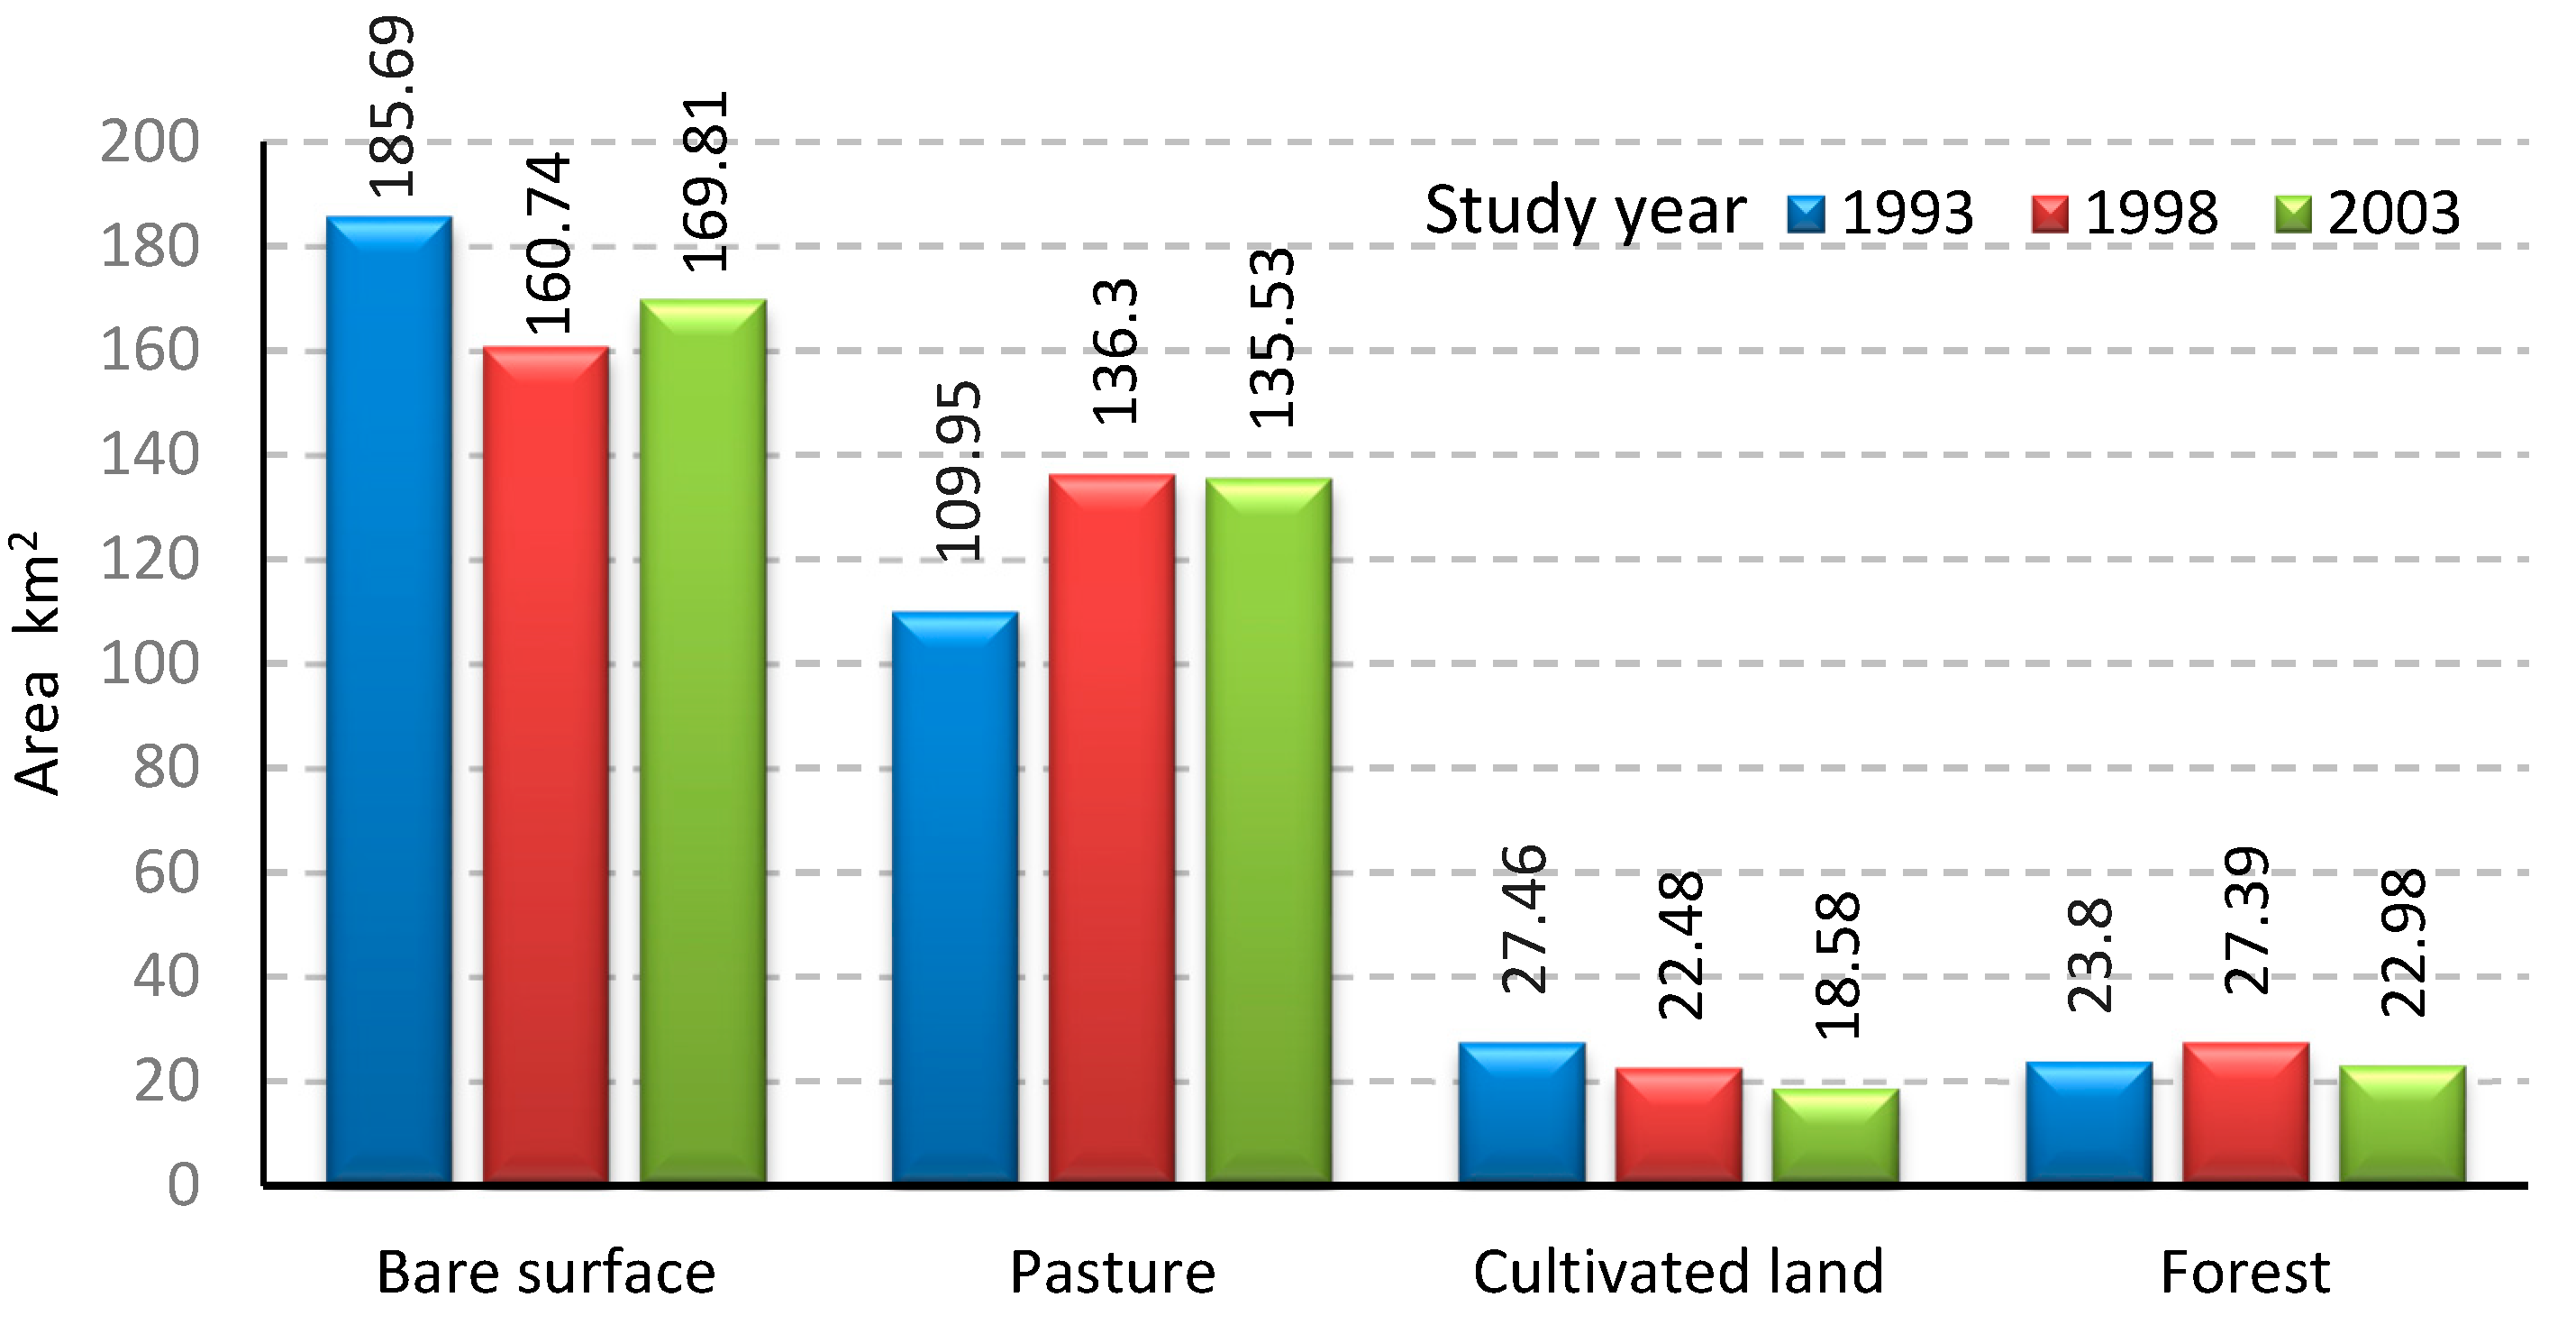
Figure 6.
Area Statistics of Actual LULC classes for the years 1993, 1998 and 2003 in square kilometres.
Figure 6.
Area Statistics of Actual LULC classes for the years 1993, 1998 and 2003 in square kilometres.
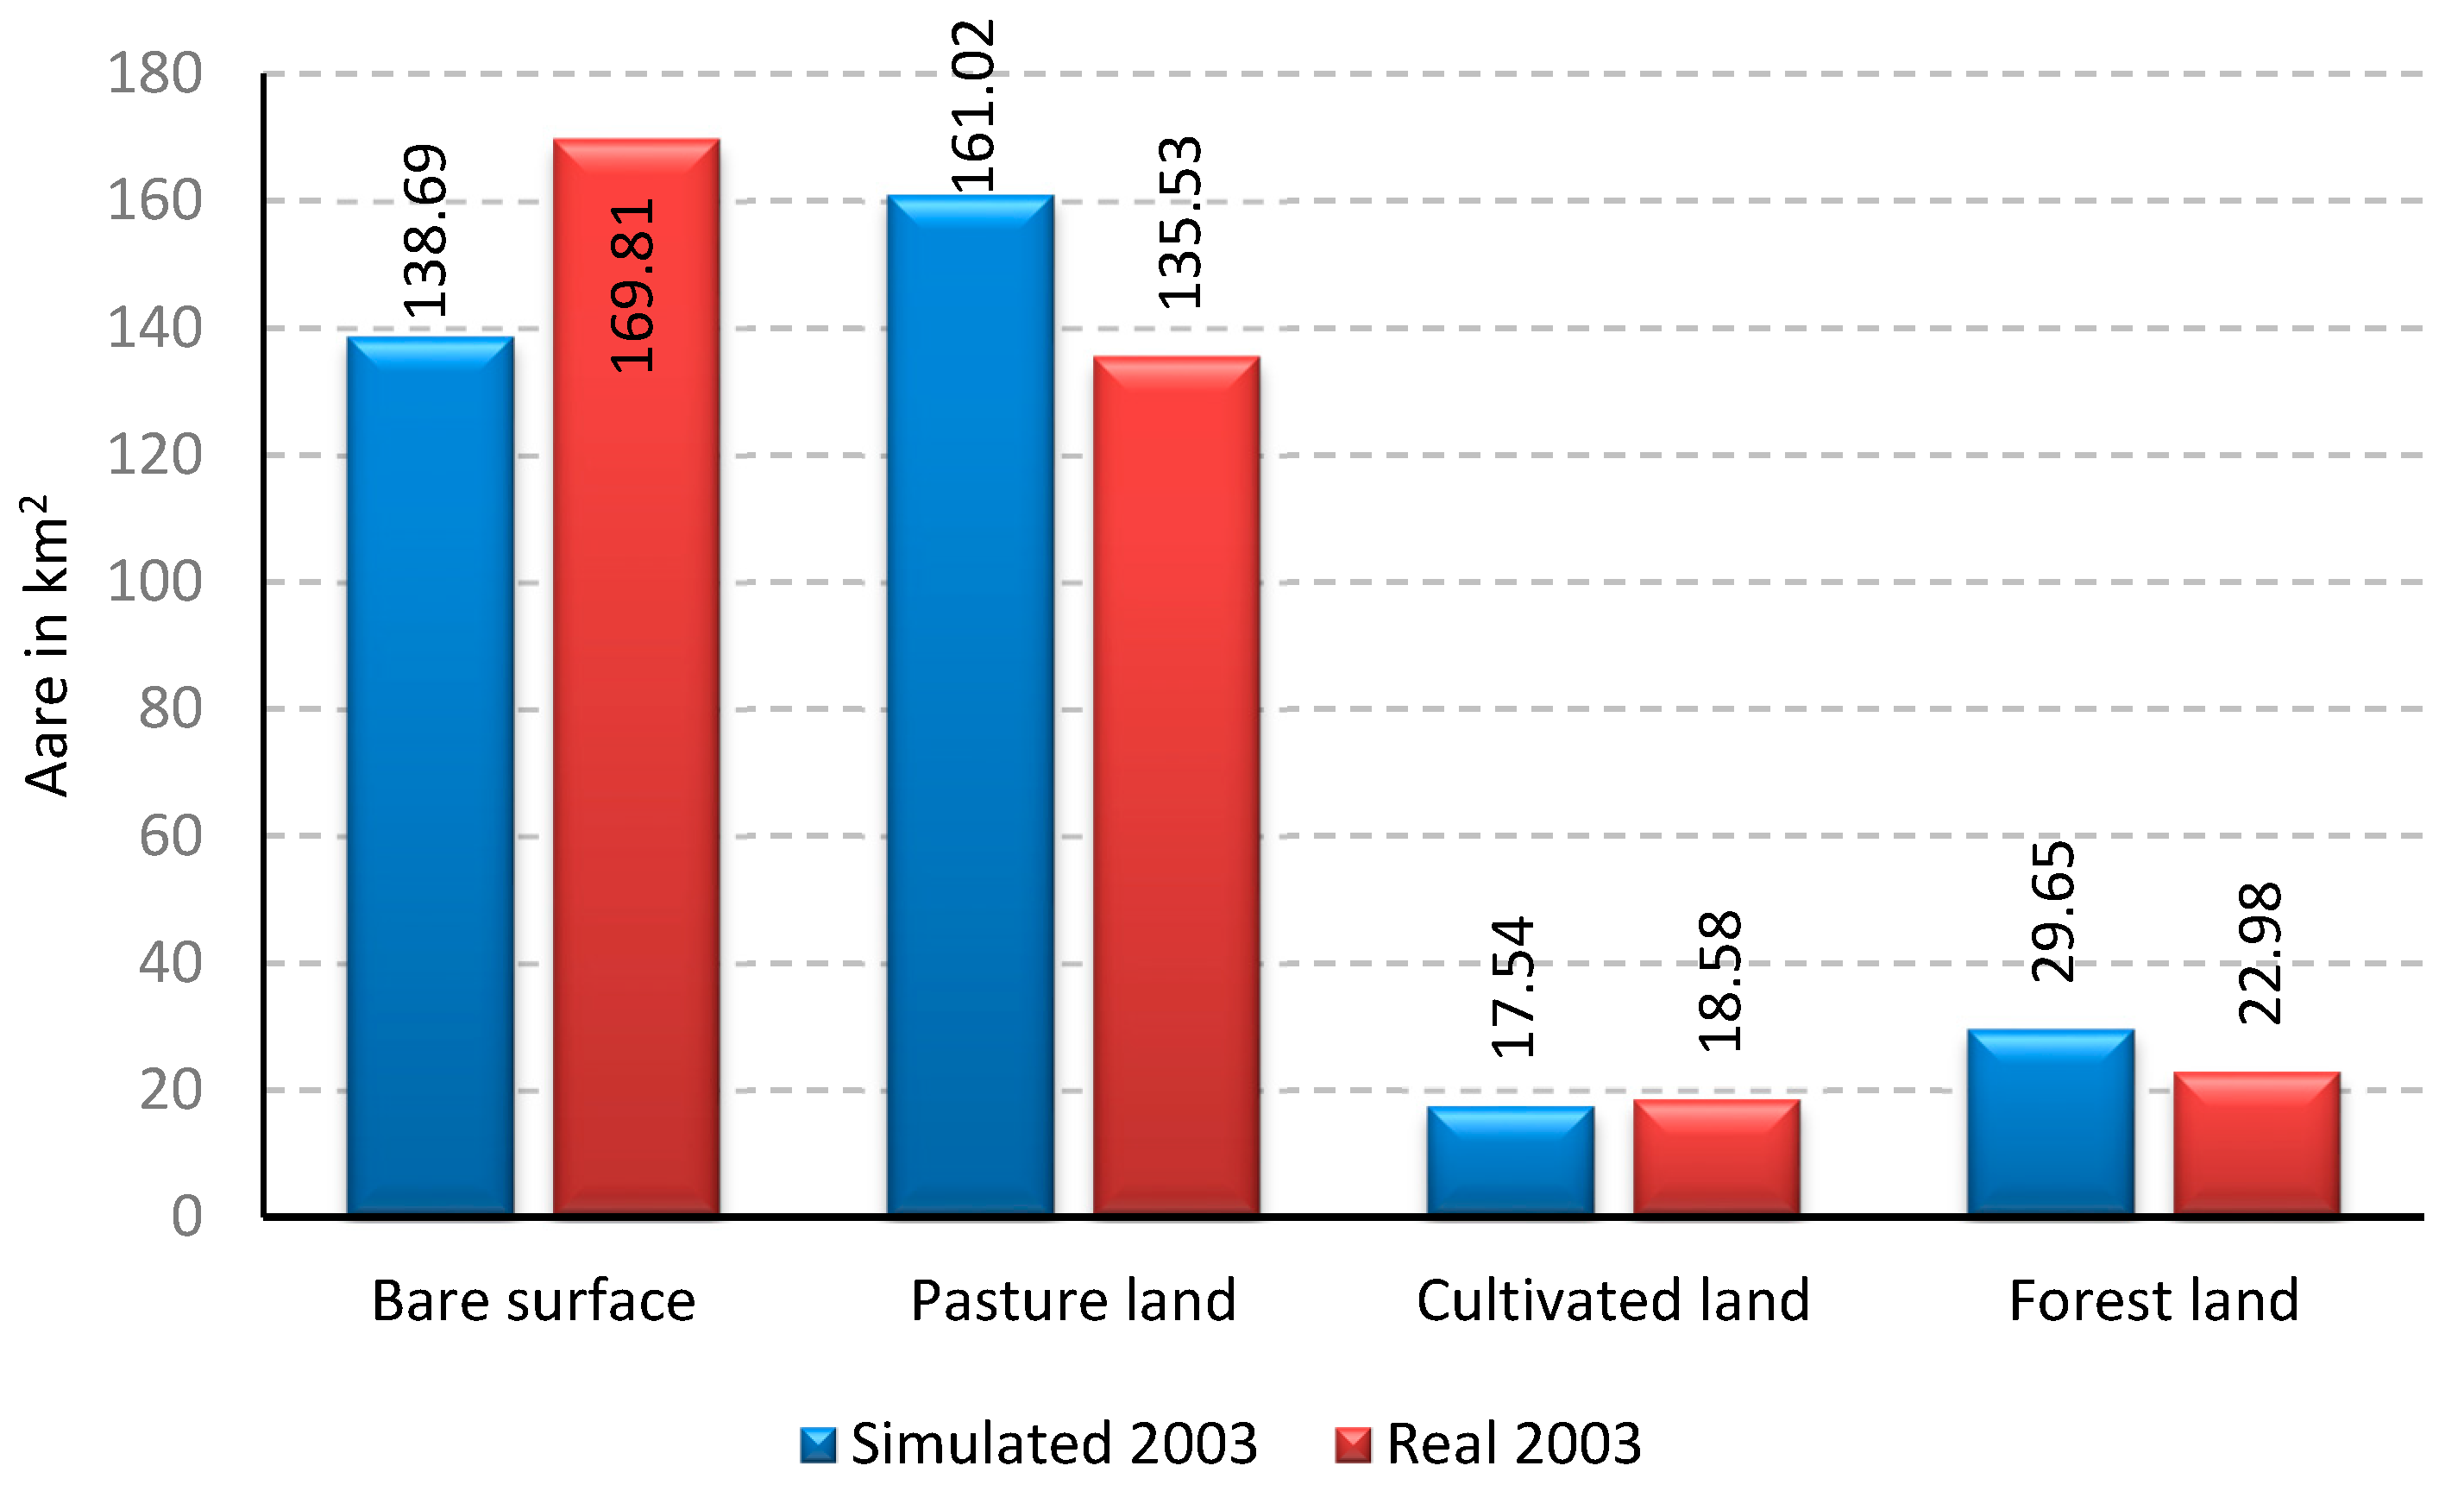
Figure 7.
The comparison between simulated map (blue colour) and real map (red colour) in square kilometres of 2003 in HSCZ.
Figure 7.
The comparison between simulated map (blue colour) and real map (red colour) in square kilometres of 2003 in HSCZ.
Figure 8.
Projected land cover under sanctions, first scenario for 2023 of HSCZ.
Figure 8.
Projected land cover under sanctions, first scenario for 2023 of HSCZ.
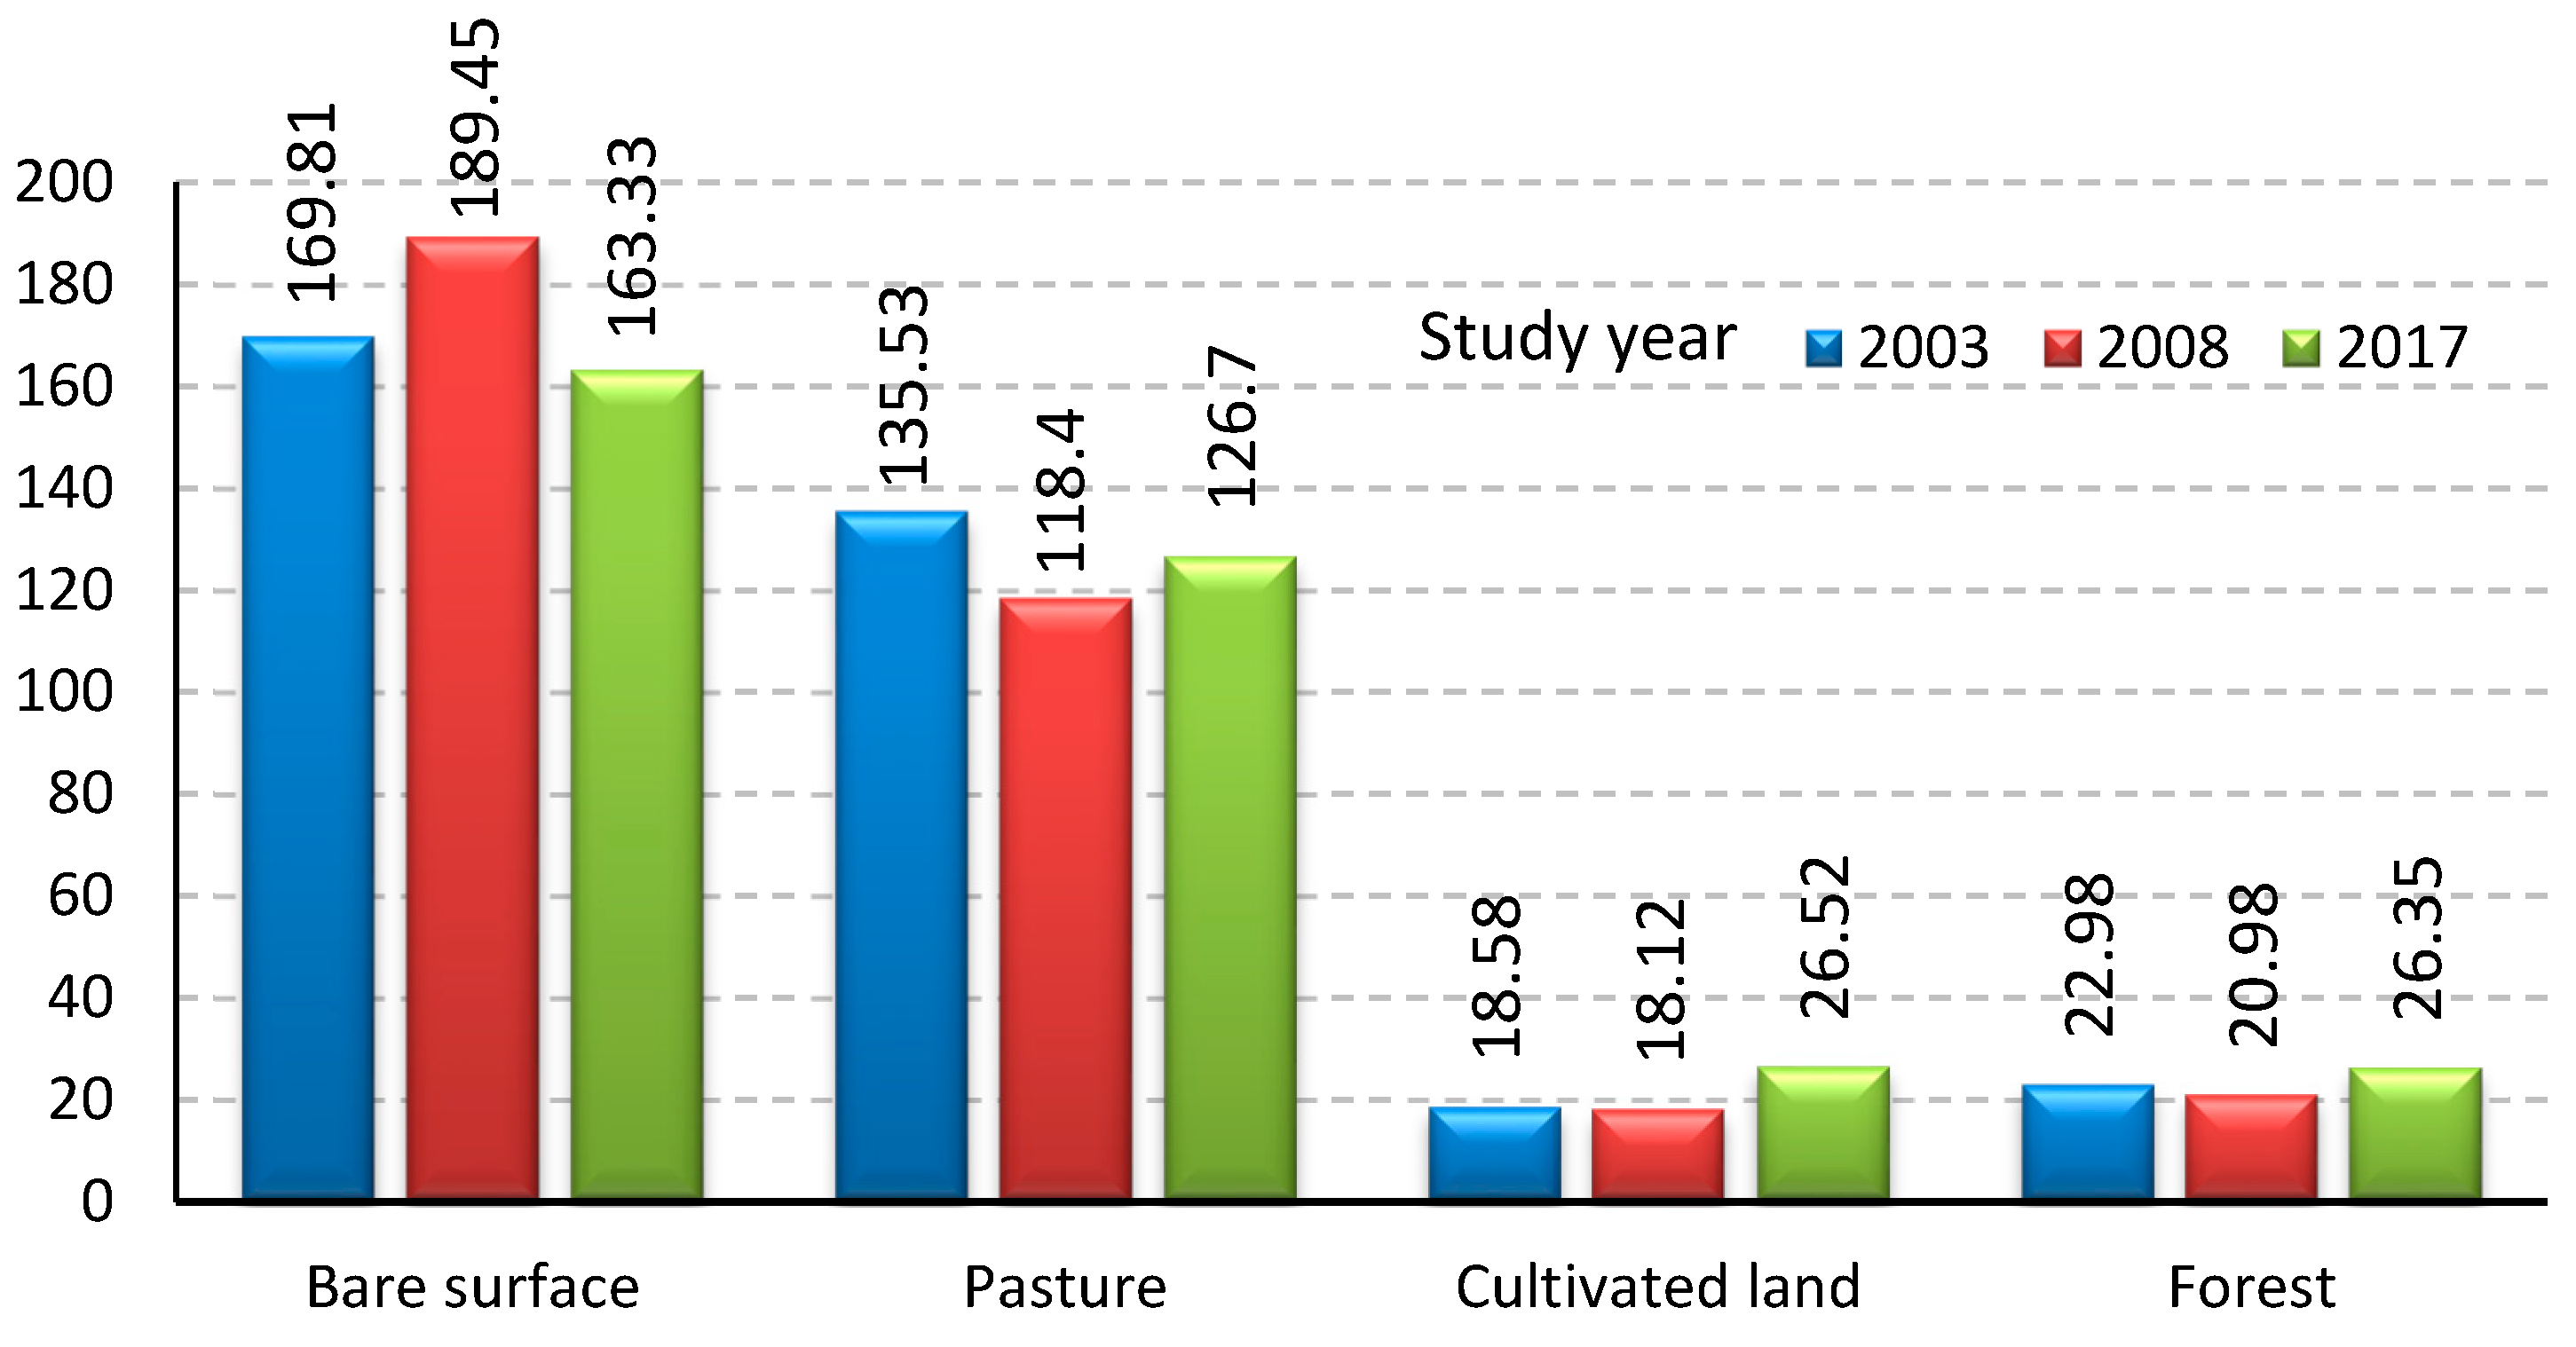
Figure 9.
Area Statistics of Actual LULC classes (second scenario) in square kilometres for the years 2003, 2008 and 2017.
Figure 9.
Area Statistics of Actual LULC classes (second scenario) in square kilometres for the years 2003, 2008 and 2017.
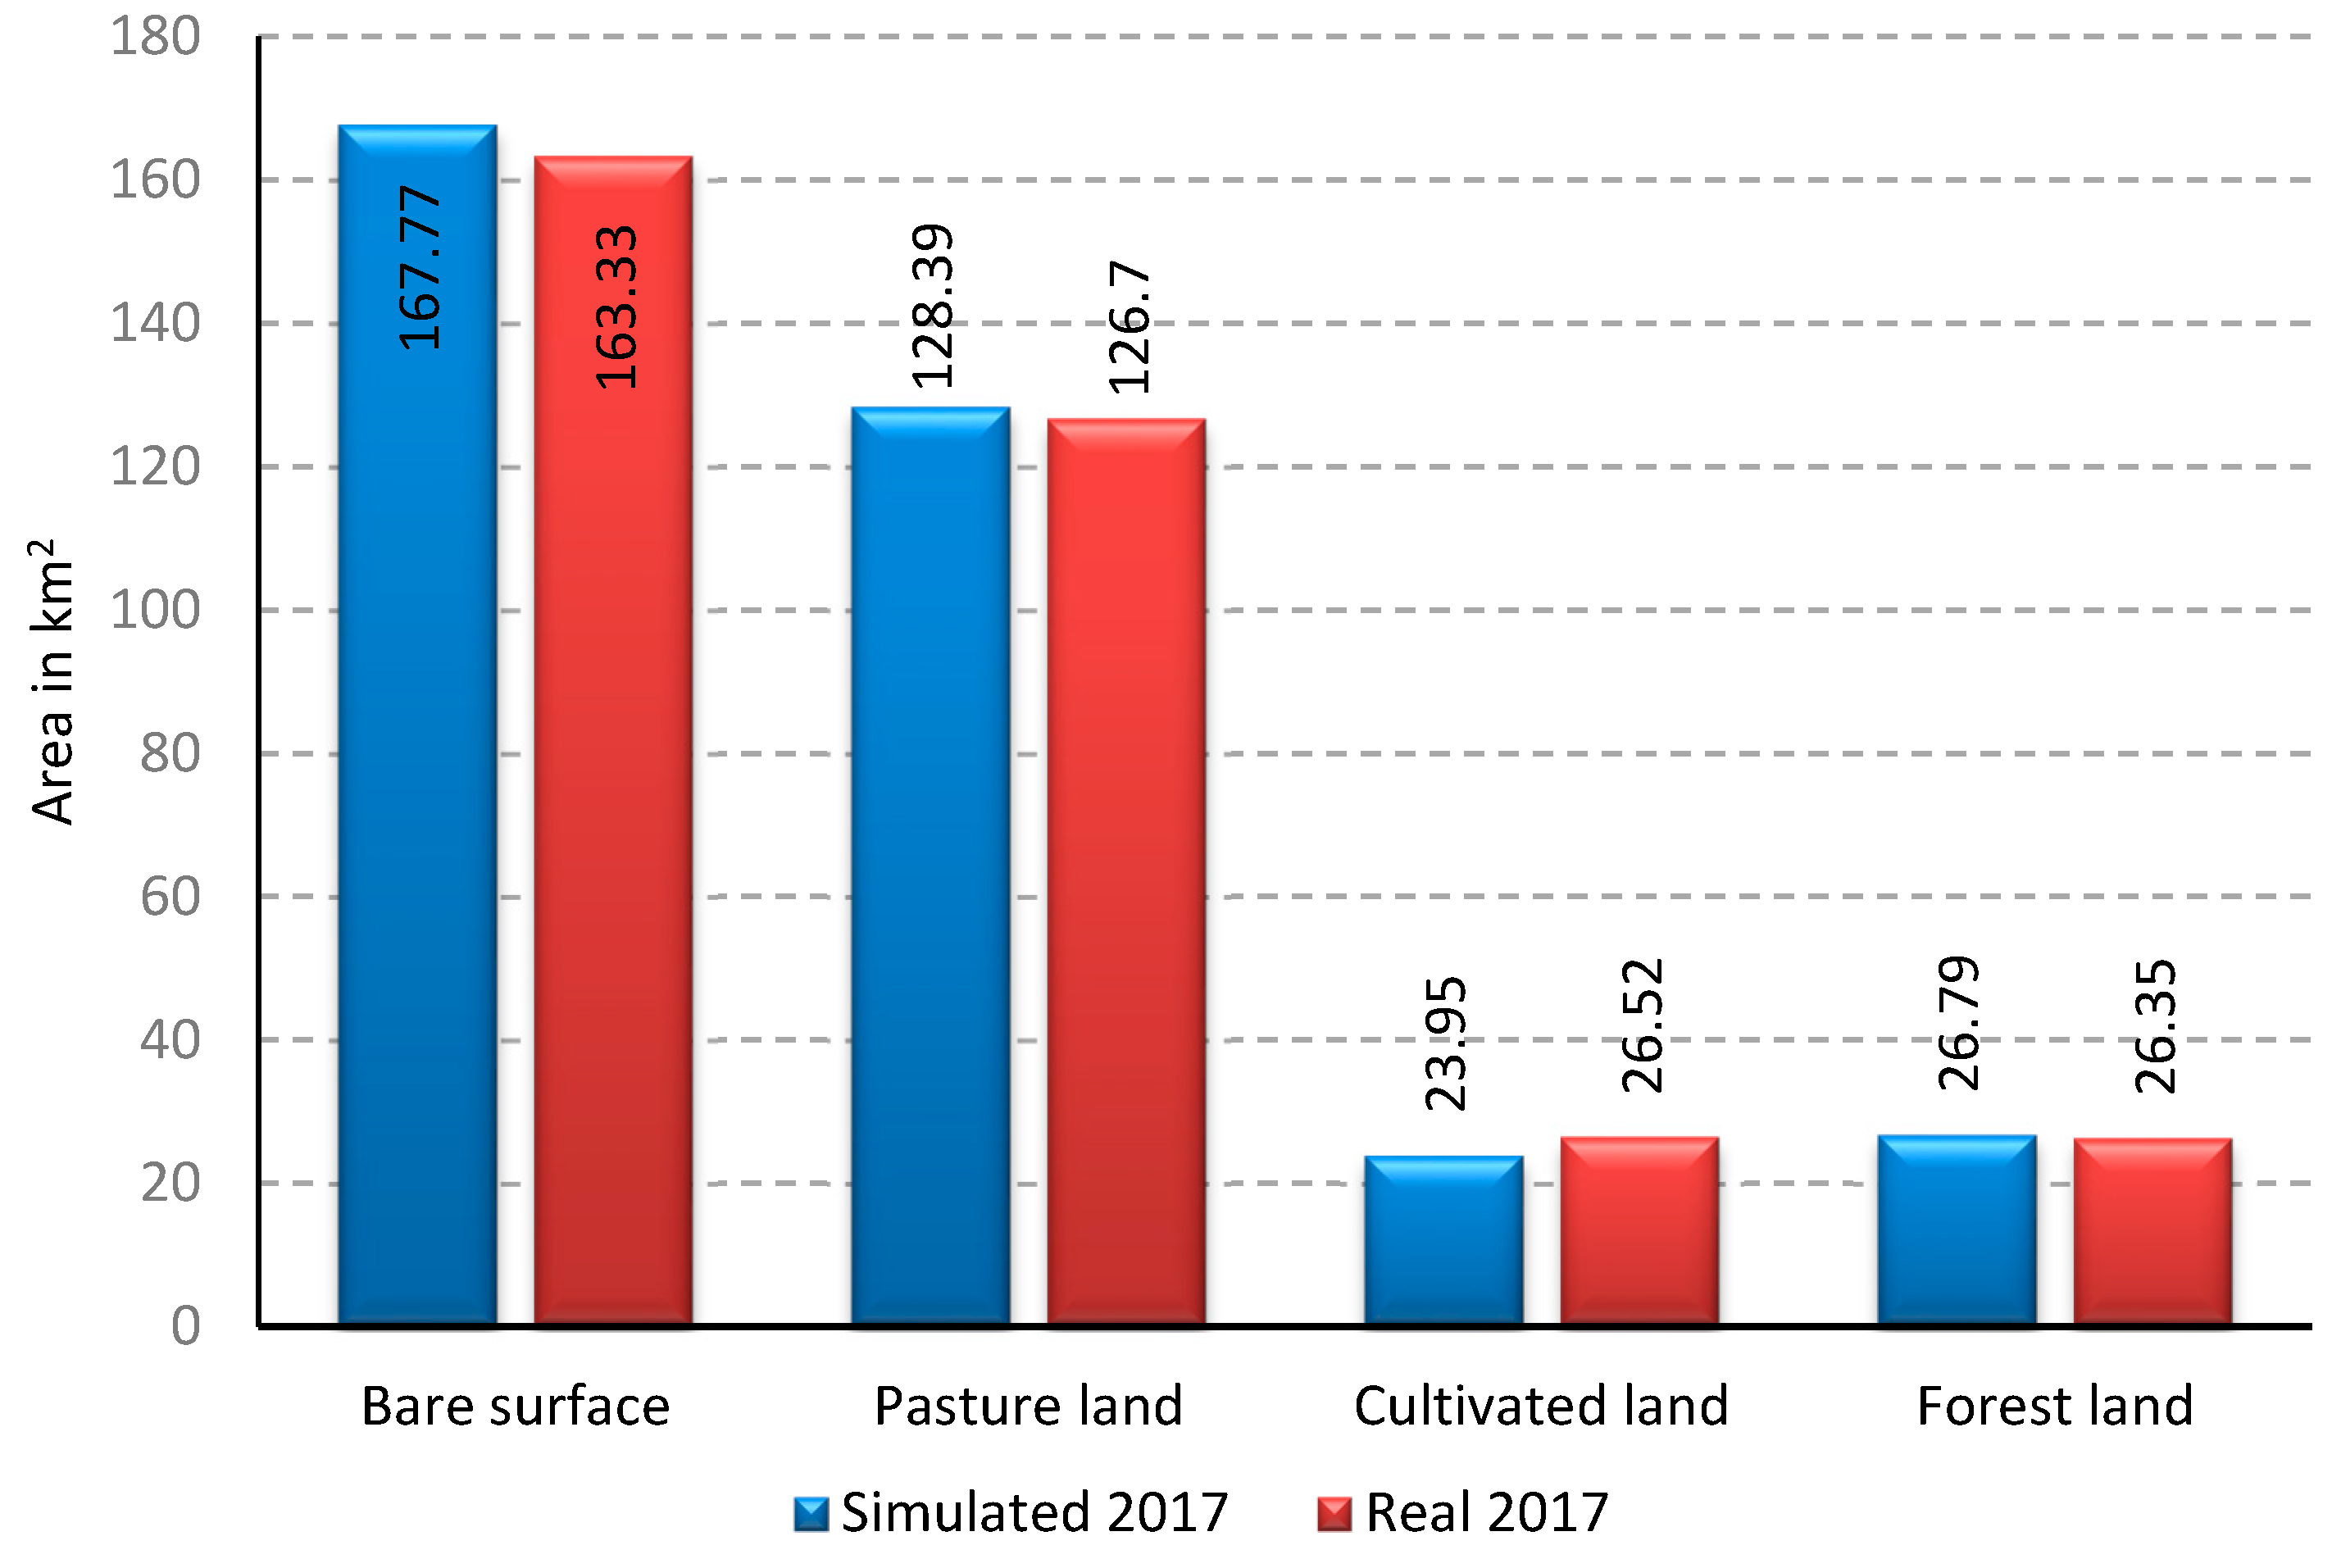
Figure 10.
The comparison between simulated map (blue colour) and real map (orange colour) of 2017 in HSCZ.
Figure 10.
The comparison between simulated map (blue colour) and real map (orange colour) of 2017 in HSCZ.
Figure 11.
Projected land cover, second scenario for 2023 of HSCZ.
Figure 11.
Projected land cover, second scenario for 2023 of HSCZ.
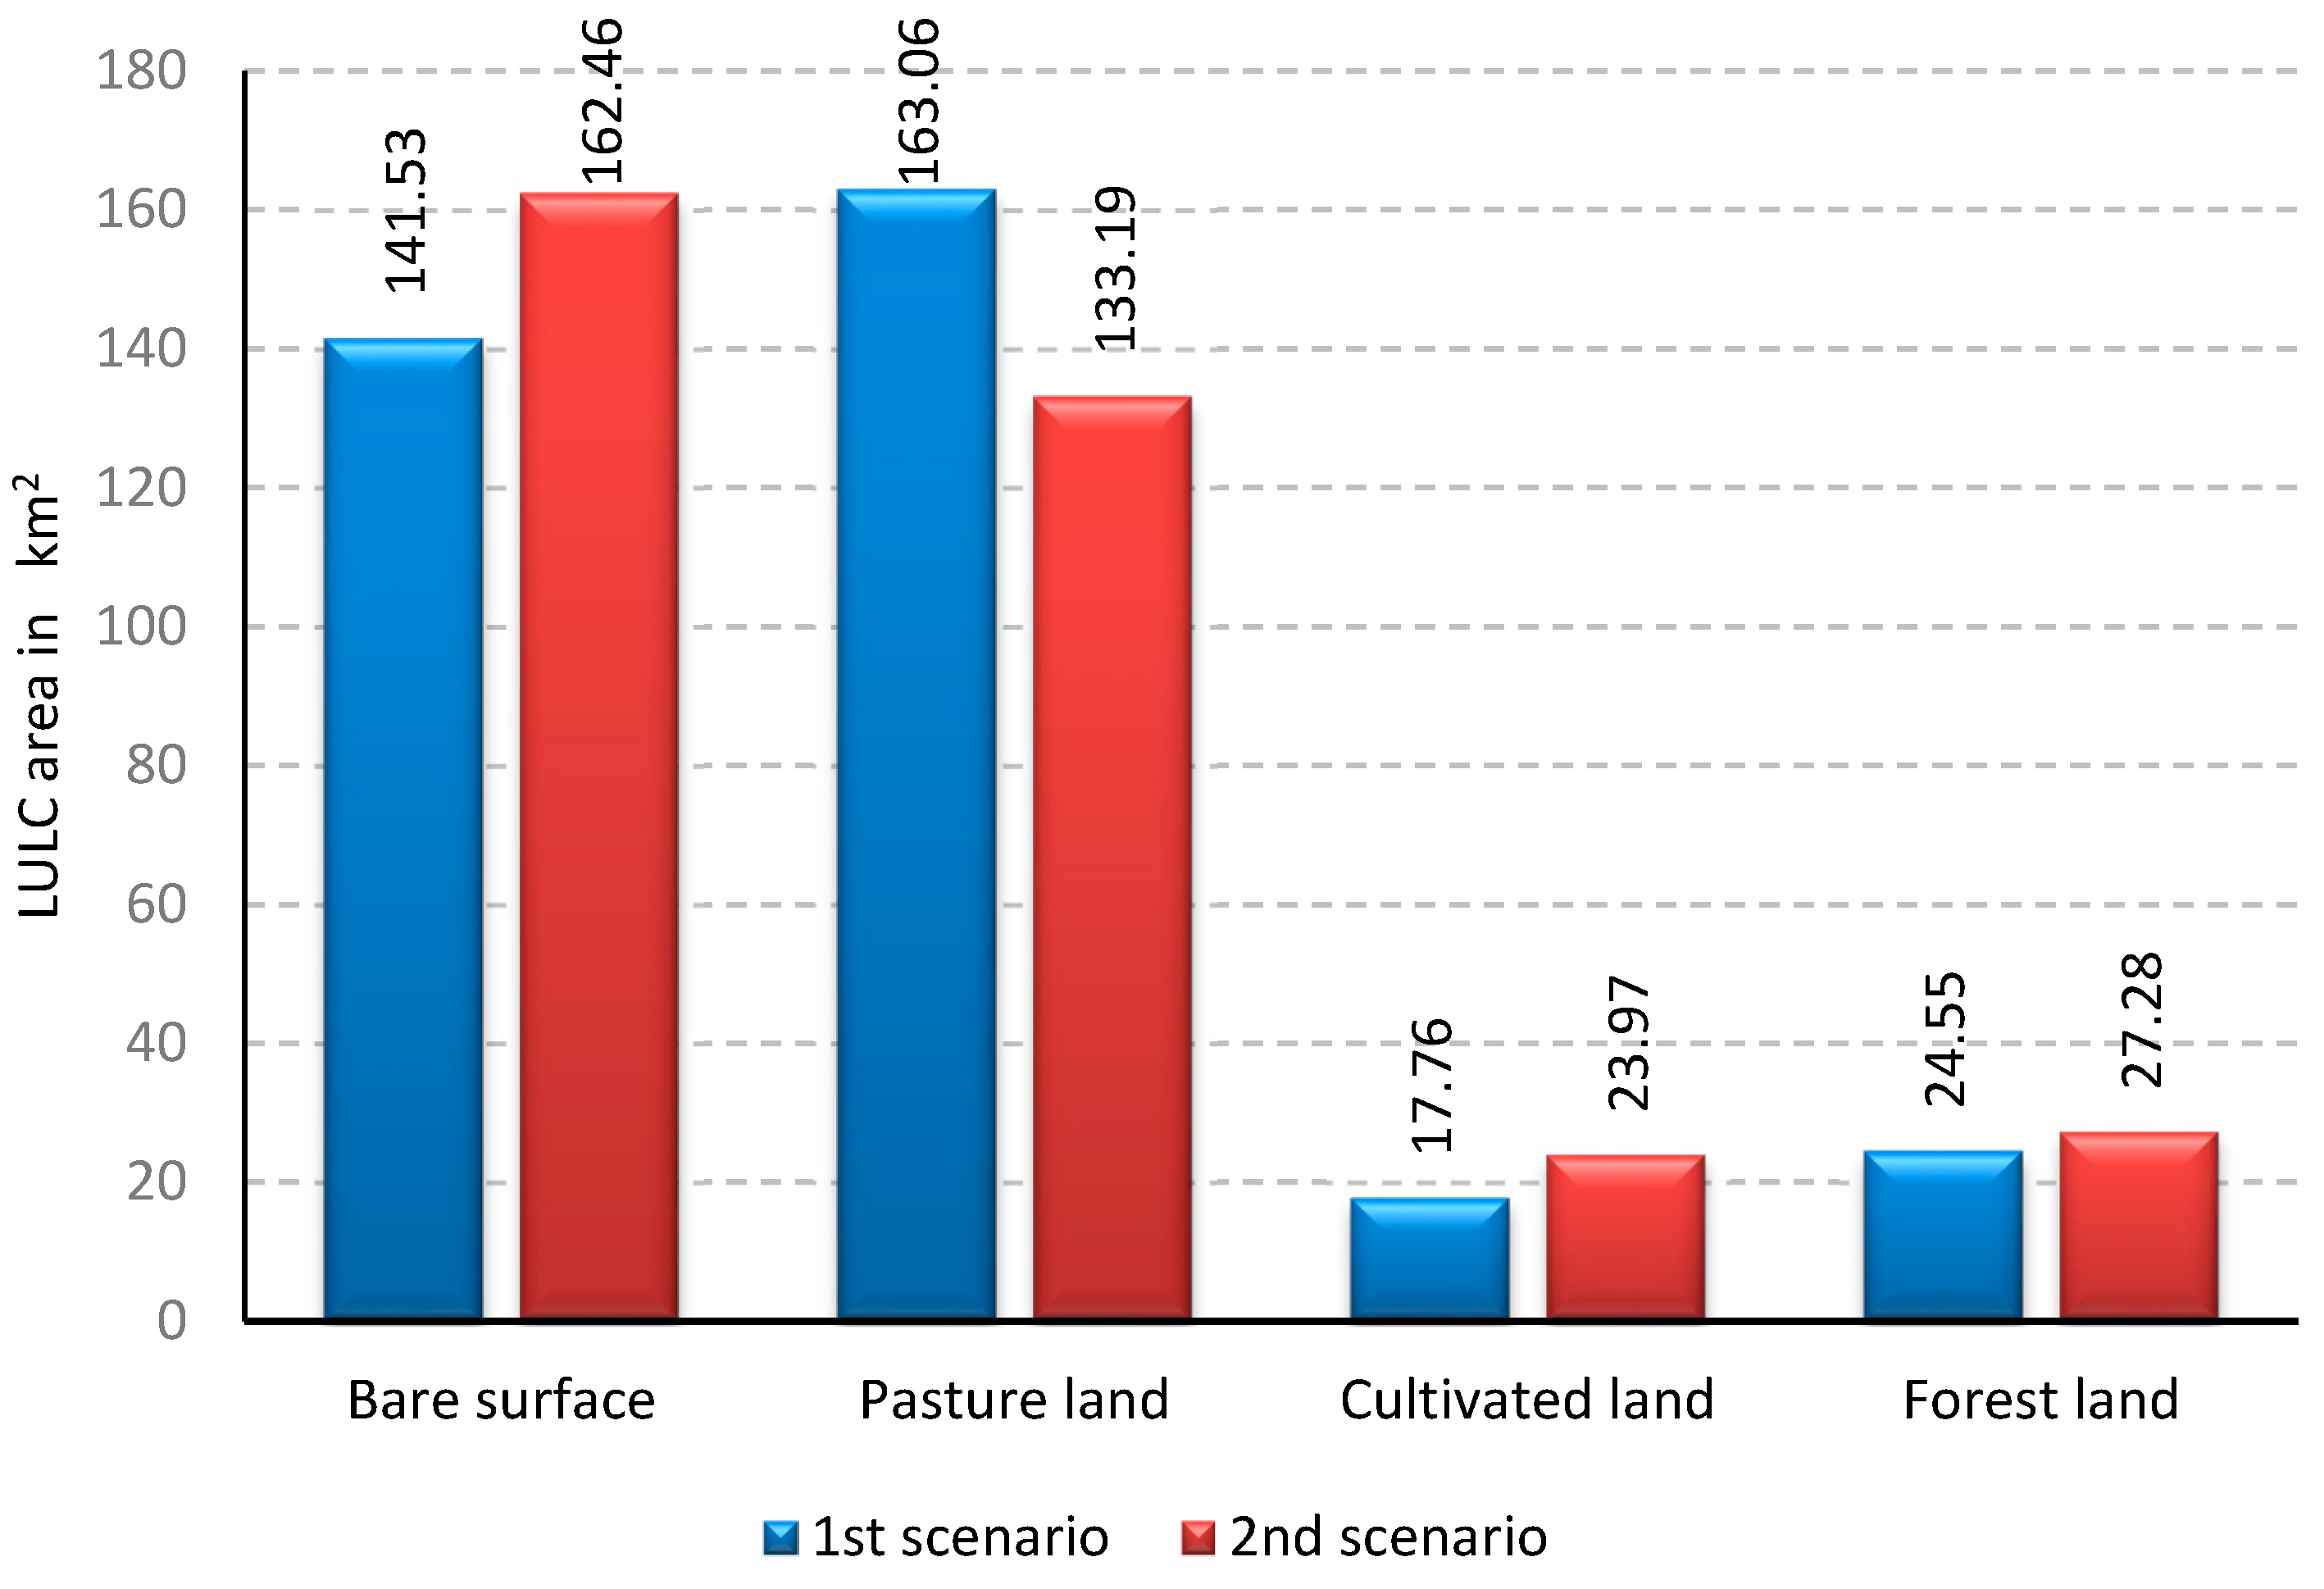
Figure 12.
The comparison of LULC area classes under two business-as-usual scenarios in square kilometres.
Figure 12.
The comparison of LULC area classes under two business-as-usual scenarios in square kilometres.
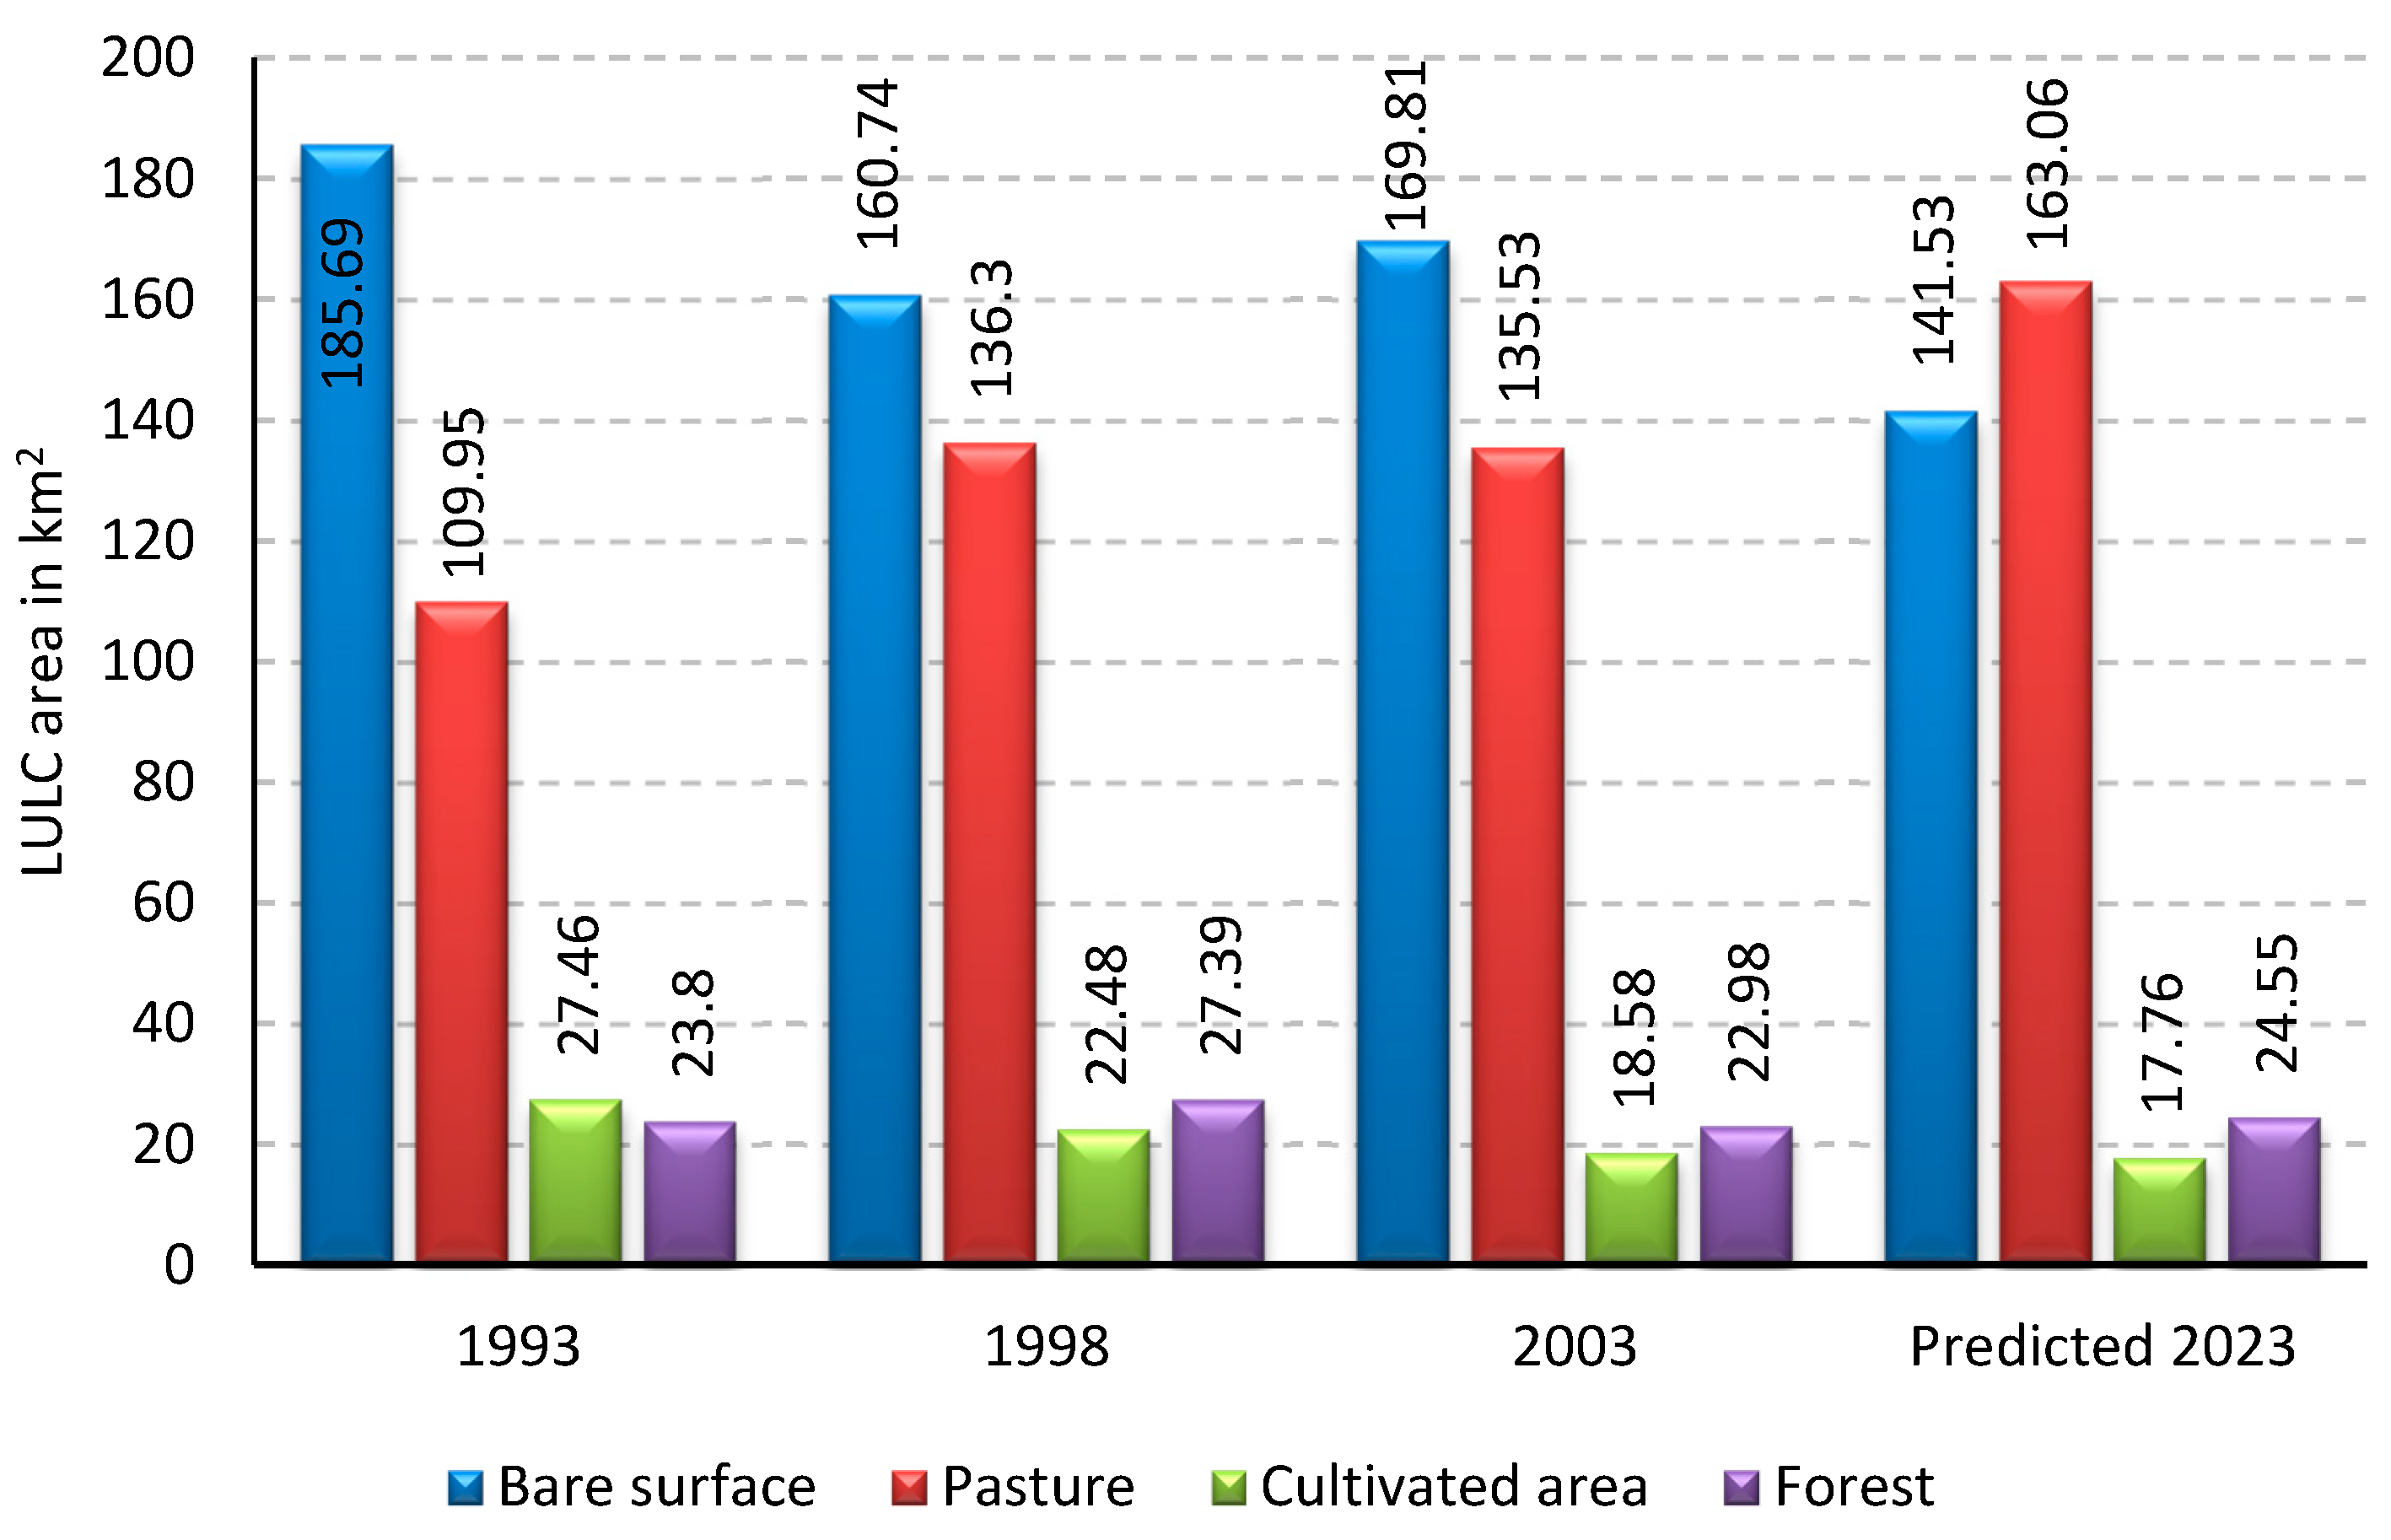
Figure 13.
Area changes in square kilometres of land use/cover classes for years 1993, 1998, 2003 and predicted 2023 of HSCZ.
Figure 13.
Area changes in square kilometres of land use/cover classes for years 1993, 1998, 2003 and predicted 2023 of HSCZ.
Figure 14.
Area changes in square kilometres of land use/cover classes for years 2003, 2008, 2017 and predicted 2023, (second scenario) of HSCZ.
Figure 14.
Area changes in square kilometres of land use/cover classes for years 2003, 2008, 2017 and predicted 2023, (second scenario) of HSCZ.
Table 1.
Satellite images with their acquisition dates and resolution.
Table 1.
Satellite images with their acquisition dates and resolution.
| Satellite Sensor | Path/Row | Acquisition Date | Resolution |
|---|
| Landsat 5 TM | 169/035 | 26 July 1993 | 30 m |
| Landsat 5 TM | 169/035 | 28 October 1998 | 30 m |
| Landsat 5 TM | 169/035 | 24 September 2003 | 30 m |
| Landsat 5 TM | 169/035 | 19 July 2008 | 30 m |
| Landsat 8 OLI | 169/035 | 10 June 2017 | 30 m |
Table 2.
Temporal distribution in km2 of land use/land cover distribution by years.
Table 2.
Temporal distribution in km2 of land use/land cover distribution by years.
| LULC | 1993 | 1998 | 2003 | 2008 | 2017 |
|---|
| Bare surface | 185.69 | 160.74 | 169.81 | 189.45 | 163.33 |
| Pasture | 109.95 | 136.30 | 135.53 | 118.40 | 126.70 |
| Cultivated area | 27.46 | 22.48 | 18.58 | 18.12 | 26.52 |
| Forest | 23.80 | 27.39 | 22.58 | 20.98 | 26.35 |
Table 3.
Accuracy assessment for 1993, 1998, 2003, 2008 and 2017 classification.
Table 3.
Accuracy assessment for 1993, 1998, 2003, 2008 and 2017 classification.
| Land Use/Cover | 1993 | 1998 | 2003 | 2008 | 2017 |
|---|
| P | U | P | U | P | U | P | U | P | U |
|---|
| Bare surface | 98 | 98 | 97 | 98 | 97 | 99 | 97 | 99 | 98 | 99 |
| Pasture | 97 | 97 | 97 | 98 | 98 | 95 | 97 | 96 | 97 | 97 |
| Cultivated area | 96 | 88 | 93 | 96 | 95 | 89 | 94 | 90 | 94 | 92 |
| Forest | 96 | 98 | 99 | 96 | 96 | 98 | 97 | 98 | 97 | 98 |
| Overall accuracy | 97 | 97 | 97 | 97 | 97 |
| Overall Kappa Statistic | 0.96 | 0.96 | 0.96 | 0.96 | 0.96 |
Table 4.
Transition probability matrix derived from the land use maps in HSCZ during 1993–1998.
Table 4.
Transition probability matrix derived from the land use maps in HSCZ during 1993–1998.
| Changing from: | Probability of Changing by 1998 to: | Subtotals |
|---|
| 1993 | Bare Surface | Pasture | Cultivated Land | Forest | Total | Loss |
|---|
| Bare surface | 0.6035 | 0.3448 | 0.0206 | 0.0312 | 1.00 | 0.3965 |
| Pasture | 0.3158 | 0.6573 | 0.0139 | 0.0130 | 1.00 | 0.3427 |
| Cultivated land | 0.1682 | 0.0998 | 0.5216 | 0.2104 | 1.00 | 0.4784 |
| Forest | 0.1313 | 0.1330 | 0.1090 | 0.6267 | 1.00 | 0.3733 |
| Total | 1.2188 | 1.2349 | 0.6651 | 0.8813 | 4.00 | |
| Gain | 0.6153 | 0.5776 | 0.1435 | 0.2546 | | |
Table 5.
Transition probability matrix derived from the land use maps in HSCZ during 1998–2003.
Table 5.
Transition probability matrix derived from the land use maps in HSCZ during 1998–2003.
| Changing from: | Probability of Changing by 2003 to: | Subtotals |
|---|
| 1998 | Bare Surface | Pasture | Cultivated Land | Forest | Total | Loss |
|---|
| Bare surface | 0.6900 | 0.2838 | 0.0073 | 0.0189 | 1.00 | 0.3100 |
| Pasture | 0.2789 | 0.6606 | 0.0349 | 0.0256 | 1.00 | 0.3394 |
| Cultivated land | 0.3170 | 0.0468 | 0.4923 | 0.1439 | 1.00 | 0.5077 |
| Forest | 0.3756 | 0.0460 | 0.0768 | 0.5016 | 1.00 | 0.4984 |
| Total | 1.6615 | 1.0372 | 0.6113 | 0.6900 | 4.00 | |
| Gain | 0.9715 | 0.3766 | 0.1190 | 0.1884 | | |
Table 6.
Transition probability matrix derived from the land use maps in HSCZ during 1993–2003.
Table 6.
Transition probability matrix derived from the land use maps in HSCZ during 1993–2003.
| Changing from: | Probability of Changing by 2003 to: | Subtotals |
|---|
| 1993 | Bare Surface | Pasture | Cultivated Land | Forest | Total | Loss |
|---|
| Bare surface | 0.6279 | 0.3409 | 0.0135 | 0.0178 | 1.00 | 0.3721 |
| Pasture | 0.2669 | 0.6823 | 0.0291 | 0.0217 | 1.00 | 0.3177 |
| Cultivated land | 0.3478 | 0.0514 | 0.4124 | 0.1884 | 1.00 | 0.5876 |
| Forest | 0.3154 | 0.0825 | 0.0791 | 0.5230 | 1.00 | 0.4770 |
| Total | 1.5580 | 1.1571 | 0.5341 | 0.7509 | 4.00 | |
| Gain | 0.9301 | 0.4748 | 0.1217 | 0.2279 | | |
Table 7.
Transition probability matrix derived from the land use maps in HSCZ during 2003–2008.
Table 7.
Transition probability matrix derived from the land use maps in HSCZ during 2003–2008.
| Changing from: | Probability of Changing by 2008 to: | Subtotals |
|---|
| 2003 | Bare Surface | Pasture | Cultivated Land | Forest | Total | Loss |
|---|
| Bare surface | 0.7143 | 0.1889 | 0.0515 | 0.0453 | 1.00 | 0.2857 |
| Pasture | 0.4183 | 0.5183 | 0.0484 | 0.0150 | 1.00 | 0.4817 |
| Cultivated land | 0.2203 | 0.2121 | 0.4283 | 0.1393 | 1.00 | 0.5717 |
| Forest | 0.3096 | 0.1644 | 0.1745 | 0.3515 | 1.00 | 0.6485 |
| Total | 1.6625 | 1.0837 | 0.7027 | 0.5511 | 4.00 | |
| Gain | 0.9482 | 0.5654 | 0.2744 | 0.1996 | | |
Table 8.
Transition probability matrix derived from the land use maps in HSCZ during 2008–2017.
Table 8.
Transition probability matrix derived from the land use maps in HSCZ during 2008–2017.
| Changing from: | Probability of Changing by 2017 to: | Subtotals |
|---|
| 2008 | Bare Surface | Pasture | Cultivated Land | Forest | Total | Loss |
|---|
| Bare surface | 0.7154 | 0.2501 | 0.0242 | 0.0102 | 1.00 | 0.2846 |
| Pasture | 0.1927 | 0.7752 | 0.0207 | 0.0114 | 1.00 | 0.2248 |
| Cultivated land | 0.0982 | 0.1753 | 0.6329 | 0.0936 | 1.00 | 0.3671 |
| Forest | 0.1302 | 0.1052 | 0.1053 | 0.6593 | 1.00 | 0.3407 |
| Total | 1.1365 | 1.3058 | 0.7831 | 0.7745 | 4.00 | |
| Gain | 0.4211 | 0.5306 | 0.1502 | 0.1152 | | |
Table 9.
Transition probability matrix derived from the land use maps in HSCZ during 2003–2017.
Table 9.
Transition probability matrix derived from the land use maps in HSCZ during 2003–2017.
| Changing from: | Probability of Changing by 2017 to: | Subtotals |
|---|
| 2003 | Bare Surface | Pasture | Cultivated Land | Forest | Total | Loss |
|---|
| Bare surface | 0.7991 | 0.1572 | 0.0343 | 0.0094 | 1.00 | 0.2009 |
| Pasture | 0.1682 | 0.8009 | 0.0231 | 0.0078 | 1.00 | 0.1991 |
| Cultivated land | 0.0522 | 0.1174 | 0.7334 | 0.0970 | 1.00 | 0.2666 |
| Forest | 0.0744 | 0.1809 | 0.1008 | 0.6438 | 1.00 | 0.3562 |
| Total | 1.0939 | 1.2564 | 0.8916 | 0.7580 | 4.00 | |
| Gain | 0.2948 | 0.4555 | 0.1582 | 0.1142 | | |
Table 10.
The predictability areas of 2023 for LULC classes under sanctions (first scenario) in square kilometres.
Table 10.
The predictability areas of 2023 for LULC classes under sanctions (first scenario) in square kilometres.
| LULC Classes | Projected 2023 in km2 |
|---|
| Barren land | 141.53 |
| Pasture land | 163.06 |
| Cultivated land | 17.76 |
| Forest land | 24.55 |
| Total | 346.9 |
Table 11.
The predictability areas of 2023 for LULC classes after sanctions (second scenario) in square kilometres.
Table 11.
The predictability areas of 2023 for LULC classes after sanctions (second scenario) in square kilometres.
| LULC Classes | Projected 2023 in km2 |
|---|
| Bare surface | 162.46 |
| Pasture land | 133.19 |
| Cultivated land | 23.97 |
| Forest land | 27.28 |
| Total | 346.94 |
Table 12.
κ for 2003 and 2017.
Table 12.
κ for 2003 and 2017.
| κ Indicators | 2003 | 2017 |
|---|
| κno | 0.8866 | 0.8318 |
| κlocation | 0.8805 | 0.8936 |
| κlocationStrata | 0.8805 | 0.8543 |
| κstandard | 0.8269 | 0.8543 |


