Article

Evaluating the Effect of Policies and the Development of Charging Infrastructure on Electric Vehicle Diffusion in China

1
Shenzhen Environmental Science and New Energy Technology Engineering Laboratory, Tsinghua-Berkeley Shenzhen Institute, Tsinghua University, Shenzhen 518055, China
2
Research Center for Modern Logistics, Graduate School at Shenzhen, Tsinghua University, Tsinghua Campus, The University Town, Shenzhen 518055, China
*
Author to whom correspondence should be addressed.
Sustainability 2018, 10(10), 3394; https://doi.org/10.3390/su10103394
Submission received: 3 September 2018 / Revised: 20 September 2018 / Accepted: 21 September 2018 / Published: 23 September 2018
(This article belongs to the Section Sustainable Transportation)

Abstract

:
China has been one of the most aggressive countries in electric vehicle (EV) promotion. However, private EV sales fail to achieve the government’s target. In particular, cutting purchase subsidies poses great uncertainty in relation to EV diffusion. In this research, a system dynamics model aims to investigate the influence of government policies, infrastructure development plans, the duration of policies, and the phase out strategy of policies. Parameters relating to consumers’ preferences are drawn from a questionnaire survey, which is conducted in Shenzhen, the pioneer city in China’s EV promotion. The result of a scenario analysis shows that purchase subsidies, purchase restrictions and driving restrictions are the most effective policies for EV promotion. Driving restrictions are more effective but less easy to enforce than purchase restrictions. The number and location of charging piles are much more important than large charging stations. Moreover, EV diffusion can be self-sufficient after current policies have been maintained for 11 years. We find that the gradual removal of subsidies will cause a four-year delay in EV sales entering rapid growth in Shenzhen. However, cutting subsidies in cities without purchase restrictions will cause the failure of EV promotion.

1. Introduction

China is promoting a transition to alternative fuel vehicles (AFVs), because conventional vehicles (CVs) consume a large amount of petroleum and cause serious environmental problems. First, “China has been the world’s largest net importer of petroleum and other liquids”, surpassing the United States at the end of 2013 [1]. Of all oil, 68% is consumed by transportation sector [1]. Furthermore, the high use of petroleum in the transportation sector generates a high level of greenhouse gases and aggregates air pollution. Especially, automobile emissions generate amounts of particulate matter, such as PM 2.5, which pose a substantial risk to Chinese public health.
In this context, the Chinese government has been determined to promote electric vehicles (EVs) as long-term transportation alternatives, since China’s Twelfth Five-Year Plan period (2010–2015). In the initial stage of EV diffusion, government policy plays a significant role because their long charging duration, short driving range and high price prevent people accepting EVs. For example, in the short term, governments offer subsidies to narrow the price gap and promote the development of charging infrastructure. In the long term, governments will continue to invest in power train technologies to improve the performance of EVs. In particular, policy creates the initial EVs and charging infrastructures, cracking the chicken-and-egg dilemma. Because EVs and charging infrastructure are classic cases of strong complementary goods [2,3,4,5,6,7], consumers will be reluctant to buy EVs without reliable charging facilities. Moreover, the rapid rollout of charging infrastructure requires a sufficient volume of EVs in operation [8].
Shenzhen is in the first batch of Chinese cities to promote EVs and has become the global leader in the alternative fuel public transportation field. By the end of 2017, the government had replaced all the gasoline buses with electric buses in Shenzhen [9].
However, private EV promotion is not as good as the rapid penetration of public transportation, and there are many obstacles, despite the great effort of the Shenzhen government. For example, purchase subsidies of EVs reached a peak of $16,812 in 2016. In addition, private EVs also had a subsidy of $2924 for private charges in 2015. The government has also implemented purchase restrictions on CVs since 2015. CV consumers must participate in a lottery to get a license plate, while EVs do not have purchase restrictions. EVs have also had a one-hour free parking right since 2015. Furthermore, according to the Shenzhen government, the number of slow charging piles in Shenzhen grew by roughly four-fold within a single year, from nearly 3000 in May 2015 [10] to 15,134 at the end of 2015 [11]. By the end of July 2017, Shenzhen had accumulatively built 27,146 slow charging piles [12]. Charging infrastructure grows rapidly. However, EV promotion does not perform as expected. As of 30 June 2016, Shenzhen had accumulatively promoted 20,574 private EVs, while the Shenzhen government prepared 20,000 EV plates in a car plate lottery policy in 2015 [13].
Moreover, the sharp decrease of purchase subsidies has posed great uncertainty in relation to EV promotion since 2017. Purchase subsidies come from the central and local governments. Compared with 2016, the purchase subsidies of the central government decreased by 20% from 2017 to 2018 and will decrease by 40% from 2019 to 2020. Before 2017, the local government could offer the same subsidies as the central government. However, the local government has not been able to offer more than 50% of central government subsidies since 2017. In Shenzhen, purchase subsidies of EVs, ranging between 150 and 250 km, decreased to $7895 in 2017, from $13,889 in 2016. EV sales of BYD Co., Ltd. (BYD), which is the biggest EV manufacturer in China, dropped by 34% during the first quarter of 2017 [14]. Unlike in 2016, EV sales of BYD had a 69.85% annual growth according to the annual report [15]. The annual growth rate of domestic AFV market is 201% in 2015, 86% in 2016 and 69% in 2017 [16]. The gradual removal of subsidies hits the growth of EVs. Thus, it is essential to deeply understand the effectiveness of cutting subsidies and create an appropriate policy combination in order to guarantee the success of EV penetration.
This research focuses on examining the role of government policies and the development of infrastructure in the private EV promotion in China, rather than the exact prediction of the future EV population. Previous researchers apply system dynamics (SD) models to study the AFV diffusion because the SD models can incorporate complex and uncertain factors [17,18,19,20]. Struben and Sterman find that the AFV market could be self-sufficient after a critical duration of subsidy policy and marketing efforts [20]. Shepherd et al. extend Struben and Sterman’s model to study factors affecting diffusion of EVs in U.K. They find that the word of mouth, the vehicle life and the emission rate have more impact than policies or vehicle factors [18]. Other studies incorporate the similar diffusion structure but add other factors, such as infrastructure developments, communication policies, regulations and the energy price. Meyer and Winebrake emphasize on the importance of the co-evolution of refueling infrastructures in relation to American hydrogen vehicle promotion [2]. Based on Meyer and Winebrake, Köhler et al. calculate the initial requirement for filling stations for hydrogen vehicles in Germany [5]. The result shows that the hydrogen vehicle market could be self-sufficient when vehicles and filling stations are both supported. Ardila and Franco [21] point out that communication policies have a more significant influence than fiscal policies on AFV diffusion in the Colombian market. Benvenutti et al. [19] find that the banning regulation for CVs is more effective than fiscal policies in relation to AFV promotion in Brazil. Gnann et al. and Plötz et al. reveal that many external factors pose great uncertainty on plug-in electric vehicle (PEV) penetration in Germany [7,8,22,23,24]. The result indicates that energy price has a large impact on PEV penetration. Furthermore, subsidizing purchases and depreciation can effectively accelerate PEV penetration. Wolf et al. [25] propose an empirically grounded agent-based modeling approach to simulate the effect of fiscal policies and social influence on German consumers’ transport model preferences. The result suggests that an exclusive zone for EVs could effectively accelerate the initial diffusion of EVs than fiscal incentives only. Pasaoglu et al. [26] incorporate the agent-based approach in the SD model to capture the interaction and feedbacks of market participants with conflicting interests. The model simulates the market share of light duty vehicles of 28 members of the European Union. This research also tests the effect of possible factors, “including different oil prices, GDP growth, learning rates, purchase subsidies, and EU emission targets”. Kangur et al. use cross-section survey data to develop an agent-based simulation model. The result shows that EV promotion requires long-lasting policies combining monetary, structural and informational measures [27]. Shepherd reviewed SD models applied in the AFV diffusion. Shepherd summarized that quantitative research papers typically include a diffusion process, a fleet aging chain and a choice model for purchase decisions [17].
Although SD models have been widely applied in long-term policy analysis, SD models cannot make the reliable and accurate forecast for the future real world system, because deep uncertainties arise in the long-term future [19,20]. Specialized literature on long-term policy analysis argues that SD models contribute to provide insight to future behavior of the real world system [28]. The SD model helps to test the behavior and response of real world systems when the policy changes. The overall aim of an SD model is to offer an enhanced learning about the real world system, rather than the accurate forecast [28].
Meanwhile, there are also some statistics methods in AFV diffusion research, such as the correlation analysis [29], the factor analysis [30], the linear regression [31,32], the logit model [33], the pooled regression [34] and the conjoint analysis [35,36,37,38,39,40]. Lin and Wu use correlation analysis to examine the public’s cognition of each factor and analyze the impact of these factors in first-tier cities of China [29]. Wang et al. apply the factor analysis method and the structural equation model to explore the potential factors that affect consumers’ acceptance of EVs in Shanghai, based on a questionnaire survey [30]. Sang and Bekhet use the linear regression-stepwise technique to explore factors influencing EV usage intention in Malaysia [32]. Junquera et al. apply a logit model to analyze consumer attitudes towards EV purchasing intentions in Spain [33]. Zhang et al. [34] explore different types of policies by explaining the quick rise of EVs across 88 cities in China. Using a pooled regression, they find that the consumer-oriented policies (e.g., lowering parking fee, subsidy) are more effective than the producer-oriented policies (e.g., R&D support, government procurement). Although many statistics methods reveal consumer preferences in relation to policies and infrastructure, these methods are hard to be incorporated into SD models [35,36,38,39].
In addition, the conjoint analysis and discrete choice models are also combined to examine AFV preferences in empirical research [35,36,37,38,39,40]. Golob et al. [40] use the conjoint analysis to examine the commercial fleet demand of AFVs in California. Based on a large-scale survey conducted in Flanders, Lebeau et al. forecast the market potential for plug-in hybrid and battery electric vehicles using a conjoint experiment [38]. Helveston et al. design a conjoint survey and a discrete choice model on vehicle preferences in the U.S. and China [36]. Ahn estimated consumer preferences regarding AFV attributes [35]. Based on a survey of 88 upper income drivers in New York, Kidder et al. [37] use the conjoint analysis to test part-utilities of different attributes of the car purchase decision. The result suggests that the current price of EVs is unattractive to potential adopters. However, previous conjoint analysis research mainly focuses on vehicle attributes and find that CVs are still most consumers’ choices. Moreover, conjoint analysis is rarely incorporated into an SD model to study EV diffusion.
In summary, although the conjoint analysis is rarely incorporated into an SD model, discrete choice models are very common in SD models in relation to AFV diffusion. It is a new idea to incorporate the conjoint analysis and the discrete choice model into an SD model. Then, previous conjoint analyses focus on vehicle attributes, despite the fact that policies and the development of infrastructure drive the early diffusion of EVs. This research expects to use conjoint analysis to quantify consumer preference for policies and charging infrastructure, rather than vehicle attributes. Moreover, most previous research focuses on AFVs, which can be refueled within a short time [2,5,20,21,26,38,41,42]. Some research only considers the number of charging stations [2,3,4,5,6,43,44]. This research proposes further study on the development of charging infrastructure from three aspects: charging piles, charging stations and charging positions. Furthermore, most research ignores the phase out strategy of policies, which is a dilemma currently faced by the government, although some research tests the duration of policies [19,20]. One of contributions of this research is evaluating the influence of the phase out strategy of purchase subsidies.
There were five primary objectives of this research: (1) to develop an SD simulation model of EV promotion in Shenzhen China; (2) to incorporate the conjoint analysis and the discrete choice model into the SD model to reveal consumer preference regarding EVs; (3) to examine the role of government policies and the charging infrastructure in the EV industry in China; (4) to evaluate the influence of the phase out strategy of incentive policies; and (5) to offer more insight into EV promotion systems.
The structure of the paper is as follows: Section 2 describes an SD model, which shows the system structure of EV diffusion. After formulating the model, a questionnaire survey and a conjoint analysis collect parameters of consumer preference. Then, a parameter analysis examines the influence of uncertainties and finds the proper value of parameters. In Section 3, a scenario analysis tests the effect of policies, infrastructure development plans, the duration of policies and the phase out strategy of purchase subsidies. Section 4 compares the results and methods of the conjoint analysis and the SD model with previous studies. Section 4 discusses the implication of the proposed approach to other countries and future research. Finally, in Section 5, suggestions and policy implications are provided to the government in order to guarantee the rapid penetration of EVs.

2. Material and Methods

2.1. Overview Description

We built the diffusion model of the Shenzhen market based on the model of Struben and Sterman [20]. Struben and Sterman emphasize a broad boundary of AFV transition, “including attributes, driver experience, word of mouth, marketing, and learning through R&D and experience, innovation spillovers, and infrastructure” [20]. However, they did not consider the effect of policies, which is a key factor in Chinese EV promotion. In our research, we focus on key factors, including policies, charging infrastructure and vehicle attributes. Moreover, the model also considered consumer preferences.
The simplified dynamic structure, shown in Figure 1, explains the diffusion of EVs. As shown in Figure 1a, an EV diffusion model contains two stages: (a) the consideration stage; and (b) purchase stage. As shown in Figure 1b, the consideration stage, which refers to Struben and Sterman’s model, contains a diffusion process and a fleet aging chain. As shown in Figure 1c, the purchase stage incorporates a conjoint analysis and a discrete choice model to reveal the consumer preference regarding policies and infrastructure development.
The consideration stage is a diffusion of the emotional acceptance of EVs. If potential consumers are sufficiently familiar with EVs and willing to choose EVs, they will enter the purchase stage. The influence of the consideration rate is shown in Figure 1b. The consideration rate equals consumers’ willingness to consider EVs (WtC), which shows the proportion of potential consumers who are willing to consider EVs. Here, WtC captures the cognitive, emotional acceptance after people are sufficiently familiar with EVs. WtC is an important stock, in terms of the total social exposure and word of mouth effect. Word of mouth is the communication among people, involving their experience or opinion about a product or service. As shown in Figure 1c, the purchase stage is a choice model. Consumers make a serious comparison of CVs and EVs, based on the representative utility of each vehicle, mainly including the vehicle attributes, government policies, and development of charging infrastructure.
Further descriptions of these two stages are presented in Section 2.2 and Section 2.3. The simulation model is conducted in Vensim PLE (Windows Version 6.4, Ventana Systems, Inc., Cambridge, MA, USA).
Current EVs (V) accumulate new EV sales (S) and EV discards (G) in Equation (1). EV discards (G) are age-dependence due to the limited EV service life, which is assumed to be 10 years:
dV dt = S G .
New EV sales (S) are determined by the potential demand (D), willingness to consider (W), and probability of purchase (P) in Equation (2). The willingness to consider (W) is discussed in Section 2.2. The probability of purchase (P) is discussed in Section 2.3:
S = D * W * P .

2.2. Consideration Stage

Consideration stage is a diffusion process of consumers’ willingness to consider EVs (WtC), which equals the consideration rate in Figure 1a. EV purchase behavior is the combination of emotional acceptance and rational choice [45,46]. Through the consideration stage, we can obtain WtC (W), which captures the cognitive, emotional acceptance of EVs. An increase of WtC (W) is a function of the total social exposure ( τ ) and decay rate ( φ ), as shown in Equation (3) [20]:
dW dt = = τ ( 1 W ) φ W .
Equation (4) refers to Struben and Sterman’s model [20]. The total social exposure ( τ ) comes from: (1) marketing, (2) word of mouth of EV drivers, and (3) word of mouth of other vehicle drivers. The marketing effectiveness ( λ ) of EVs is dominated by the government and enterprises at the initial stage of EV penetration. The second term represents the influence of the word of mouth of EV drivers. Here, q 1 and W 1 are the contact effectiveness and WtC of the EV drivers. V N is the EV market share. The last term is the word of mouth of other vehicle drivers. Here, q 2 and W 2 are the contact effectiveness and WtC of other drivers, respectively. ( 1 V N ) is the market share of other vehicles. It is assumed that the WtC of the EV drivers ( W 1 ) is close to 100%. The WtC of other drivers ( W 2 ) is close to the average WtC (W):
τ = λ + q 1 W 1 V N + q 2 W 2 ( 1 V N ) .
Unlike Struben and Sterman, we assume that marketing effectiveness ( λ ) is the sum effects of all marketing hot spots ( λ i ) in Equation (5). Here, the marketing hot spots were simplified to the critical factors of EV penetration. Struben and Sterman only investigate the diffusion process of AFV without comparing the effect of different factors. This research uses scenario analysis to compare the effect of different policy combinations and infrastructure development plans. Different combinations of policies and infrastructure development plans have different marketing effectiveness. Thus, we decompose the total marketing effectiveness to the sum effect of all marketing hot spots. Furthermore, because marketing effectiveness has diminishing marginal utility, the linear decomposition of marketing effectiveness will not lead to the linear relation of results. The diminishing incentive marginal utility issues indeed exit in the EV diffusion systems:
λ = λ 1 + λ 2 + λ i + λ n .
WtC will decrease without enough social exposure of EVs. When the total social exposure ( τ ) is infrequent, WtC decays rapidly. The loss of WtC ( φ ) is defined in Equation (6) [20]. When WtC decays at a rate of 50%, τ * is the reference total social exposure:
φ = 1 1 + exp ( 2 ( 1 τ τ * ) ) ,   φ [ 0 , 1 ] .

2.3. Purchase Stage

Before the large-scale promotion of private EVs, government policies achieve success in public transportation and official government vehicle fields. When it comes to private cars, policies seem to have less influence. EVs are high-grade durable goods. Consumers of EVs not only need good policies, but also require vehicle attributes and charging infrastructure that match their expectation, especially in China, where most families buy EVs as their first cars.
Although consumers are willing to take EVs as a serious choice in the first stage, they would still make a comparison between EVs and CVs in the purchase stage, rather than directly choose cars among different EVs. The attractiveness of each vehicle is a function of factors, including government policy attractiveness ( a p ), vehicle attributes attractiveness ( a v ), charging infrastructure attractiveness ( a c ):
P = β p a p + β v a v + β c a c ,
where β p , β v and β c are the importance of each factor, which is calculated based on our questionnaire survey.
All of the critical factors in our model are listed in Table 1. In particular, the development of charging infrastructure can be evaluated from the number of charging stations, the car-to-pile ratio, and the charging place. A conjoint analysis was conducted to analyze the utility and importance of the charging place and qualitative policies. Furthermore, the purchase cost equals the selling price minus subsidies. Thus, we merge the selling price and subsidies into one variable, called the purchase cost.

2.3.1. Policy Incentives

To evaluate the effect of policies and calculate some parameters of our model, a survey was conducted in Shenzhen in January 2016. We invited shoppers in an automobile supermarket in Shenzhen to fill out an online survey. The survey had three parts. The first part contained questions on demographics, driving experience, as well as questions on attitudes, knowledge and preferences in relation to purchasing and driving EVs. The second part was a description of each policy, which will be presented in the third part. The third part was a ranking question of eight policy combinations. Participants were asked to rank their willingness to purchase EVs under eight policy combinations, which were presented in a random order. Policy combinations were generated by ORTHOPLAN, which is a design generator, as shown in Table 2. For example, in the first policy combination, CVs have purchase restrictions and driving restrictions by the tail number, while EVs do not. EVs have a parking fee and tolls, as do CVs. EVs can only charge at parking lots in communities, the workplace, and other public places. The rental model of EVs is in the early stage. Renting stations are not convenient for borrowing and returning EVs. The battery insurance of EVs is 5–8 years.
The survey collected a total of 189 responses. Because the answer time was less than 60 s, 32 questionnaires were eliminated from our analysis. Because a preliminary test showed that finishing the survey without random answers required at least 60 s, the average time of completing the questionnaire was 173 s. In total, there were 157 valid questionnaires, with a response rate of 83%.
The demographic characteristics of the sample are presented in Table 3. This sample can represent the potential car buyers with respect to gender, age and driving experience. In this survey, there were 2.5 times more males than females, and young people, whose age is under 35, are more numerous than people whose age is over 35. Thus, males and young people are the major consumers of cars. In addition, only 1.91% participants already bought EVs. Of the participants, 26.75% considered buying EVs in the next two years, and 8.92% did not consider buying EVs in next two years, with 62.42% unsure of whether they want to buy an EV.
In this research, government policy utility was evaluated by conjoint analysis, which has been widely used to collect consumer preferences in relation to vehicle attributes [35,37,38,39]. Conjoint analysis was conducted in IBM SPSS 19.0 (New York, NY, USA), which can calculate the part-worth utility value of different levels of each attribute and the relative importance of each attribute. The results are presented in Table 4 and Table 5. Pearson’s r is 0.967 (Sig. = 0.000). Kendall’s tau is 0.929 (Sig. = 0.000). Pearson’s R and Kendall’s tau can assess the validity of the conjoint analysis model. The validity of the conjoint model assesses how well the model fits the ratings for an individual [47]. Here, the values of Pearson’s R and Kendall’s tau are very close to 1 and the two-tailed test significance levels are 0.000, which indicate that the conjoint analysis model fits the ratings for an individual very well and the results are very significant.
The policy utility of EVs ( u p e ) and CVs ( u p c ) are calculated by Equation (8).
u p = 0.5 * ( i = 1 m γ i v ij x ij + 1 ) ,   u p [ 0 , 1 ] ,   x ij = { 1 0 if   the   jth   level   of   ith   attribute   is   present otherwise ,
where v ij is the part-worth utility value of the jth level of the ith attribute, γ i is the relative importance of the ith attribute, x ij depends on the real situation of EVs and CVs. v ij and γ i are the result of the conjoint analysis. V i = v ij x ij is the part-worth utility of ith attribute in each scenario.
The attractiveness of EV policy ( a p ) is calculated by comparing the utility of EVs and CVs in Equation (9):
a p = u pe u pe + u pc .

2.3.2. Vehicle Attributes

Since vehicle attributes can be quantified, we use the original value to compare EVs with CVs in relation to four aspects: (1) the purchase cost; (2) energy cost; (3) charging/refueling period; and (4) range. Vehicle attributes attractiveness ( a v ) is calculated in Equations (10) and (11):
a v = 1 4 β i u i 2 + 0.5 ,   a v [ 0 , 1 ] ,
u i = a 1 i a 2 i max ( a 1 i , a 2 i ) ,   u i [ 1 , 1 ] ,   i = 1 ,   2 ,   3 ,   4 .
The importance of the ith attribute ( β i ) is calculated by our questionnaire survey. u i is the relative utility of the ith attribute, a 1 i is the ith vehicle attribute of EVs, and a 2 i is CVs. The value of a 1 i and a 2 i are calculated based on the average or the median attribute value of the 10 best-selling CVs and EVs of 2016.

2.3.3. Infrastructure Development

As shown in Figure 2 and Equation (12), the infrastructure attractiveness ( a c ) is obtained from the charging pile utility ( u p ) and charging station utility ( u s ). In addition, the utility of different charging places is considered in the conjoint analysis because the charging place is a qualitative parameter.
As shown in Figure 2a and Equation (13), the charging station utility ( u s ) is calculated by comparing the number of charging stations ( s 1 ) with gasoline stations ( s 2 ). As shown in Figure 2b and Equation (14), the charging pile utility is calculated by comparing the car-to-pile ratio with the ideal ratio, which is 1:3. The importance of the charging pile ( β p ) and charging station ( β s ) in Equation (12) is also calculated by our questionnaire survey. To simplify the model, we assume a fixed increasing rate of charging stations and charging piles. For example, if the increase rate of charging stations is 20, charging stations increase by 20 every year. If the increase rate of charging piles is 1:2, charging piles are twice the increase of EVs:
a c = β p u p + β s ( u s 2 + 0.5 ) ,   a c [ 0 , 1 ] ,
u s = s 1 s 2 max ( s 1 , s 2 ) ,   u s [ 1 , 1 ] ,
u p = min ( 1 , c 3 V ) ,   u p [ 0 , 1 ] .

2.4. Parameter Analysis

Because parameters conditioning EV diffusion are highly uncertain, we focus on analyzing the effect of policies, infrastructure development plans, the duration of policies and the phase out strategy, rather than the parameter estimation and the EV population forecast.
The goal of parameter analysis is to determine the proper values of some highly uncertain and important parameters to make the EV diffusion process consist of national strategic planning in relation to EVs and other similar research.
Parameters in the consideration stage are highly uncertain. We will analyze these parameters later in this section. In the purchase stage, EVs are compared with CVs to generate the attractiveness of policies, infrastructures and vehicle attributes. In the purchase stage, there are four types of parameters including the utility of policies, vehicle attributes, infrastructure development plans and the importance of each factor. Firstly, the utility of policies is drawn from the conjoint analysis. Secondly, parameters of vehicle attributes prefer to use the average or the median attribute value of the 10 best-selling CVs and EVs. Then, infrastructure development factors were simplified to the fixed ratio and increasing rate. Finally, the importance of each factor comes from the conjoint analysis and the questionnaire survey. Parameters in the purchase stage change over time, such as EV driving range, policy environment, infrastructure development. To reduce large uncertainty, we assume that some parameters remain the same in the future. This research only focuses on the current environment.
Parameters of the consideration stage are estimated based on the diffusion models of AFV, HFCVs, EVs, PEVs and other durable goods. Parameter analysis is conducted to obtain the proper value of some key parameters, including the marketing effectiveness (λ), reference rate of the total social exposure (τ*), contact effectiveness of EV drivers (q1), and contact effectiveness of other drivers (q2). The results are shown in Figure 3.
In the consideration stage, consumers obtain EV information from two main sources: business promotion and word of mouth. The marketing effectiveness (λ), which represents the influence of business promotion, is similar to the external influence coefficient in the Bass model. As shown in Figure 3a, marketing is very important at the initial stage of EV penetration. If λ is less than 0.04, EVs grow slowly in the first 25 years. Compared to the typical estimate of the marketing effectiveness (0–0.02) of durable goods, EVs need a much stronger marketing strategy to form a solid foundation for promotional efforts.
The reference rate of the total social exposure (τ*) influences the declining rate of WtC. EV penetration accelerates along with the decrease of τ*, which means less forgetting of WtC. As shown in Figure 3b, when τ* is less than 0.04, EVs grow slowly in the first 20 years.
Word of mouth is similar to the parameter of internal influence in the Bass model. The more people talk about EVs, the more people in the social system may choose to purchase EVs. The effectiveness of word of mouth can be divided into two parts: EV drivers and other drivers. The contact effectiveness of EV drivers (q1) represents the percentage of potential consumers who are influenced by EV drivers. The contact effectiveness of others (q2) represents the influence of other drivers. In this research, the word of mouth of other drivers, which is neglected by many researchers, has a greater influence than EV drivers. As shown in Figure 3c,d, the various value of q2 has a greater influence on EV diffusion than q1. Due to the limited EV market share at the beginning of the promotion, the word of mouth of EV drivers does not have a significant influence on the penetration system. When q2 is less than 0.15, EVs will enter a rapid growth stage after 15 years, which is beyond the previous research.
Finally, parameters are estimated as follows: the marketing effectiveness (λ) is 0.04; the reference rate of the total social exposure (τ*) is 0.04; the contact effectiveness of EV drivers ( q 1 ) is 0.3; and the contact effectiveness of other drivers ( q 2 ) is 0.15.

3. Scenario Analysis

A scenario analysis tests the effect of different policies, infrastructure construction plans, policy durations, and decreases in purchase subsidies. To make a clear comparison between different scenarios, EV diffusion is considered to enter the rapid growth stage when the yearly sale of private EVs takes 10% of total private vehicle sales. Thus, the time period before EVs entering rapid growth stage is an indicator, which quantifies EV promotion effectiveness in each scenario.

3.1. Base Scenario

The base scenario simulates the policy combination and the infrastructure development plan of Shenzhen in 2016, when the government is the most ambitious about EV penetration. The Shenzhen government offers an average of $14,556 per car to subsidize the purchase of EVs, whose driving range is between 150 and 250 km. Other fiscal benefits include one-hour free parking every day and free tolls. In addition to providing fiscal incentives, the Shenzhen government offers many priorities in traffic management. The Shenzhen government has launched purchase restrictions on CVs, and EVs are not subject to these restrictions. Furthermore, a total of 4000 license plates for EVs were given to car-leasing companies that intend to offer car rental services at the end of 2015. Charging piles in Shenzhen are mainly located in the charging stations and parking lots that are located in communities, work places, roadsides and other public parking spaces. The battery insurance time, which is a mandatory request, was eight years or 120,000 km in 2016. Most EV manufacturers can reach the battery warranty standard. Furthermore, 11 cities in China have already enforced driving restrictions by tail number, including Beijing, Chengdu and Lanzhou. However, Shenzhen is not included. We compare other scenarios with the base scenario to illustrate the effect of each policy, infrastructure development plan and the phase out strategy.
In the base scenario, the yearly sale of private EVs will account for 10% of the total private vehicles after 10 years and 20% after 15 years. The result is quite consistent with the goal of EV promotion in “Made in China 2025”, which is launched by the State Council of China. The plan identified the overall goal of raising the EV market share to 20% by 2025. The Shenzhen government began to promote private EVs in 2010. Therefore, if the policy and infrastructure development plan can support enough time, EVs will enter a rapid growth stage in 2020 and account for 20% of the market share in 2025.

3.2. Policy Analysis

Each column in Table 6 represents a combination of policies. A more detailed parameter setup of each scenario is listed in Table A1 in Appendix A. In Table 6 and Table A1, the parameters (in bold italics) of each column is the changing variable of each scenario.

3.2.1. Fiscal Policies

In the base scenario, EVs have purchase subsidies and do not pay parking fees and tolls. In scenario 1, the purchase subsidies of EVs is canceled. In scenario 2, EVs have to pay parking fees and tolls, as do CVs. Other parameters are as same as in the base scenario. The results are shown in Figure 4.
As shown in Figure 4, the yearly market share of EVs declines more quickly in scenario 1 than in scenario 2. Furthermore, the base scenario takes 10 years to enter the rapid growth stage. Scenario 1 takes 22 years. Scenario 2 takes 14 years. Thus, purchase subsidies have a greater effect than free parking and tolls.
For most people, subsidies are the most familiar policy in relation to EVs than other policies. The propaganda of the government and manufacturers mainly focuses on subsidy policy through the mass media. A great word of mouth effect is also generated from public discussion. People will not consider EVs as a choice without subsidies at the initial stage of EV promotion.
The effect of free parking and tolls is less significant than that of subsidies. Free parking and tolls can be seen as the subsidies given in the process of use. A lump sum purchase subsidy is more attractive than subsidies given in the process of use, since consumers are not interested in calculating cumulative subsidies, as shown in Figure 4.

3.2.2. Traffic Management Policies

In the base scenario, CVs only have purchase restrictions. In scenario 3, CVs do not have purchase restrictions or driving restrictions by tail number. In scenario 4, CVs only have driving restrictions by tail number. In scenario 5, CVs both have purchase restrictions and driving restrictions by tail number.
As shown in Figure 5, purchase restrictions and driving restrictions by tail number both have great influence on EV promotion. Comparing the base scenario with scenario 4, driving restrictions by tail number have a greater influence than purchase restrictions. It takes 18 years to enter the rapid growth stage without any restrictions on CVs. It takes at least 10 years when CVs have driving or purchase restrictions. Scenario 5 only takes five years under purchase restrictions and driving restrictions by tail number.
The influence of purchase restrictions and driving restrictions has been verified, not only in our study, but also in reality, especially the purchase restrictions. For example, the sum of private EVs in cities that have purchase restrictions takes up more than 70% of the total private EVs in China. Purchase restrictions of CVs force consumers who have an urgent need for cars to consider EVs as a substitute.
With vehicle driving restrictions by tail number on CVs, many more families would consider EVs, which can be used at any time. Since most families in China buy their first car, they have more requests for new cars than they do for updated purchases. The inconvenience of CVs can’t be ignored. Families that already have one CV would also intend to buy EVs due to the inconvenience of CVs.

3.2.3. Business Model

In scenario 6, assuming that the rental model of EVs has entered into the mature stage, the yearly market share of EVs reaches 10% after eight years. In scenario 7, we make a regulation on the lifetime battery warranty, which is the most important component of EVs. The yearly market share of EVs reaches 10% after six years. The lifetime battery warranty is more effective than the rental model, as shown in Figure 6.
Currently, some EV manufacturers try to expand the market share by promising a longer warranty period. BYD E6 provides a 100,000 km/five years battery warranty and lifetime warranty for the battery cell. In addition, the warranty standard, other standards, such as charging and key assembly, need continuous improvement to earn the trust of consumers and accelerate the development of manufacturers. In addition, although the rental model has some positive effects on EV promotion, people show little interest in renting EV for daily use. Moreover, Shenzhen is the first city to offer a time-sharing renting service of EVs since 2015. A time-sharing renting service has a limited effect on EV promotion and has developed very slowly in recent years.

3.3. The Development of Charging Infrastructure Analysis

The charging utility is drawn from three aspects: (a) the major place for charging; (b) car-to-pile ratio; and (c) the number of charging stations. This section simulated different developments of charging infrastructure. The parameter of each scenario is listed in Table 7. A more detailed parameter setup of each scenario is listed in Table A2 in Appendix A. In Table 7 and Table A2, the parameters (in bold italics) of each column is the changing variable of each scenario.

3.3.1. Charging Place

In the base scenario, the main charging places are parking lots in communities, road sides and other public places. To simplify the analysis, we assume that EVs only charge at charging stations in scenario 8. As shown in Figure 7, scenario 8 takes more than 36 years to enter the rapid growth stage, while the base scenario only takes 10 years. Thus, the charging place is the most important factor for private EV promotion.
Now, the owners of EVs can choose to charge at parking lots and parking stations. Charging in communities is the most convenient way, although many EV owners face the dilemma of residential properties refusing to install a charging pile. On the one hand, many old districts do not set aside the original location for the installation charge piles, and, on the other hand, residential property managers refuse to help solve the charging pile problem for security reasons.

3.3.2. Car-to-Pile Ratio

In scenario 9, we propose a strong public charging pile construction plan according to a car-to-pile ratio of 1:2. In the base scenario, the ratio is 1:1.5. In scenario 10, the ratio is 1:1.
As shown in Figure 8, the charging pile construction is critical to EV promotion. In scenario 9, EVs enter the rapid growth stage after 6 years. However, it takes 22 years in scenario 10. A weak charging pile construction will significantly slow down the promotion of EVs.

3.3.3. The Number of Charging Stations

In scenario 11, we propose a strong construction plan of 30 public charging stations per year, which is 20 in the base model. In scenario 12, we assume that the increase of charging stations is 10 stations per year.
As shown in Figure 9, the increase rate of public charging stations will not significantly influence EV promotion. For private users, a long charging time prevents private EV drivers going to public charging stations. They prefer charging in the parking lots of communities, on the roadside and in other public places. Furthermore, the charging piles in parking lots are much more noticeable than charging stations that are always located in an out-of-the-way place.
In the absence of breakthrough battery technology, the charging piles in parking lots are more popular than charging stations. From the experience of Israel and Japan [48,49], the charging piles located in parking lots and communities have a higher use-frequency than charging stations. The utilization of the existing charging stations in Shenzhen is quite low, and charging piles age quickly without use. In the long term, charging piles in parking lots will dominate the charging infrastructure in China. Thus, we suggest that the government pay more attention to the promotion of charging pile construction in parking lots to maximize the utilization of charging facilities. The government should improve the charging infrastructure, not only in new communities, but also in old ones. We also suggest charging piles in roadside parking spaces, which are more noticeable for the public than indoor parking lots.

3.4. Critical Duration Time of Policies

A successful policy would not only create a boost of EVs and infrastructures, but would also make the EV market become self-sufficient, after incentive policies are withdrawn. The critical duration time is an indicator (T*) of EV market diffusion becoming self-sufficient. To simplify the model, we assume that all policies end after the critical duration time (T*).
We conduct a series of simulations with different duration times to observe the yearly market share of EVs, as shown in Figure 10. The critical duration time (T*) for the marketing diffusion of EVs is 11 years, when the yearly marketing share of EVs is more than 11%.
The central government of China aims to gradually cut the purchase subsidies before 2020. Scenario 13 (S-13) simulated the gradual removal of subsidies in Shenzhen. As shown in Figure 11, EV promotion in scenario 13 will enter the rapid growth stage after 14 years, while in the base scenario, only 10 years are required. The gradual removal will not lead to the failure of EV promotion but rather delay the promotion process in Shenzhen. However, most cities in China do not have purchase restrictions. We are also curious about the effect of cutting subsidies on cities that do not have purchase restrictions. Scenario 14 (S-14) simulated the gradual removal of subsidies, without purchase restrictions. In scenario 14, EVs will not enter the rapid growth stage in 50 years. Cutting purchase subsidies has a totally different effect under different policy combinations.

4. Discussion

4.1. Conjoint Analysis

Previous conjoint analysis research mainly focuses on vehicle attributes (e.g., costs, driving range, refuel or charging time, fuel type, body type, engine displacement, brand) to explore consumer preference for AFVs, without considering policies and the charging infrastructure. Lebeau et al. find that the up-take of EVs is most sensitive to vehicle prices, the energy price and the pace of technological improvement (e.g., driving range) [38]. Ahn find that gasoline-fueled cars will still be most consumers’ first choice [35]. Helveston et al. find that Chinese consumers are more willing to adopt battery electric vehicles than American consumers [36]. Most previous research find that CVs are still most consumers’ choices because they only focus on vehicle attributes without considering policies and the charging infrastructure.
Unlike previous research, conjoint analysis in this research focuses on qualitative factors, such as regulations (e.g., driving and purchase restrictions), operation subsidies, charging places, the rental model and the battery warranty. Due to regulations, policies and the charging infrastructure are critical factors regarding EV promotion. Moreover, a conjoint analysis and a discrete choice model are incorporated into an SD model. We can further test the effect of specific factors. The results show that subsidies, driving restrictions and purchase restrictions can effectively attract consumers to adopt EVs. Conjoint analysis of other countries should add more factors, such as policies, infrastructures, socio-demographic factors, the lifestyle and the environmental awareness [50,51,52].

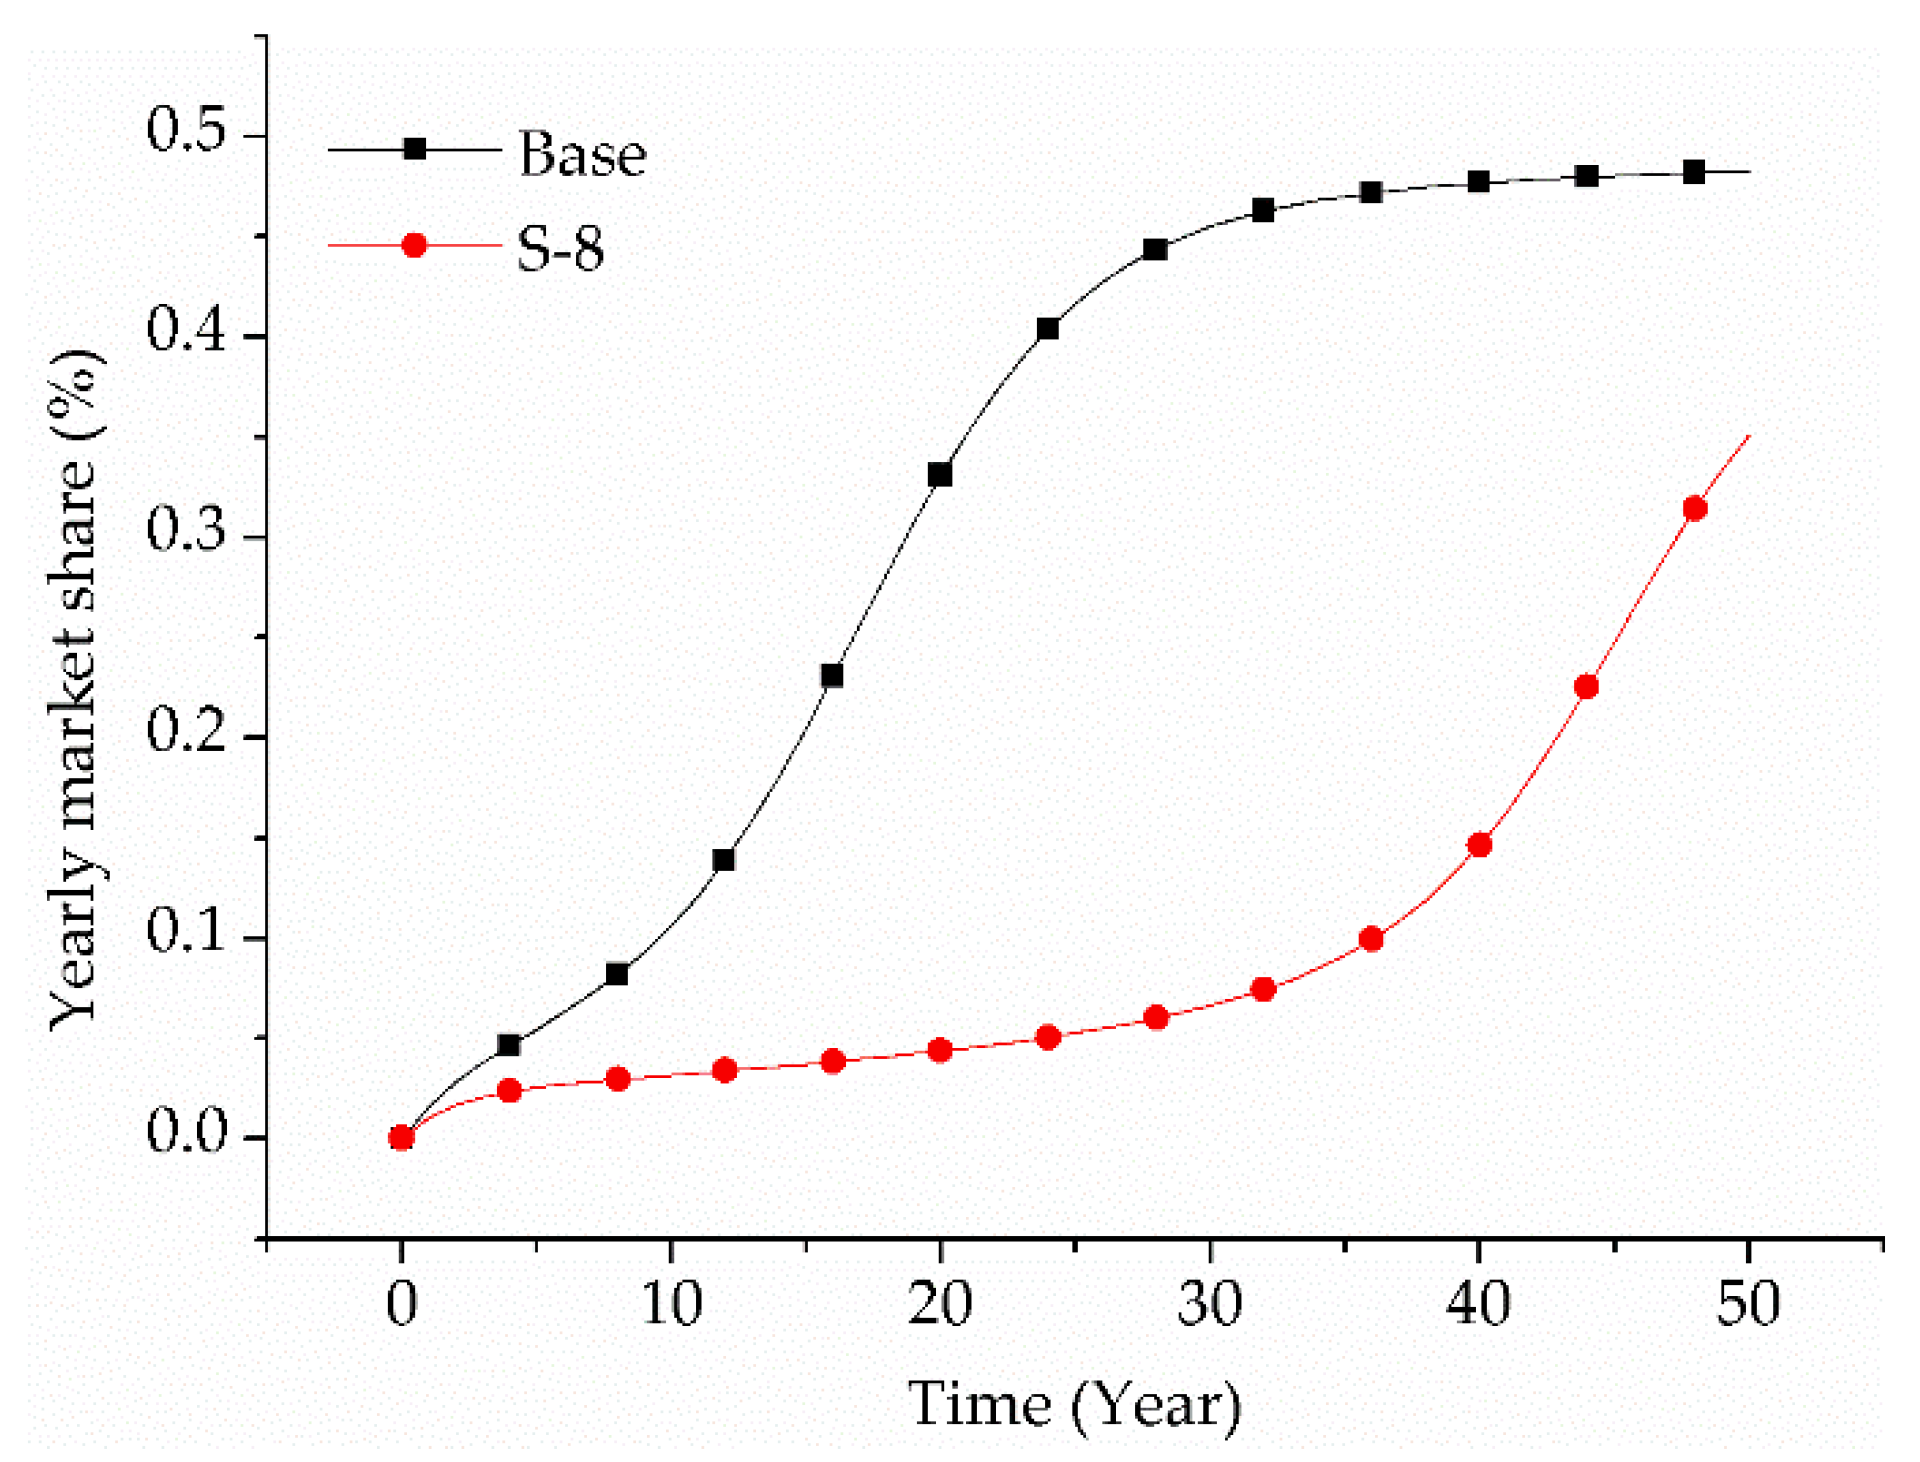
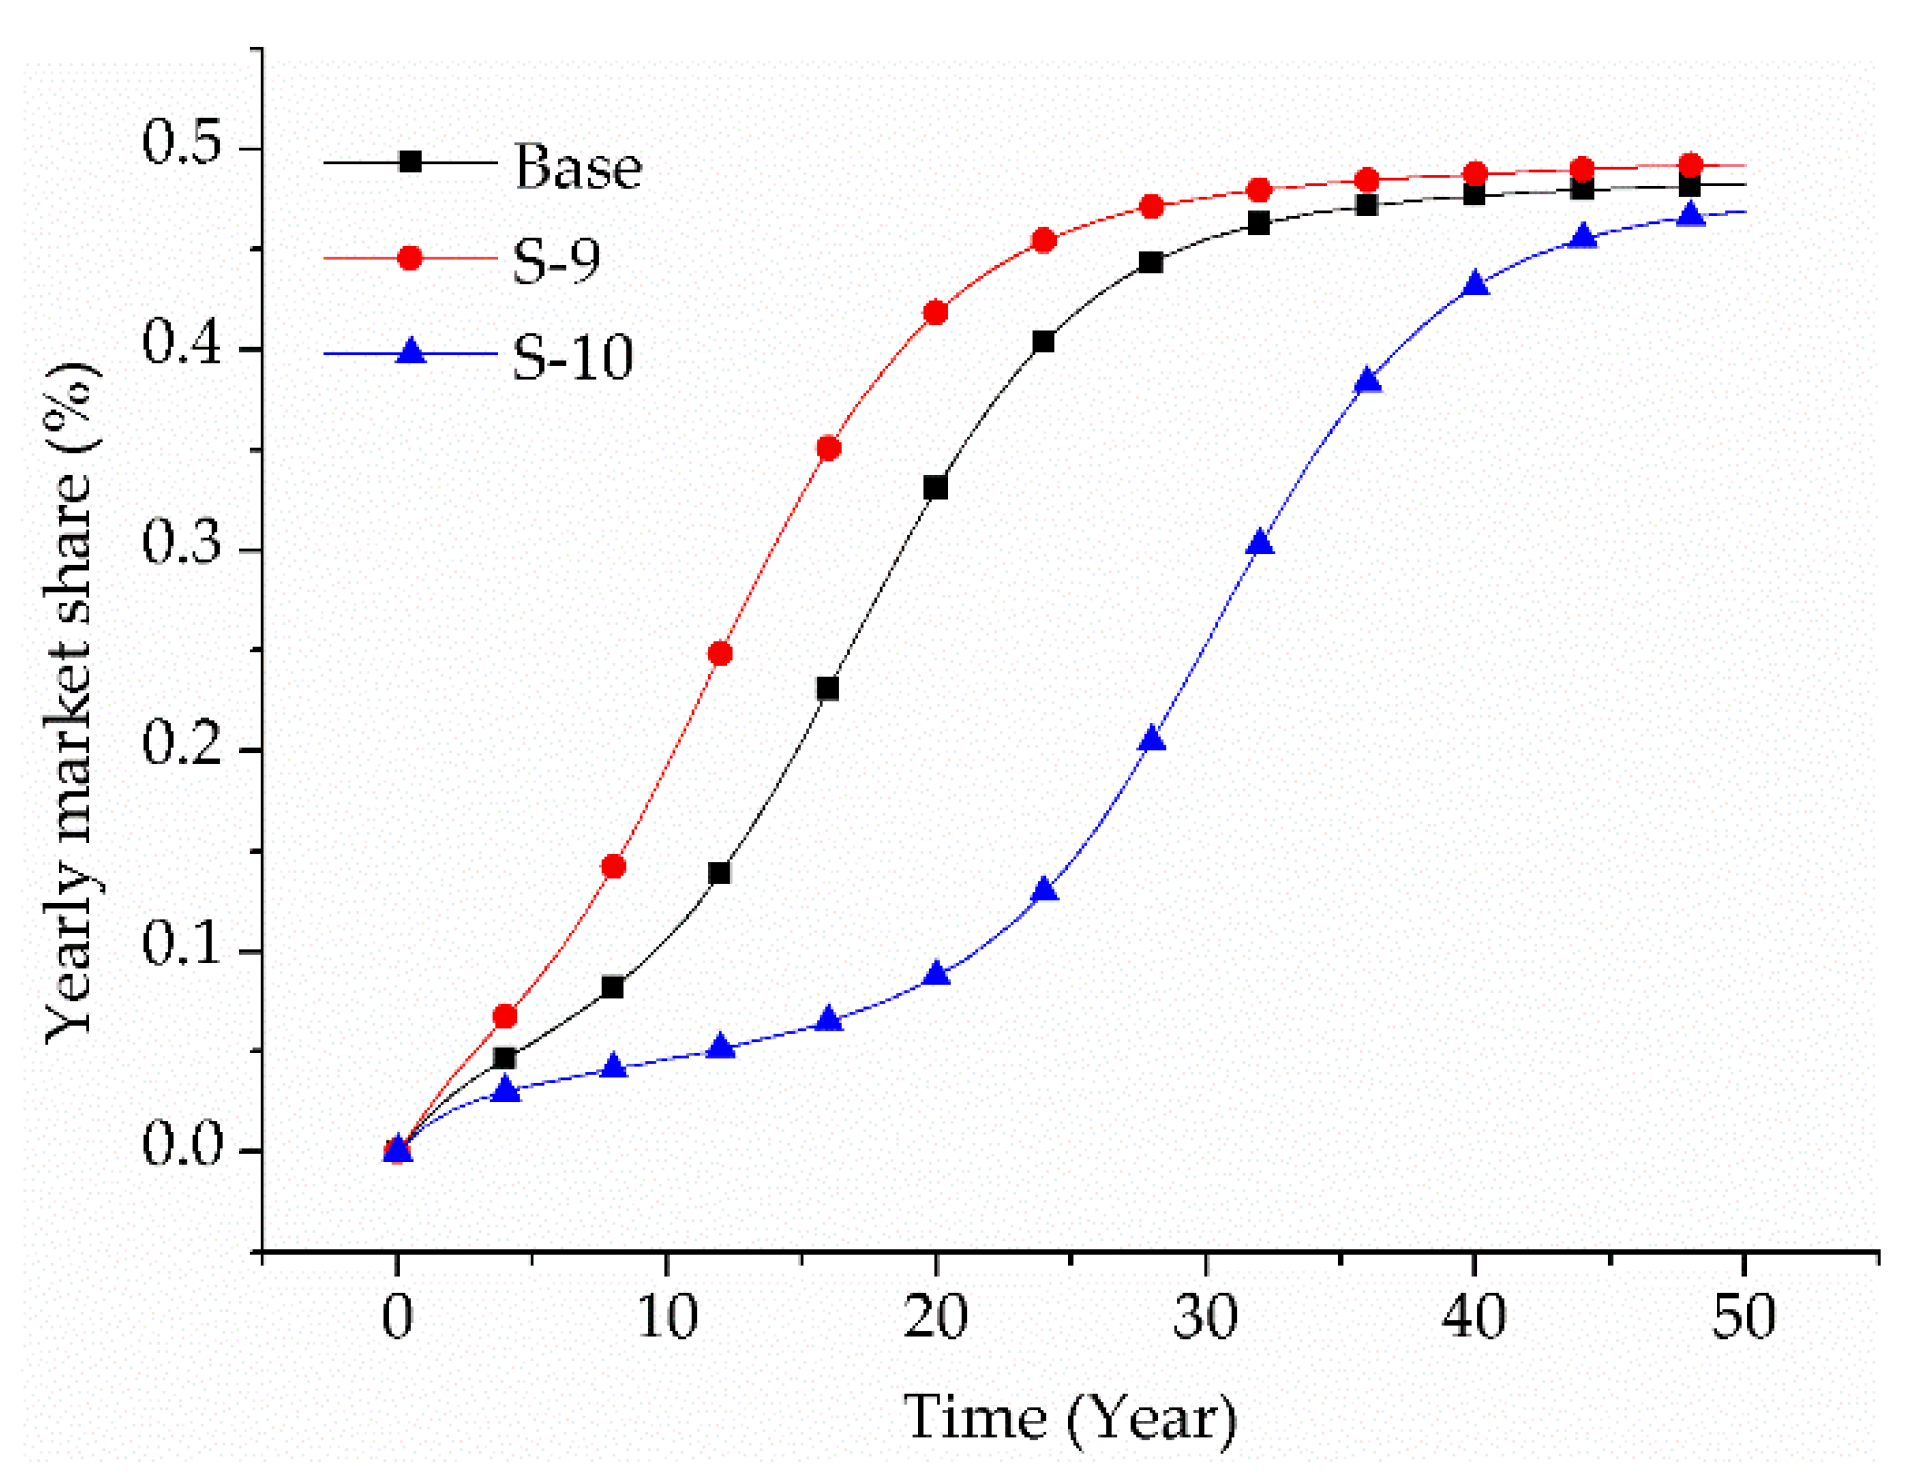
4.2. The Effects of Fiscal Policies

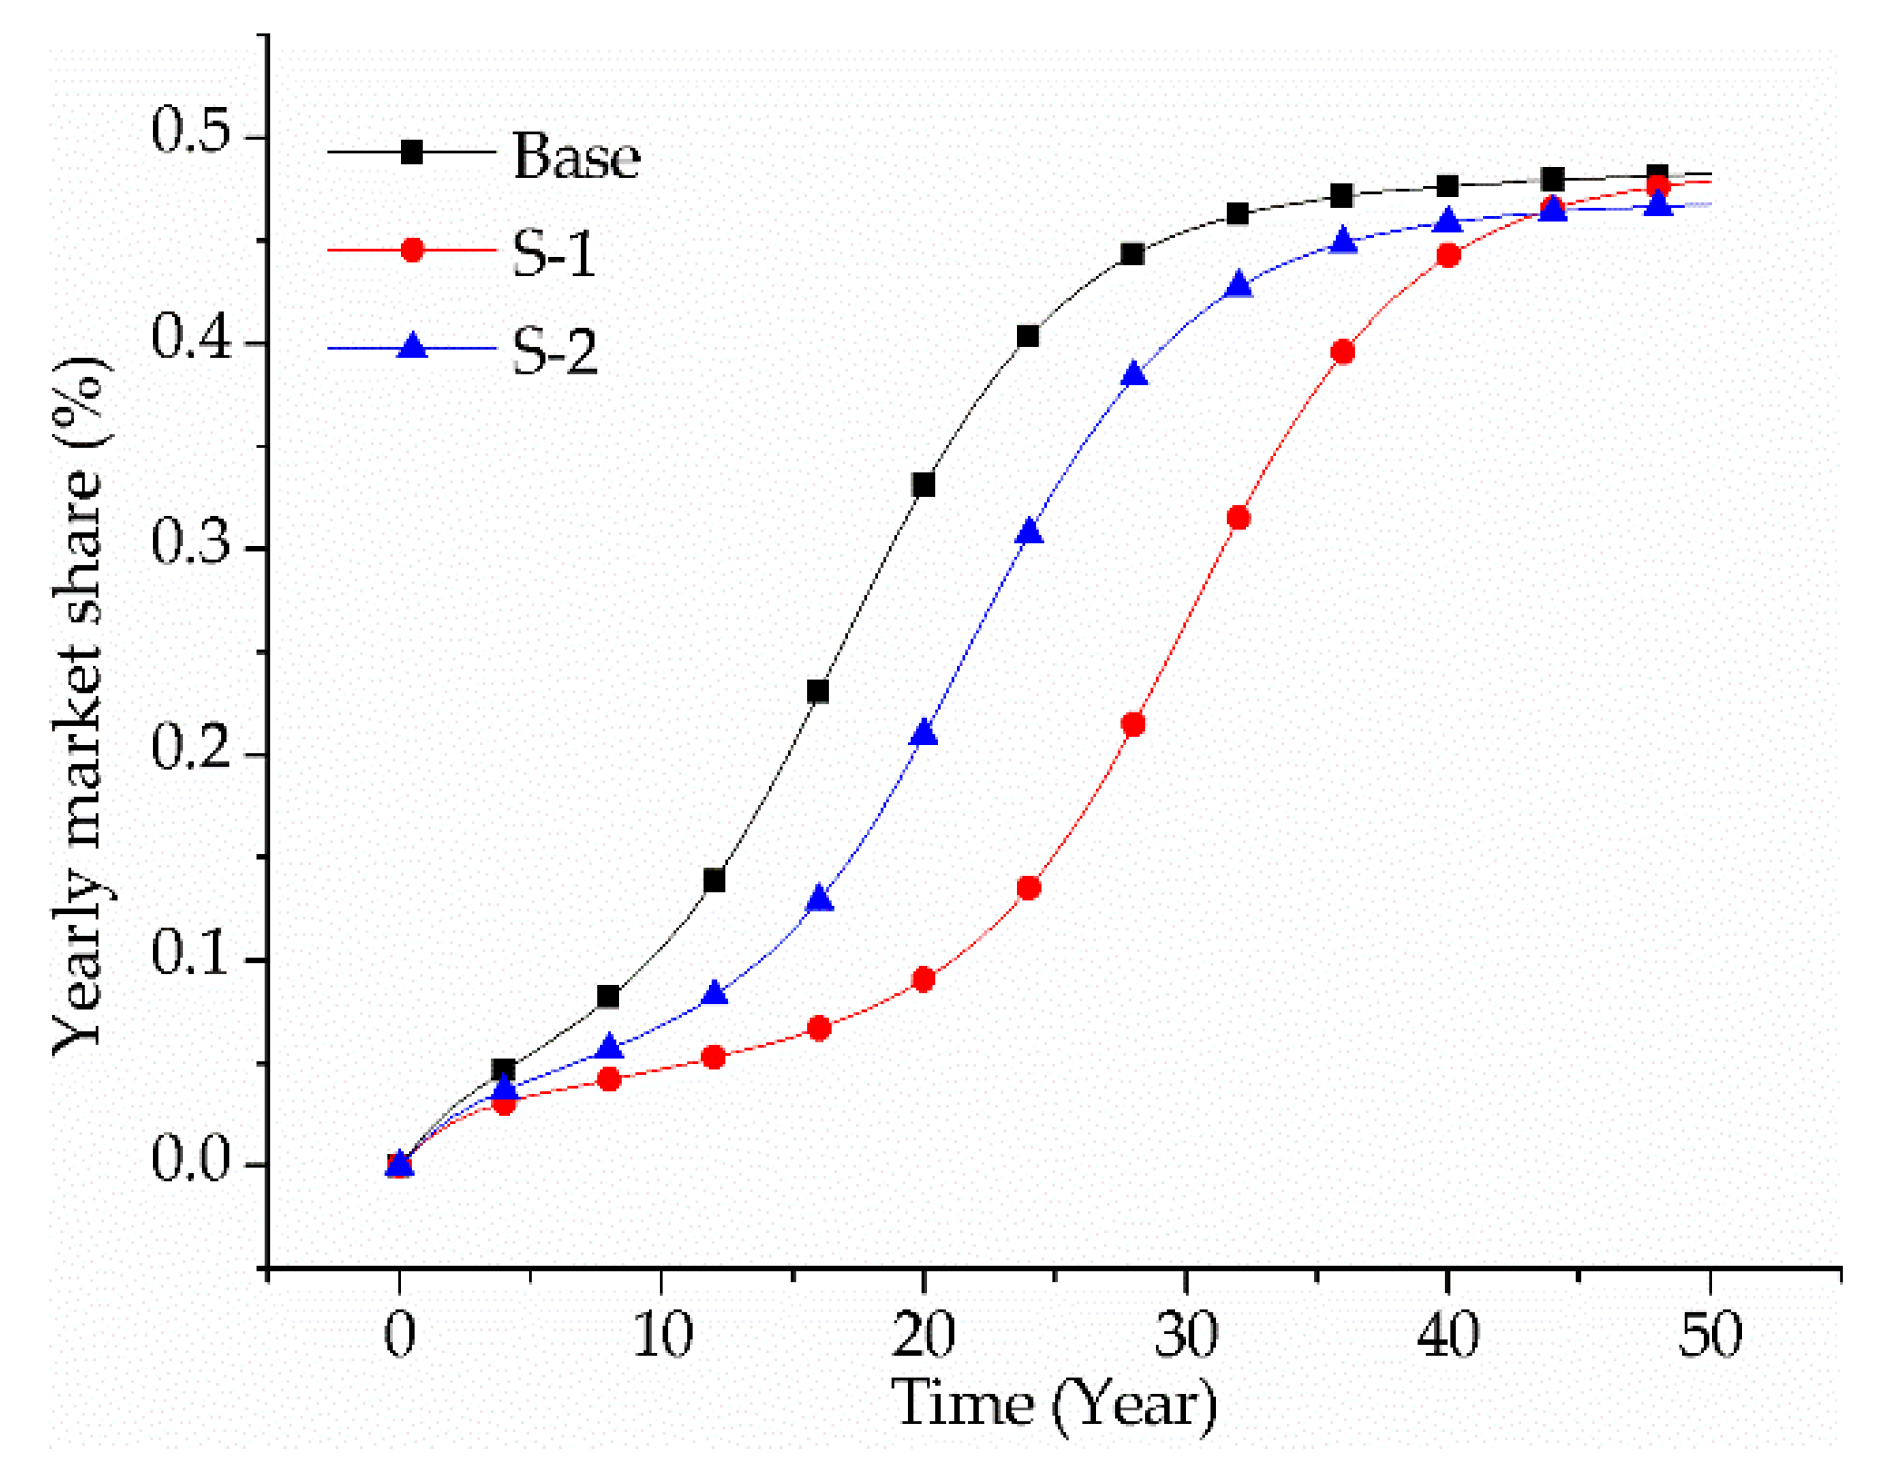
In Shenzhen, it takes 10 years for EVs to enter the rapid growth stage with purchase subsidies in the base scenario. Without purchase subsidies, it takes 22 years. In particular, the gradual removal of purchase subsidies will lead to a four-year delay of the rapid growth stage, although it will not lead to the failure of EV promotion in Shenzhen. However, cutting purchase subsidies in cities that do not have purchase restrictions will prevent EVs entering the rapid growth stage in 50 years.
Purchase subsidies are still the key factor for EV promotion in China. This is very much in line with previous research in Austria, German, Switzerland, EU, Italy and Norway [22,26,31,44,53,54,55,56,57,58], which suggests that up-front price reduction is the most powerful incentive in promoting AFV adoption. However, literature pays little attention to the effect of the phase out strategy of subsidies. In addition, China, Norway, Denmark, U.S. and many other countries plan to trim subsidies of EVs in next few years. Thus, it is essential to evaluate the effect of cutting subsidies, which may delay the EV diffusion.
Moreover, cutting subsidies has both positive and negative effects. On the one hand, the government hopes to eliminate the subsidy-reliant companies and speed up industrial integration by cutting EV subsidies [14]. Manufacturers are also forced to reduce costs and accelerate technology improvement. On the other hand, cutting subsidies hits EV penetration and causes an uncertainty influence on EV promotion. Thus, both the central and local governments should adjust policies according to the policy combination, the EV promotion and the industrial development. Government can lessen the negative effect of cutting subsidies by implementing other policies, such as a longer battery warranty and better charging infrastructure. The SD model contributes to test the response of EV diffusion system when policies change.

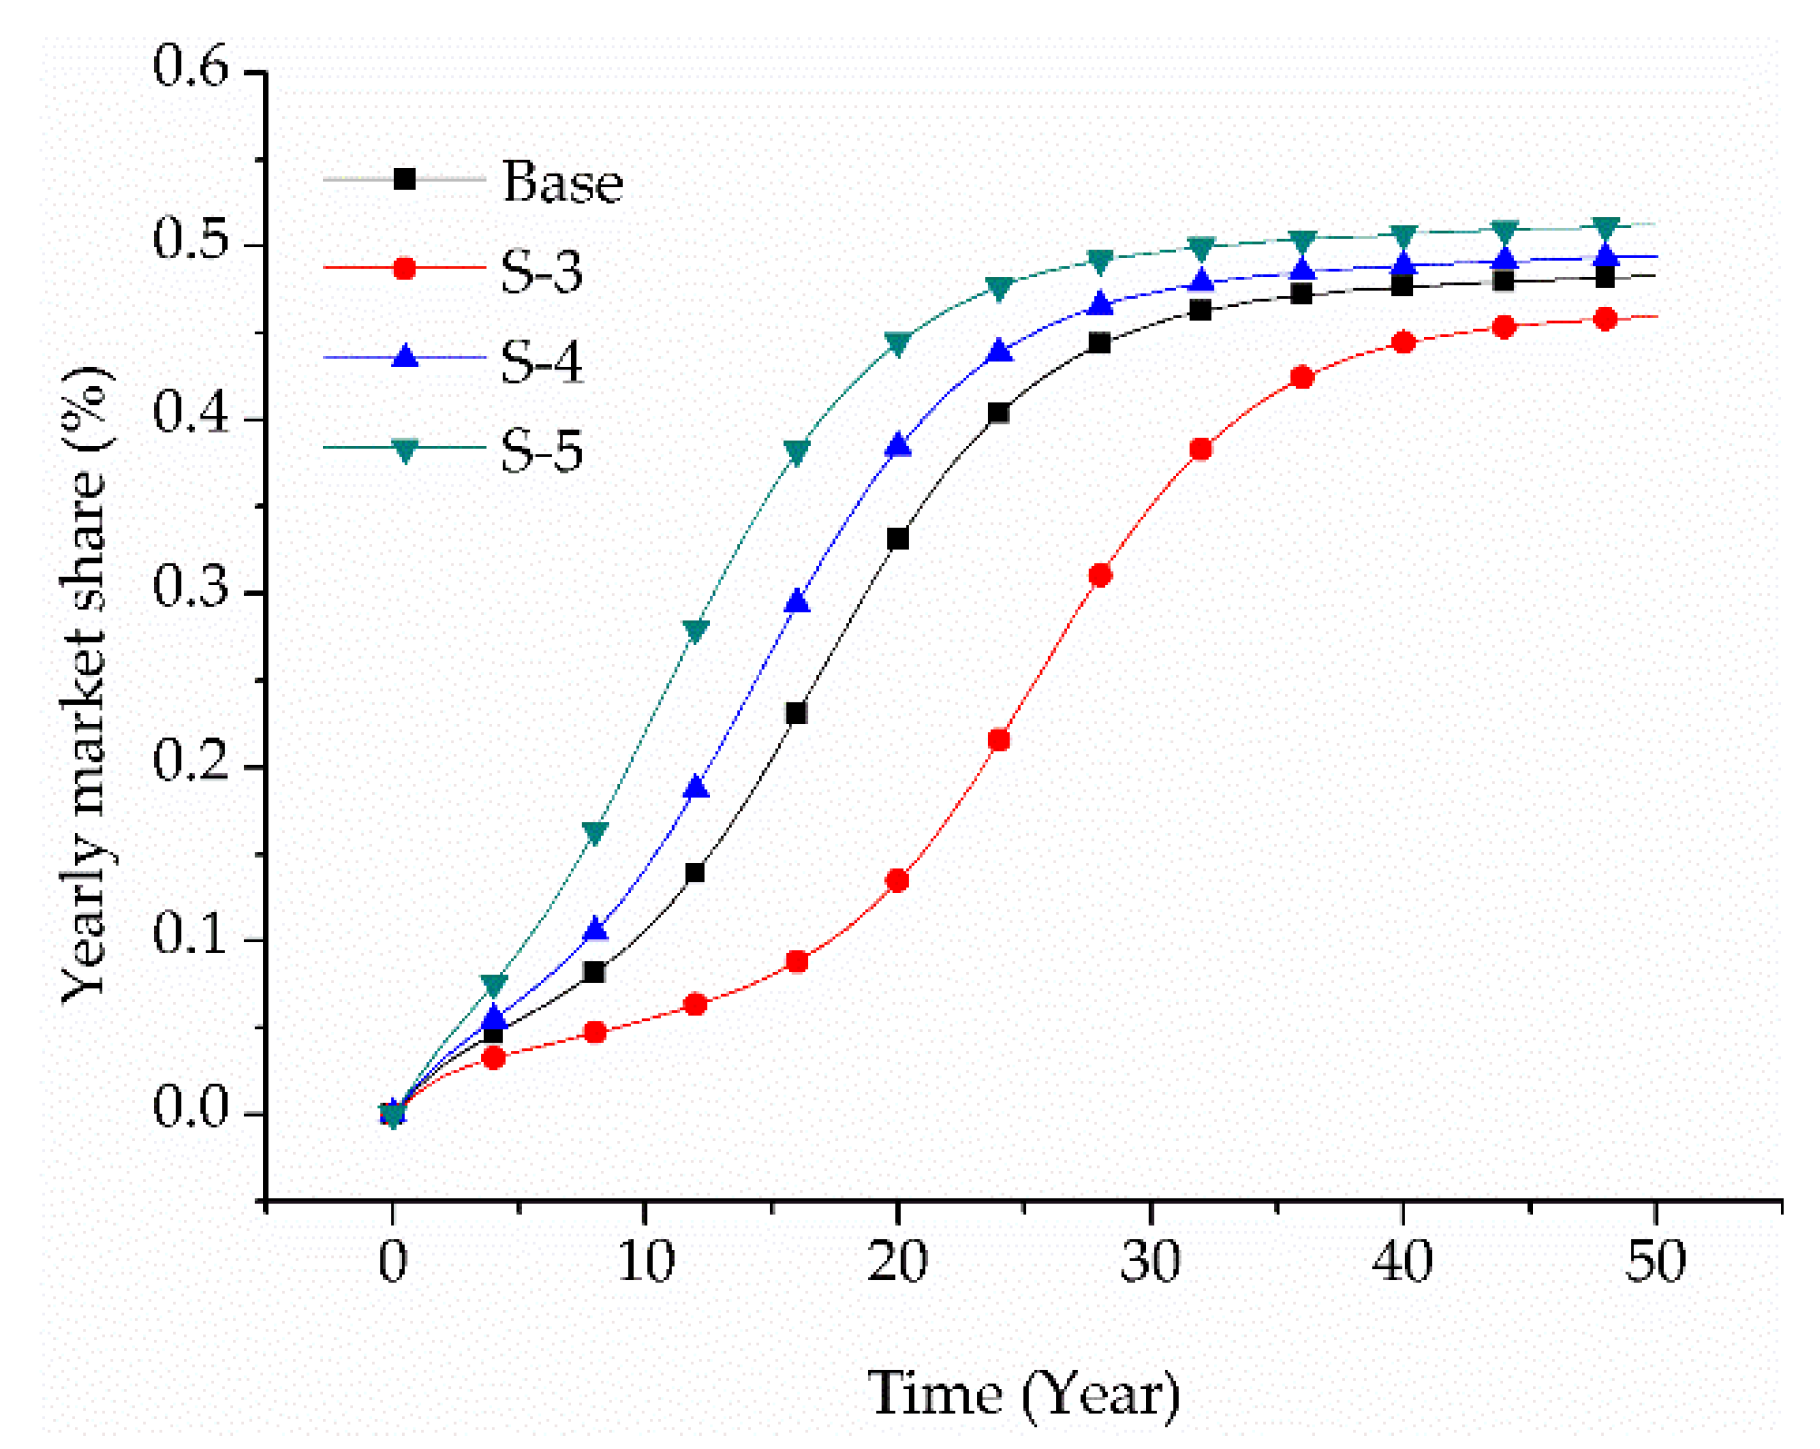
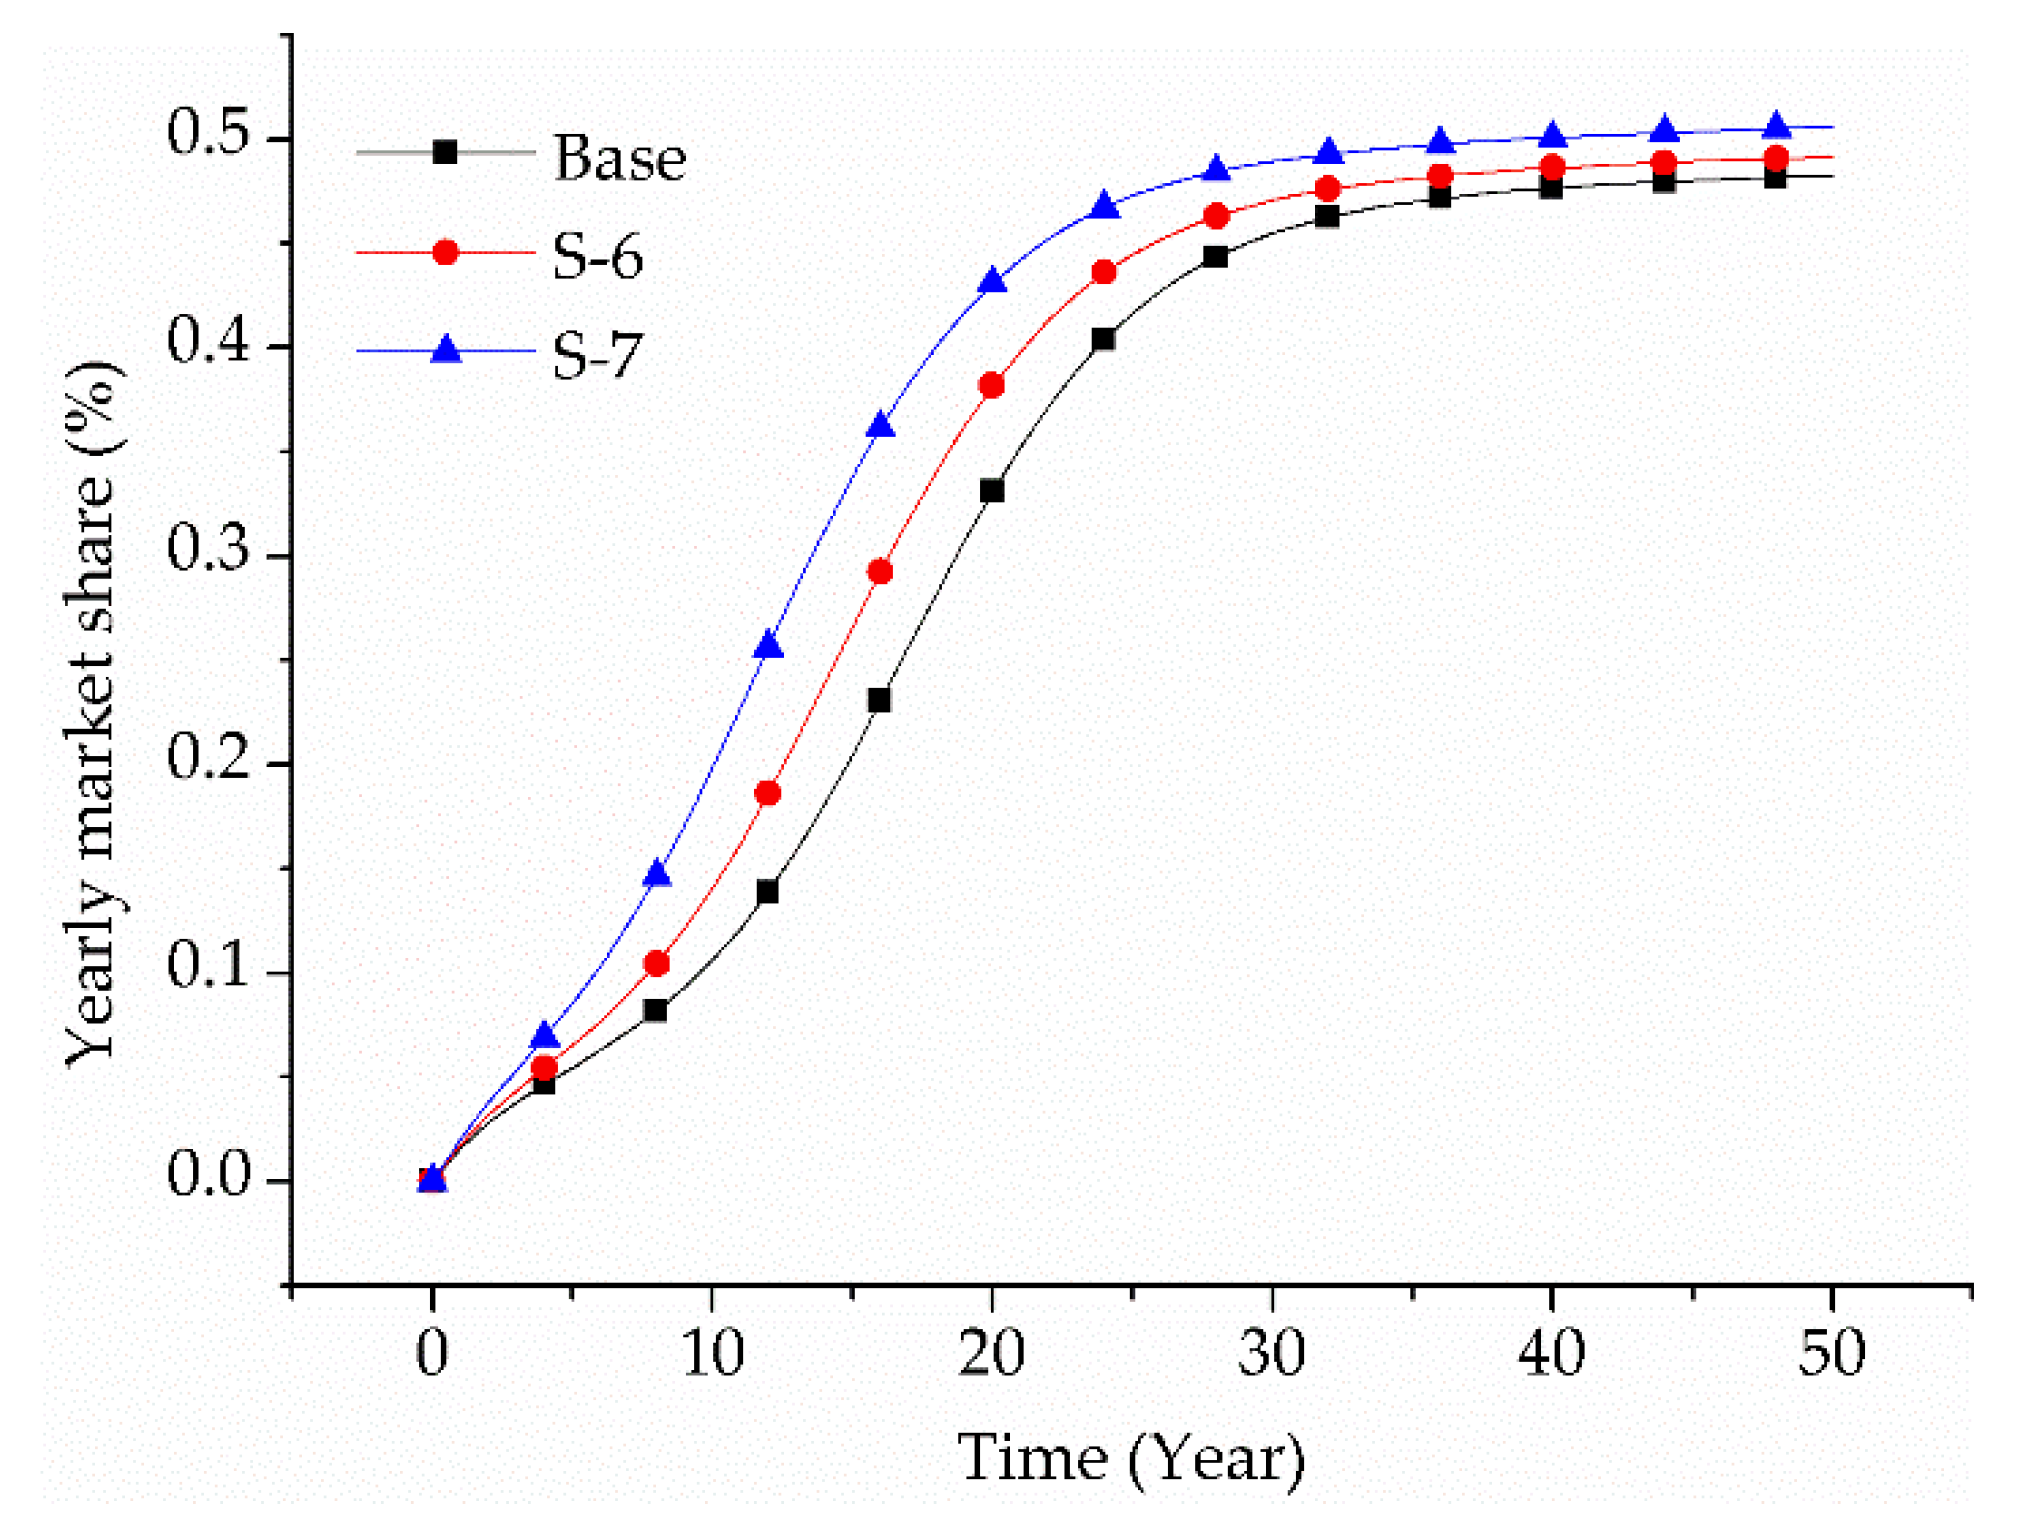
4.3. The Effects of Charging Infrastructure

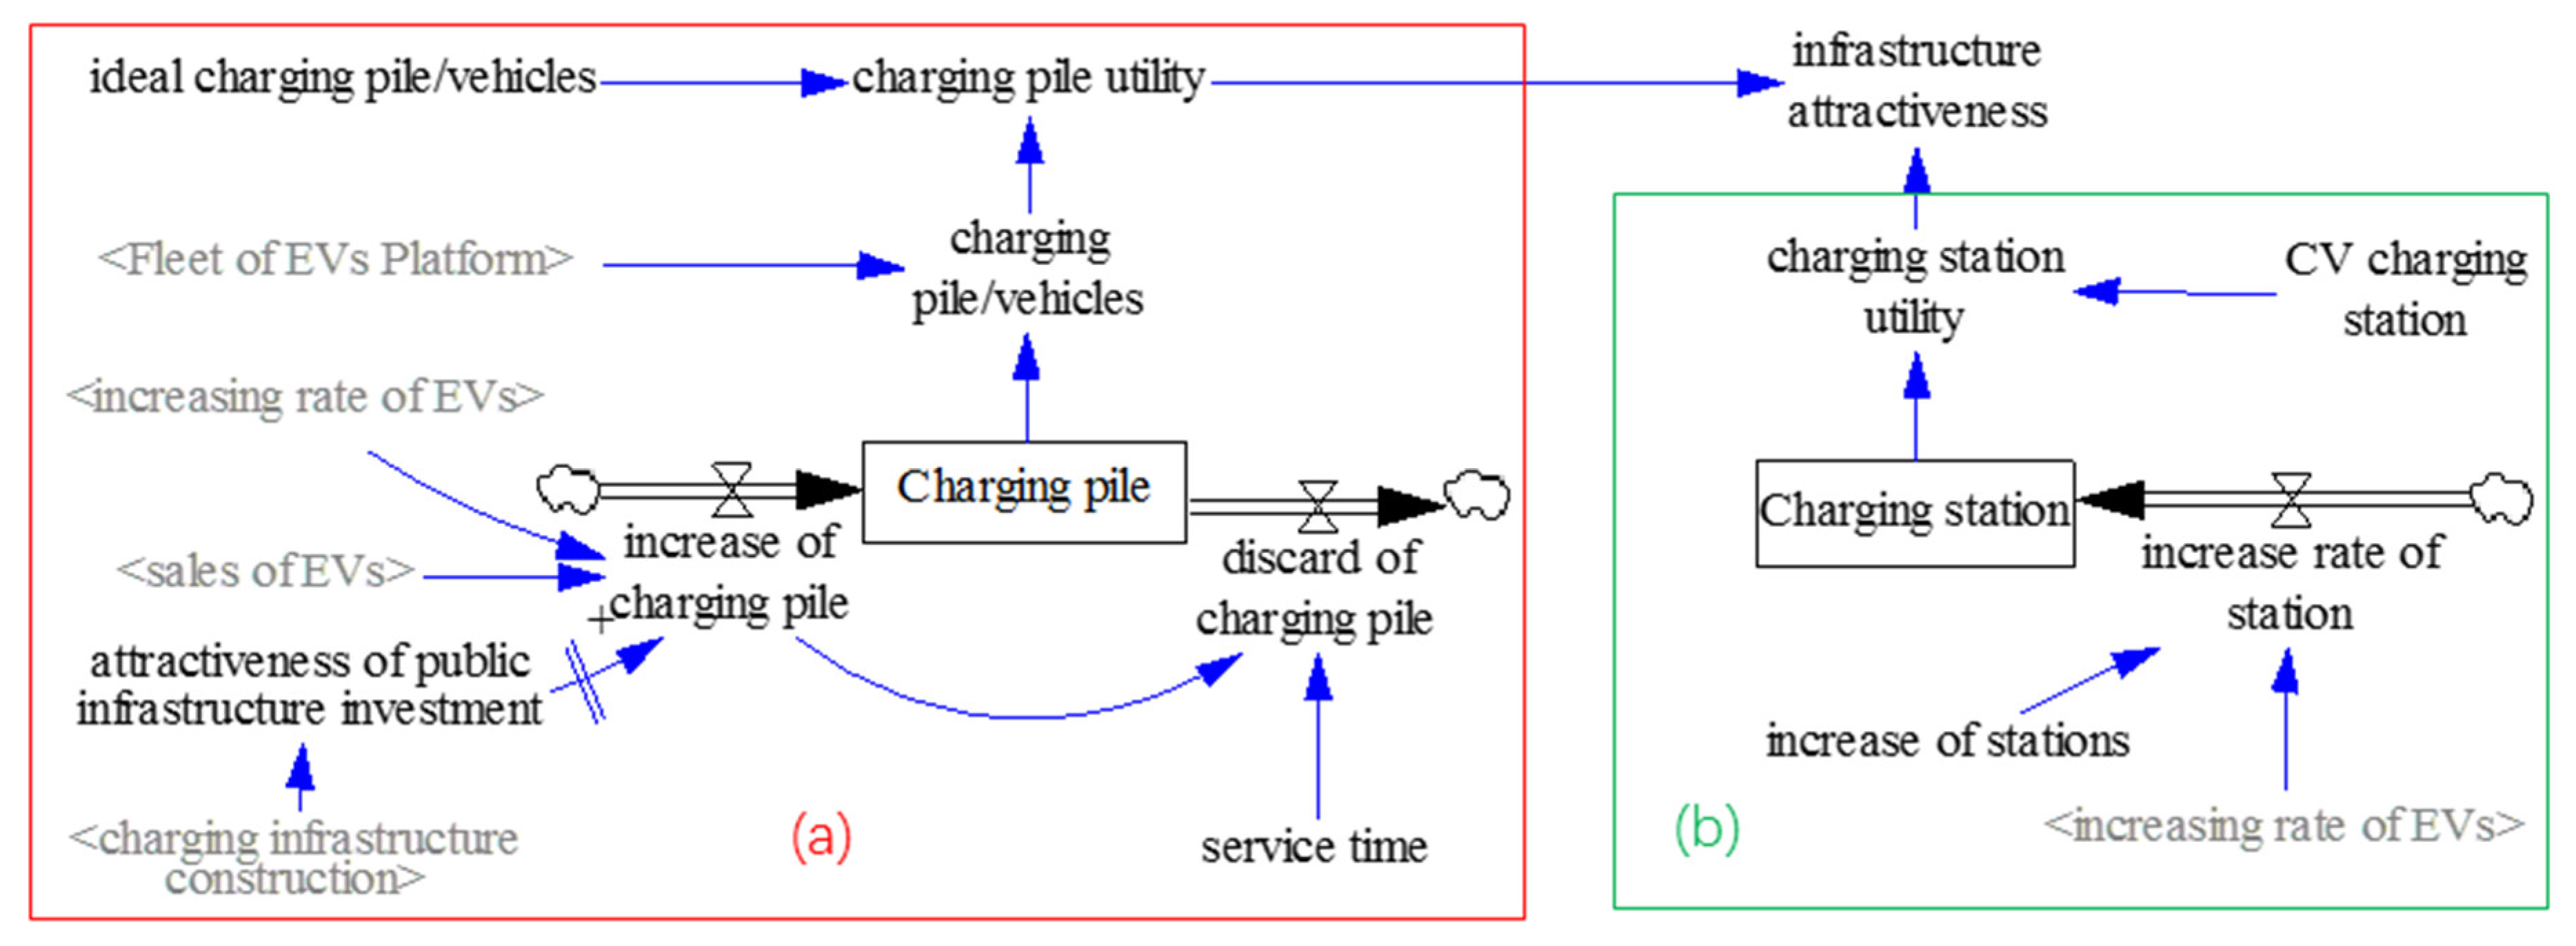
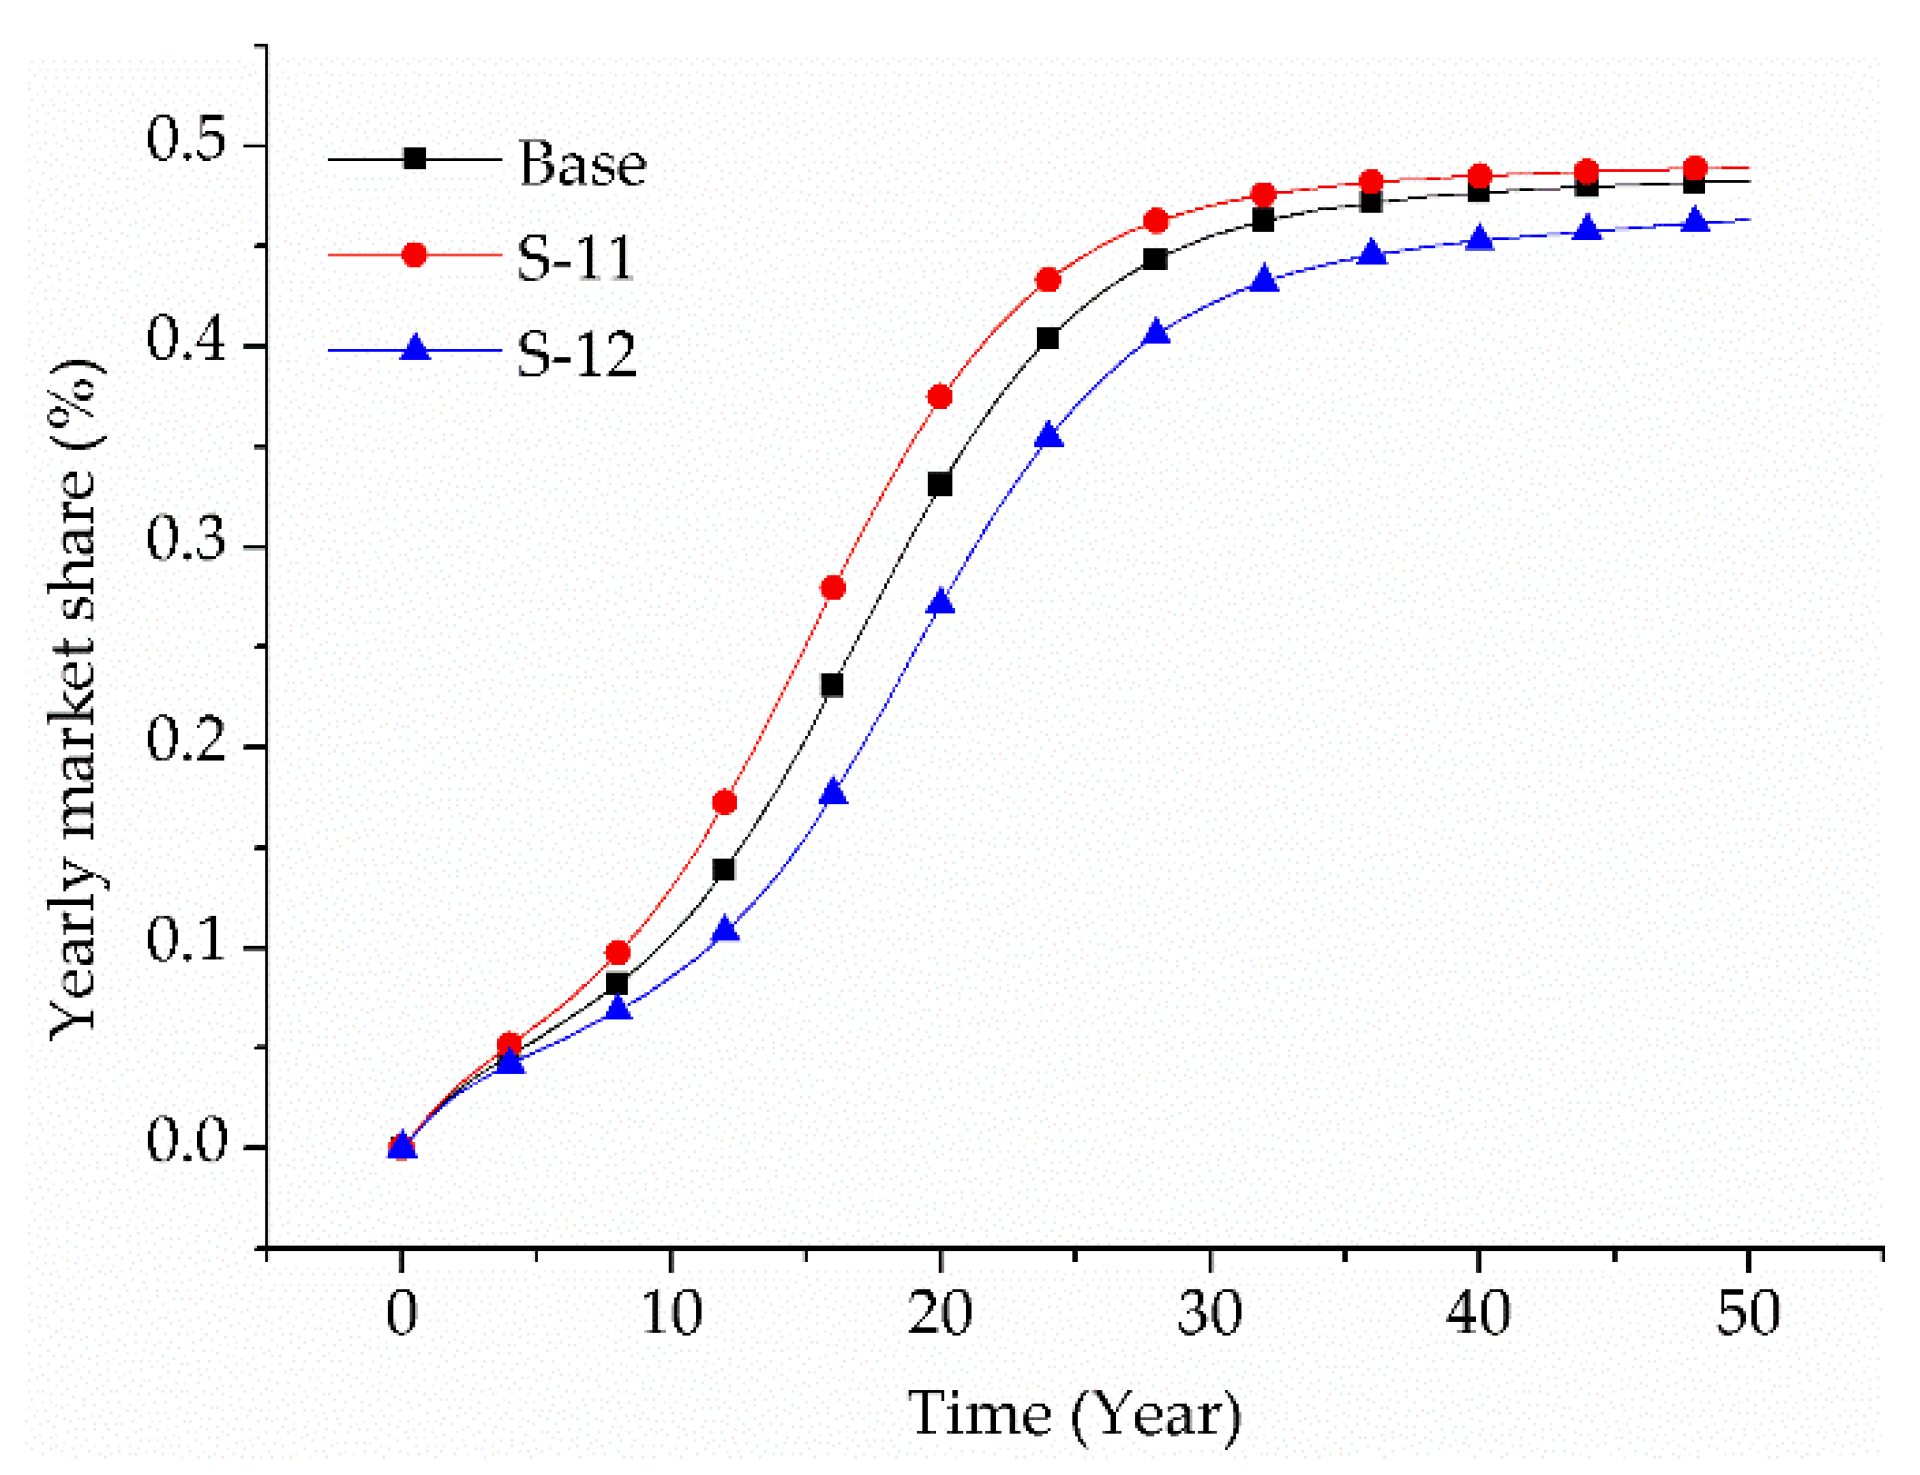
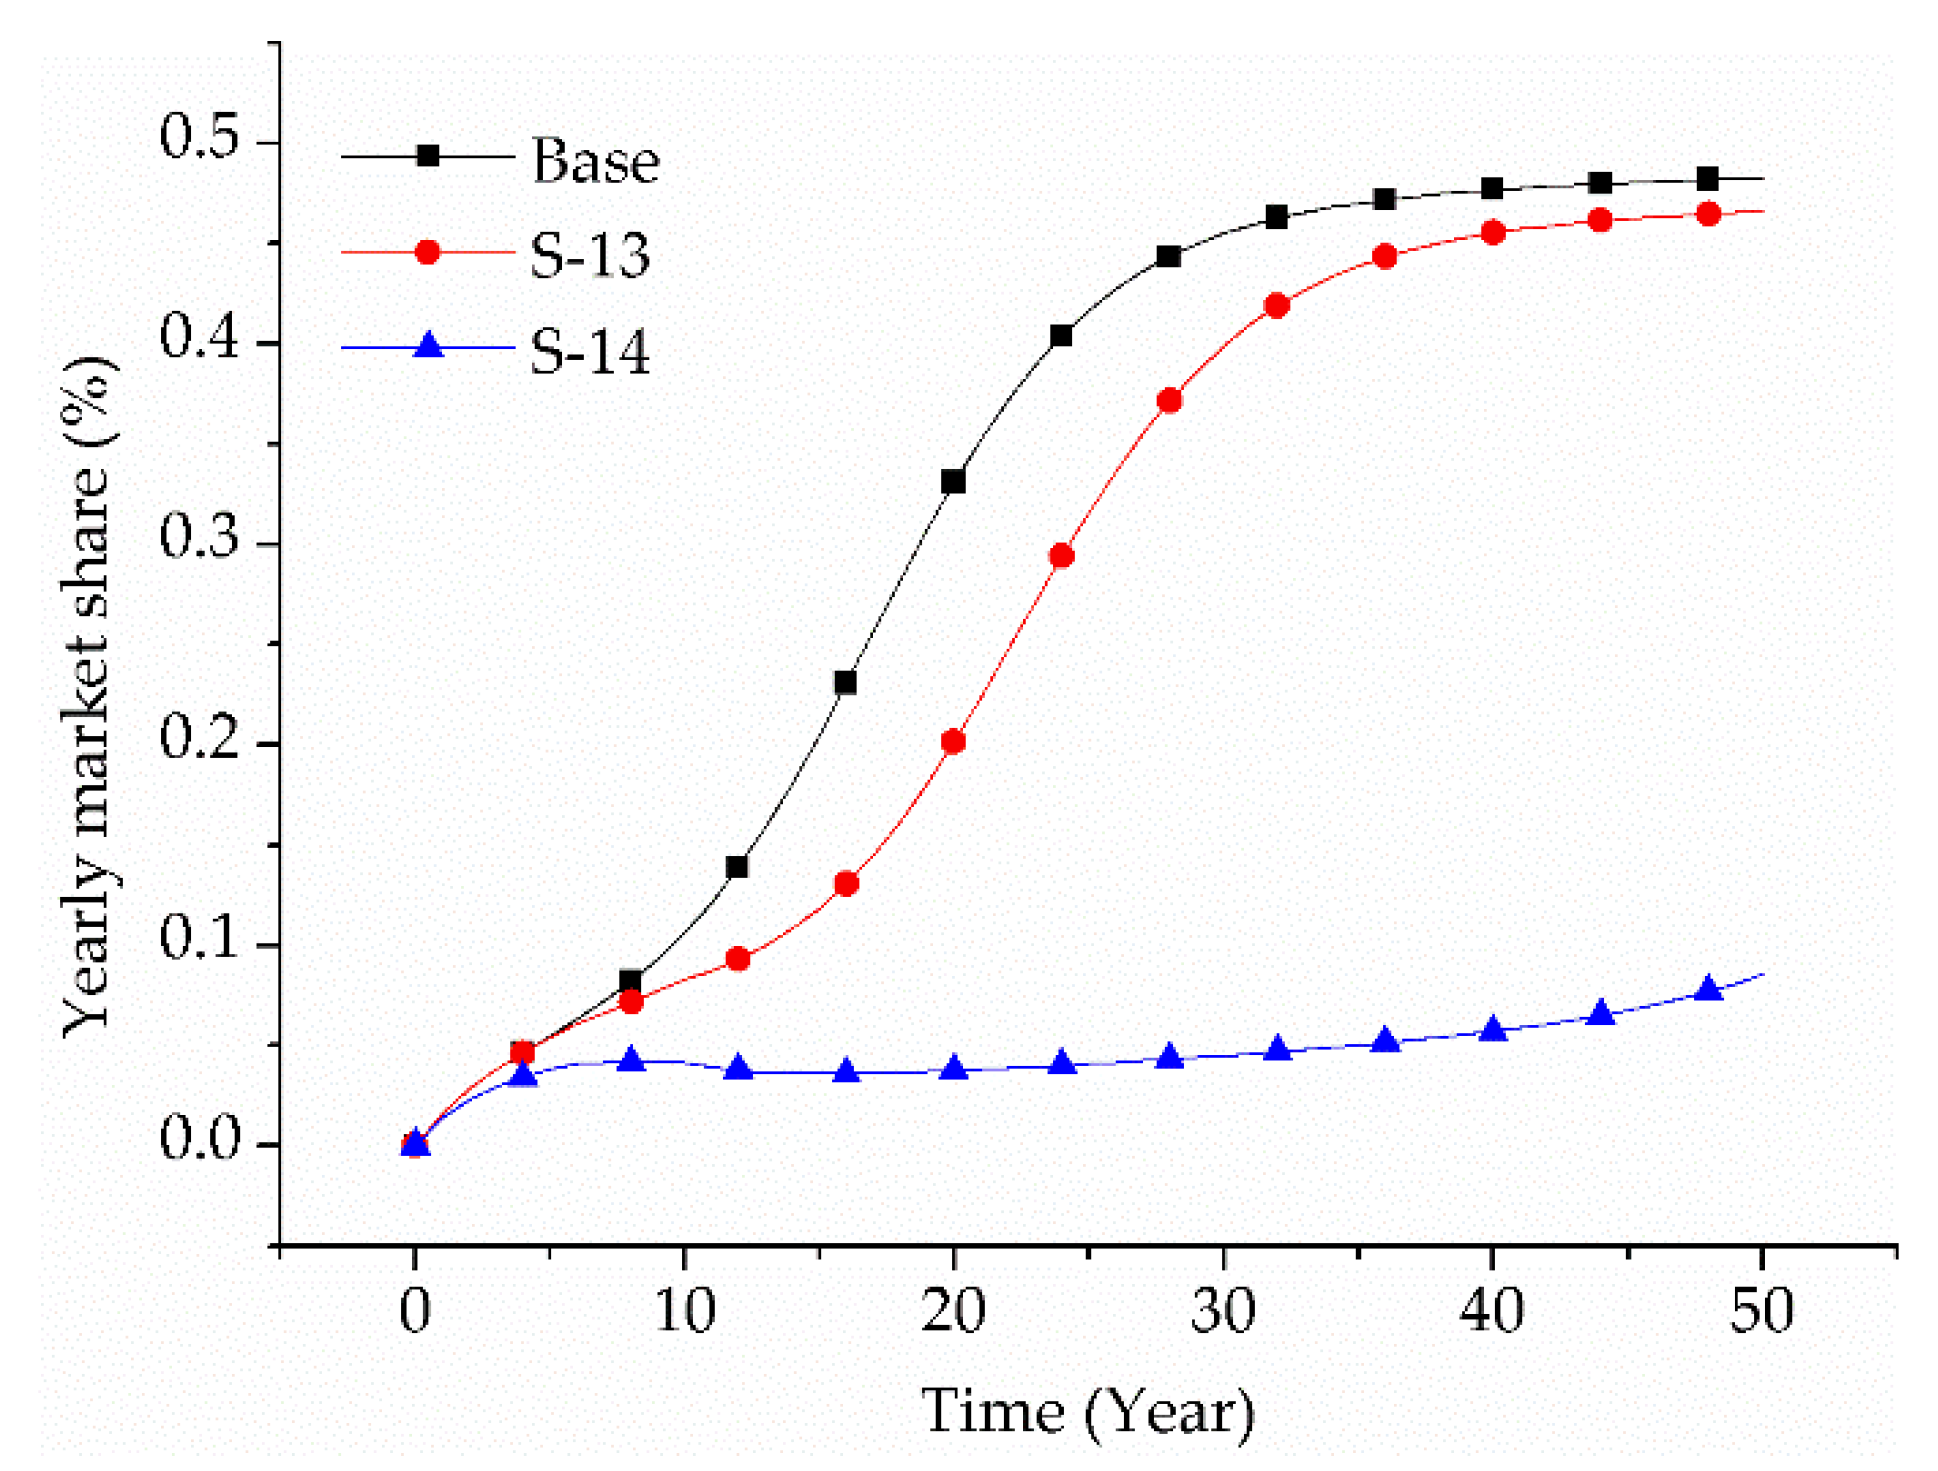
As for the charging infrastructure aspect, charging piles and their location are more important than charging stations, which is neglected by previous research. Charging piles in communities, roadsides, work places, and other parking places are much more important than charging stations for private EV users. Because private EV drivers are reluctant to charge far away. Literature also emphasizes that the installation of a charging network on freeways is an absolute necessity [5,17,57]. Moreover, the proper rate of EVs and charging piles is 1:1.5.
This research also answered the chicken-and-egg problem. The government must take the initiative to promote the infrastructure development because charging enterprises are not willing to construct charging infrastructure without incentive policies due to the low driving force of current EVs. The government should place more emphasis on the construction of charging piles, especially in the parking lots of old communities. Before 2016, the Chinese government put more emphasis on the construction of large charging stations. However, these charging stations are not entirely used and depreciate quickly, which generates a great amount of waste. Now, the Chinese government is turning to the construction of charging piles.
Moreover, EVs grow rapidly when fiscal incentives and the charging infrastructure were both supported [6,41,59]. All of the leading countries in AFV promotion offer a great amount of purchase subsidies and heavily invest in charging or refueling infrastructure, such as U.S., Japan, U.K., Norway, German, and China. In particular, Nissan reported that Japan has 40,000 car chargers compared to 34,000 gas stations [60]. Analyzing the process of EV diffusion in these countries, subsidies have little effect, if there are very few charging facilities.
To promote private EVs, other countries and other research should focus on charging pile construction and pay more attention to their locations.

4.4. The Effects of Regulations

In addition, fiscal policies and the charging infrastructure, regulations also play an important role in EV promotion [34,36,50,61]. As shown in scenario analysis, implementing purchase or driving restrictions on CVs will boost EVs within 10 years. Moreover, driving restrictions are more effective but less controllable than purchase restrictions. With driving restrictions, more families would consider EVs for their first car, since EVs can be used most of the time. Families that already have a CV would also intend to buy an EV due to the inconvenience of CVs. Thus, without purchase restrictions, driving restrictions will lead to more redundant purchases, which will increase traffic congestion. Driving restrictions are also difficult to remove because of traffic congestion. Thus, driving restrictions are more effective, although purchase restrictions are more controllable in relation to the promotion of EVs and control of traffic congestion. Purchase restrictions effectively force consumers, who have a strong demand for vehicles, to consider EVs as a substitute, since the success rate of the license plate lottery is currently lower than 1% in Shenzhen. Eight cities that have purchase restrictions take up more than 70% of the total private EV sales in China [16].
Moreover, the banning regulation in Brazil increase the diffusion rate [19]. Some European countries also focuses on punishments for the use of high emission vehicles, which also helps to promote EVs, such as Finland, France and U.K. [62,63,64]. Accommodation lane access also promote EVs in the U.S. [36], Norway [55,56] and Germany [25].
Other countries can adopt purchase restrictions and driving restrictions according to their traffic conditions. China can also adopt other countries’ regulations to promote EVs, such as punishments for the use of high emission vehicles and accommodation lane access. Moreover, this research suggests to apply conjoint analysis to quantify the effect of regulations for future research.

4.5. Simulation Parameters

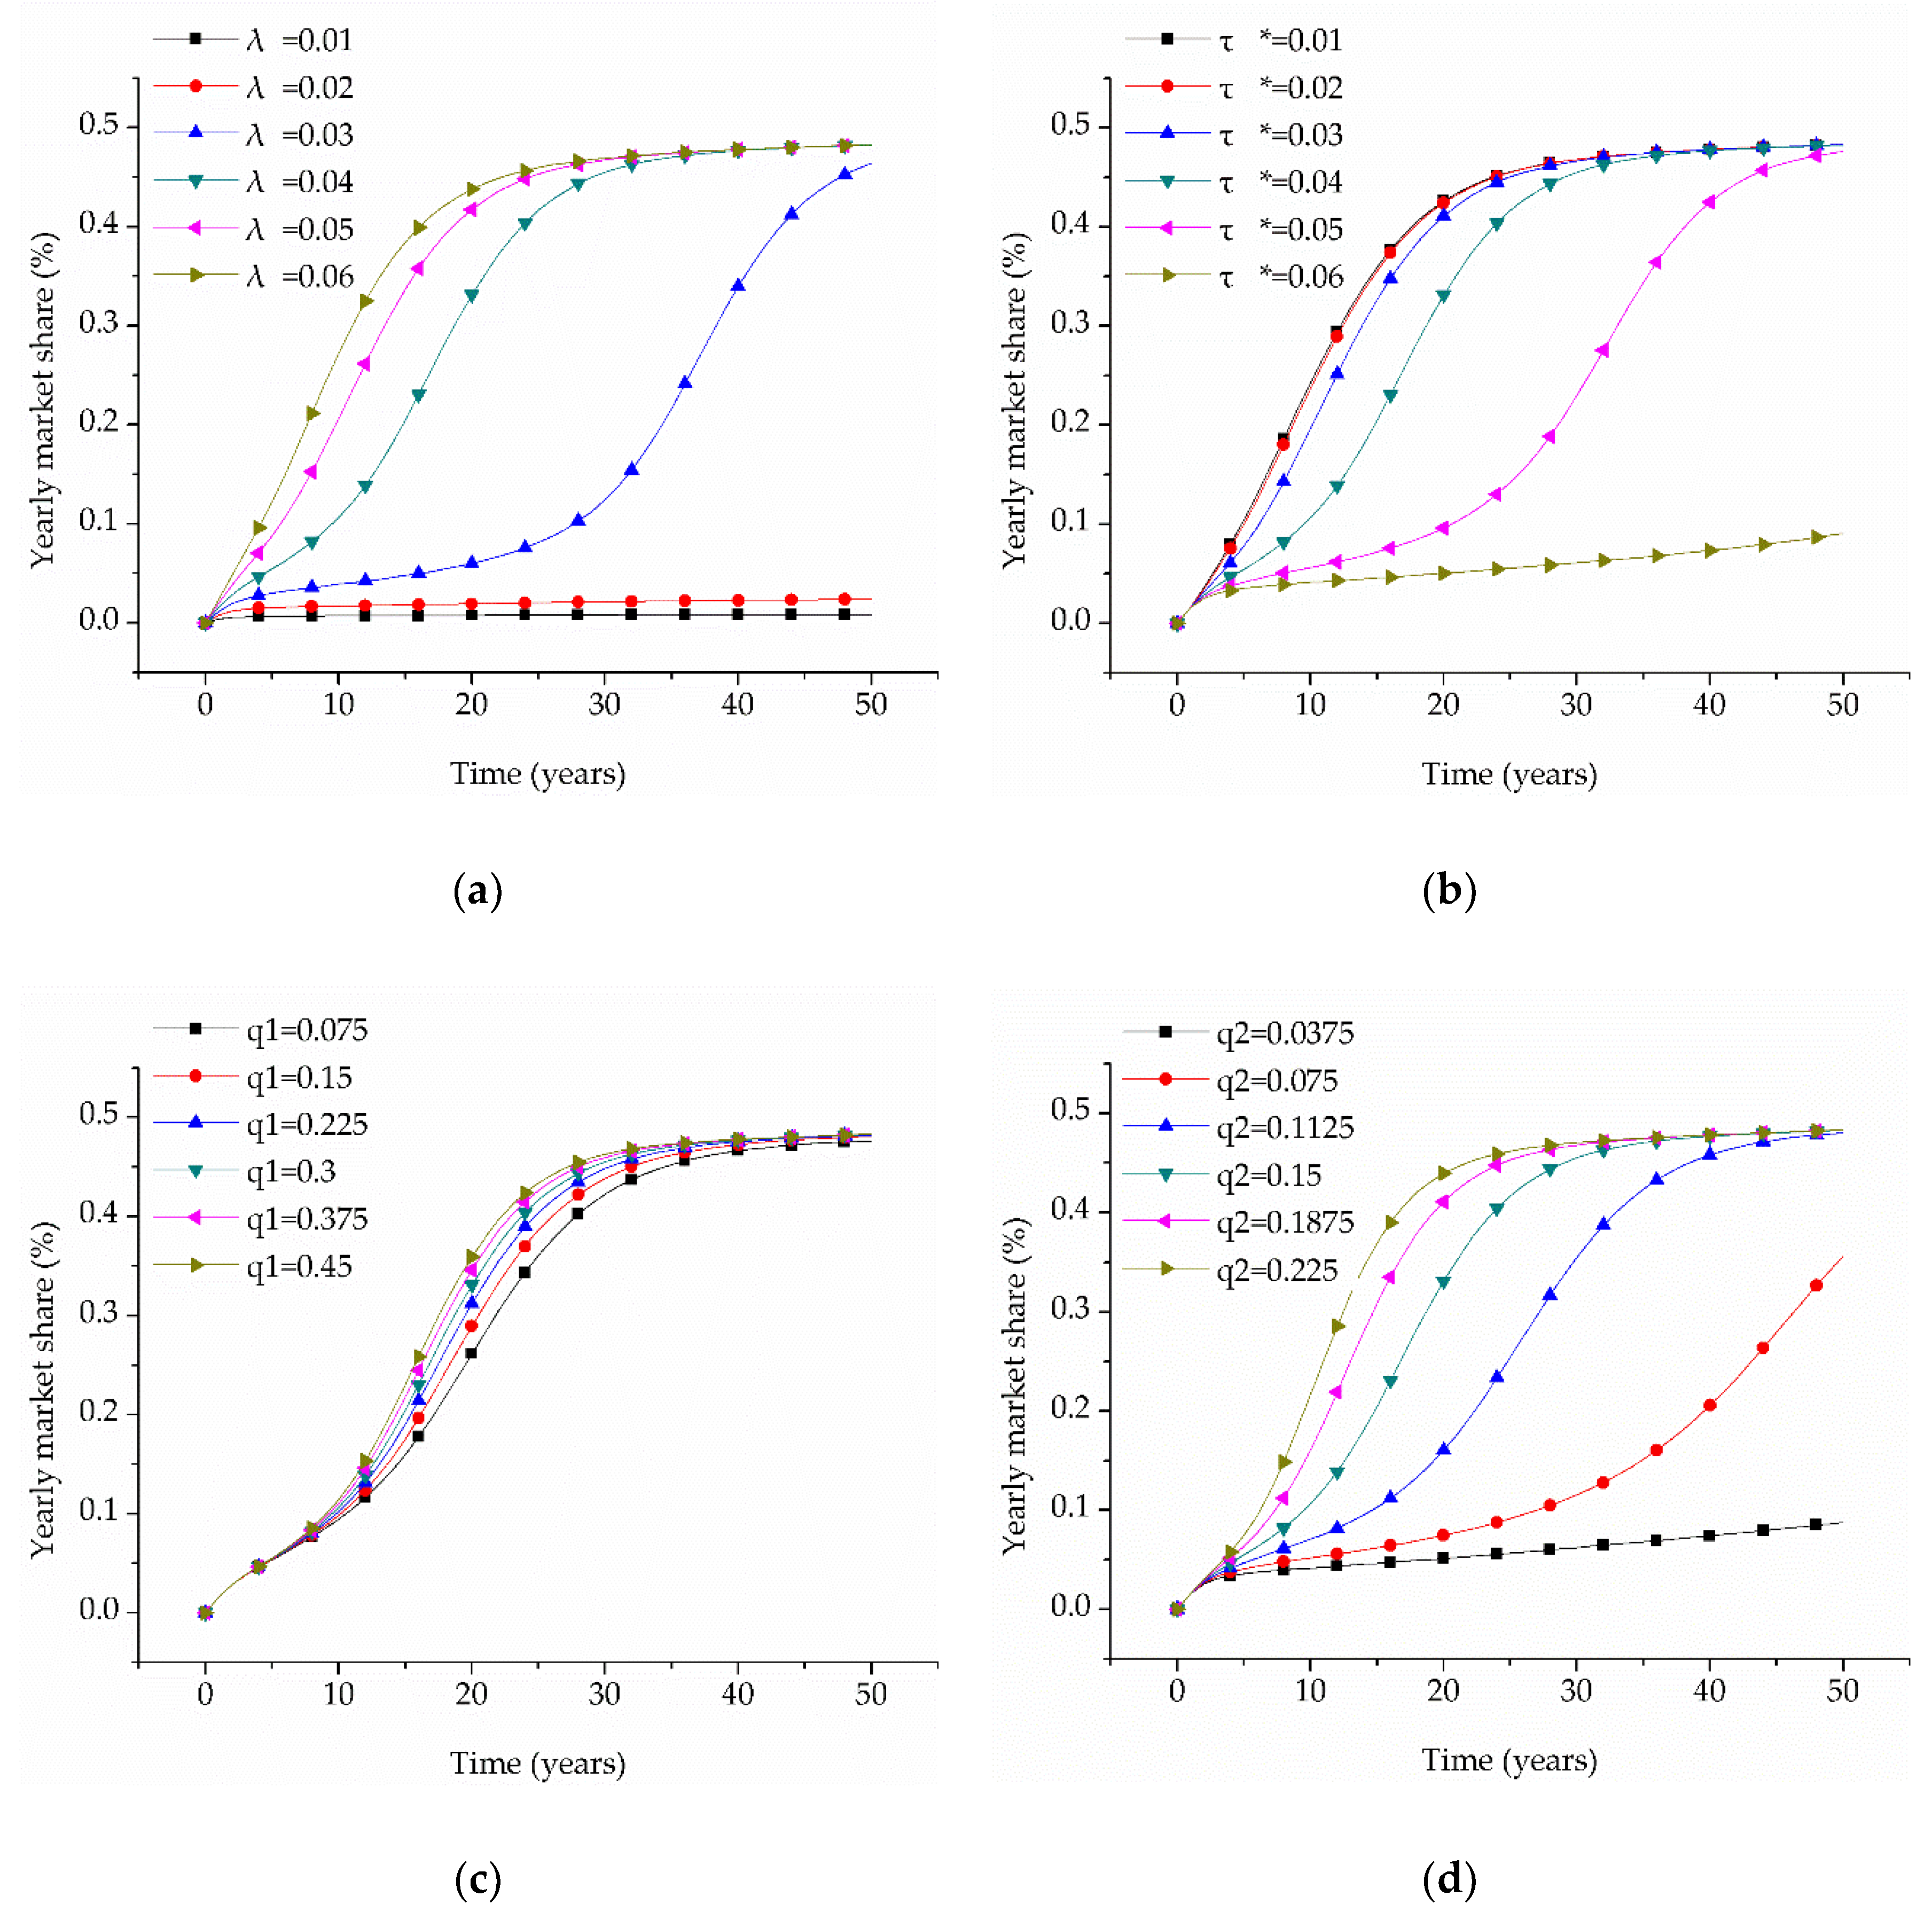
Because deep uncertainties arise in the long-term future, SD models cannot make the reliable and accurate forecast for the future EV promotion system. A parameter analysis is conducted to determine the proper value of some highly uncertain parameters to make EV diffusion process consist with national strategic planning for EVs and other similar research. Then, we can focus on analyzing the effect of policies, infrastructure development plans, policy durations and the phase out strategy.
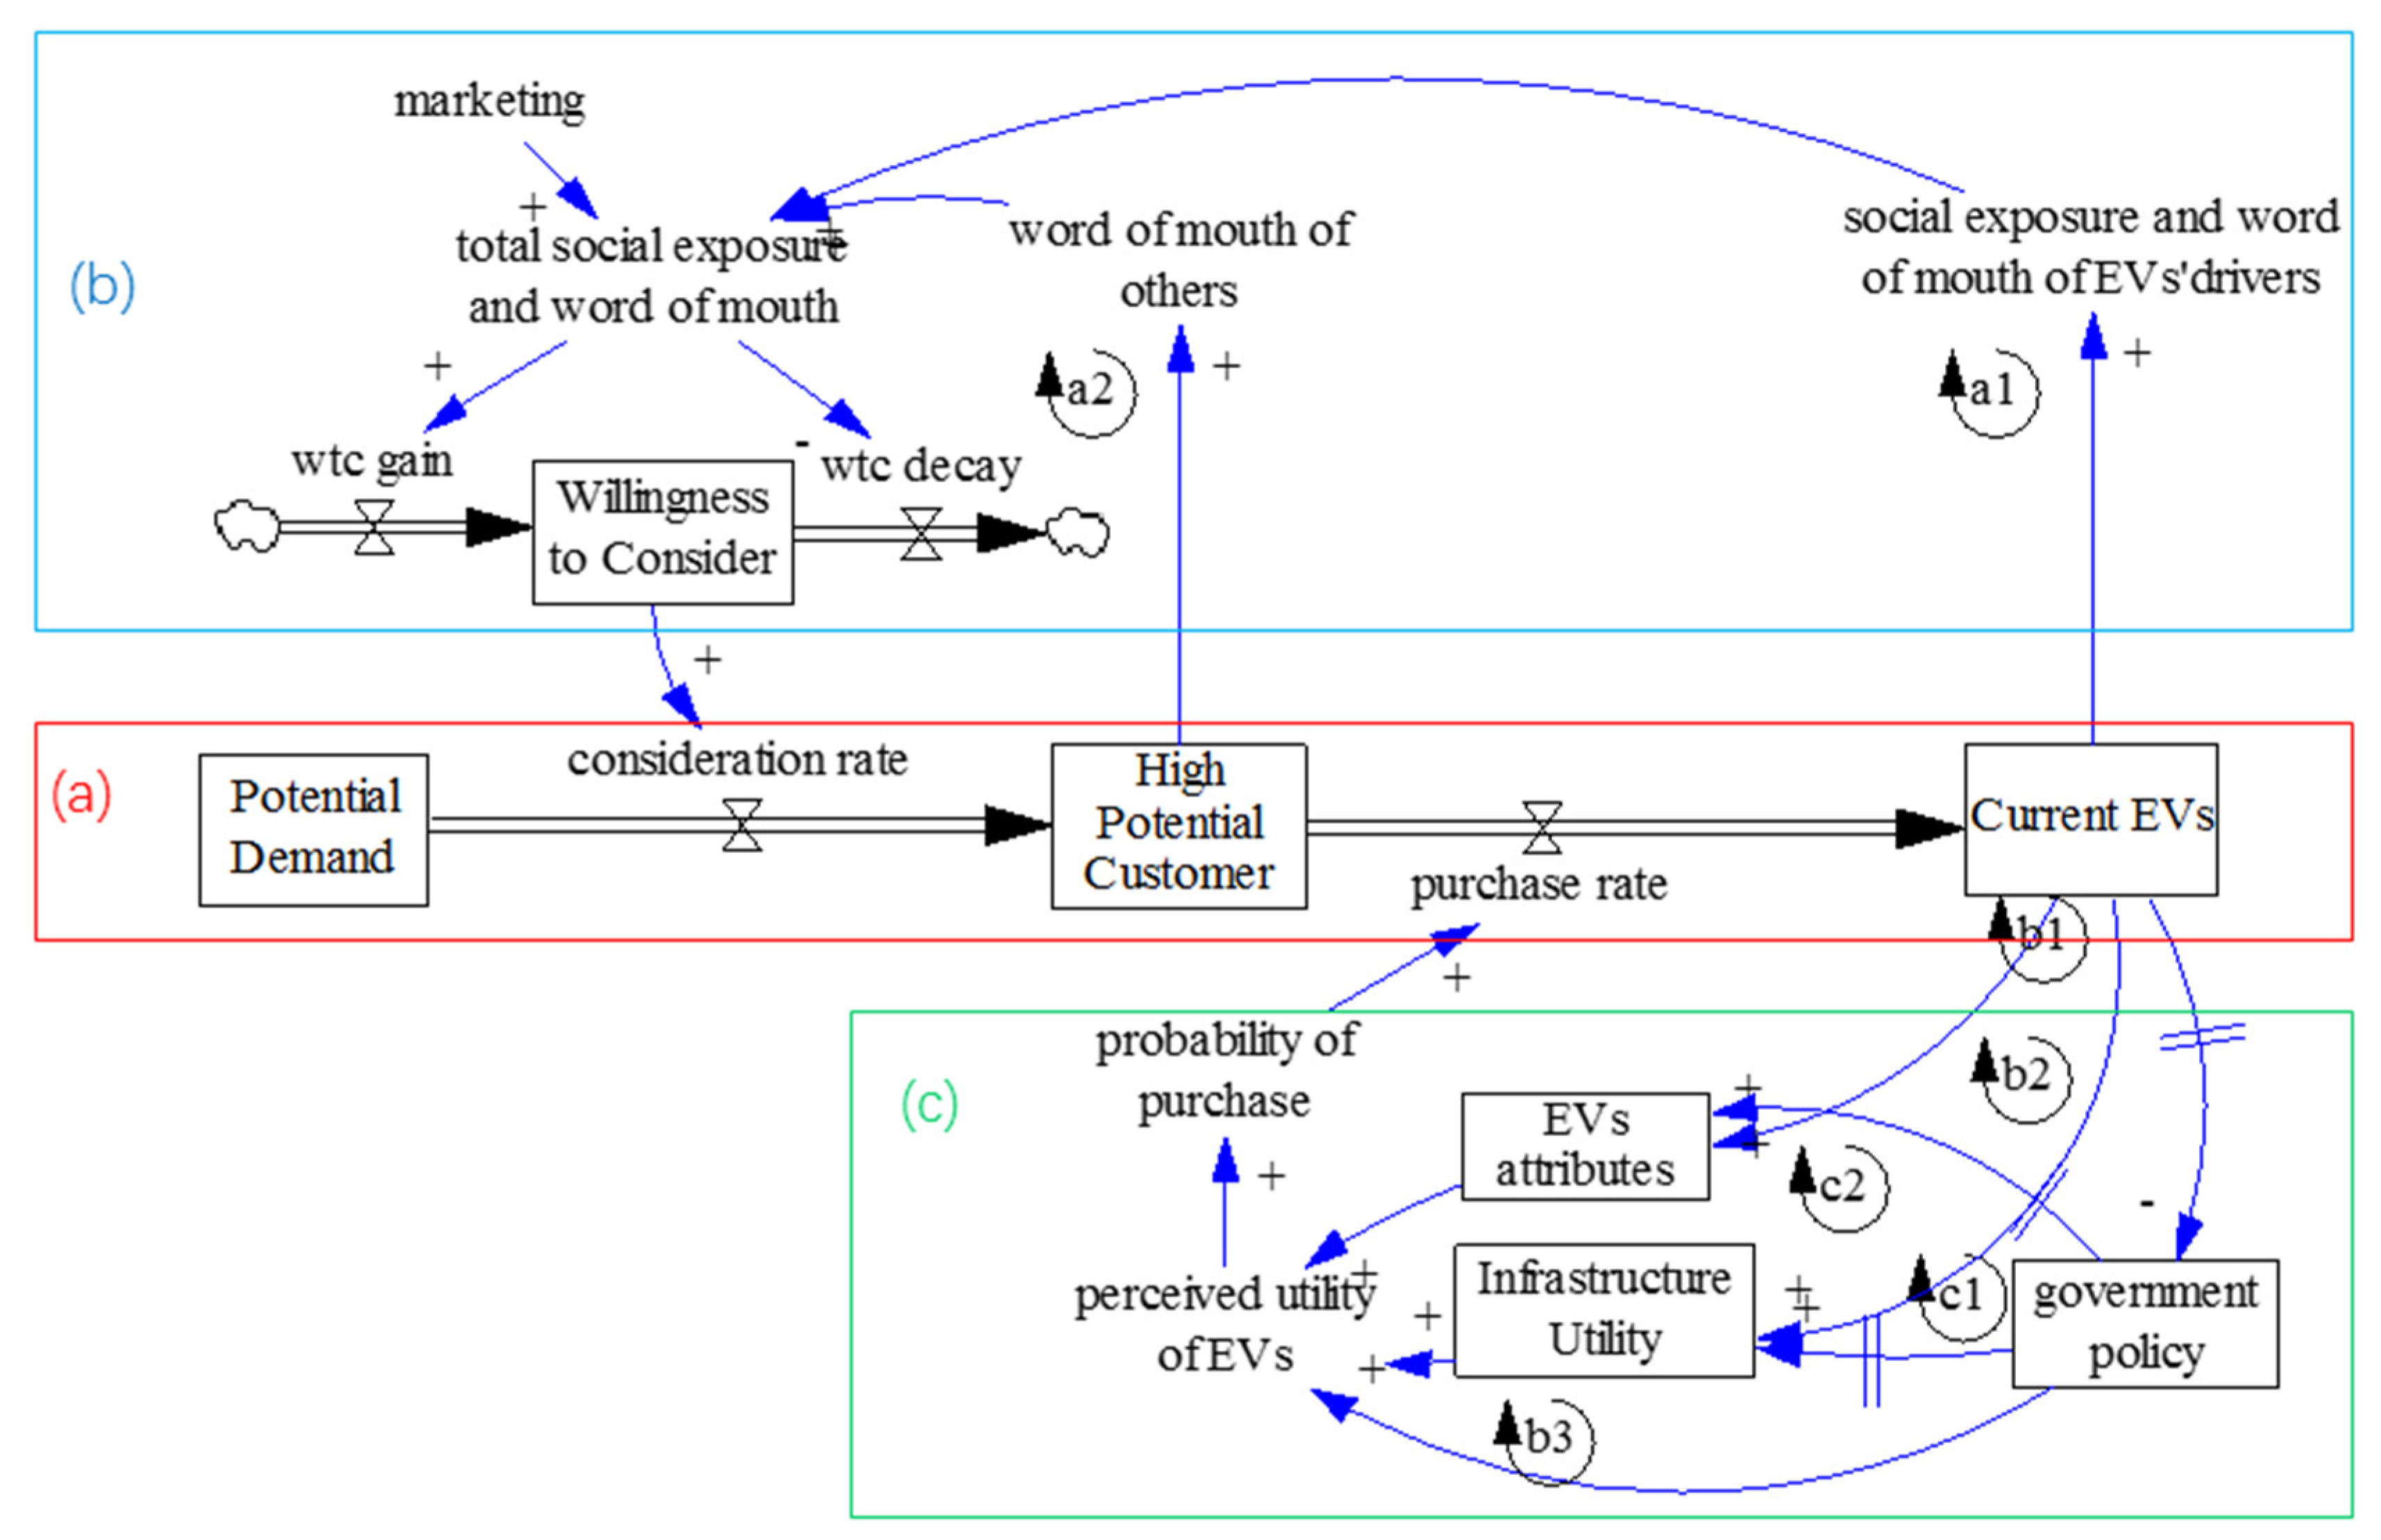
The EV diffusion model contains two stages: (a) the consideration stage, and (b) purchase stage. In the consideration stage, we find that marketing effectiveness (λ), reference rate of the total social exposure (τ*), and contact effectiveness of EV drivers (q1) have remarkable influence on EV diffusion. Contact effectiveness of other drivers (q2) has little effect.
In the purchase stage, policies can be divided into three levels. Purchase subsidies, driving restrictions by tail number, and purchase restrictions significantly improve EV diffusion. A lifetime battery warranty and free parking and tolls have some effect. A rental model has little effect. Charging piles and charging place are more important than charging stations.

4.6. Limitation

This research inherits the general structure of SD literature, verifies many conclusions from literature and comes up some new findings. However, because parameters conditioning EV diffusion are high uncertain, SD models cannot make a reliable and accurate forecast for the future EVs population. This research focuses on the effect of policies and infrastructure development, assuming that the technology and service remain the same. For future research, we suggest to combine some future-oriented technology analysis (e.g., Delphi and technology road-mapping) to offer a better understanding of the long-term future. In addition, the development of charging infrastructure is formulated in a simple approximation. In future research, a GIS- or matrix-based formulation could better measure the distribution of charging infrastructure.

5. Conclusions

This research focuses on building an SD model in Shenzhen to identity the general trends of EVs and provide suggestions for the government rather than exactly forecast the future EV population. This model can be applied to other studies in analyzing diffusion factors of AFVs in other countries. This SD model tests the effect of different policies, infrastructure development plans, policy durations and the current decrease rule in relation to purchase subsidies. The government can also use this model to test the influence of the phase out strategy of other policies. Several conclusions can be drawn from this research.
Firstly, policies can be divided into three levels, according to their effects. Purchase subsidies, driving restrictions by tail number, and purchase restrictions significantly improve EV diffusion. A lifetime battery warranty and free parking and tolls have some effect. A rental model has little effect. The critical duration time of policies for EV diffusion is 11 years. Secondly, the effect phase out strategy of subsidies is highly uncertain. Thus, government needs to work on a long-term policy for electric mobility and a proper phase out strategy. Additionally, charging piles and their location are more important than charging stations.
EV penetration will take a long time and create challenges in relation to policy design and application. In the short term, policy and infrastructure development play the important role in promoting EVs by reducing the convenience of CVs and increasing the attractiveness of EVs. In the medium term, the phase out strategy of policies has great uncertainty effects. In the long term, the technological development of EVs is the decisive factor in relation to the EV market share. Thus, the government needs to work on long-term policies for EVs and adjust policies according to the policy combination, EV sales, technology improvement and charging infrastructure. This model allows the government to foresee the effect of policies and test the impact when policies change.
The improvement of this research includes four aspects: firstly, the conjoint analysis is incorporated into an SD model to reveal consumer preferences; secondly, the development of charging infrastructure is modeled well; thirdly, the effect of specific policies and charging infrastructure development plans is evaluated by a scenario analysis. Finally, the duration of policies and effect of the phase out strategy of subsidies are also tested in this research.

Author Contributions

P.Y. and L.M. conceived and designed the study; J.Y., F.W. and K.Z. were responsible for the Methodology and Validation; J.Y. was responsible for Writing—Original Draft Preparation; P.Y. was responsible for Writing—Review and Editing; P.Y. and L.M. were responsible for supervision, project administration and funding acquisition.

Acknowledgments

This work is supported by the National Natural Science Foundation of China (No. 71771130), the National Natural Science Foundation of China (Grant No. 71572090), Shenzhen Municipal Development and Reform Commission, Shenzhen Environmental Science and New Energy Technology Engineering Laboratory (Grant No. SDRC [2016]172).

Conflicts of Interest

The authors declare no conflict of interest.

Appendix A

Table A1. Parameters of each scenario in relation to policy.
ParemeterDefinitionBaseS-1S-2S-3S-4S-5S-6S-7
s1Purchase subsidies (EVs)$14,620$0$14,620$14,621$14,622$14,623$14,624$14,625
s2Purchase subsidies (CVs)$0$0$0$0$0$0$0$0
Ve1Part-worth utility of parking fee and tolls (EVs)9.94%9.94%–9.94%9.94%9.94%9.94%9.94%9.94%
Vc1Part-worth utility of parking fee and tolls (CVs)−9.94%−9.94%−9.94%−9.94%−9.94%−9.94%−9.94%−9.94%
Ve2Part-worth utility of purchase restrictions (EVs)15.05%15.05%15.05%15.05%15.05%15.05%15.05%15.05%
Vc2Part-worth utility of purchase restrictions (CVs)−15.05%−15.05%−15.05%15.05%15.05%−15.05%−15.05%−15.05%
Ve3Part-worth utility of driving restrictions (EVs)23.75%23.75%23.75%23.75%23.75%23.75%23.75%23.75%
Vc3Part-worth utility of driving restrictions (CVs)23.75%23.75%23.75%23.75%−23.75%−23.75%23.75%23.75%
Ve4Part-worth utility of rental model (EVs)−6.65%−6.65%−6.65%−6.65%−6.65%−6.65%6.65%−6.65%
Ve4Part-worth utility of rental model (CVs)6.65%6.65%6.65%6.65%6.65%6.65%6.65%6.65%
Ve5Part-worth utility of battery insurance (EVs)−18.34%−18.34%−18.34%−18.34%−18.34%−18.34%−18.34%18.34%
Vc4Part-worth utility of car insurance (CVs)−18.34%−18.34%−18.34%−18.34%−18.34%−18.34%−18.34%−18.34%
λMarketing effectiveness0.040.0320.0360.0340.0430.050.0430.048
Table A2. Parameters of each scenario in relation to charging infrastructure development.
ParameterCharging Infrastructure Development PlanBaseS-8S-9S-10S-11S-12
Ve5Part-worth utility of charging place (EVs)26.27%−26.27%26.27%26.27%26.27%26.27%
R1Charging piles increase rate (Car-to-pile ratio)1:1.51:1.51:21:11:1.51:1.5
R2Charging station increase per year202020203010
λMarketing effectiveness0.040.02880.0480.0320.0420.038

References

  1. China Is Now the World’s Largest Net Importer of Petroleum and Other Liquid Fuels. Available online: https://www.eia.gov/todayinenergy/detail.php?id=15531 (accessed on 14 September 2018).
  2. Meyer, P.E.; Winebrake, J.J. Modeling technology diffusion of complementary goods: The case of hydrogen vehicles and refueling infrastructure. Technovation 2009, 29, 77–91. [Google Scholar] [CrossRef]
  3. Reid, S.; Spence, D.B. Methodology for evaluating existing infrastructure and facilitating the diffusion of pevs. Energy Policy 2016, 89, 1–10. [Google Scholar] [CrossRef]
  4. Park, S.Y.; Kim, J.W.; Lee, D.H. Development of a market penetration forecasting model for hydrogen fuel cell vehicles considering infrastructure and cost reduction effects. Energy Policy 2011, 39, 3307–3315. [Google Scholar] [CrossRef]
  5. Köhler, J.; Wietschel, M.; Whitmarsh, L.; Keles, D.; Schade, W. Infrastructure investment for a transition to hydrogen automobiles. Technol. Forecast. Soc. Chang. 2010, 77, 1237–1248. [Google Scholar] [CrossRef]
  6. Harrison, G.; Thiel, C. An exploratory policy analysis of electric vehicle sales competition and sensitivity to infrastructure in europe. Technol. Forecast. Soc. Chang. 2017, 114, 165–178. [Google Scholar] [CrossRef]
  7. Gnann, T.; Plötz, P. A review of combined models for market diffusion of alternative fuel vehicles and their refueling infrastructure. Renew. Sustain. Energy Rev. 2015, 47, 783–793. [Google Scholar] [CrossRef]
  8. Gnann, T.; Plötz, P.; Funke, S.; Wietschel, M. What is the market potential of plug-in electric vehicles as commercial passenger cars? A case study from germany. Transp. Res. Part D Transp. Environ. 2015, 37, 171–187. [Google Scholar] [CrossRef]
  9. How Did Shenzhen, China Build World’s Largest Electric Bus fleet? | World Resources Institute. Available online: https://www.wri.org/blog/2018/04/how-did-shenzhen-china-build-world-s-largest-electric-bus-fleet (accessed on 14 September 2018).
  10. Shenzhen Will Build 23,000 Electric Vehicle Charging Piles in 2016. Available online: http://www.szgnjn.com/News/detail/id/361.html (accessed on 14 September 2018).
  11. Charging Pile Construction Plan of 19 Chinese Provinces and Cities. Available online: http://www.escn.com.cn/news/show-311849.html (accessed on 14 September 2018).
  12. There Will Be Charging Piles for Every Kilometer in Downtown Shenzhen. Available online: http://static.nfapp.southcn.com/content/201709/08/c662645.html (accessed on 14 September 2018).
  13. Shenzhen Has Promoted 50,000 New Energy Vehicles. Available online: http://szsb.sznews.com/html/2016-07/19/content_3573844.htm (accessed on 14 September 2018).
  14. World’s Largest Electric Vehicle Maker BYD Sees Sales Drop 34% after China Reduced Subsidies. Available online: https://electrek.co/2017/05/08/byd-electric-vehicle-sales-drop-china/ (accessed on 14 September 2018).
  15. 2016 Annual Report of B. Y. D. Company Limited. Available online: http://www.byd.com/cn/Investor/InvestorAnnals.html (accessed on 14 September 2018).
  16. Sales of Domestic Alternative Fuel Vehicle Increased by 69% in 2017. Available online: http://www.sohu.com/a/221339998_492537 (accessed on 14 September 2018).
  17. Shepherd, S.P. A review of system dynamics models applied in transportation. Transp. B Transp. Dyn. 2014, 2, 83–105. [Google Scholar] [CrossRef] [Green Version]
  18. Shepherd, S.; Bonsall, P.; Harrison, G. Factors affecting future demand for electric vehicles: A model based study. Transp. Policy 2012, 20, 62–74. [Google Scholar] [CrossRef]
  19. Benvenutti, L.M.M.; Ribeiro, A.B.; Uriona, M. Long term diffusion dynamics of alternative fuel vehicles in brazil. J. Clean. Prod. 2017, 164, 1571–1585. [Google Scholar] [CrossRef]
  20. Struben, J.; Sterman, J.D. Transition challenges for alternative fuel vehicle and transportation systems. Environ. Plan. B Plan. Des. 2008, 35, 1070–1097. [Google Scholar] [CrossRef]
  21. Ardila, L.; Franco, C. Policy analysis to boost the adoption of alternative fuel vehicles in the colombian market. Presented at the 31st International Conference of System Dynamics Society, Cambridge, MA, USA, 21–25 July 2013. [Google Scholar]
  22. Gnann, T.; Plötz, P.; Kühn, A.; Wietschel, M. Modelling market diffusion of electric vehicles with real world driving data—German market and policy options. Transp. Res. Part A Pol. Pract. 2015, 77, 95–112. [Google Scholar] [CrossRef]
  23. Plötz, P.; Gnann, T.; Wietschel, M. Modelling market diffusion of electric vehicles with real world driving data—Part I: Model structure and validation. Ecol. Econ. 2014, 107, 411–421. [Google Scholar] [CrossRef]
  24. Plötz, P.; Schneider, U.; Globisch, J.; Dütschke, E. Who will buy electric vehicles? Identifying early adopters in germany. Transp. Res. Part A Pol. Pract. 2014, 67, 96–109. [Google Scholar] [CrossRef]
  25. Wolf, I.; Schröder, T.; Neumann, J.; de Haan, G. Changing minds about electric cars: An empirically grounded agent-based modeling approach. Technol. Forecast. Soc. Chang. 2015, 94, 269–285. [Google Scholar] [CrossRef] [Green Version]
  26. Pasaoglu, G.; Harrison, G.; Jones, L.; Hill, A.; Beaudet, A.; Thiel, C. A system dynamics based market agent model simulating future powertrain technology transition: Scenarios in the eu light duty vehicle road transport sector. Technol. Forecast. Soc. Chang. 2016, 104, 133–146. [Google Scholar] [CrossRef]
  27. Kangur, A.; Jager, W.; Verbrugge, R.; Bockarjova, M. An agent-based model for diffusion of electric vehicles. J. Environ. Psychol. 2017, 52, 166–182. [Google Scholar] [CrossRef]
  28. Lempert, R.J.; Popper, S.W.; Bankes, S.C. Shaping the Next One Hundred Years: New Methods for Quantitative, Long-Term Policy Analysis; RAND Corporation: Santa Monica, CA, USA, 2003; ISBN 0-8330-3275-5. [Google Scholar]
  29. Lin, B.; Wu, W. Why people want to buy electric vehicle: An empirical study in first-tier cities of China. Energy Policy 2018, 112, 233–241. [Google Scholar] [CrossRef]
  30. Wang, N.; Tang, L.; Pan, H. Analysis of public acceptance of electric vehicles: An empirical study in shanghai. Technol. Forecast. Soc. Chang. 2018, 126, 284–291. [Google Scholar] [CrossRef]
  31. Sierzchula, W.; Bakker, S.; Maat, K.; van Wee, B. The influence of financial incentives and other socio-economic factors on electric vehicle adoption. Energy Policy 2014, 68, 183–194. [Google Scholar] [CrossRef]
  32. Sang, Y.-N.; Bekhet, H. Exploring Factors Influencing Electric Vehicle Usage Intention: An Empirical Study in Malaysia. Int. J. Bus. Soc. 2015, 16, 57–74. [Google Scholar]
  33. Junquera, B.; Moreno, B.; Álvarez, R. Analyzing consumer attitudes towards electric vehicle purchasing intentions in spain: Technological limitations and vehicle confidence. Technol. Forecast. Soc. Chang. 2016, 109, 6–14. [Google Scholar] [CrossRef]
  34. Zhang, G.; Xu, Y.; Zhang, J. Consumer-oriented policy towards diffusion of electric vehicles: City-level evidence from China. Sustainability 2016, 8, 1343. [Google Scholar] [CrossRef]
  35. Ahn, J.; Jeong, G.; Kim, Y. A forecast of household ownership and use of alternative fuel vehicles: A multiple discrete-continuous choice approach. Energy Econ. 2008, 30, 2091–2104. [Google Scholar] [CrossRef]
  36. Helveston, J.P.; Liu, Y.; Feit, E.M.; Fuchs, E.; Klampfl, E.; Michalek, J.J. Will subsidies drive electric vehicle adoption? Measuring consumer preferences in the U.S. and China. Transp. Res. Part A Pol. Pract. 2015, 73, 96–112. [Google Scholar] [CrossRef] [Green Version]
  37. Kidder, A.E.; Benjamin, J.M.; Shuman, R.C. Application of conjoint analysis in assessing the u.S. Market for electric cars. In Proceedings of the 1982 Academy of Marketing Science (AMS) Annual Conference, Montreal, QC, Canada, 2015; Kothari, V., Ed.; Springer International Publishing: New York, NY, USA, 2015; pp. 481–484. [Google Scholar]
  38. Lebeau, K.; Van Mierlo, J.; Lebeau, P.; Mairesse, O.; Macharis, C. The market potential for plug-in hybrid and battery electric vehicles in flanders: A choice-based conjoint analysis. Transp. Res. Part D Transp. Environ. 2012, 17, 592–597. [Google Scholar] [CrossRef]
  39. Rudolph, C. How may incentives for electric cars affect purchase decisions? Transp. Policy 2016, 52, 113–120. [Google Scholar] [CrossRef]
  40. Golob, T.F.; Torous, J.; Bradley, M.; Brownstone, D.; Crane, S.S.; Bunch, D.S. Commercial fleet demand for alternative-fuel vehicles in california. Transp. Res. Part A Pol. Pract. 1997, 31, 219–233. [Google Scholar] [CrossRef]
  41. Krishnan, V.; Gonzalez-Marciaga, L.; McCalley, J. A planning model to assess hydrogen as an alternative fuel for national light-duty vehicle portfolio. Energy 2014, 73, 943–957. [Google Scholar] [CrossRef]
  42. De Haan, P.; Mueller, M.G.; Peters, A. Does the hybrid toyota prius lead to rebound effects? Analysis of size and number of cars previously owned by swiss prius buyers. Ecol. Econ. 2006, 58, 592–605. [Google Scholar] [CrossRef]
  43. Yu, Z.; Li, S.; Tong, L. Market dynamics and indirect network effects in electric vehicle diffusion. Transp. Res. Part D Transp. Environ. 2016, 47, 336–356. [Google Scholar] [CrossRef] [Green Version]
  44. Janssen, A.; Lienin, S.F.; Gassmann, F.; Wokaun, A. Model aided policy development for the market penetration of natural gas vehicles in switzerland. Transp. Res. Part A Pol. Pract. 2006, 40, 316–333. [Google Scholar] [CrossRef]
  45. Rezvani, Z.; Jansson, J.; Bodin, J. Advances in consumer electric vehicle adoption research: A review and research agenda. Transp. Res. Part D Transp. Environ. 2015, 34, 122–136. [Google Scholar] [CrossRef]
  46. Yetano Roche, M.; Mourato, S.; Fischedick, M.; Pietzner, K.; Viebahn, P. Public attitudes towards and demand for hydrogen and fuel cell vehicles: A review of the evidence and methodological implications. Energy Policy 2010, 38, 5301–5310. [Google Scholar] [CrossRef] [Green Version]
  47. Bogue, J.; Sorenson, D. A conjoint-based approach to concept optimisation: Probiotic beverages. Br. Food J. 2005, 107, 870–883. [Google Scholar] [CrossRef]
  48. Åhman, M. Government policy and the development of electric vehicles in japan. Energy Policy 2006, 34, 433–443. [Google Scholar] [CrossRef]
  49. Oliveira, V.; Pinho, P. Evaluation in urban planning: Advances and prospects. J. Plan. Lit. 2010, 24, 343–361. [Google Scholar] [CrossRef]
  50. Wang, F.; Yu, J.; Yang, P.; Miao, L.; Ye, B. Analysis of the barriers to widespread adoption of electric vehicles in shenzhen China. Sustainability 2017, 9, 522. [Google Scholar] [CrossRef]
  51. Degirmenci, K.; Breitner, M.H. Consumer purchase intentions for electric vehicles: Is green more important than price and range? Transp. Res. Part D Transp.Environ. 2017, 51, 250–260. [Google Scholar] [CrossRef]
  52. Choo, S.; Mokhtarian, P.L. What type of vehicle do people drive? The role of attitude and lifestyle in influencing vehicle type choice. Transp. Res. Part A Pol. Pract. 2004, 38, 201–222. [Google Scholar] [CrossRef] [Green Version]
  53. Gass, V.; Schmidt, J.; Schmid, E. Analysis of alternative policy instruments to promote electric vehicles in austria. Renew. Energy 2014, 61, 96–101. [Google Scholar] [CrossRef]
  54. Valeri, E.; Danielis, R. Simulating the market penetration of cars with alternative fuelpowertrain technologies in italy. Transp. Policy 2015, 37, 44–56. [Google Scholar] [CrossRef] [Green Version]
  55. Bjerkan, K.Y.; Nørbech, T.E.; Nordtømme, M.E. Incentives for promoting battery electric vehicle (bev) adoption in norway. Transp. Res. Part D Transp. Environ. 2016, 43, 169–180. [Google Scholar] [CrossRef]
  56. Mersky, A.C.; Sprei, F.; Samaras, C.; Qian, Z.S. Effectiveness of incentives on electric vehicle adoption in norway. Transp. Res. Part D Transp. Environ. 2016, 46, 56–68. [Google Scholar] [CrossRef]
  57. Lieven, T. Policy measures to promote electric mobility—A global perspective. Transp. Res. Part A Pol. Pract. 2015, 82, 78–93. [Google Scholar] [CrossRef]
  58. Wang, N.; Yan, R. Research on consumers’ use willingness and opinions of electric vehicle sharing: An empirical study in shanghai. Sustainability 2016, 8, 7. [Google Scholar] [CrossRef]
  59. Zhang, X.; Xie, J.; Rao, R.; Liang, Y. Policy incentives for the adoption of electric vehicles across countries. Sustainability 2014, 6, 8056–8078. [Google Scholar] [CrossRef]
  60. Japan Has More Car Chargers than Gas Stations. Available online: https://www.japantimes.co.jp/news/2015/02/16/business/japan-has-more-car-chargers-than-gas-stations#.W5ekIWdG3IX (accessed on 14 September 2018).
  61. Liu, H.; You, X.; Xue, Y.; Luan, X. Exploring critical factors influencing the diffusion of electric vehicles in China: A multi-stakeholder perspective. Res. Transp. Econ. 2017, 66, 46–58. [Google Scholar] [CrossRef]
  62. Calef, D.; Goble, R. The allure of technology: How france and california promoted electric and hybrid vehicles to reduce urban air pollution. Pol. Sci. 2007, 40, 1–34. [Google Scholar] [CrossRef]
  63. Lane, B.; Potter, S. The adoption of cleaner vehicles in the uk: Exploring the consumer attitude–action gap. J. Clean. Prod. 2007, 15, 1085–1092. [Google Scholar] [CrossRef]
  64. Graham-Rowe, E.; Gardner, B.; Abraham, C.; Skippon, S.; Dittmar, H.; Hutchins, R.; Stannard, J. Mainstream consumers driving plug-in battery-electric and plug-in hybrid electric cars: A qualitative analysis of responses and evaluations. Transp. Res. Part A Pol. Pract. 2012, 46, 140–153. [Google Scholar] [CrossRef]
Figure 1. Simplified structure of the simulation model.
Sustainability 10 03394 g001
Figure 2. Simplified structure of the development of charging infrastructure.
Sustainability 10 03394 g002
Figure 3. Parameter analysis: (a) the marketing effectiveness (λ); (b) reference rate of total social exposure (τ*); (c) contact effectiveness of electric vehicle (EV) drivers (q1); and (d) contact effectiveness of other drivers (q2).
Sustainability 10 03394 g003
Figure 4. Yearly market share of EVs in scenarios 1–2.
Sustainability 10 03394 g004
Figure 5. Yearly market share of EVs in scenarios 3–5.
Sustainability 10 03394 g005
Figure 6. Yearly market share of EVs in scenarios 6–7.
Sustainability 10 03394 g006
Figure 7. Yearly market share of EVs in scenario 8.
Sustainability 10 03394 g007
Figure 8. Yearly market share of EVs in scenarios 9–10.
Sustainability 10 03394 g008
Figure 9. Yearly market share of EVs in scenarios 11–12.
Sustainability 10 03394 g009
Figure 10. Results of different policy duration times.
Sustainability 10 03394 g010
Figure 11. Results of the gradual removal of subsidies.
Sustainability 10 03394 g011
Table 1. Description of factors considered in the model.
CategoryFactors
Government policiesPurchase subsidies, Purchase restrictions, Driving restrictions, Free parking and free tolls, Rental model, Battery insurance
Vehicle attributesPurchase cost, Operation cost, Charging duration, Driving range
Charging infrastructureNumber of charging stations, Car-to-pile ratio, Charging place
Table 2. Eight policy combinations.
Policy Combinations12345678
Do conventional vehicles (CVs) have purchase restrictions? aYesNoNoYesNoNoYesYes
Do CVs have driving restrictions? bYesNoYesNoNoYesNoYes
Do electric vehicles (EVs) have parking fee or tolls? cYesYesNoYesNoYesNoNo
Charging place of EVs dParking lotsStationsParking lotsParking lotsParking lotsStationsStationsStations
Rental model stage of EVs eEarly stage Early stage Mature stageMature stageEarly stageMature stageMature stageEarly stage
Battery guarantee time of EVs f5–8 years5–8 years5–8 yearsLife TimeLife TimeLife Time5–8 yearsLife Time
a If CVs have purchase restrictions, consumers who want to buy CVs must participate in a lottery to get a license plate. However, with all policy combinations, EVs do not have purchase restrictions; b If CVs have driving restrictions, CVs cannot drive from 7:00 a.m. to 8:00 p.m. one day every week. However, with all policy combinations, EVs do not have driving restrictions; c If the answer is ‘Yes’, it means that EVs have to pay parking fees and tolls, as do CVs. If the answer is ‘No’, it means that EVs do not pay tolls and have one hour of free parking in public parking places every day. Moreover, CVs have parking fees and tolls with all policy combinations; d The charging place of EVs includes parking lots and charging stations. Parking lots include communities, working places and other public parking spaces. Parking lots only provide self-service charging piles. Charging stations have a full-time service staff and offer a charging service for EVs; e If the rental model is in the early stage, renting stations of EVs are not convenient. The renting service is not very flexible. However, in the mature stage, the renting service of EVs is very flexible. Renting stations are also convenient for borrowing and returning EVs; f This warranty is only for the battery, not the entire car. There are two types of battery guarantee times: 5–8 years and lifetime.
Table 3. Sample description.
IndexVariablePopulationPercentage
Gender1. Male11371.97%
2. Female4428.03%
Age1. 18–22 years old42.55%
2. 22–35 years old8151.59%
3. Over 35 years old7145.22%
Occupation1. Staff 6038.22%
2. Advanced management3824.20%
3. Private firm owner4126.11%
4. University student53.18%
5. Research & Design engineer127.64%
Drive Experience1. Less than 3 years5243.12%
2. Between 3–5 years2312.65%
3. Between 5–8years2914.47%
4. Over 8 years5329.76%
Willingness to buy EVs in 2 years1. Already buy an EV31.91%
2. Consider to buy EVs4226.75%
3. Not consider to buy EVs148.92%
4. Not sure9862.42%
Table 4. Results of the conjoint analysis.
PolicyRelatively Importance a (%)LevelPart-Worth Utility bParameter c (%)
Purchase restrictions16.72No0.9015.05
Yes−0.90−15.05
Parking fees and tolls13.14No0.769.99
Yes−0.76−9.99
Driving restrictions by tail number20.39No1.1623.65
Yes−1.16−23.65
Charging/Refueling place 21.22Parking lots1.2426.31
Stations−1.24−26.31
Rental model10.75Early stage0.626.67
Mature stage−0.62−6.67
Battery/car insurance17.78Lifetime1.0318.31
5–8 years−1.03−18.31
a Relative importance of each attribute; b Part-worth utility indicates the utility of each level of each attribute; c Parameter = Part-worth Utility * Relatively Importance.
Table 5. Results of the correlation analysis.
ValueSig.
Pearson’s R0.9670.000
Kendall’s tau0.9290.000
Table 6. Scenario setup-policies.
BaseS-1S-2S-3S-4S-5S-6S-7
EVs have purchase subsidies YesNoYesYesYesYesYesYes
CVs have purchase subsidiesNoNoNoNoNoNoNoNo
EVs have parking fee, tollsNoNoYesNoNoNoNoNo
CVs have parking fee, tollsYesYesYesYesYesYesYesYes
EVs have purchase restrictionsNoNoNoNoNoNoNoNo
CVs have purchase restrictionsYesYesYesNoNoYesYesYes
EVs have driving restrictions NoNoNoNoNoNoNoNo
CVs have driving restrictions NoNoNoNoYesYesNoNo
rental model of EVsEarly stageEarly stageEarly stageEarly stageEarly stageEarly stageMature stageEarly stage
rental model of CVsMature stageMature stageMature stageMature stageMature stageMature stageMature stageMature stage
Battery insurance of EVs (year)5–8 5–8 5–85–85–85–8 5–8 Life time
Insurance of CVs (year)3–5 3–5 3–53–53–53–53–5 3–5
Marketing effectiveness (λ)0.040.0320.0360.0340.0430.050.0430.048
Table 7. Scenario inputs- the development of charging infrastructure.
Charging Infrastructure Development PlanBaseS-8S-9S-10S-11S-12
Charging place aParking lotsStationsParking lotsParking lotsParking lotsParking lots
Charging piles increase rate (Car-to-pile ratio) b1:1.51:1.51:21:11:1.51:1.5
Charging station increase rate c202020203010
Marketing effectiveness0.040 0.02880.0480.0320.0420.038
a Charging place of EVs includes parking lots and charging stations. Parking lots in communities, working places and other public places provide self-service charging piles. Charging stations have a full-time service staff and offer a charging service for EVs. Charging stations are fewer than charging piles in parking lots; b Car-to-pile ratio is an indicator of the charging pile increase rate. In the base scenario, this ratio is 1:1.5, which means that an increase of EVs will result in an increase of charging piles by 1.5 times; c Charging stations are simplified to increase at a fixed rate. In the base scenario, charging stations will increase by 20 every year.

