The Sustainable Development of the Economic-Energy-Environment (3E) System under the Carbon Trading (CT) Mechanism: A Chinese Case


Abstract
:1. Introduction
2. Methodology
2.1. Causal Loop Diagrams (CLD) Analysis
2.1.1. 3E Module
- (1)
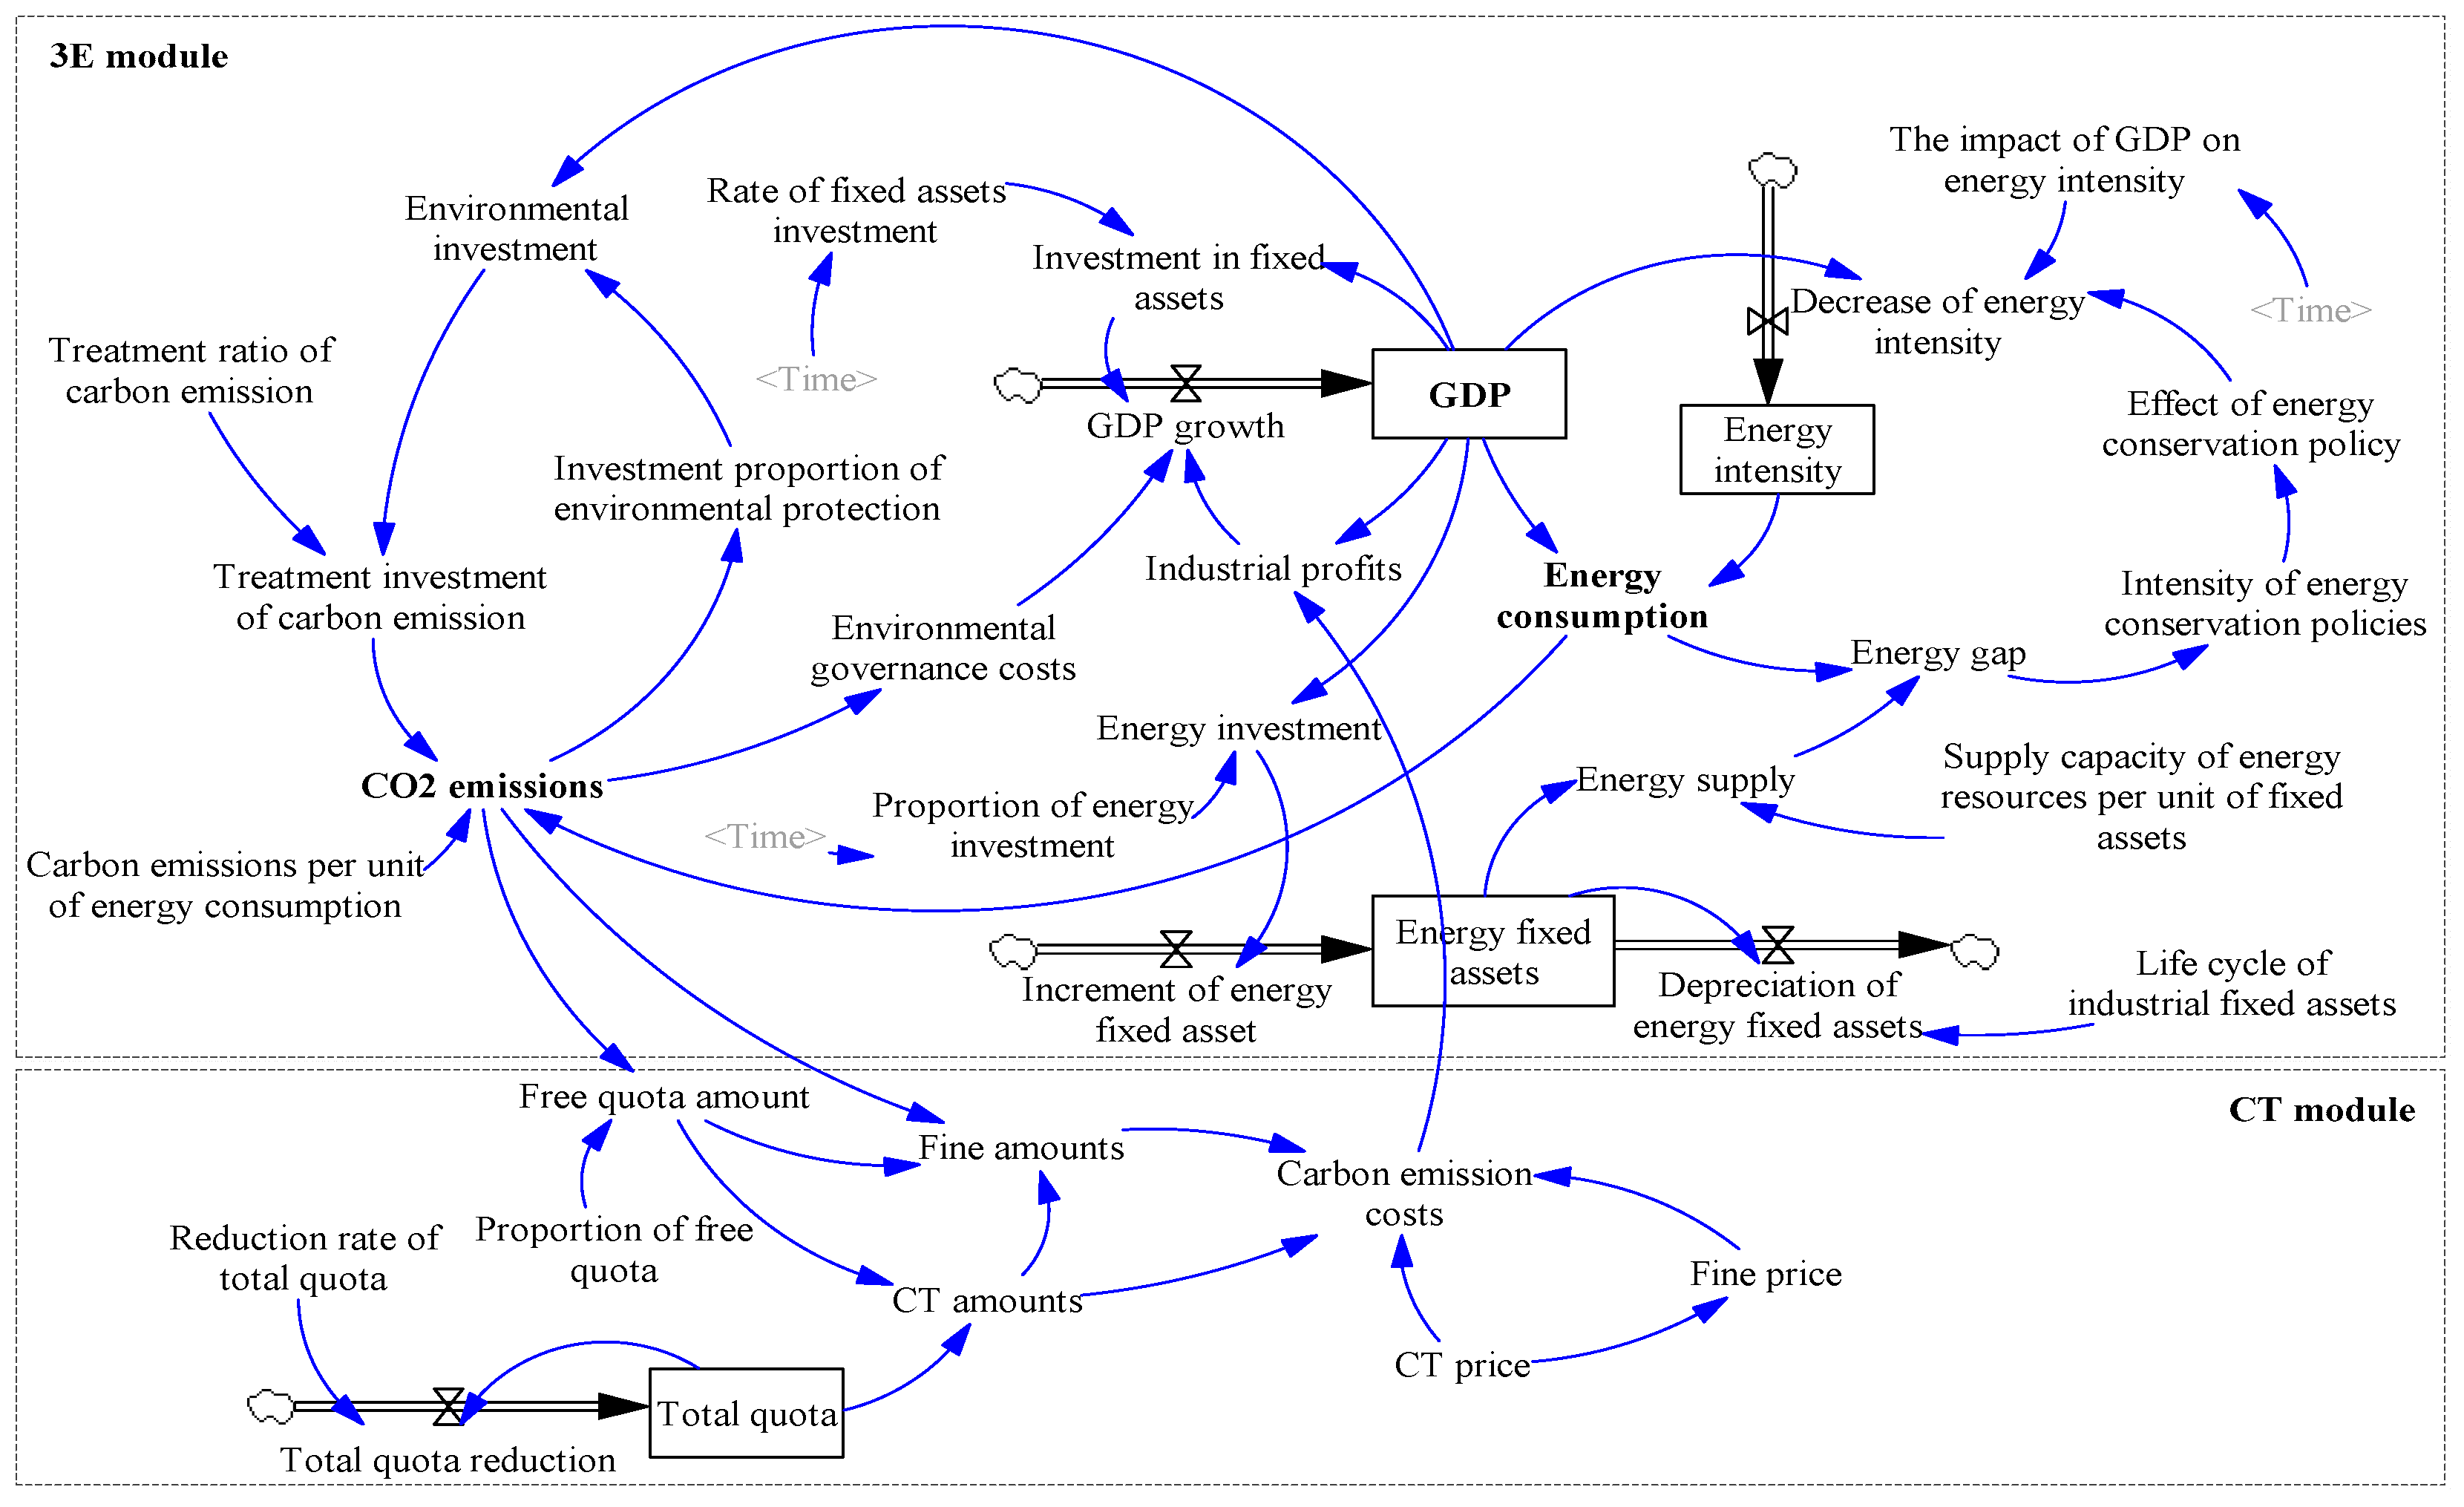
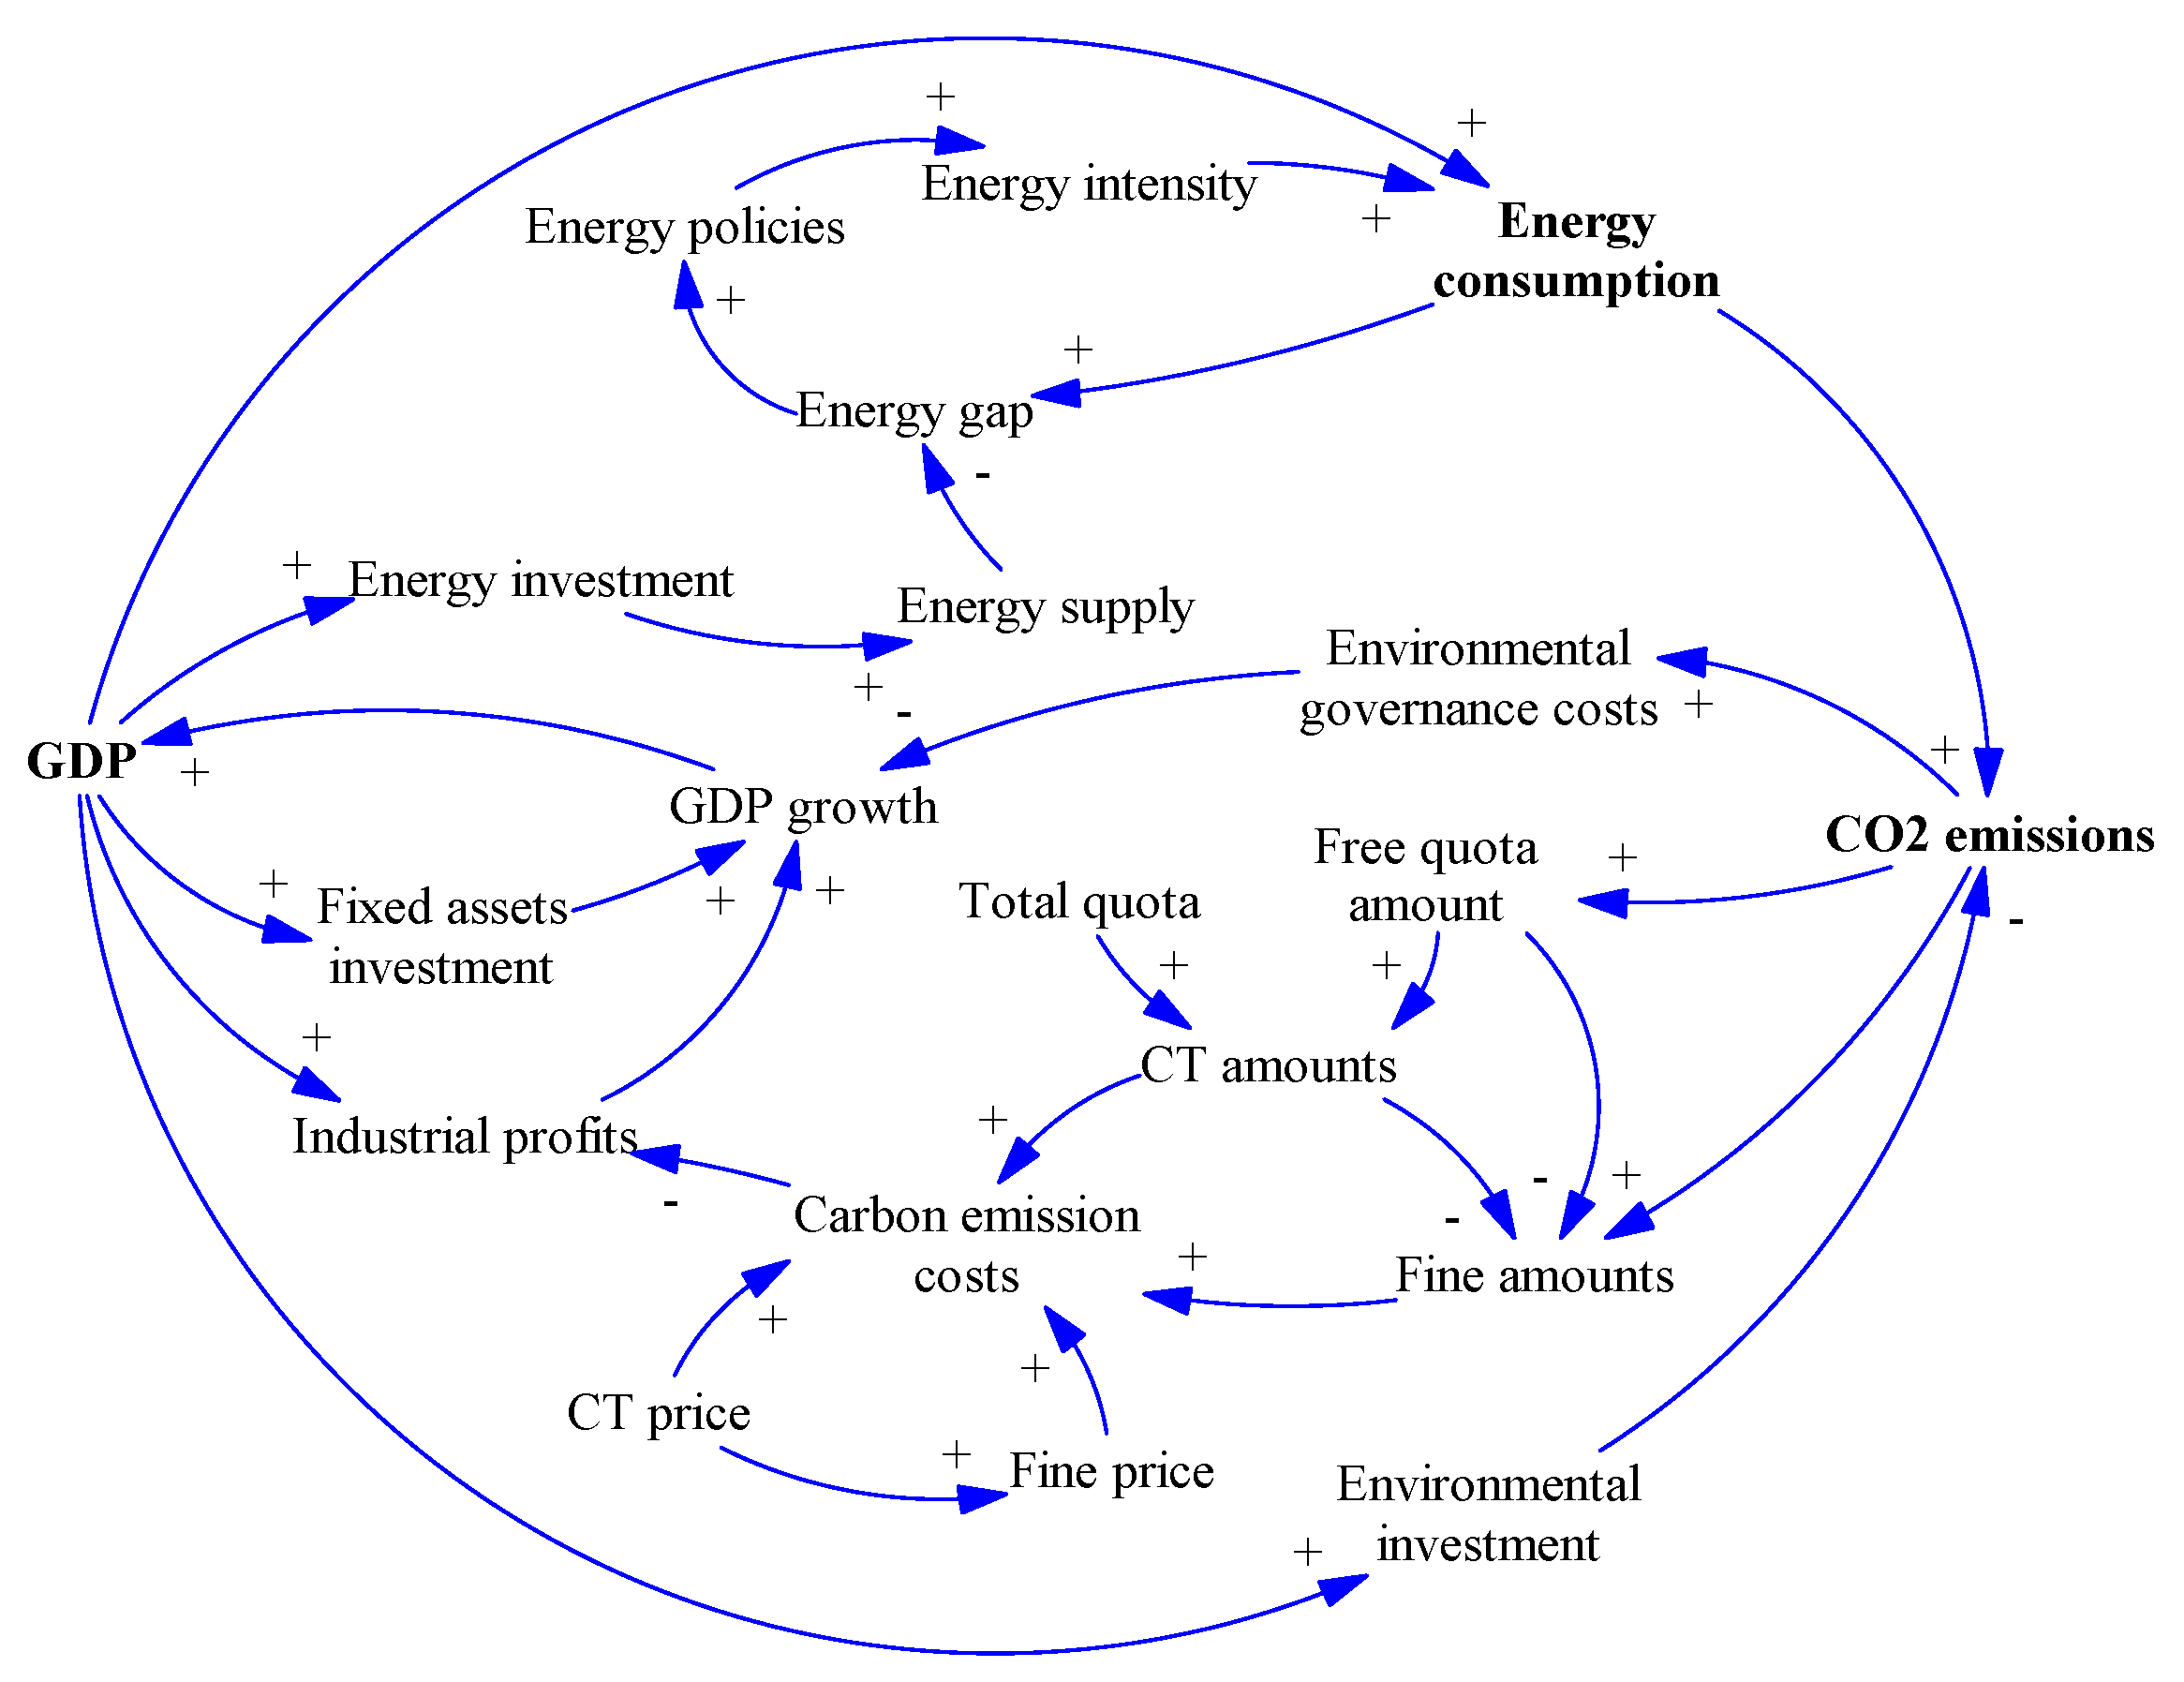
- The core factors of the 3E system: The economic subsystem is composed of economic elements that are interconnected and have a causal relationship between each other, where, GDP is an important indicator to measure the overall economic situation of a country or region [21]. GDP growth will directly enhance energy investment, thereby promoting the development of the energy industry, eventually leading to an increase in energy consumption. The development of industry and the growth of energy consumption further aggravate CO2 emissions, which is the main cause of environmental pollution and greenhouse effect. Therefore, we set the core factors of the economic subsystem, energy subsystem, and environmental subsystem as GDP, energy consumption, and CO2 emissions, respectively.
- (2)
- The feedback path of the economic subsystem: GDP → fixed assets investment → GDP growth → GDP, and GDP → industrial profits → GDP growth → GDP. The development of the economy has a positive effect on fixed assets investment, while the increase in fixed assets investment will in turn promote economic growth, and ultimately increase GDP. Similarly, economic development can promote the growth of enterprise outputs, and produce certain positive effects on industrial profits. The increase of profits will promote economic growth, and correspondingly, eventually promote the growth of GDP.
- (3)
- The feedback path of the energy subsystem [18]: GDP → energy investment → energy supply → energy gap → energy policies → energy intensity → energy consumption, and GDP → energy consumption. The GDP growth will directly increase energy investment, and the supply and demand of energy will also increase, which lead to energy shortage. With the expansion of the energy gap, energy policies will be strengthened to reduce energy intensity, thereby reducing energy demand, and thus narrowing the energy gap.
- (4)
- The feedback path of the environment subsystem: GDP → energy consumption → CO2 emissions, and GDP → environmental investment → CO2 emissions. On the one hand, economic growth promotes the energy industry’s development, while the development of the energy industry generates a large amount of CO2. On the other hand, the increase of GDP will increase the government’s investment in environmental governance, and thus reduce carbon emissions.
2.1.2. CT Module
- (1)
- CT market: In the CT market, the government sets a certain amount of total carbon emissions, that is, the total quotas, and sets the maximum amount of carbon emissions for each carbon-emitting enterprise, that is, free quotas. In order not to exceed the maximum carbon emissions, carbon emitters can purchase carbon indicators from other enterprises that do not fulfill their carbon emission targets at a certain price, to compensate for their excessive carbon emissions, thus forming the CT market for free transactions between enterprises. Enterprises need to be punished if they exceed the limit of carbon emissions. Both of the costs of purchasing carbon emissions and the fines they pay belong to the enterprises’ carbon emission costs.
- (2)
- The feedback path of the impact of the CT market on the 3E system: CO2 emissions → environmental governance cost → GDP growth → GDP, and CO2 emissions → fine amounts → carbon emission costs → industrial profits → GDP growth → GDP. On the one hand, the increase of carbon emissions causes the government to invest more in harnessing the environment, and the increase of environmental governance costs will inevitably have some negative effects on economic development in the short term. On the other hand, when the total quota is fixed, for the larger carbon emissions, more penalties will be for the excessive emission enterprises, thus increasing the carbon emission costs. Correspondingly, the increase of carbon emission costs will increase the production costs, and have a negative effect on industrial profits, while the decrease of profits will restrain GDP growth [22].
2.2. Model Design
2.3. Validation of Dynamic Models
2.3.1. Boundary Adequacy
2.3.2. Structure Verification
2.3.3. Dimensional Consistency
2.3.4. Extreme Condition Test
2.3.5. Structurally Oriented Behavior Test
3. Case Study
3.1. Data
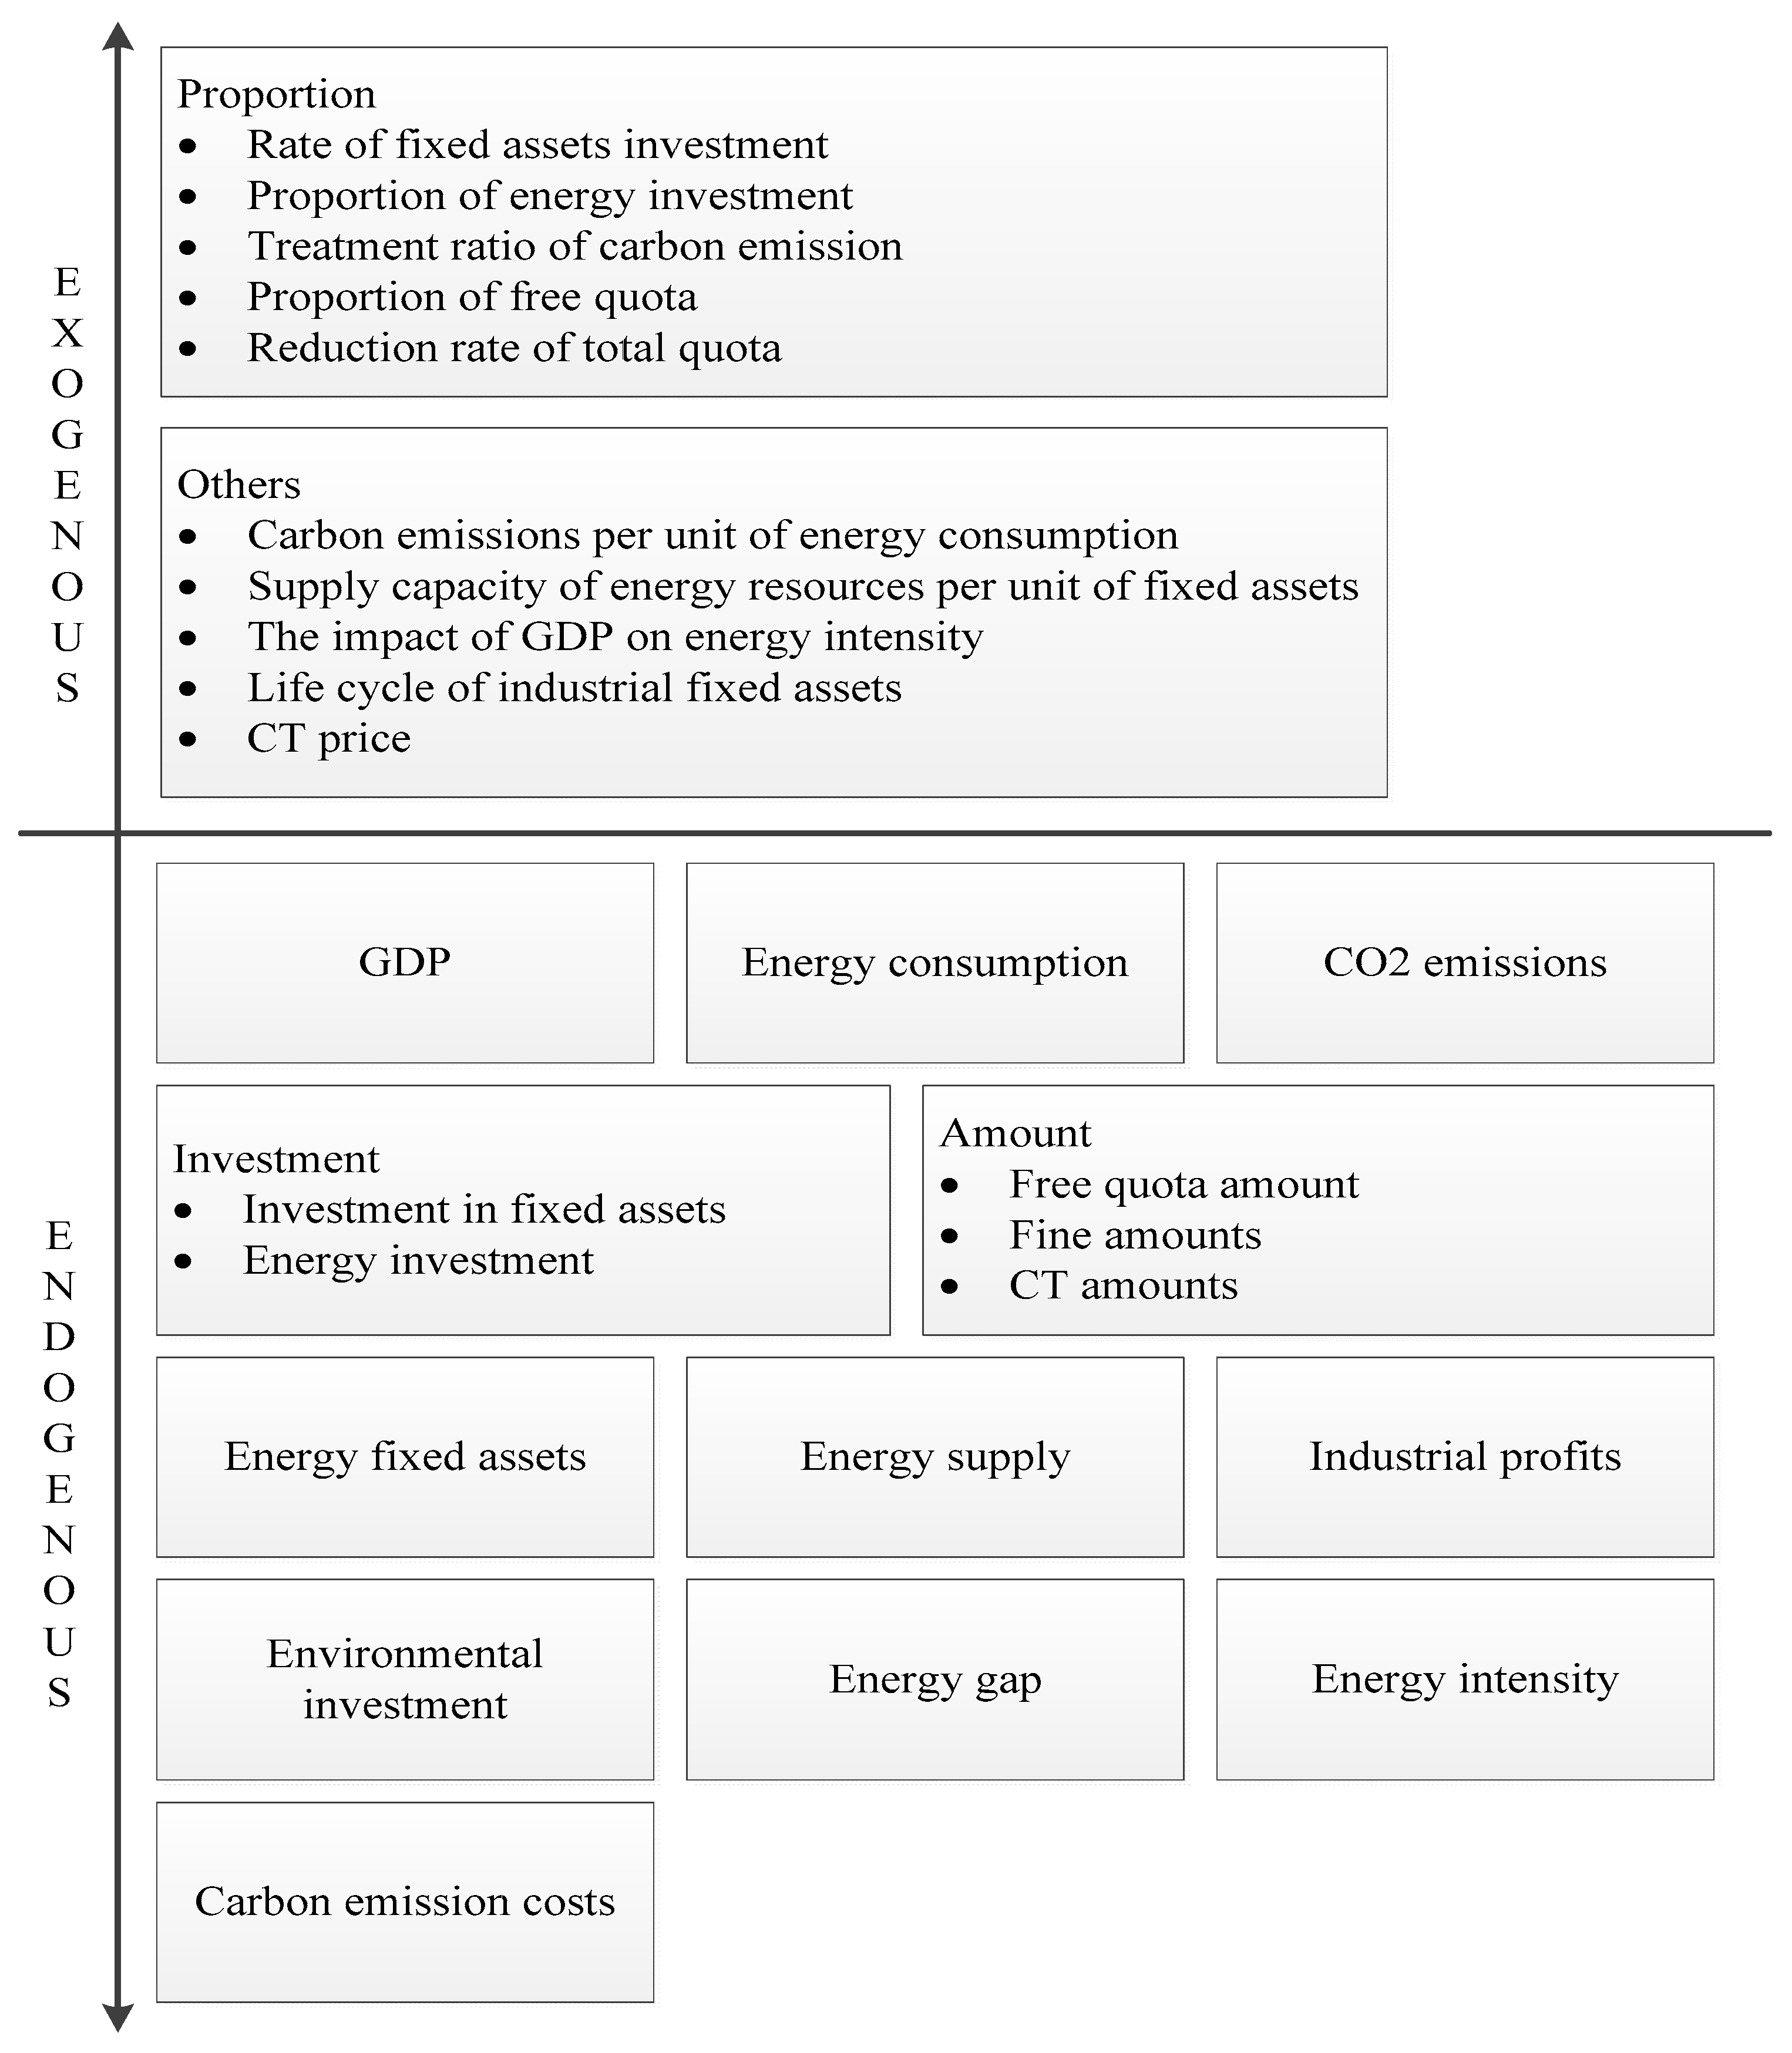
- (1)
- Direct determination. Some variable values can be directly obtained from the statistical yearbook or the CES survey data of the Beijing-Tianjin-Hebei region, such as GDP, energy fixed assets, and total quota.
- (2)
- Linear regression method. When assigning some economic auxiliary variables, there is no direct data source in reality, and it is necessary to fit these economic auxiliary variables based on historical data and quantitative regression analysis, such as GDP growth, industrial profits, and environmental governance costs.
- (3)
- Average value method. For some variables that are not significant with time, the average value is taken as the constant value according to the principle of simplifying the model as much as possible, such as the treatment ratio of carbon emission, carbon emissions per unit of energy consumption, supply capacity of energy resources per unit of fixed assets, and the life cycle of industrial fixed assets.
- (4)
- Logical inference. In the process of economic model operation, the initial values of some economic variables cannot meet the needs of the model under the conditions of the above assignment methods. For these economic variables, the initial values are confirmed by repeatedly running through the models according to the statistical data, such as reduction rate of total quota, proportion of free quota, and CT price.
- (5)
- Table function. For some variables that change over time, their values are determined by table functions in Vensim, such as rate of fixed assets investment, proportion of energy investment, and the impact of GDP on energy intensity. The values of each parameter are shown in Table 3.
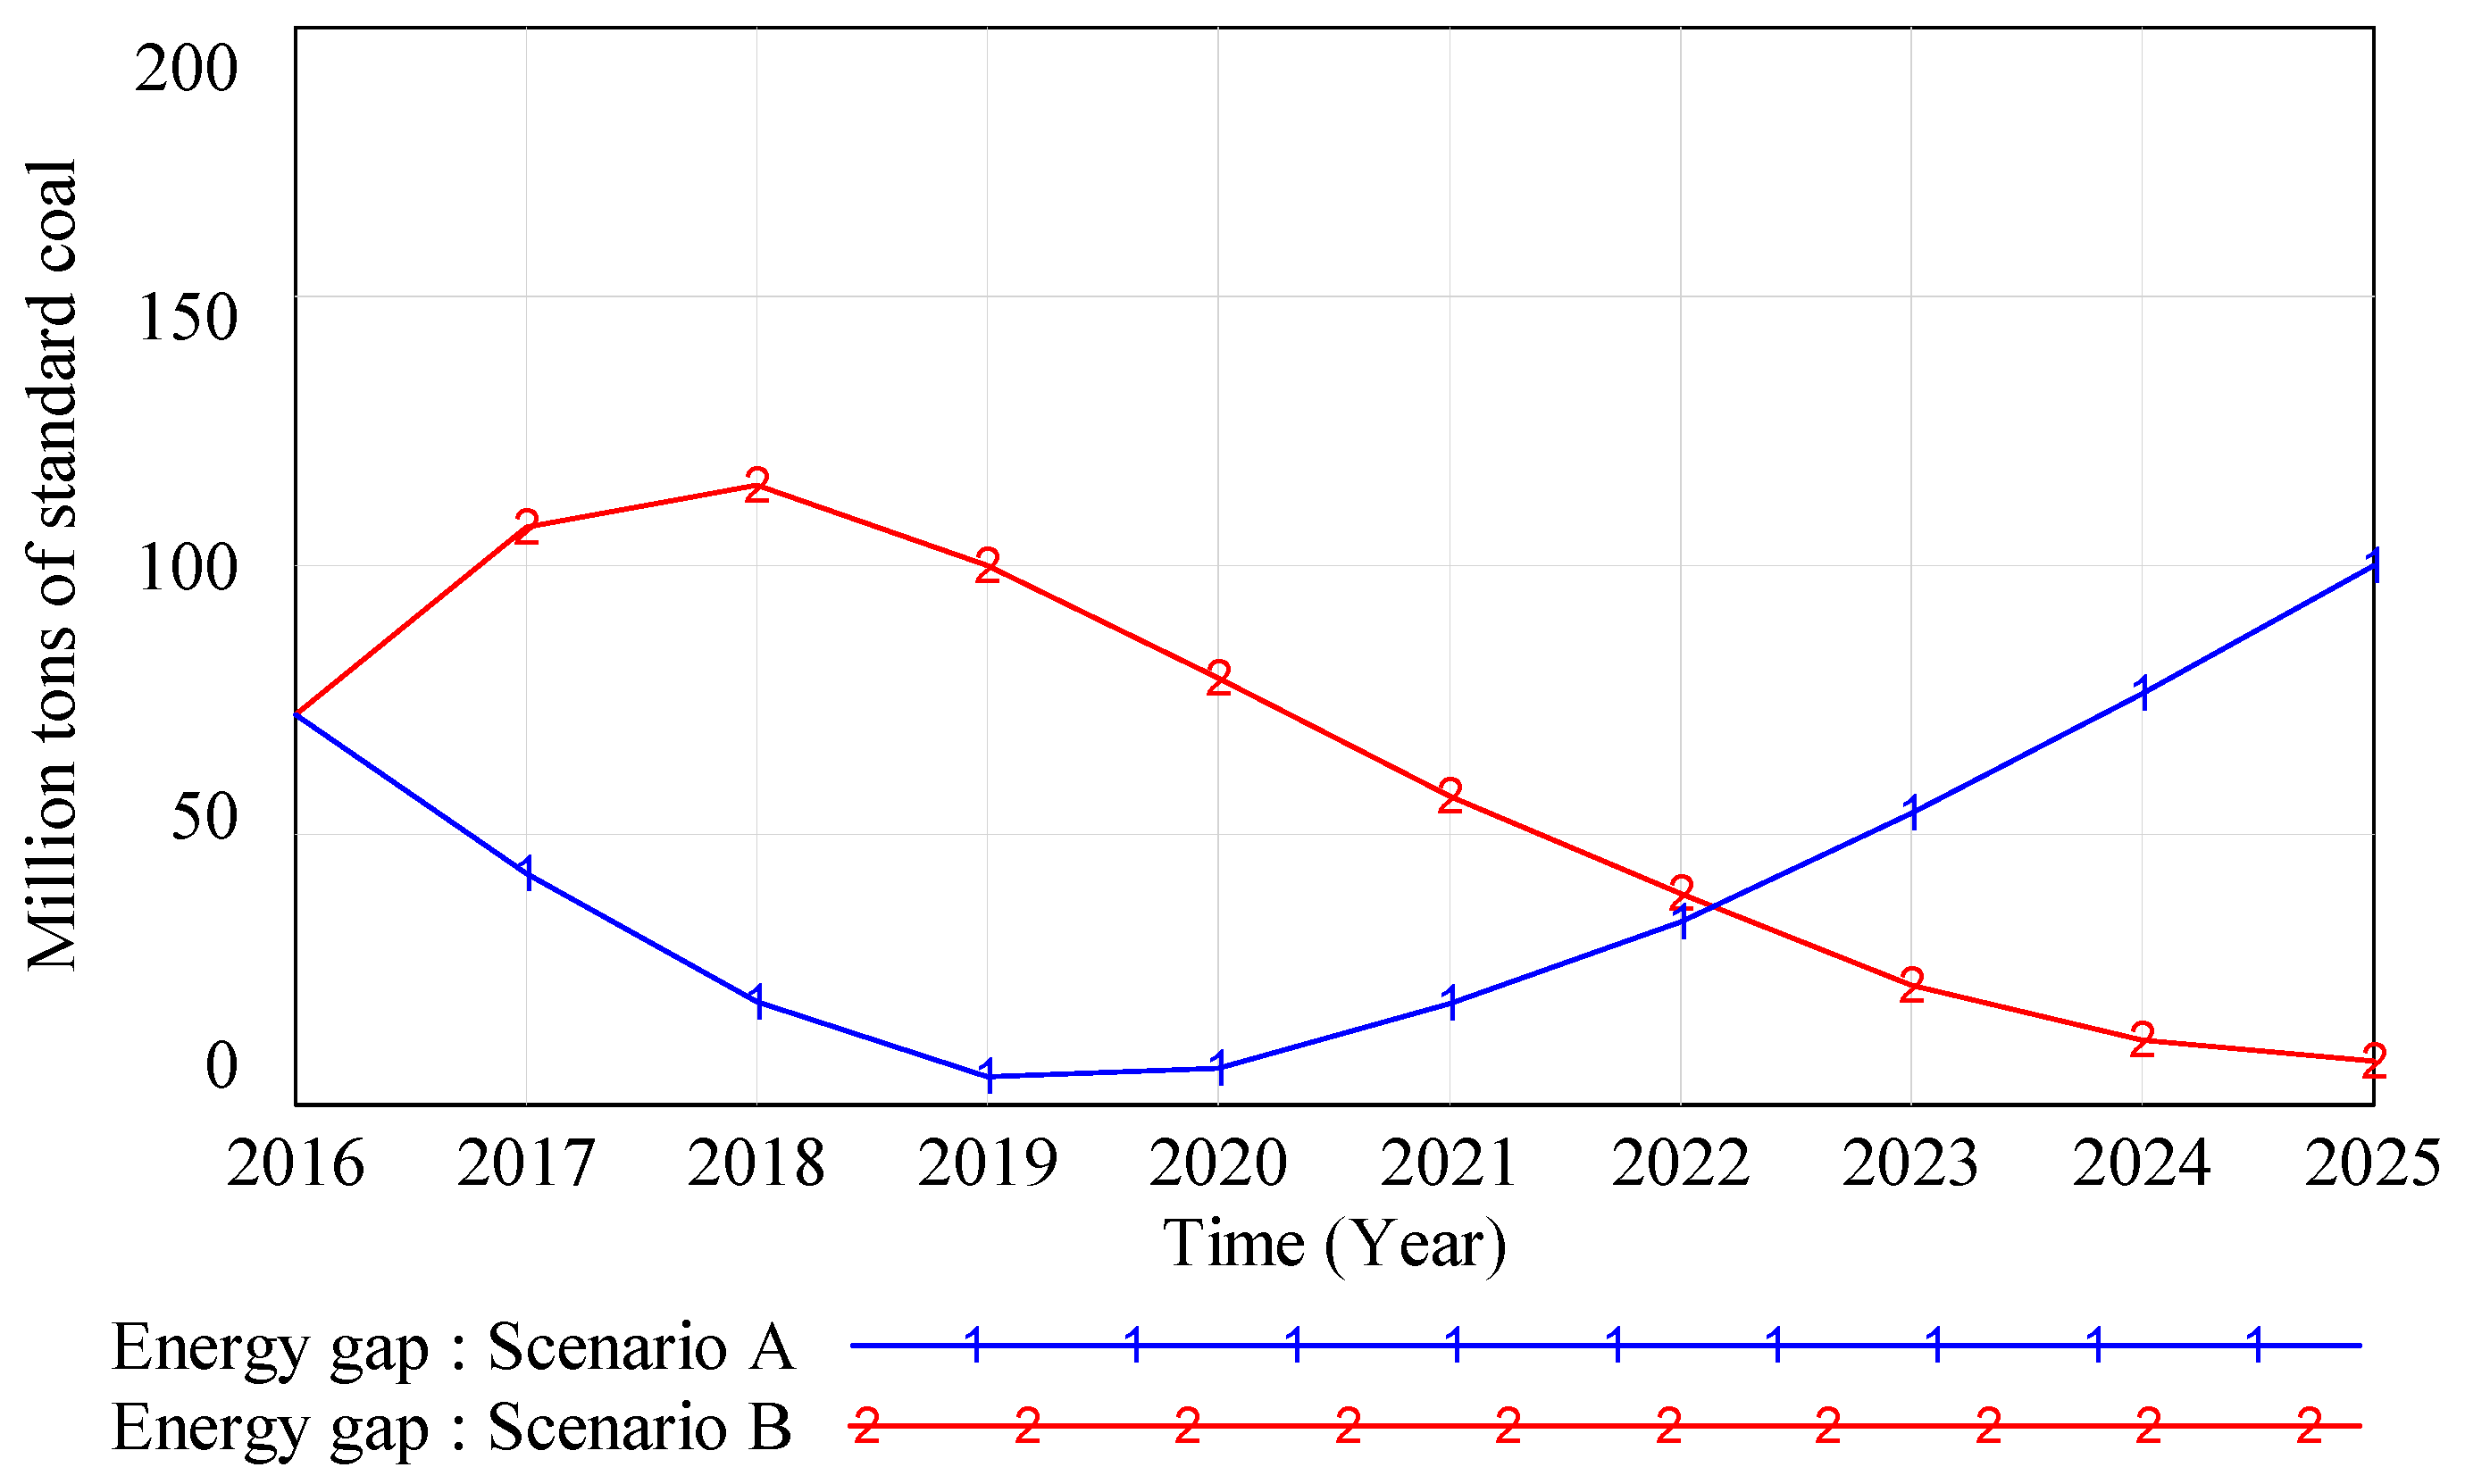
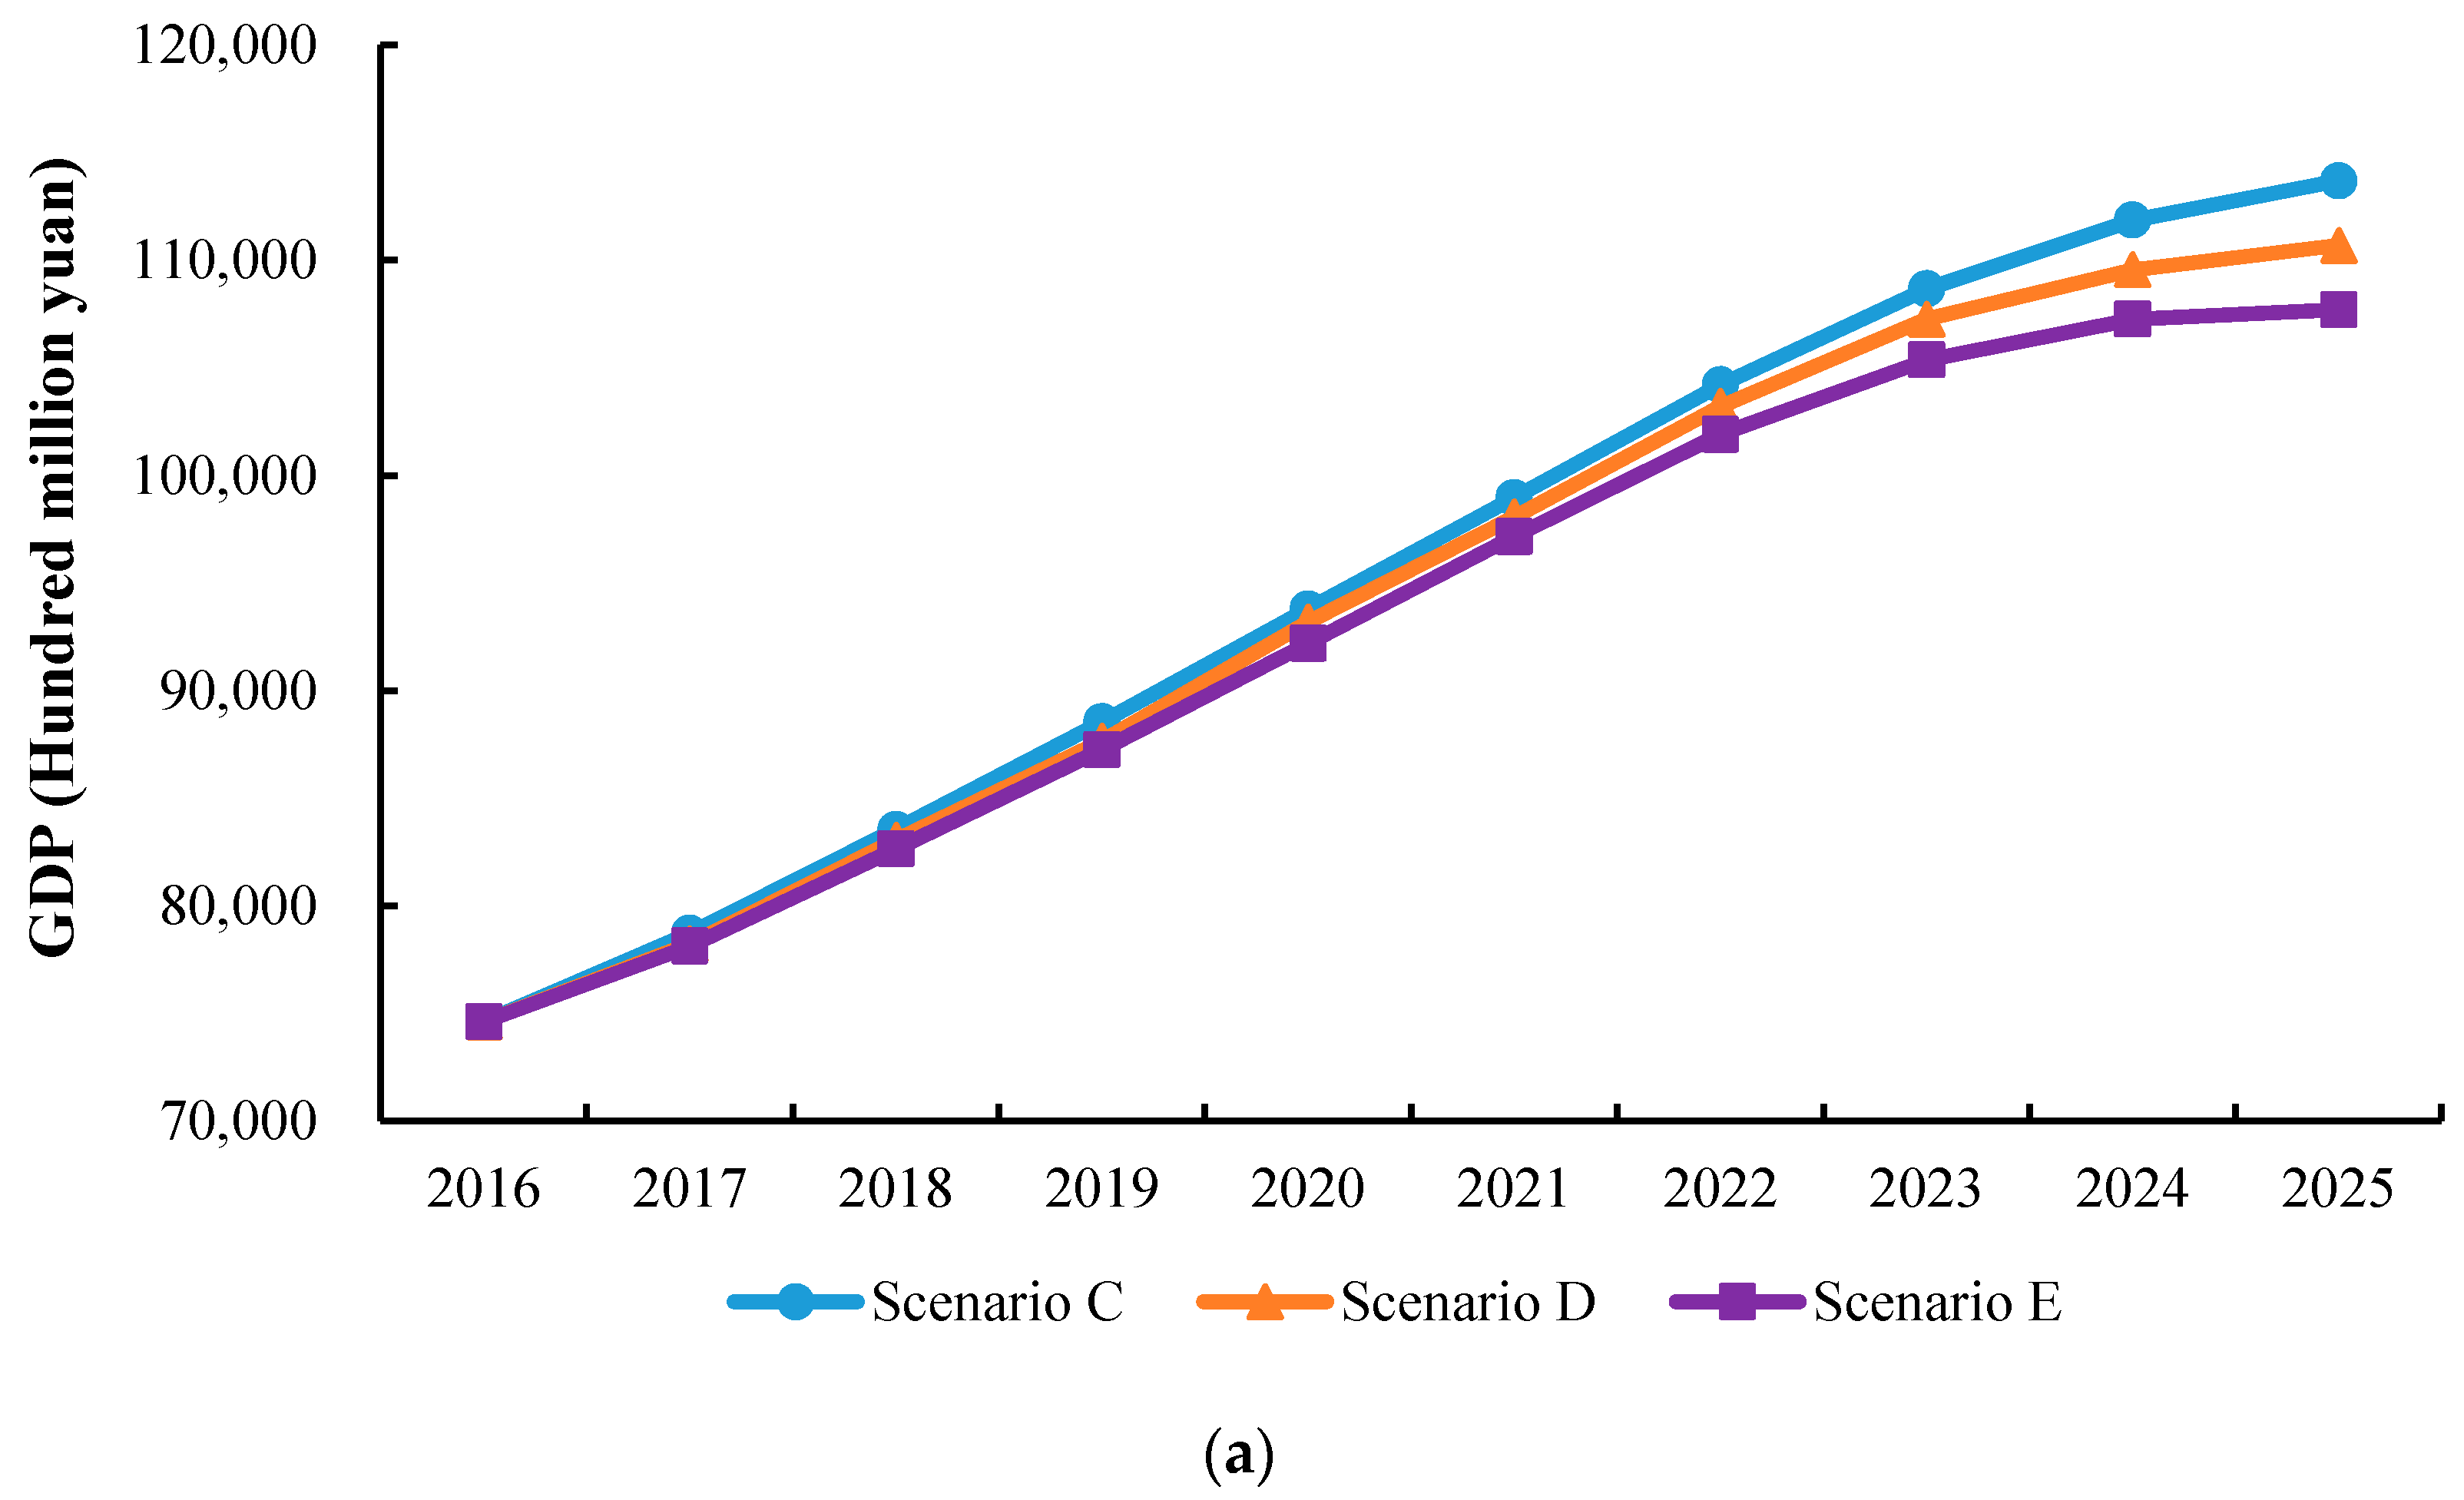
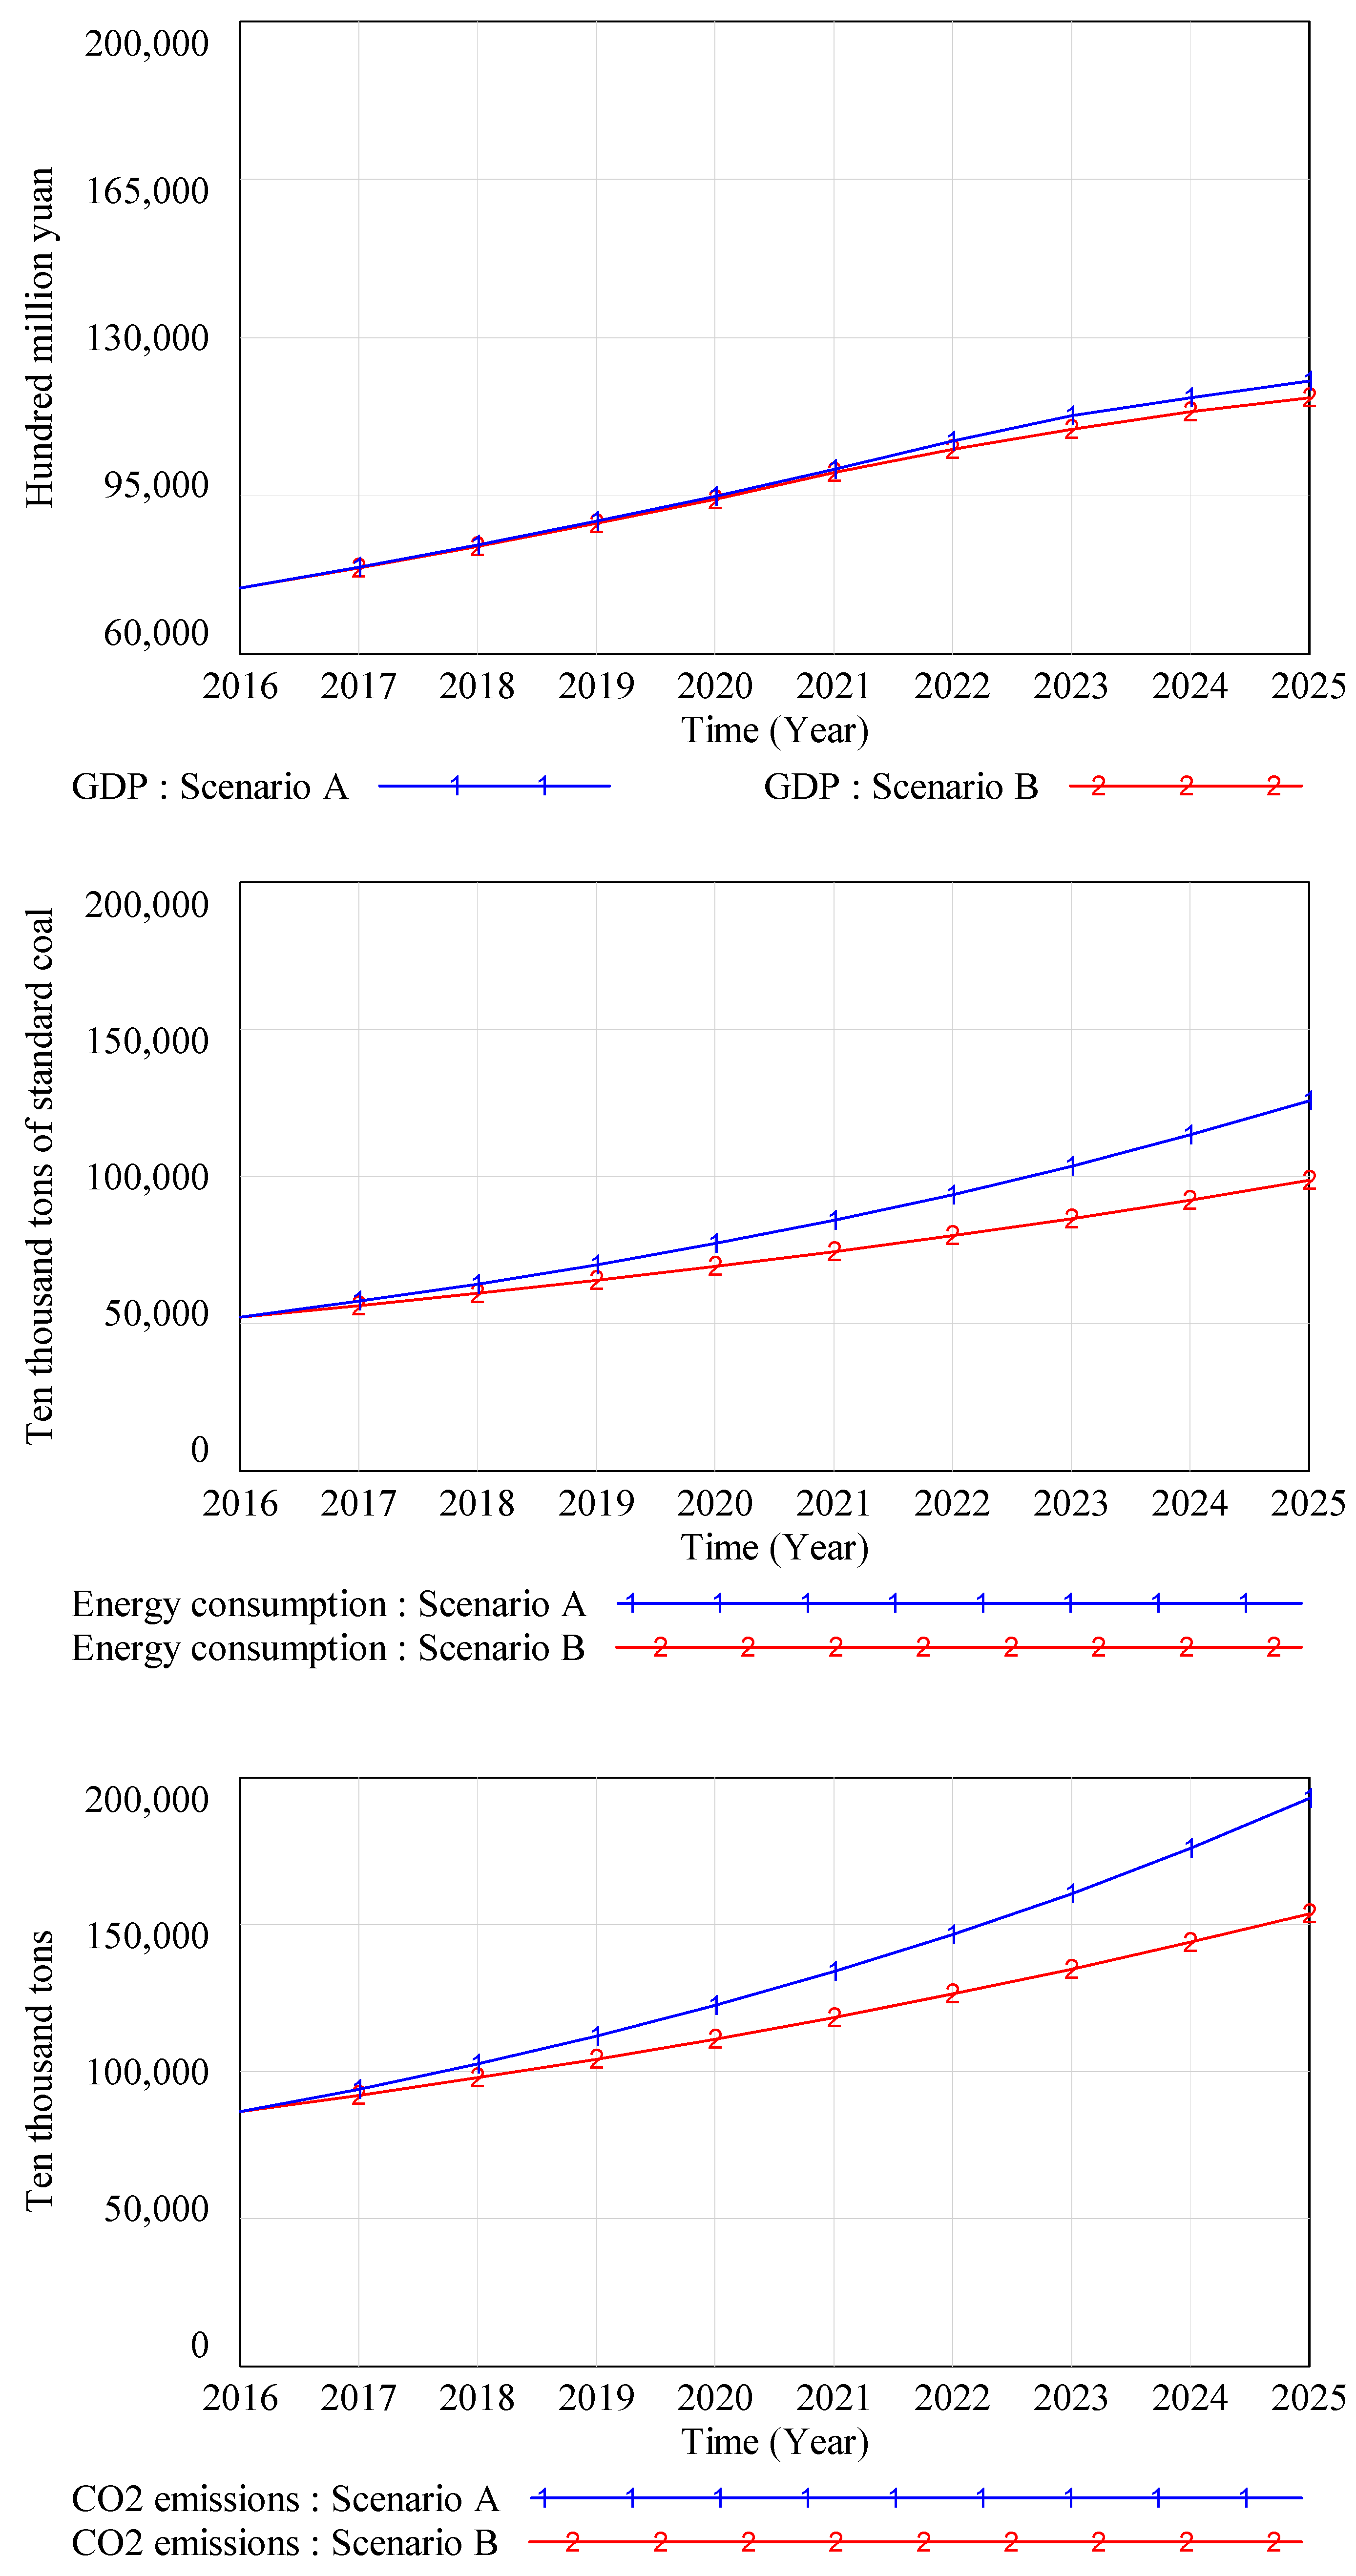
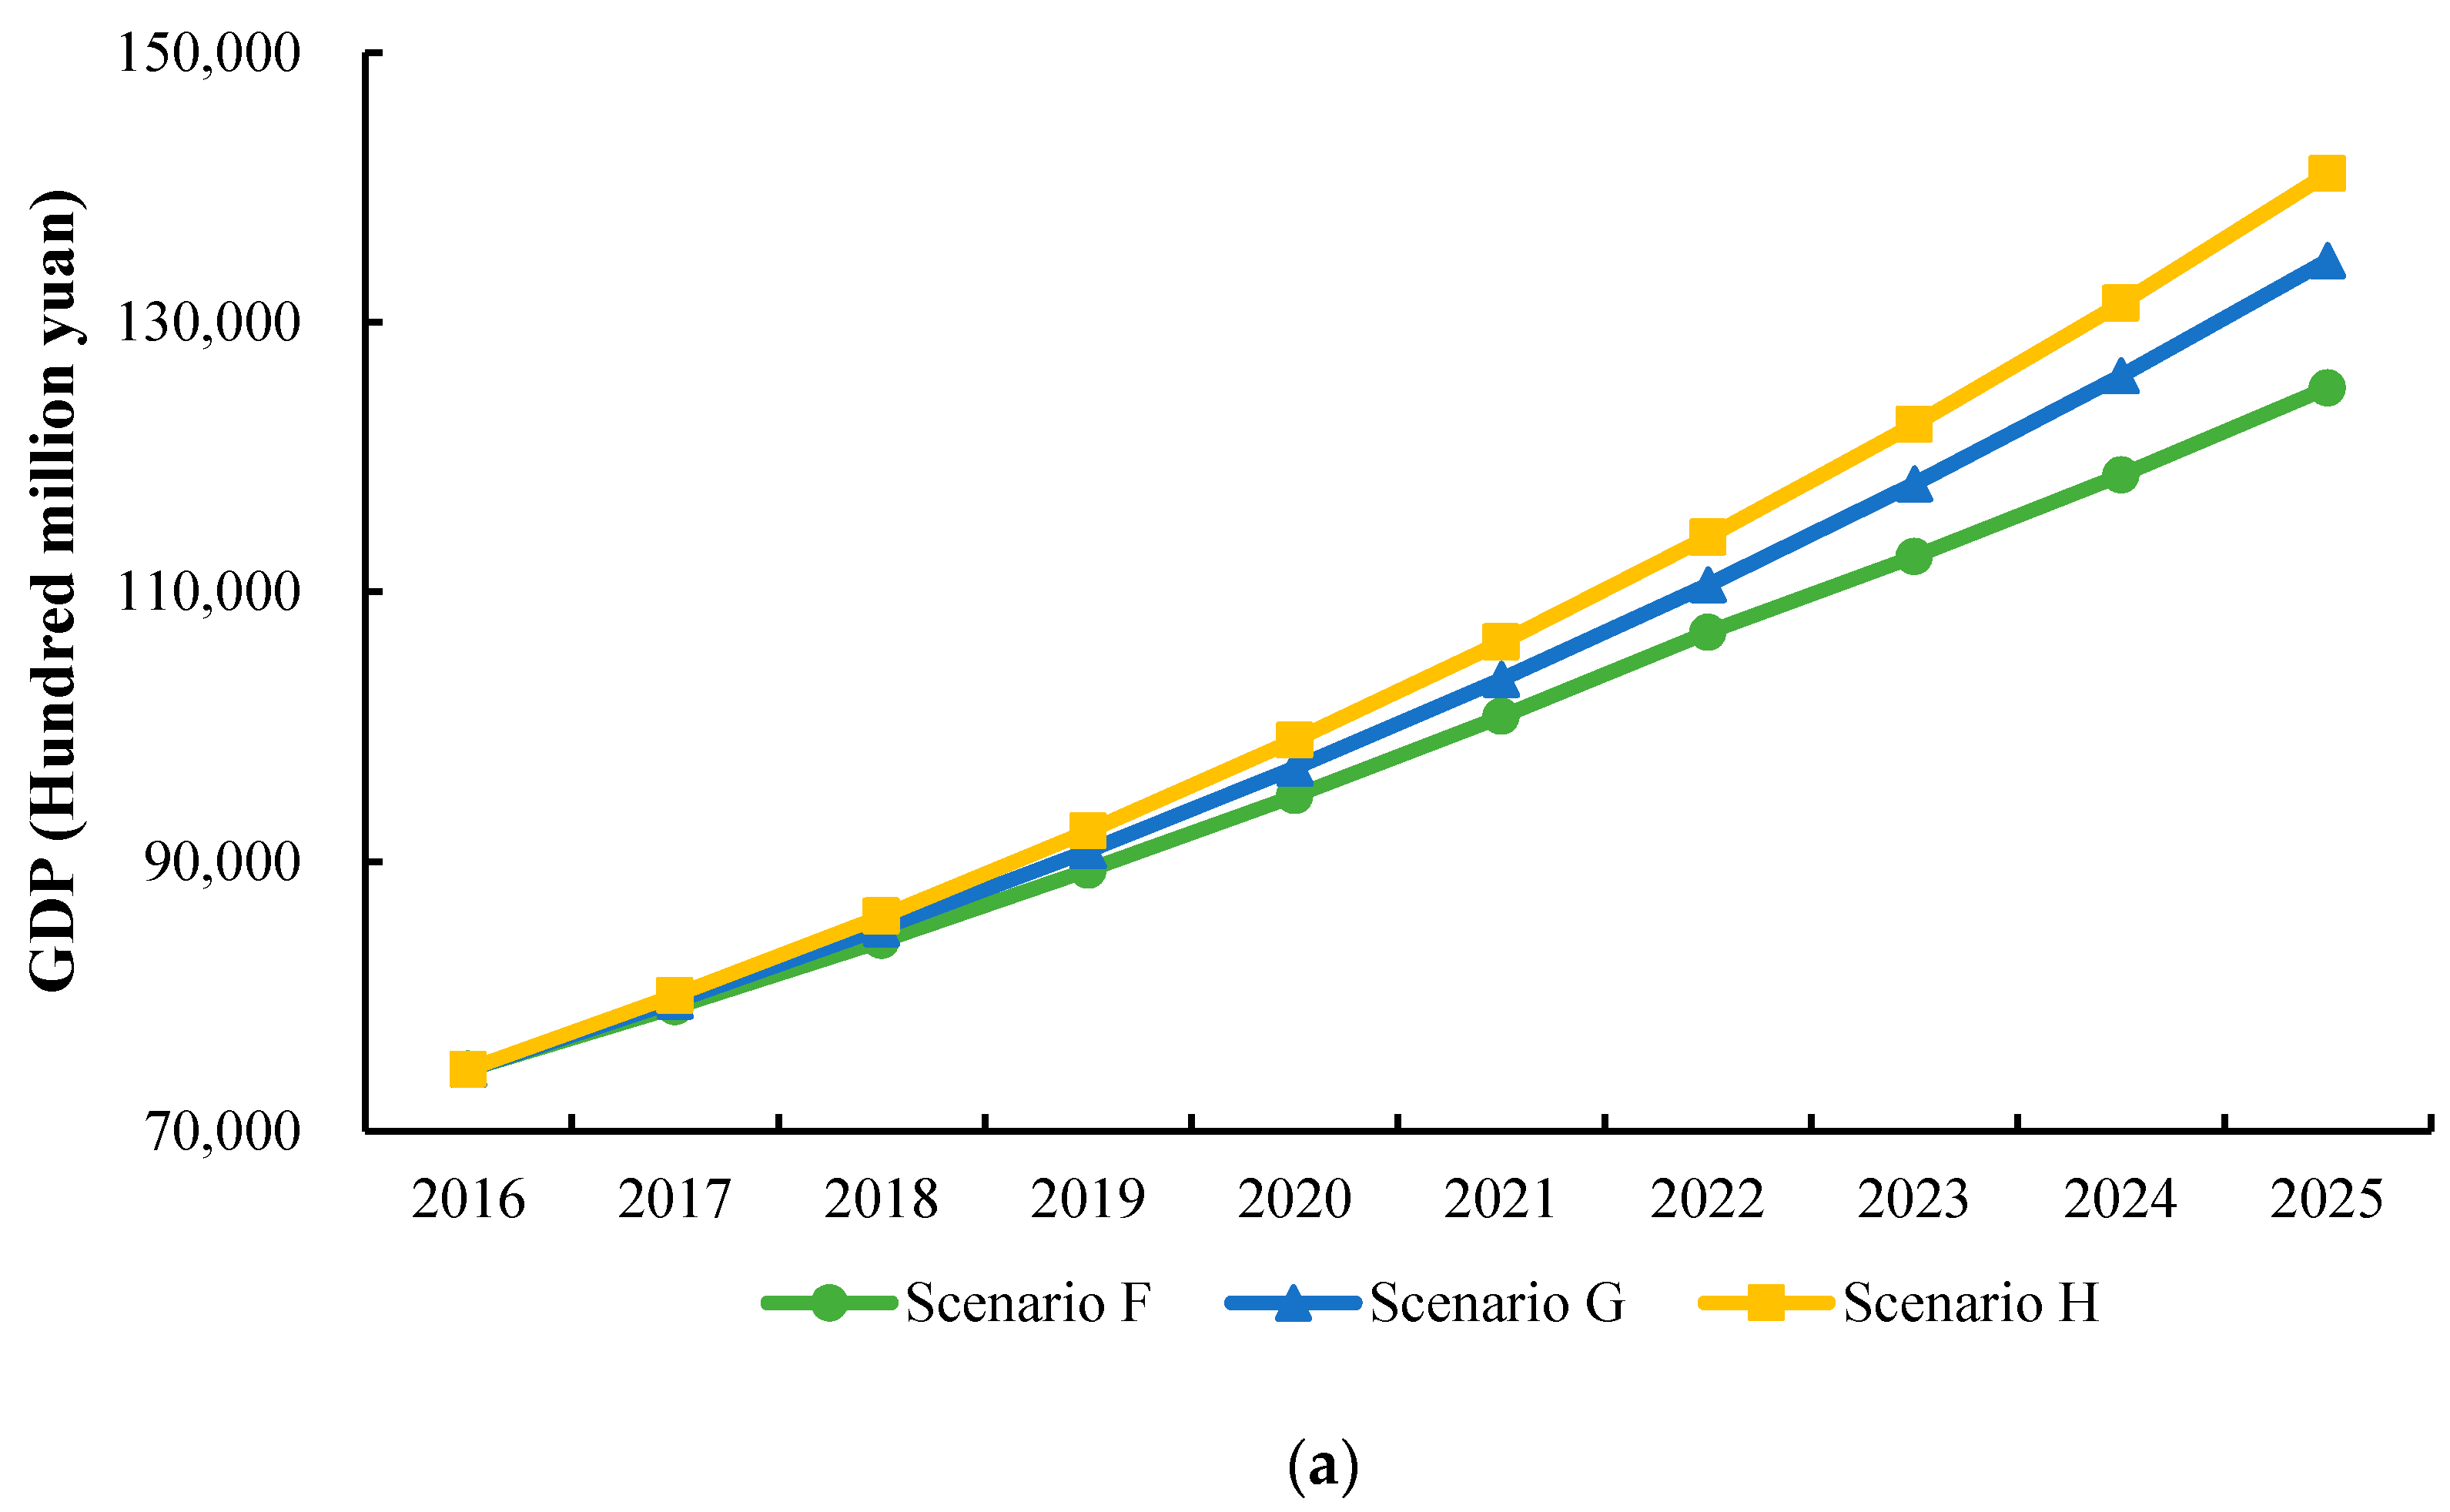
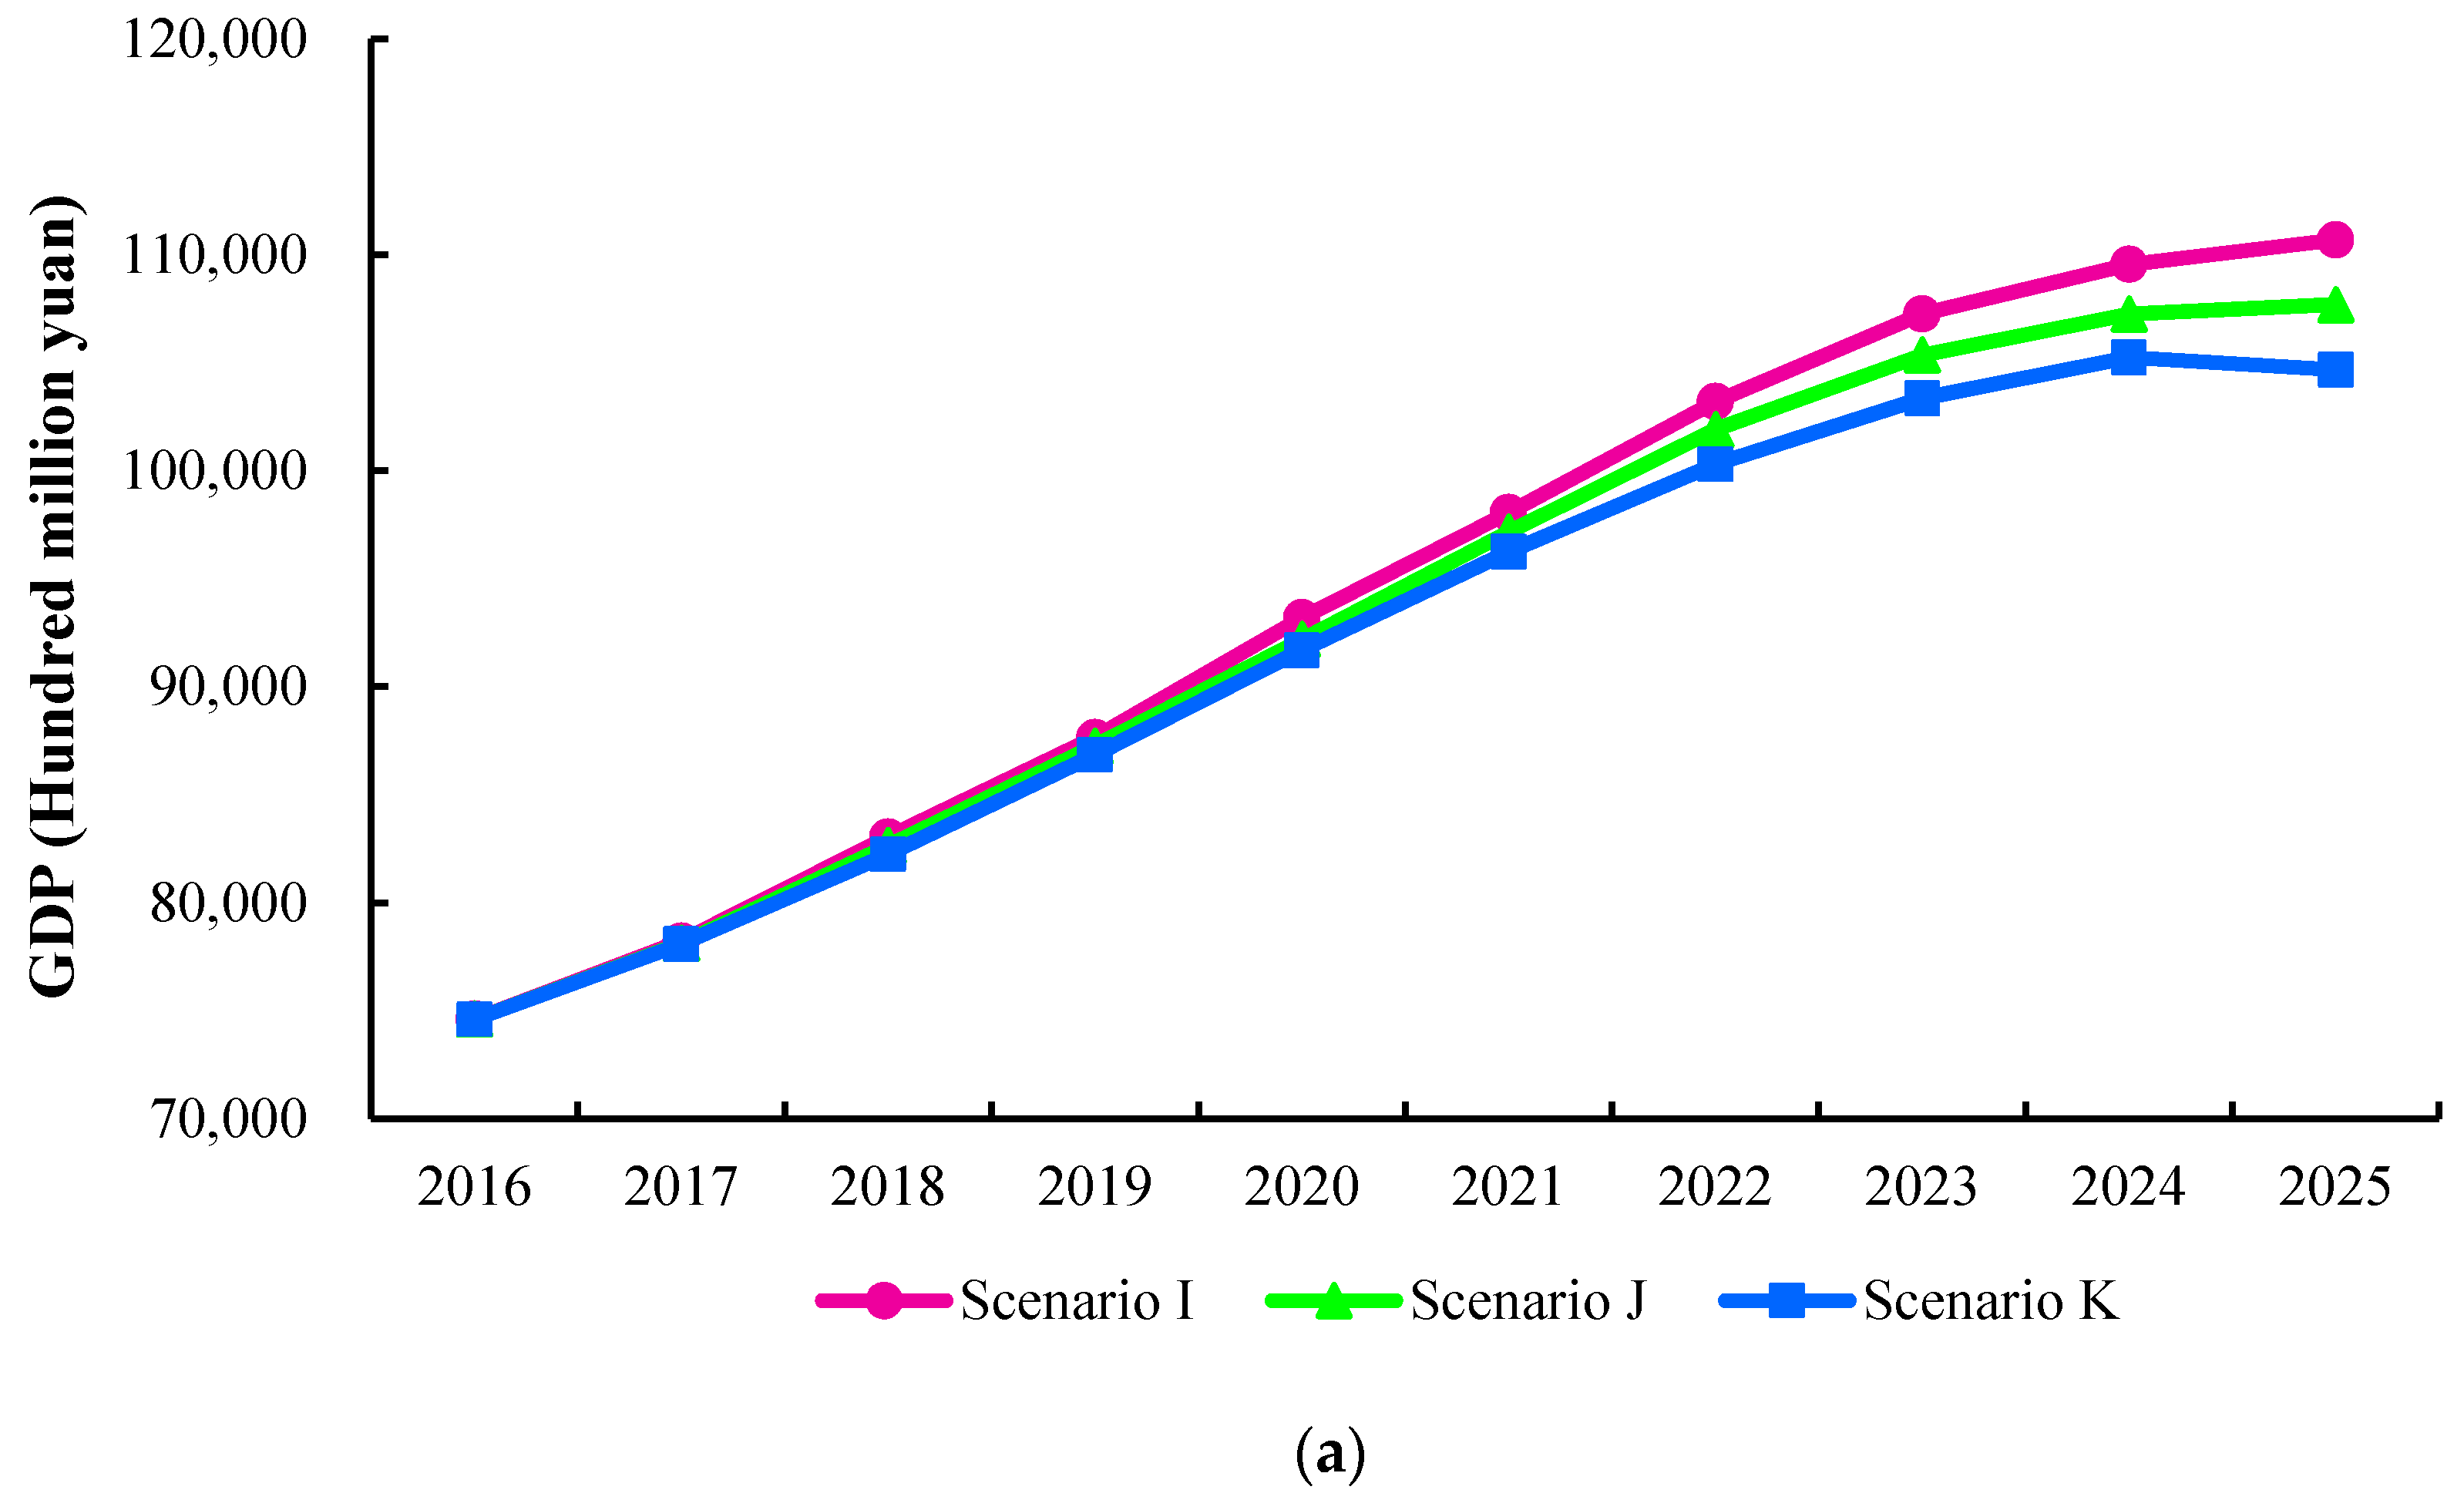
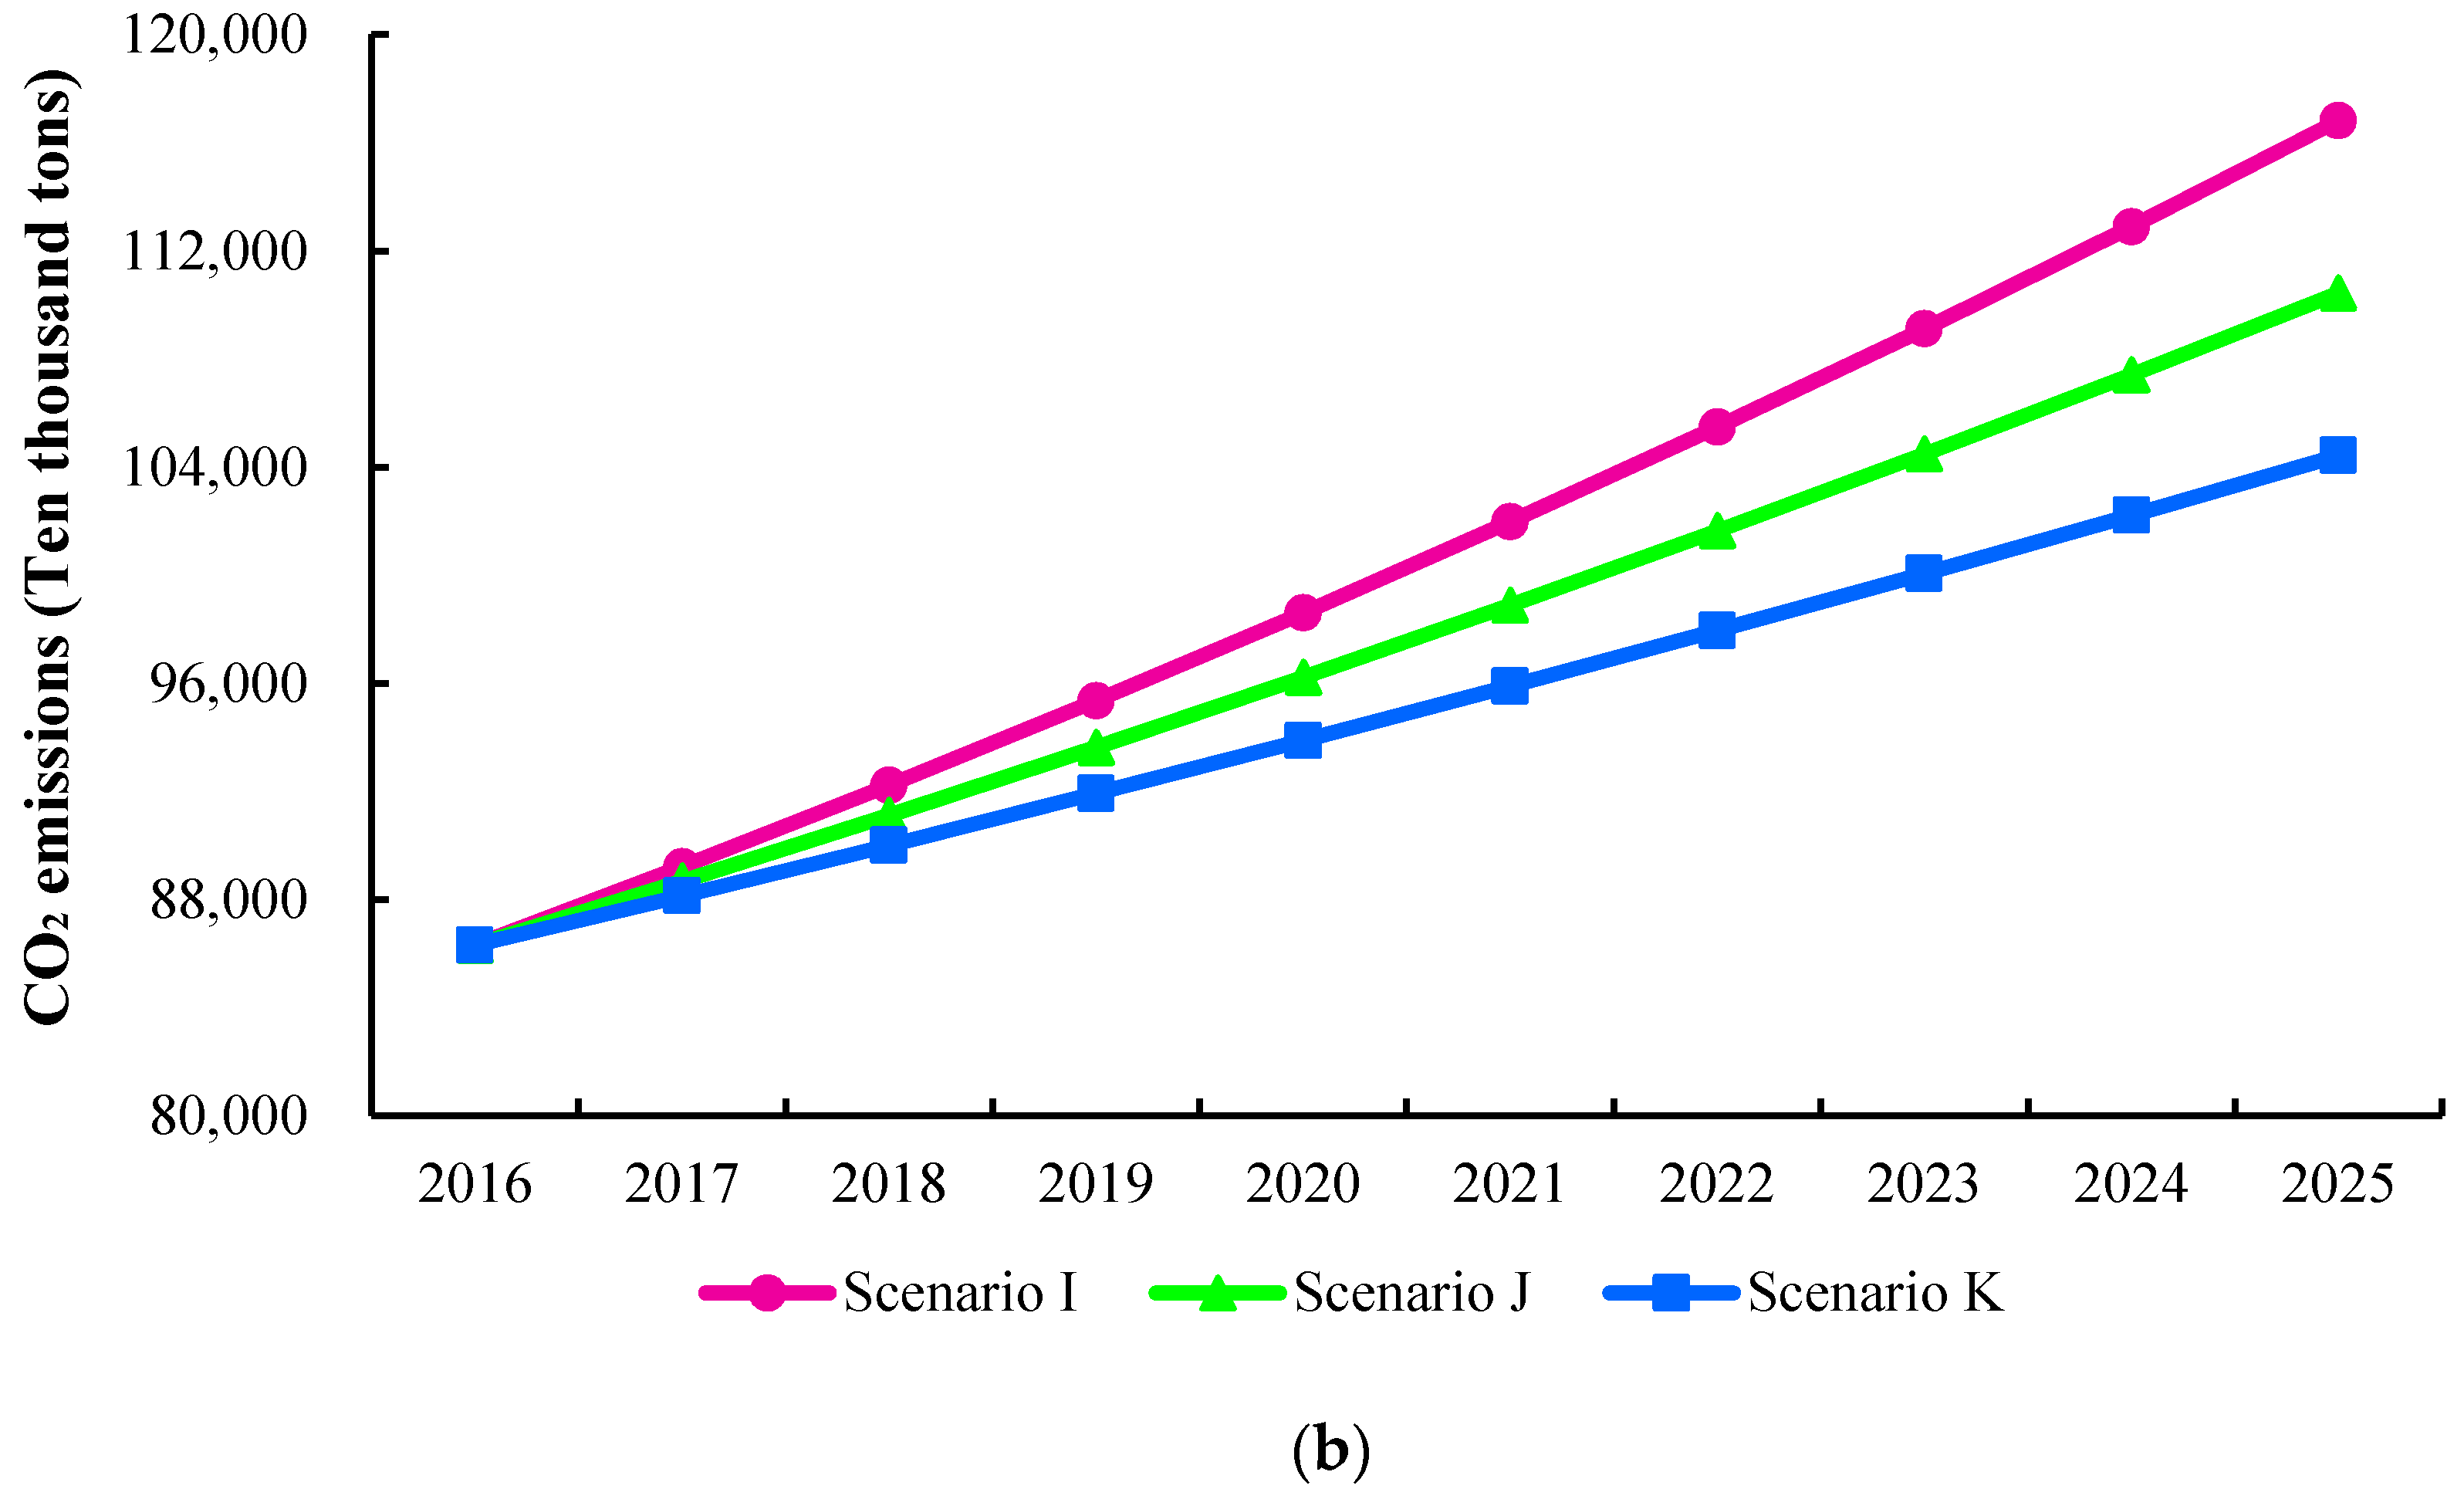
3.2. Simulation Results
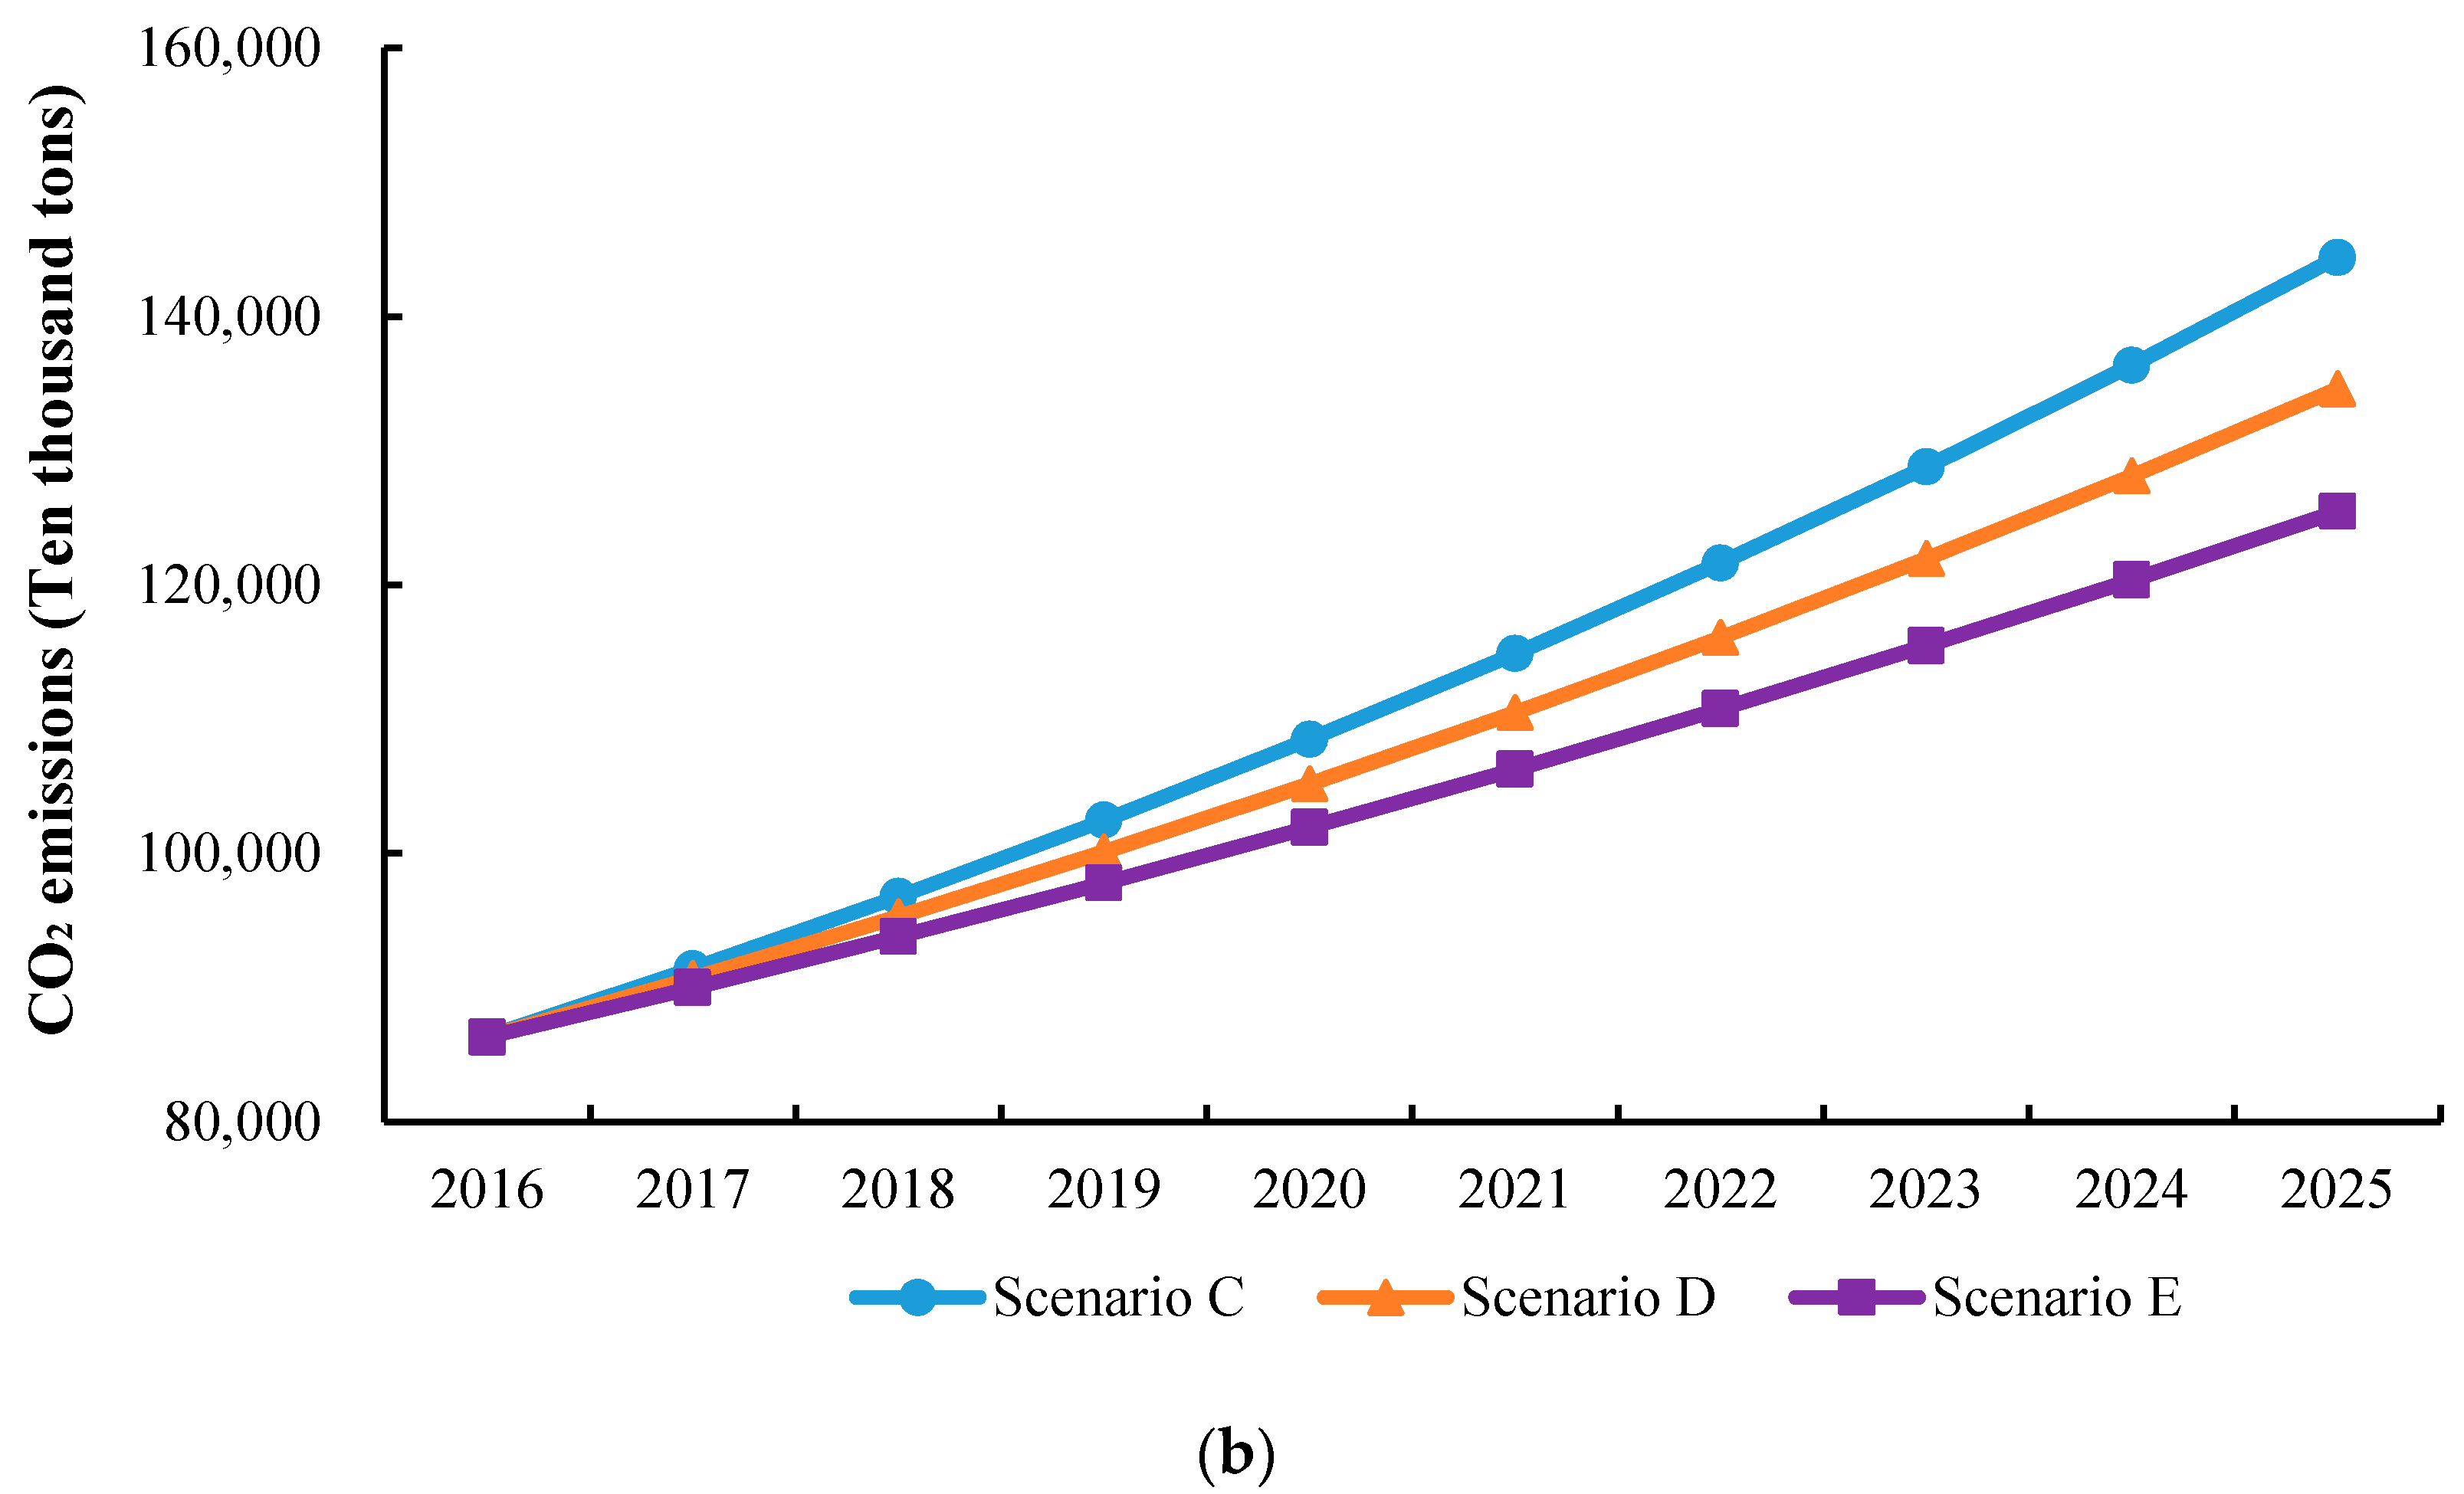
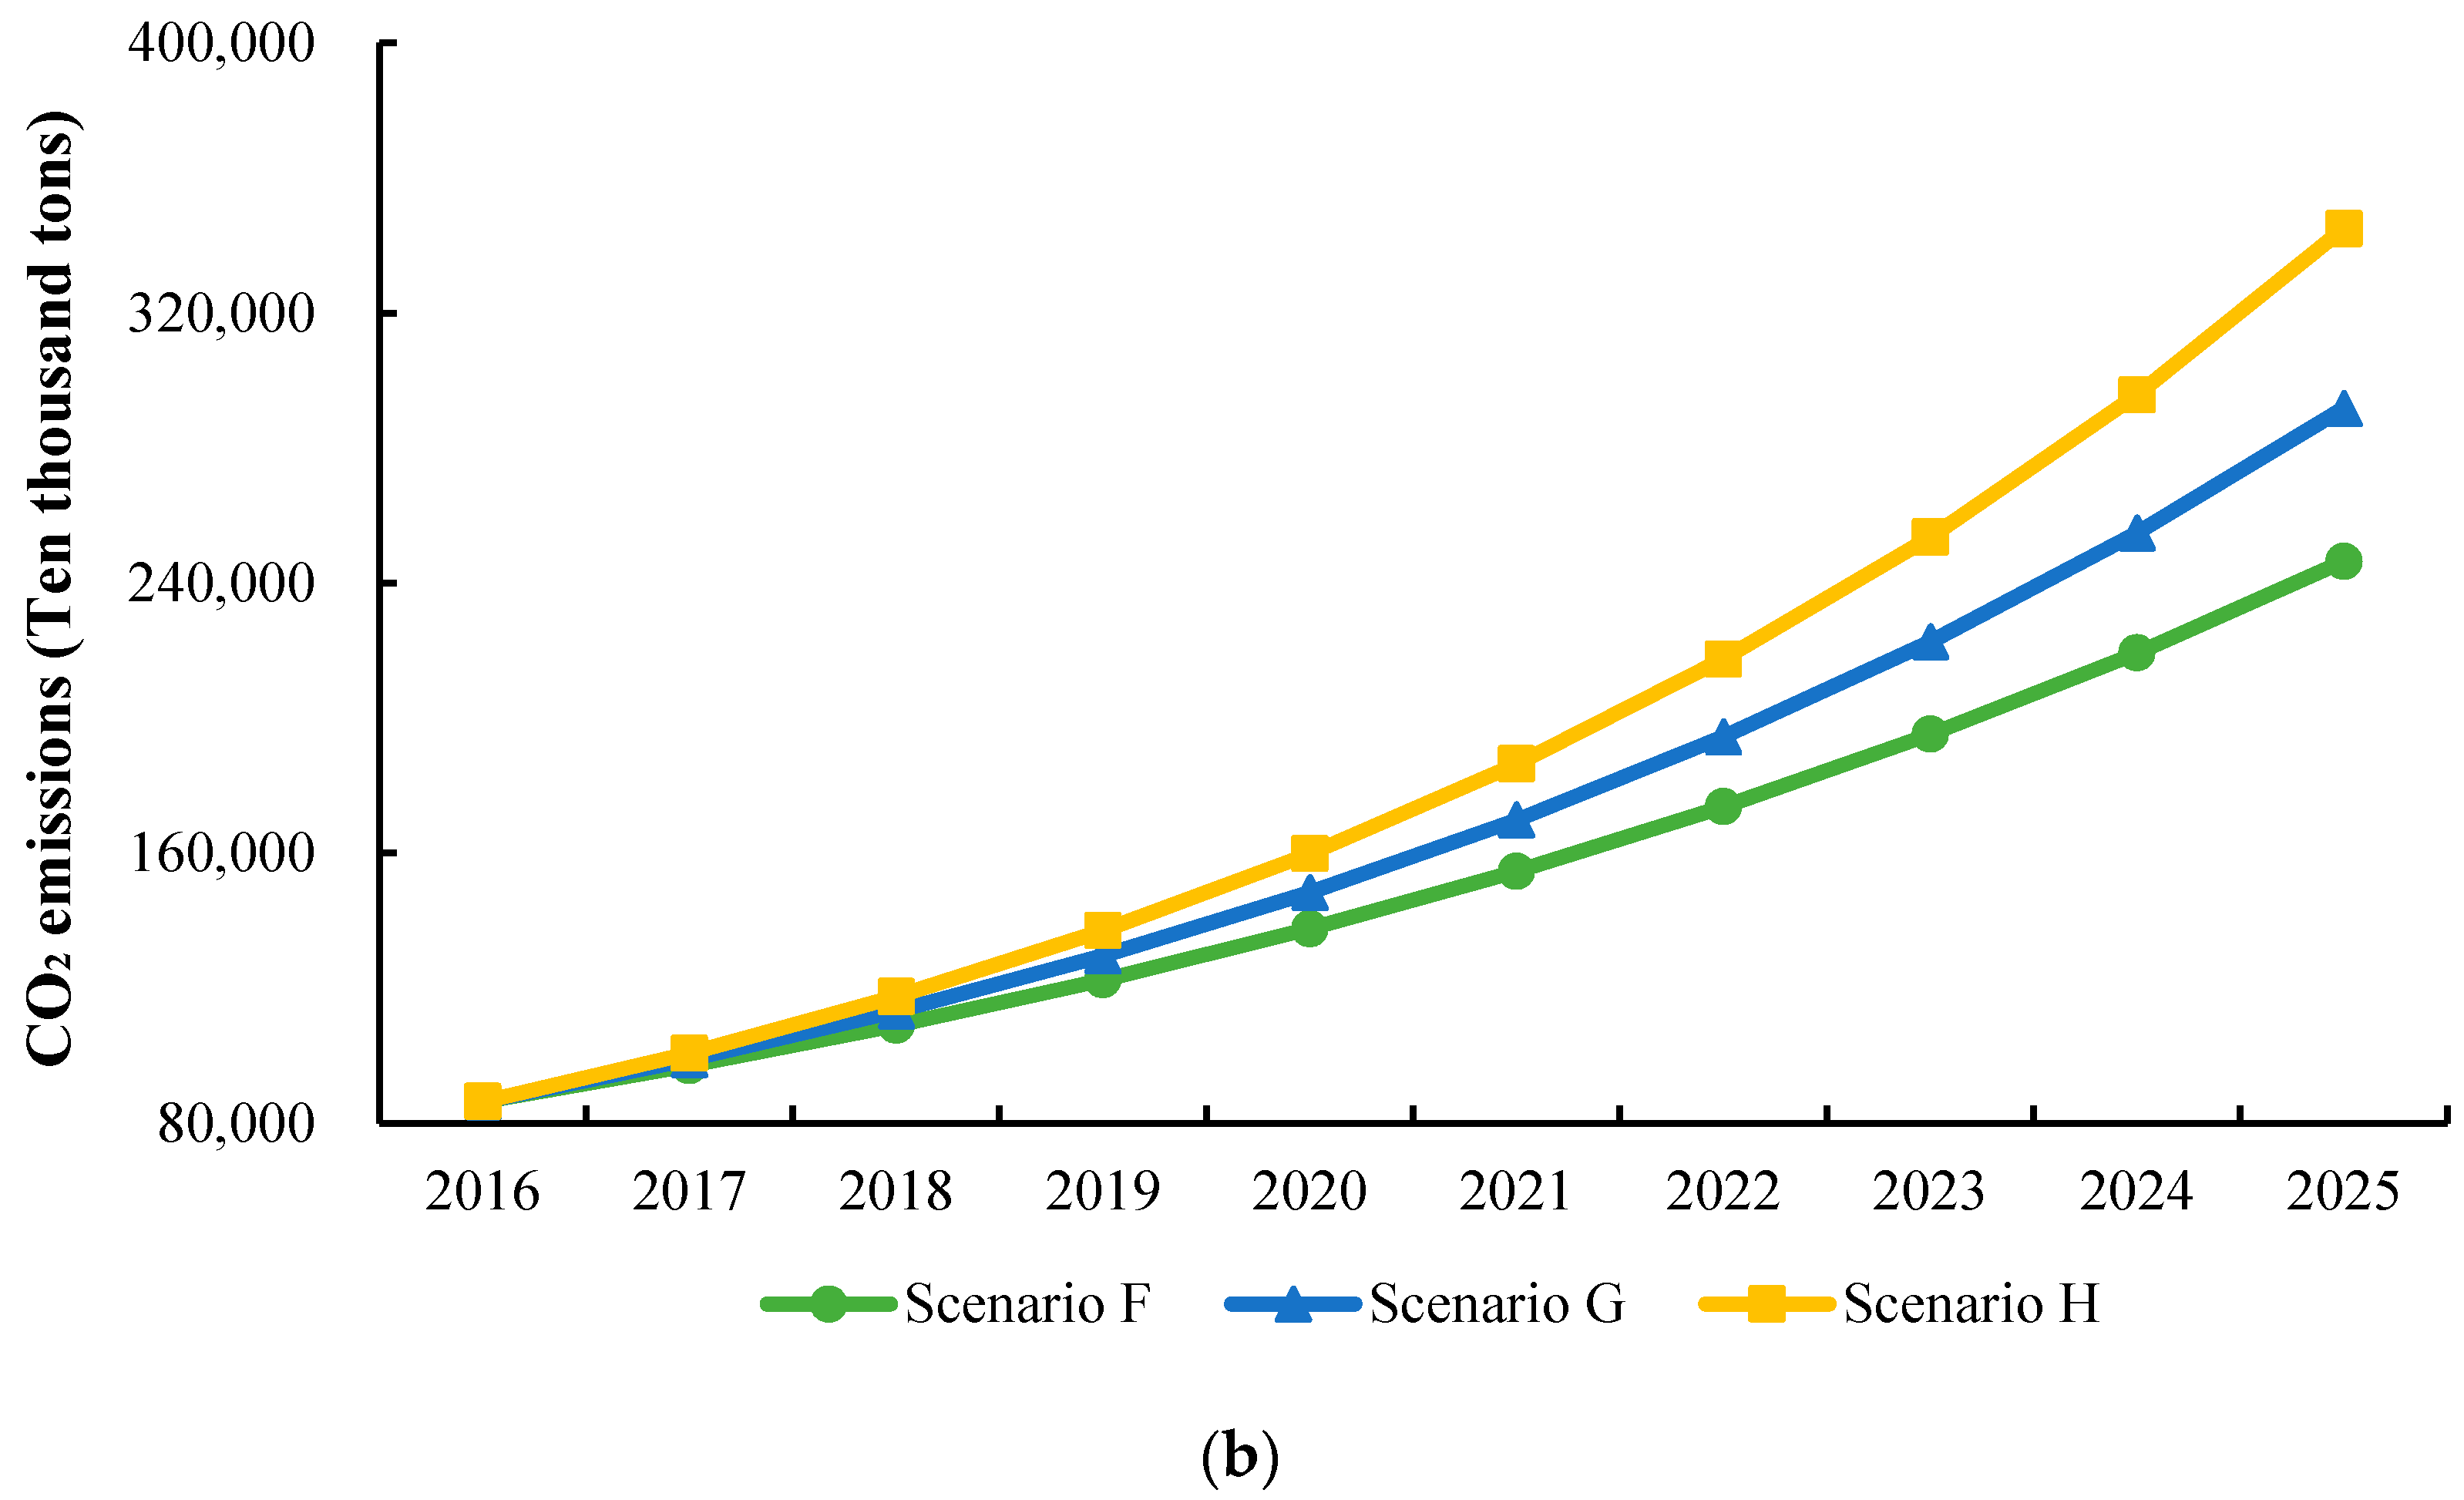
4. Discussion
4.1. Reduction Rate of Total Quota
4.2. Proportion of Free Quota
4.3. CT Price
5. Conclusions
Acknowledgments
Author Contributions
Conflicts of Interest
Appendix A
- (1)
- Carbon emission costs = CT amounts × CT price + Fine amounts × Fine price
- (2)
- Carbon emissions per unit of energy consumption = 3.89
- (3)
- CO2 emissions = Carbon emissions per unit of energy consumption × Energy consumption-Treatment investment of carbon emission × 2 × 10⁻²
- (4)
- CT amounts = Total quota − Free quota amount
- (5)
- CT price = 40
- (6)
- Decrease of energy intensity = Effect of energy conservation policy − GDP × The impact of GDP on energy intensity × 1.2 × 10⁻⁵
- (7)
- Depreciation of energy fixed assets = Energy fixed assets/Life cycle of industrial fixed assets
- (8)
- Effect of energy conservation policy = Intensity of energy conservation policies × 1.1
- (9)
- Energy consumption = Energy intensity × GDP
- (10)
- Energy fixed assets = INTEG (Increment of energy fixed asset − Depreciation of energy fixed assets, 16,273.3)
- (11)
- Energy gap = Energy consumption − Energy supply
- (12)
- Energy intensity = INTEG (Decrease of energy intensity, 0.726)
- (13)
- Energy investment = GDP × Proportion of energy investment
- (14)
- Energy supply = Energy fixed assets × Supply capacity of energy resources per unit of fixed assets
- (15)
- Environmental governance costs = 0.0258 × CO2 emissions − 782.15
- (16)
- Environmental investment = GDP × Investment proportion of environmental protection
- (17)
- Fine amounts = CO2 emissions − CT amounts − Free quota amount
- (18)
- Fine price = 0.2 × CT price
- (19)
- Free quota amount = CO2 emissions × Proportion of free quota
- (20)
- GDP = INTEG (GDP growth, 74612.6)
- (21)
- GDP growth = 1912.12 + 4.116 × Industrial profits + 0.828 × Investment in fixed assets − 8.585 × Environmental governance costs
- (22)
- Increment of energy fixed asset = Energy investment × 1.6 × 10⁻⁵
- (23)
- Industrial profits = −5 × 10⁻¹¹ × GDP3+5 × 10⁻⁶ × GDP2 − 0.0336 × GDP + 274.77 − Carbon emission costs
- (24)
- Intensity of energy conservation policies = Energy gap × 3 × 10⁻⁴
- (25)
- Investment in fixed assets = GDP × Rate of fixed assets investment
- (26)
- Investment proportion of environmental protection = CO2 emissions × 9 × 10⁻³
- (27)
- Life cycle of industrial fixed assets = 240
- (28)
- Proportion of energy investment = WITH LOOKUP (Time, ([(2016, 0.25) − (2025, 0.43)],(2016, 0.25),(2017, 0.27),(2018, 0.28),(2019, 0.3),(2020, 0.31),(2021, 0.33),(2022, 0.36),(2023, 0.38),(2024, 0.41),(2025, 0.43)))
- (29)
- Proportion of free quota = 0.6
- (30)
- Rate of fixed assets investment = WITH LOOKUP (Time,([(2016, 0.65) − (2025, 0.75)],(2016, 0.658),(2017, 0.664),(2018, 0.673),(2019, 0.686),(2020, 0.695),(2021, 0.712),(2022, 0.724),(2023, 0.733),(2024, 0.736),(2025, 0.741))
- (31)
- Reduction rate of total quota = 0.01
- (32)
- Supply capacity of energy resources per unit of fixed assets = 54,716
- (33)
- The impact of GDP on energy intensity = WITH LOOKUP (Time,([(2016, 1) − (2025, 2)],(2016, 1),(2017, 1.1),(2018, 1.2),(2019, 1.4),(2020, 1.5),(2021, 1.6),(2022, 1.7),(2023, 1.8),(2024, 1.9),(2025, 2)))
- (34)
- Total quota = INTEG (Total quota reduction, 53,417)
- (35)
- Total quota reduction = Total quota × Reduction rate of total quota
- (36)
- Treatment investment of carbon emission = Environmental investment × Treatment ratio of carbon emission
- (37)
- Treatment ratio of carbon emission = 0.336
Appendix B
- (1)
- GDP growth = 1912.12 + 4.116 × Industrial profits + 0.828 × Investment in fixed assets − 8.585 × Environmental governance costs
- (2)
- Industrial profits = −5 × 10⁻¹¹ × GDP3 + 5 × 10⁻⁶ × GDP2 − 0.0336 × GDP + 274.77 − Carbon emission costs
- (3)
- Environmental governance costs = 0.0258 × CO2 emissions − 782.15
- (4)
- ([(2016, 0.65) − (2025, 0.75)],(2016, 0.658),(2017, 0.664),(2018, 0.673),(2019, 0.686),(2020, 0.695),(2021, 0.712),(2022, 0.724),(2023, 0.733),(2024, 0.736),(2025, 0.741))
- (5)
- ([(2016, 0.25) − (2025, 0.43)],(2016, 0.25),(2017, 0.27),(2018, 0.28),(2019, 0.30),(2020, 0.31),(2021, 0.33),(2022, 0.36),(2023, 0.38),(2024, 0.41),(2025, 0.43))
- (6)
- ([(2016, 1) − (2025, 2)],(2016, 1.0),(2017, 1.1),(2018, 1.2),(2019, 1.4),(2020, 1.5),(2021, 1.6),(2022, 1.7),(2023, 1.8),(2024, 1.9),(2025, 2.0))
References
- China Stock Net. The Chinese Government Will Set up a Nationwide CT Market by 2018. 2017. Available online: http://news.cnstock.com/news,bwkx-201711-4156446.htm (accessed on 26 November 2017).
- Chappin, E.J.L.; Dijkema, G.P.J. On the impact of CO2, emission-trading on power generation emissions. Technol. Forecast. Soc. Chang. 2009, 76, 358–370. [Google Scholar] [CrossRef]
- Mo, J.L.; Zhu, L.; Fan, Y. The impact of the EU ETS on the corporate value of European electricity corporations. Energy 2012, 45, 3–11. [Google Scholar] [CrossRef]
- Tang, L.; Wu, J.; Yu, L.; Bao, Q. Carbon emissions trading scheme exploration in China: A multi-agent-based model. Energy Policy 2015, 81, 152–169. [Google Scholar] [CrossRef]
- Cong, R.G.; Wei, Y.M. Potential impact of carbon emissions trading (CET) on China’s power sector: A perspective from different allowance allocation options. Energy 2010, 35, 3921–3931. [Google Scholar] [CrossRef]
- Zhao, X.; Jiang, G.; Nie, D.; Chen, H. How to improve the market efficiency of carbon trading: a perspective of China. Renew. Sustain. Energy Rev. 2016, 59, 1229–1245. [Google Scholar] [CrossRef]
- Wang, Q.; Wang, S. Study on market efficiency of China’s carbon trading market. Soc. Sci. J. 2014, 4, 30–36. [Google Scholar]
- Zhao, X.G.; Wu, L.; Li, A. Research on the efficiency of carbon trading market in China. Renew. Sustain. Energy Rev. 2017, 79, 1–8. [Google Scholar] [CrossRef]
- Liu, J.P.; Zhang, X.B.; Song, X.H. Regional carbon emission evolution mechanism and its prediction approach driven by carbon trading-A case study of Beijing. J. Clean. Prod. 2017. [Google Scholar] [CrossRef]
- Kanamura, T. Role of carbon swap trading and energy prices in price correlations and volatilities between carbon markets. Energy Econ. 2016, 54, 204–212. [Google Scholar] [CrossRef]
- Rannou, Y.; Barneto, P. Futures trading with information asymmetry and OTC predominance: Another look at the volume/volatility relations in the European carbon markets. Energy Econ. 2014, 53, 159–174. [Google Scholar] [CrossRef]
- Balietti, A.C. Trader types and volatility of emission allowance prices. Evidence from EU ETS phase I. Energy Policy 2015, 98, 607–620. [Google Scholar] [CrossRef]
- Yin, L.; Mei, F. The Short Economic Impact of Carbon Emission Trade System on High Energy-consuming Industries in Hubei Province. J. Sichuan Normal Univ. 2016, 39, 437–443. [Google Scholar]
- Zhou, S. Economic and Environmental Impacts of the Shanghai Carbon Emission Trading: Based on CGE Model Analysis. Adv. Clim. Chang. Res. 2015, 11, 144–152. [Google Scholar]
- Zhang, X.; Qi, T.Y.; Ou, X.M.; Zhang, X.L. Research on the Energy and Economic Impacts of Multi-region Linked Emissions Trading System. Energy Procedia 2015, 75, 2495–2503. [Google Scholar]
- Koljonen, T.; Savolainen, I. Impact of the EU Emissions Trading Directive on the Energy and Steel Industries in Finland. Available online: https://www.sciencedirect.com/science/article/pii/B9780080447049500847 (accessed on 1 January 2018).
- Schleich, J.; Rogge, K.; Betz, R. Incentives for energy efficiency in the EU Emissions Trading Scheme. Energy Effic. 2009, 2, 37–67. [Google Scholar] [CrossRef]
- Kamarzamana, N.A.; Tan, C.W. A comprehensive review of maximum power point tracking algorithms for photovoltaic systems. Renew. Sustain. Energy Rev. 2014, 37, 585–598. [Google Scholar] [CrossRef]
- Ming, Z.; Zhang, K.; Dong, J. Overall review of China’s wind power industry: Status quo, existing problems and perspective for future development. Renew. Sustain. Energy Rev. 2013, 24, 379–386. [Google Scholar] [CrossRef]
- Guo, X.D.; Guo, X.P. China’s photovoltaic power development under policy incentives: A system dynamics analysis. Energy 2015, 93, 589–598. [Google Scholar] [CrossRef]
- Zuo, Y.; Shi, Y.L.; Zhang, Y.Z. Research on the Sustainable Development of an Economic-Energy-Environment (3E) System Based on System Dynamics (SD): A Case Study of the Beijing-Tianjin-Hebei Region in China. Sustainability 2017, 9, 1727. [Google Scholar] [CrossRef]
- Zhang, J.R.; Wang, Z.D.; Tang, L.; Yu, L.A. The Simulation of Carbon Emission Trading System in Beijing-Tianjin-Hebei Region: An Analysis Based on System Dynamics. Chin. J. Manag. Sci. 2016, 24, 1–8. [Google Scholar]
- Yuan, C.Q.; Liu, S.F.; Guo, B.H. System dynamics modeling and imitation for Chinese energy-economy system. Chin. J. Manag. Sci. 2011, 19, 717–724. (In Chinese) [Google Scholar]
- Beijing Municipal Commission of Development & Reform. Interim Measures for the Management of Carbon Emissions Trading. 2017. Available online: http://www.bjpc.gov.cn/ (accessed on 9 December 2014).
- Sgouridis, S.; Csala, D. A Framework for Defining Sustainable Energy Transitions: Principles, Dynamics, and Implications. Sustainability 2014, 6, 2601–2622. [Google Scholar] [CrossRef]
- State Statistical Bureau. China Statistical Yearbook 2016; China Statistics Press: Beijing, China, 2017.
- Han, R.; Tang, B.J.; Fan, J.L.; Liu, L.C.; Wei, Y.M. Integrated weighting approach to carbon emission quotas: an application case of Beijing-Tianjin-Hebei region. J. Clean. Prod. 2016, 131, 448–459. [Google Scholar] [CrossRef]
- Zhu, L.; Gan, Q.; Liu, Y.; Yan, Z. The impact of foreign direct investment on SO2 emissions in the Beijing-Tianjin-Hebei region: A spatial econometric analysis. J. Clean. Prod. 2017, 166, 189–196. [Google Scholar] [CrossRef]
- Zhao, H.; Zhang, Q.; Huo, H.; Lin, J.; Liu, Z.; Wang, H.; Guan, D.; He, K. Environment-economy trade off for Beijing-Tianjin-Hebei’s exports. Appl. Energy 2016, 184, 926–935. [Google Scholar] [CrossRef] [Green Version]
- Zhang, Z.; Wang, W.; Cheng, M.; Liu, S.; Xu, J.; He, Y.; Meng, F. The contribution of residential coal combustion to PM 2.5, pollution over China’s Beijing-Tianjin-Hebei region in winter. Atmos. Environ. 2017, 159, 147–161. [Google Scholar] [CrossRef]
- Zhang, Y.Z.; Zhao, X.G.; Ren, L.Z.; Liang, J.; Liu, P.K. The development of China’s biomass power industry under feed-in tariff and renewable portfolio standard: A system dynamics analysis. Energy 2017, 139, 947–961. [Google Scholar]
- State Statistical Bureau. Chinese Energy Statistics Yearbook 2016; China Statistics Press: Beijing, China, 2017; pp. 116–221.
- State Statistical Bureau. Chinese Environmental Statistics Yearbook 2016; China Statistics Press: Beijing, China, 2017; pp. 56–92.


| Structures/Concepts | Remarks |
|---|---|
| Economic and environment subsystems [18,21] | Structural formulation was adopted |
| Energy subsystem [23,25] | Structural formulation was adopted |
| Carbon trading (CT) market [6,22] | Causal structure was adopted |
| 2006 | 2007 | 2008 | 2009 | 2010 | 2011 | 2012 | 2013 | 2014 | 2015 | MAPE (Mean Absolute Percentage Error) | Data Source | |
|---|---|---|---|---|---|---|---|---|---|---|---|---|
| GDP (108 Yuan) | 24,048 | 28,706 | 33,845 | 36,910 | 43,732 | 52,074 | 57,348 | 62,472 | 66,474 | 69,359 | - | [26] |
| simulation results | 24,267 | 29,372 | 34,428 | 37,348 | 44,025 | 52,683 | 57,889 | 62,699 | 66,937 | 69,662 | 1.04% | SD model |
| Energy consumption (104 tons of standard coal) | 31,968 | 34,583 | 35,811 | 37,641 | 41,060 | 43,839 | 45,355 | 46,522 | 48,296 | 50,337 | - | [26] |
| simulation results | 32,473 | 35,129 | 36,307 | 38,022 | 41,839 | 44,279 | 46,075 | 47,013 | 49,060 | 51,127 | 1.42% | SD model |
| CO2 emissions (104 Tons) | 48,884 | 51,912 | 54,668 | 56,985 | 62,501 | 68,821 | 73,086 | 74,509 | 78,200 | 81,968 | - | [26] |
| simulation results | 49,916 | 53,116 | 55,610 | 58,231 | 64,170 | 70,314 | 74,506 | 76,270 | 79,527 | 83,965 | 2.16% | SD model |
| Parameter | Value | Unit | Method of Calculation | Data Sources |
|---|---|---|---|---|
| GDP | 74,612.6 | 108 Yuan | Direct determination | [26] |
| Energy fixed assets | 16,273.3 | 108 Yuan | Direct determination | [26] |
| Total quota | 53,417 | 104 Tons | Direct determination | survey data from CES |
| Energy intensity | 0.726 | - | Direct determination | [32] |
| Treatment ratio of carbon emission | 33.6% | - | Average value | [32] |
| Carbon emissions per unit of energy consumption | 3.89 | Ton/Ton of standard coal | Average value | [32,33] |
| Supply capacity of energy resources per unit of fixed assets | 54,716 | Ton of standard coal/104 Yuan | Average value | [31,32] |
| Life cycle of industrial fixed assets | 20 | Year | Average value | survey data from CES |
| Reduction rate of total quota | 0.01 | - | Logical inference | [22] |
| Proportion of free quota | 0.6 | - | Logical inference | [22] |
| CT price | 40 | Yuan/Ton | Logical inference | [22] |
| GDP growth | (1) of Appendix B | - | Metering method | [26] |
| Industrial profits | (2) of Appendix B | 108 Yuan | Metering method | [26,32] |
| Environmental governance costs | (3) of Appendix B | 108 Yuan | Metering method | [32,33] |
| Rate of fixed assets investment | (4) of Appendix B | - | Table function | [21,26] |
| Proportion of energy investment | (5) of Appendix B | - | Table function | [32] and survey data from CES |
| The impact of GDP on energy intensity | (6) of Appendix B | - | Table function | [26,32] and survey data from CES |
© 2018 by the authors. Licensee MDPI, Basel, Switzerland. This article is an open access article distributed under the terms and conditions of the Creative Commons Attribution (CC BY) license (http://creativecommons.org/licenses/by/4.0/).
Share and Cite
Zhao, X.; Zhang, Y.; Liang, J.; Li, Y.; Jia, R.; Wang, L. The Sustainable Development of the Economic-Energy-Environment (3E) System under the Carbon Trading (CT) Mechanism: A Chinese Case. Sustainability 2018, 10, 98. https://doi.org/10.3390/su10010098
Zhao X, Zhang Y, Liang J, Li Y, Jia R, Wang L. The Sustainable Development of the Economic-Energy-Environment (3E) System under the Carbon Trading (CT) Mechanism: A Chinese Case. Sustainability. 2018; 10(1):98. https://doi.org/10.3390/su10010098
Chicago/Turabian StyleZhao, Xingang, Yuzhuo Zhang, Ji Liang, Yanbin Li, Rongda Jia, and Ling Wang. 2018. "The Sustainable Development of the Economic-Energy-Environment (3E) System under the Carbon Trading (CT) Mechanism: A Chinese Case" Sustainability 10, no. 1: 98. https://doi.org/10.3390/su10010098
APA StyleZhao, X., Zhang, Y., Liang, J., Li, Y., Jia, R., & Wang, L. (2018). The Sustainable Development of the Economic-Energy-Environment (3E) System under the Carbon Trading (CT) Mechanism: A Chinese Case. Sustainability, 10(1), 98. https://doi.org/10.3390/su10010098