Article

Assessment of Soil Quality of Croplands in the Corn Belt of Northeast China

1
College of Earth Sciences, Jilin University, Changchun 130012, China
2
Key Laboratory of Wetland Ecology and Environment, Northeast Institute of Geography and Agroecology, Chinese Academy of Sciences, Changchun 130102, China
*
Author to whom correspondence should be addressed.
Sustainability 2018, 10(1), 248; https://doi.org/10.3390/su10010248
Submission received: 25 December 2017 / Revised: 15 January 2018 / Accepted: 15 January 2018 / Published: 18 January 2018
(This article belongs to the Section Environmental Sustainability and Applications)

Abstract

:
The increasing global demands for land resource with increasing population have resulted in occurrence of soil degradation in many regions of the world. Assessment of soil quality has become the basic work for agricultural sustainable development and selecting regional indicators effectively has become very important since there are no standard evaluation methods and universal indicators. In this study, taking the Corn Belt of Northeast China as the study area, seven indicators—obstacle horizon thickness, cation exchange capacity, pH, soil organic matter, total nitrogen, total potassium, and available Fe—were selected to constitute the minimum data set from sixteen indictors of the total data set to assess the soil quality. The soil quality of the study area was dominated by moderate grade, increasing from west to east. The soil quality of Yushu, Changchun and Shuangyang had higher values, and that of Nongan was the lowest. We found that the distribution of cation exchange capacity has a good consistency with the assessment result of the soil quality. Black soils were distributed in the middle part of the study region from north to south and accounted for a higher quality, exactly where the areas of rapid urbanization are located. An ANOVA analysis showed that soil quality in the Corn Belt of Northeast China was greatly affected by topographic factors and agricultural management and climate was not the principal factor affecting soil quality. Though the minimum data set slightly reduced the evaluation accuracy, a large sampling density in our study was able to improve the precision loss that resulted from reducing the number of indicators to a certain extent.

1. Introduction

With the growing public interest in the effects of environment and management practices on soil resources, focus has increased on soil quality, and it has been recognized as crucial to agricultural sustainability [1,2]. The concept of soil quality emerged in the early 1990s [3], and the term was first applied by the Soil Science Society of America Ad Hoc Committee on Soil Quality (S-581) [4]. Soil quality refers to the soil function of sustaining plant and animal productivities, maintaining or enhancing water and air quality, and supporting human health and habitation [4]. Soil quality not only provides a useful and universal concept for educating professionals, producers and the public about the importance of soils but also offers an evaluation tool for appraising current management practices and comparing the advantages and disadvantages of alternative management practices [5].
Many methods of soil quality assessment have been developed since the USDA Soil Conservation Service issued the land capability classification system in 1961 [6]. At the beginning, single indicators, such as soil organic matter (SOM), PH, electrical conductivity (EC), and nitrogen were commonly used indicators. With deeper understanding of soil quality, a comprehensive evaluation method that took management practices and crop production into consideration were developed [2,5,7,8,9,10]. Among these, the soil quality indices method is the most commonly used method today for its ease of use and convenient quantification [5,11]. The integrated quality index (IQI) and nemoro quality index (NQI) were universally used indices [11]. However, there was no definitive set of soil indices for soil quality monitoring because there was a lack of established standards because soils vary widely. Moreover, according to its definition, soil quality should reflect the condition of soil chemicals, as well as physical and biological properties and processes; however too many data were difficult to obtain [12]. Minimum data set method was introduced to reduce the numbers of the indicators used in evaluation [1,11,12]. More attention had been put on the soil quality assessment of croplands, forestlands and urban lands. For the croplands in particular, an assessment of soil quality is needed to recognize problems in the production area and to assist in the formulation and evaluation of realistic agricultural and land use policies [5,13].
The Corn Belt of Northeast China(CBNC) is one of the three golden corn belts in the world [14]. It has a continental monsoon climate, with characteristically short, warm summer and long, cold winter. The climate characteristics are very suitable for the growth of corn, which made the CBNC become one of the main granaries of China. But due to soil erosion and intensive land use, serious soil degradation occurs frequently in this region [15]. All this greatly affected crop production and aggravated the vulnerabilities of China’s future food security. Understanding soil quality in the CBNC and improving the agricultural efficiency can provide a valuable base for alleviating the supply and marketing contradiction of China’s corn production, while there is also a need for ensuring national food security and promoting the development of animal husbandry and the corn processing industry. There is an urgent need to develop some methods to evaluate soil quality so that the process of any corrective action that may be required by the region can be monitored [16].
For these reasons, based on 1691 soil samples, we evaluated the soil quality of the croplands in the CBNC of China with a combination of a soil quality indices method and geographic information systems. There were three objectives for this study: (1) to determine the characteristic indicators that can reflect the soil quality in CBNC; (2) to evaluate soil quality in the CBNC; (3) to understand the association between environmental factors, agricultural management, and soil quality.

2. Materials and Methods

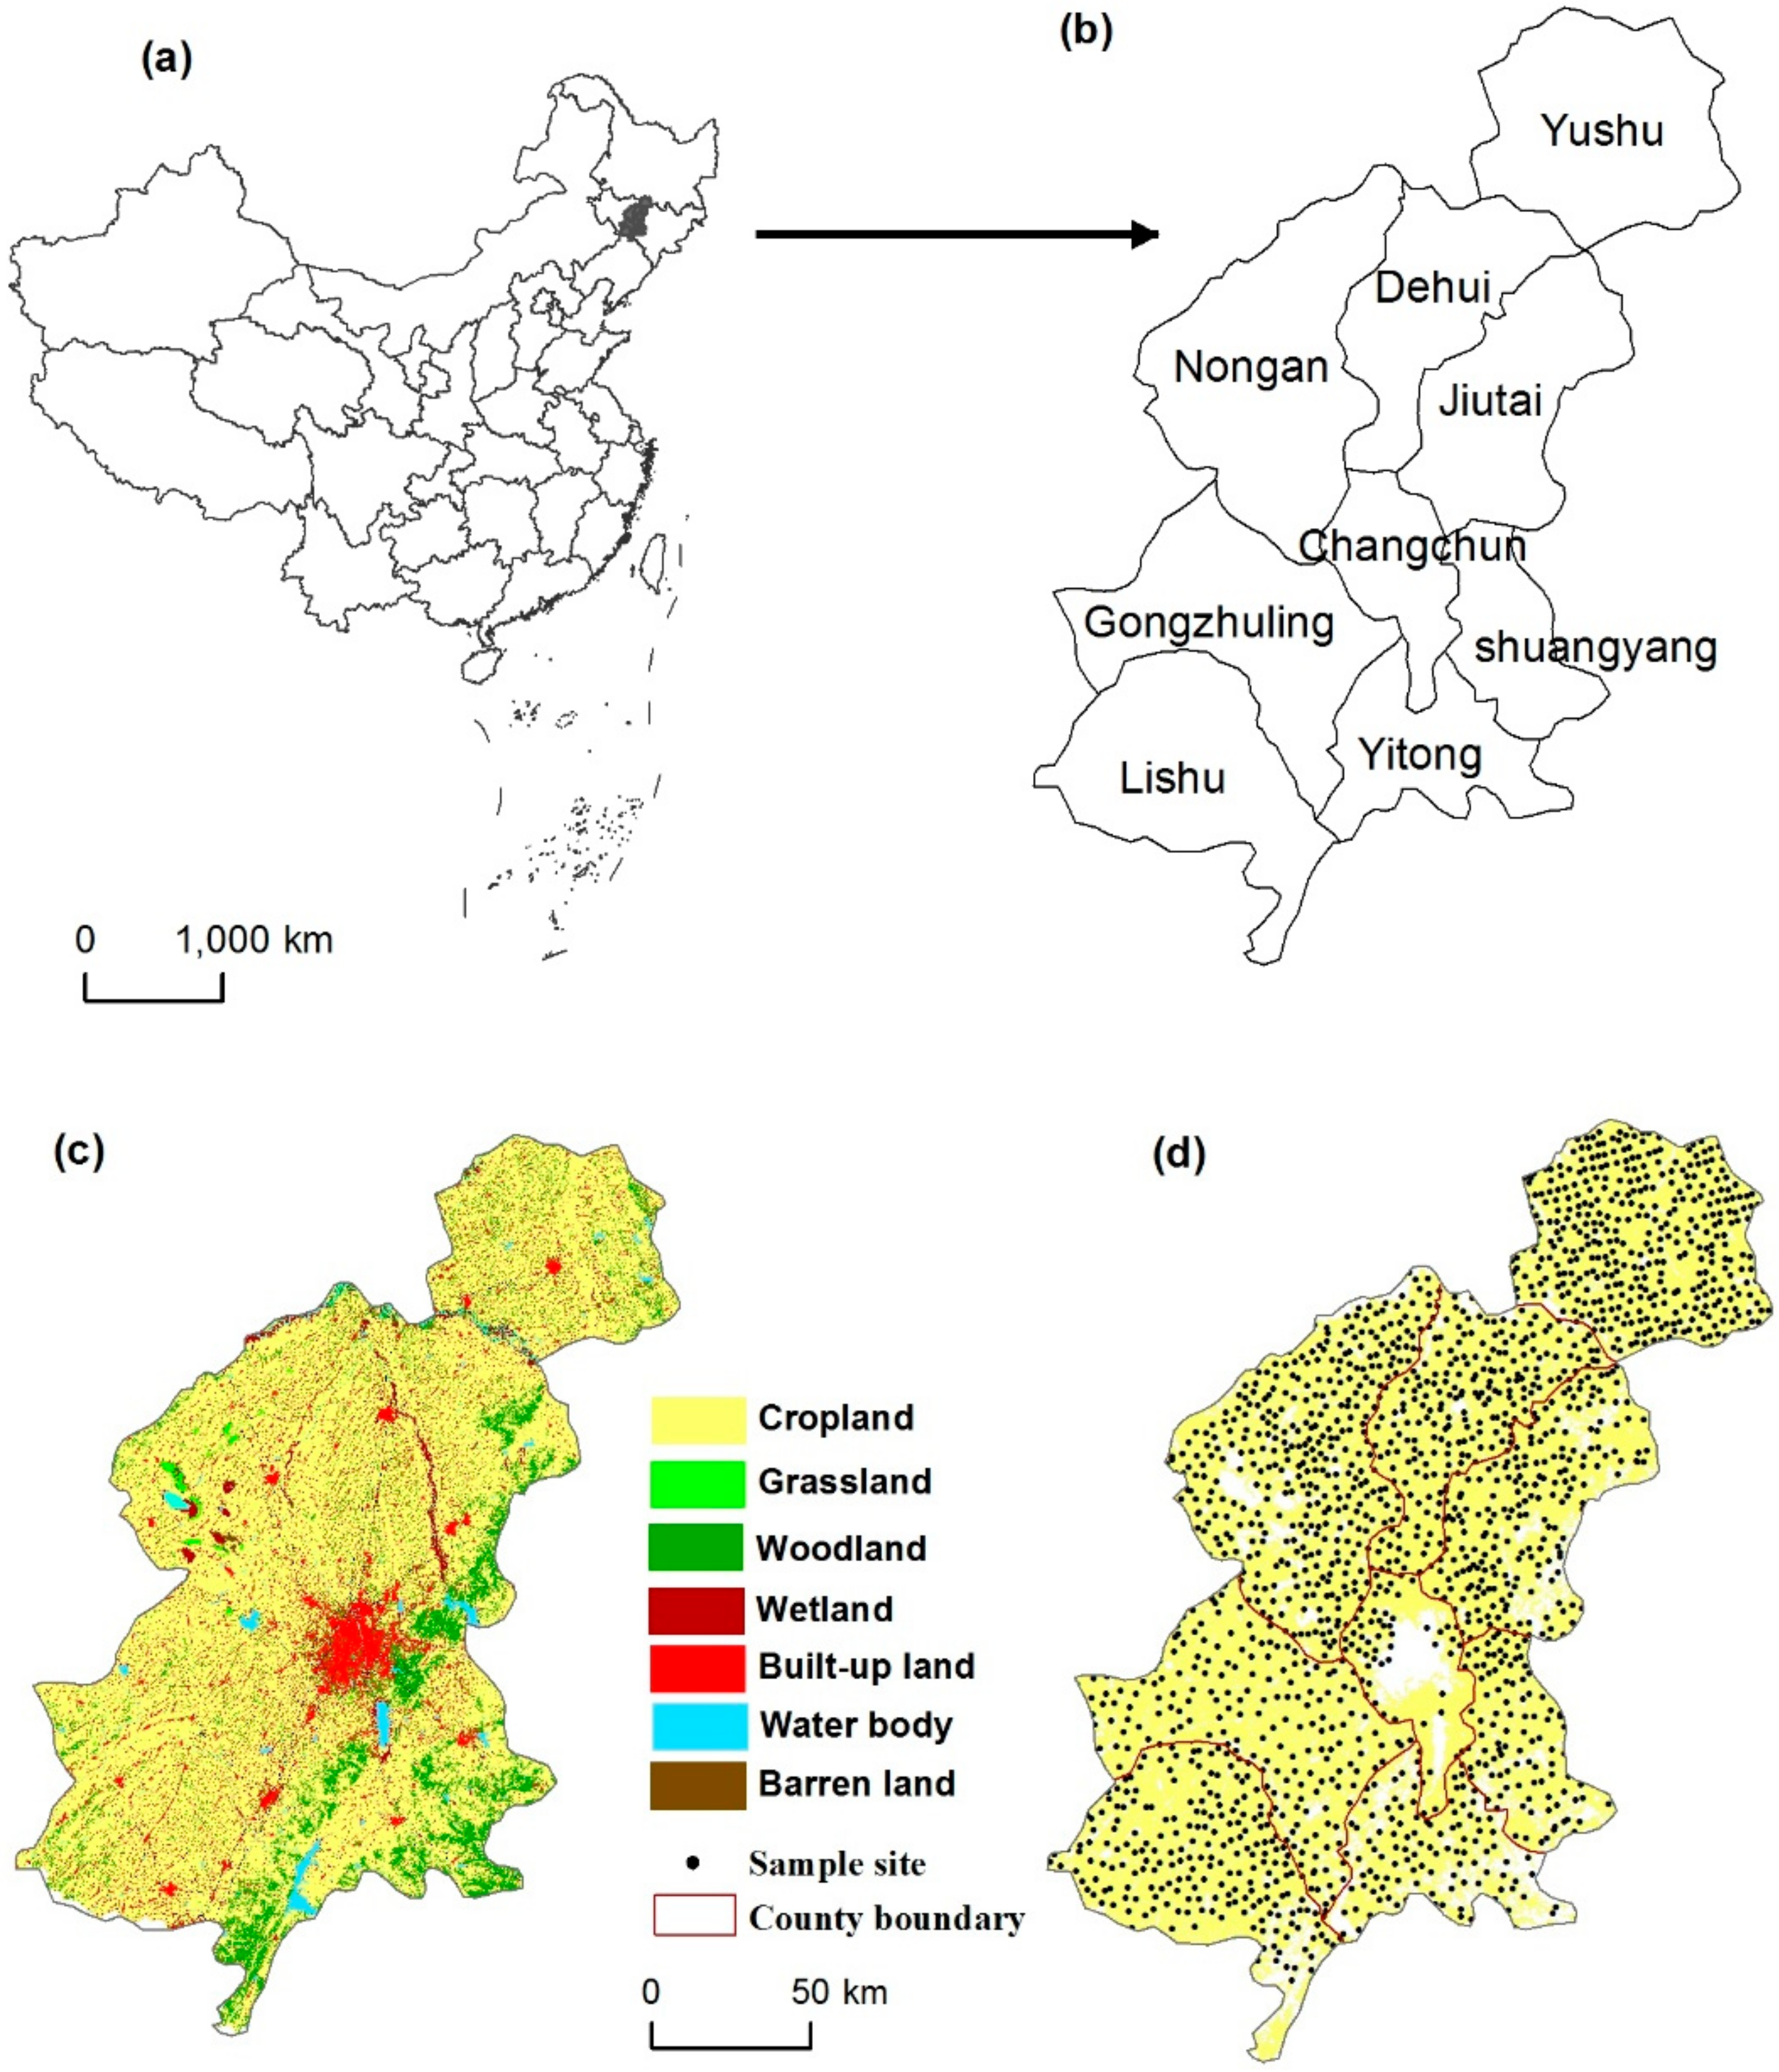
2.1. Study Site Descriptions

The Corn Belt of Northeast China is situated in the middle part of Jilin Province (42°51′–45°14′ N, 123°16′–127°36′ E), and includes nine counties: Changchun, Yushu, Nongan, Dehui, Jiutai, Gongzhuling, Lishu, Yitong and Shuangyang (Figure 1). These areas have elevation between 107 and 689 m, and cover a total area of 29.1 × 10³ km2. The study area has a temperate, semi-humid continental monsoon climate with four distinct seasons. The average annual temperature is 4.8 °C and the precipitation is 582 mm, with 82% occurring between May and September. The frost-free period is about 130–150 d in duration. The study region was located in the middle part of the Songnen Plain and the Second Songhua River, Wukai River, Yinma River, Shuangyang River and Yitong River flow through the area. The study area is also in the famous black soil region and the main soils are black soil (Luvic Phaeozem, Food and Agriculture Organization of the United Nations (FAO)), dark Chernozems (Haplic Chernozems, FAO), aeolian soil (Arenosol, FAO), brown forest soil (Haplic Luvisol, FAO), meadow soil (Eutric Vertisol, FAO), and paddy soil (Hydragric Anthrosol, FAO).
As a typical agricultural region of Northeast China, the CBNC had cropland area of 26.2 × 10³ km2 in 2015 (Figure 1c), accounting for 79.3% of the total study area. In this area, a warm and raining summer, large temperature differences between day and night and fertile soil work together to promote the growth of the corn. As a result, this region has developed corn based planting structures and become one of the famous corn belts in the world. However, croplands in CBNC have been influenced by human-induced soil degradation to a serious degree after about 300 years of conventional tillage. After long term reclamation and tillage, the soil quality of the CBNC has deteriorated a lot and this is characterized by the thinning of the soil layer, reduction of organic matter, salinization of soil, soil compaction and severe soil erosion [14,15,17]. In recent years, considerable interests have been paid to the protection of soils in this region [17].

2.2. Soil Sampling and Analysis

In this study, the sampling data were collected in a regional soil fertility investigation. In principle, at least one sit was selected at random from an area of 10 km2. Samples of 0 to 20 cm in depth from 1691 sites were surveyed in 2013. The 0 to 20 cm depth of the soil is the cultivated layer for the agricultural production in the CBNC and soil chemical properties in this layer are crucial for crop growth. Each soil sample was a composite of sub-samples and five replicate samples were homogeneously mixed by hand within 200 m2. Among the 1691 points collected, 1528 points were sampled from rainfed croplands under corn and 163 points were located in paddy fields. The coordinate position of each sample site was recorded using a handheld global positioning system (GPS) (Magellan, Santa Clara, CA, USA) and the spatial locations of the sampling points are shown in Figure 1d.
Samples were air-dried, crumbled, sieved through a 2 mm sieve and analyzed in the laboratory Table A1 indicated the analytical protocols selected. Cultivated layer depth (CLD), obstacle horizon depth (OHD) and obstacle horizon thickness (OHT) were measured in the field and depicted for each sample site [18]. In addition, parent material from each site was surveyed by the regional soil fertility investigation. Farmers’ investigations were also conducted at the sampling time and relative information, such as fertilization, yield and drainage, etc., was collected as part of agricultural management practices.

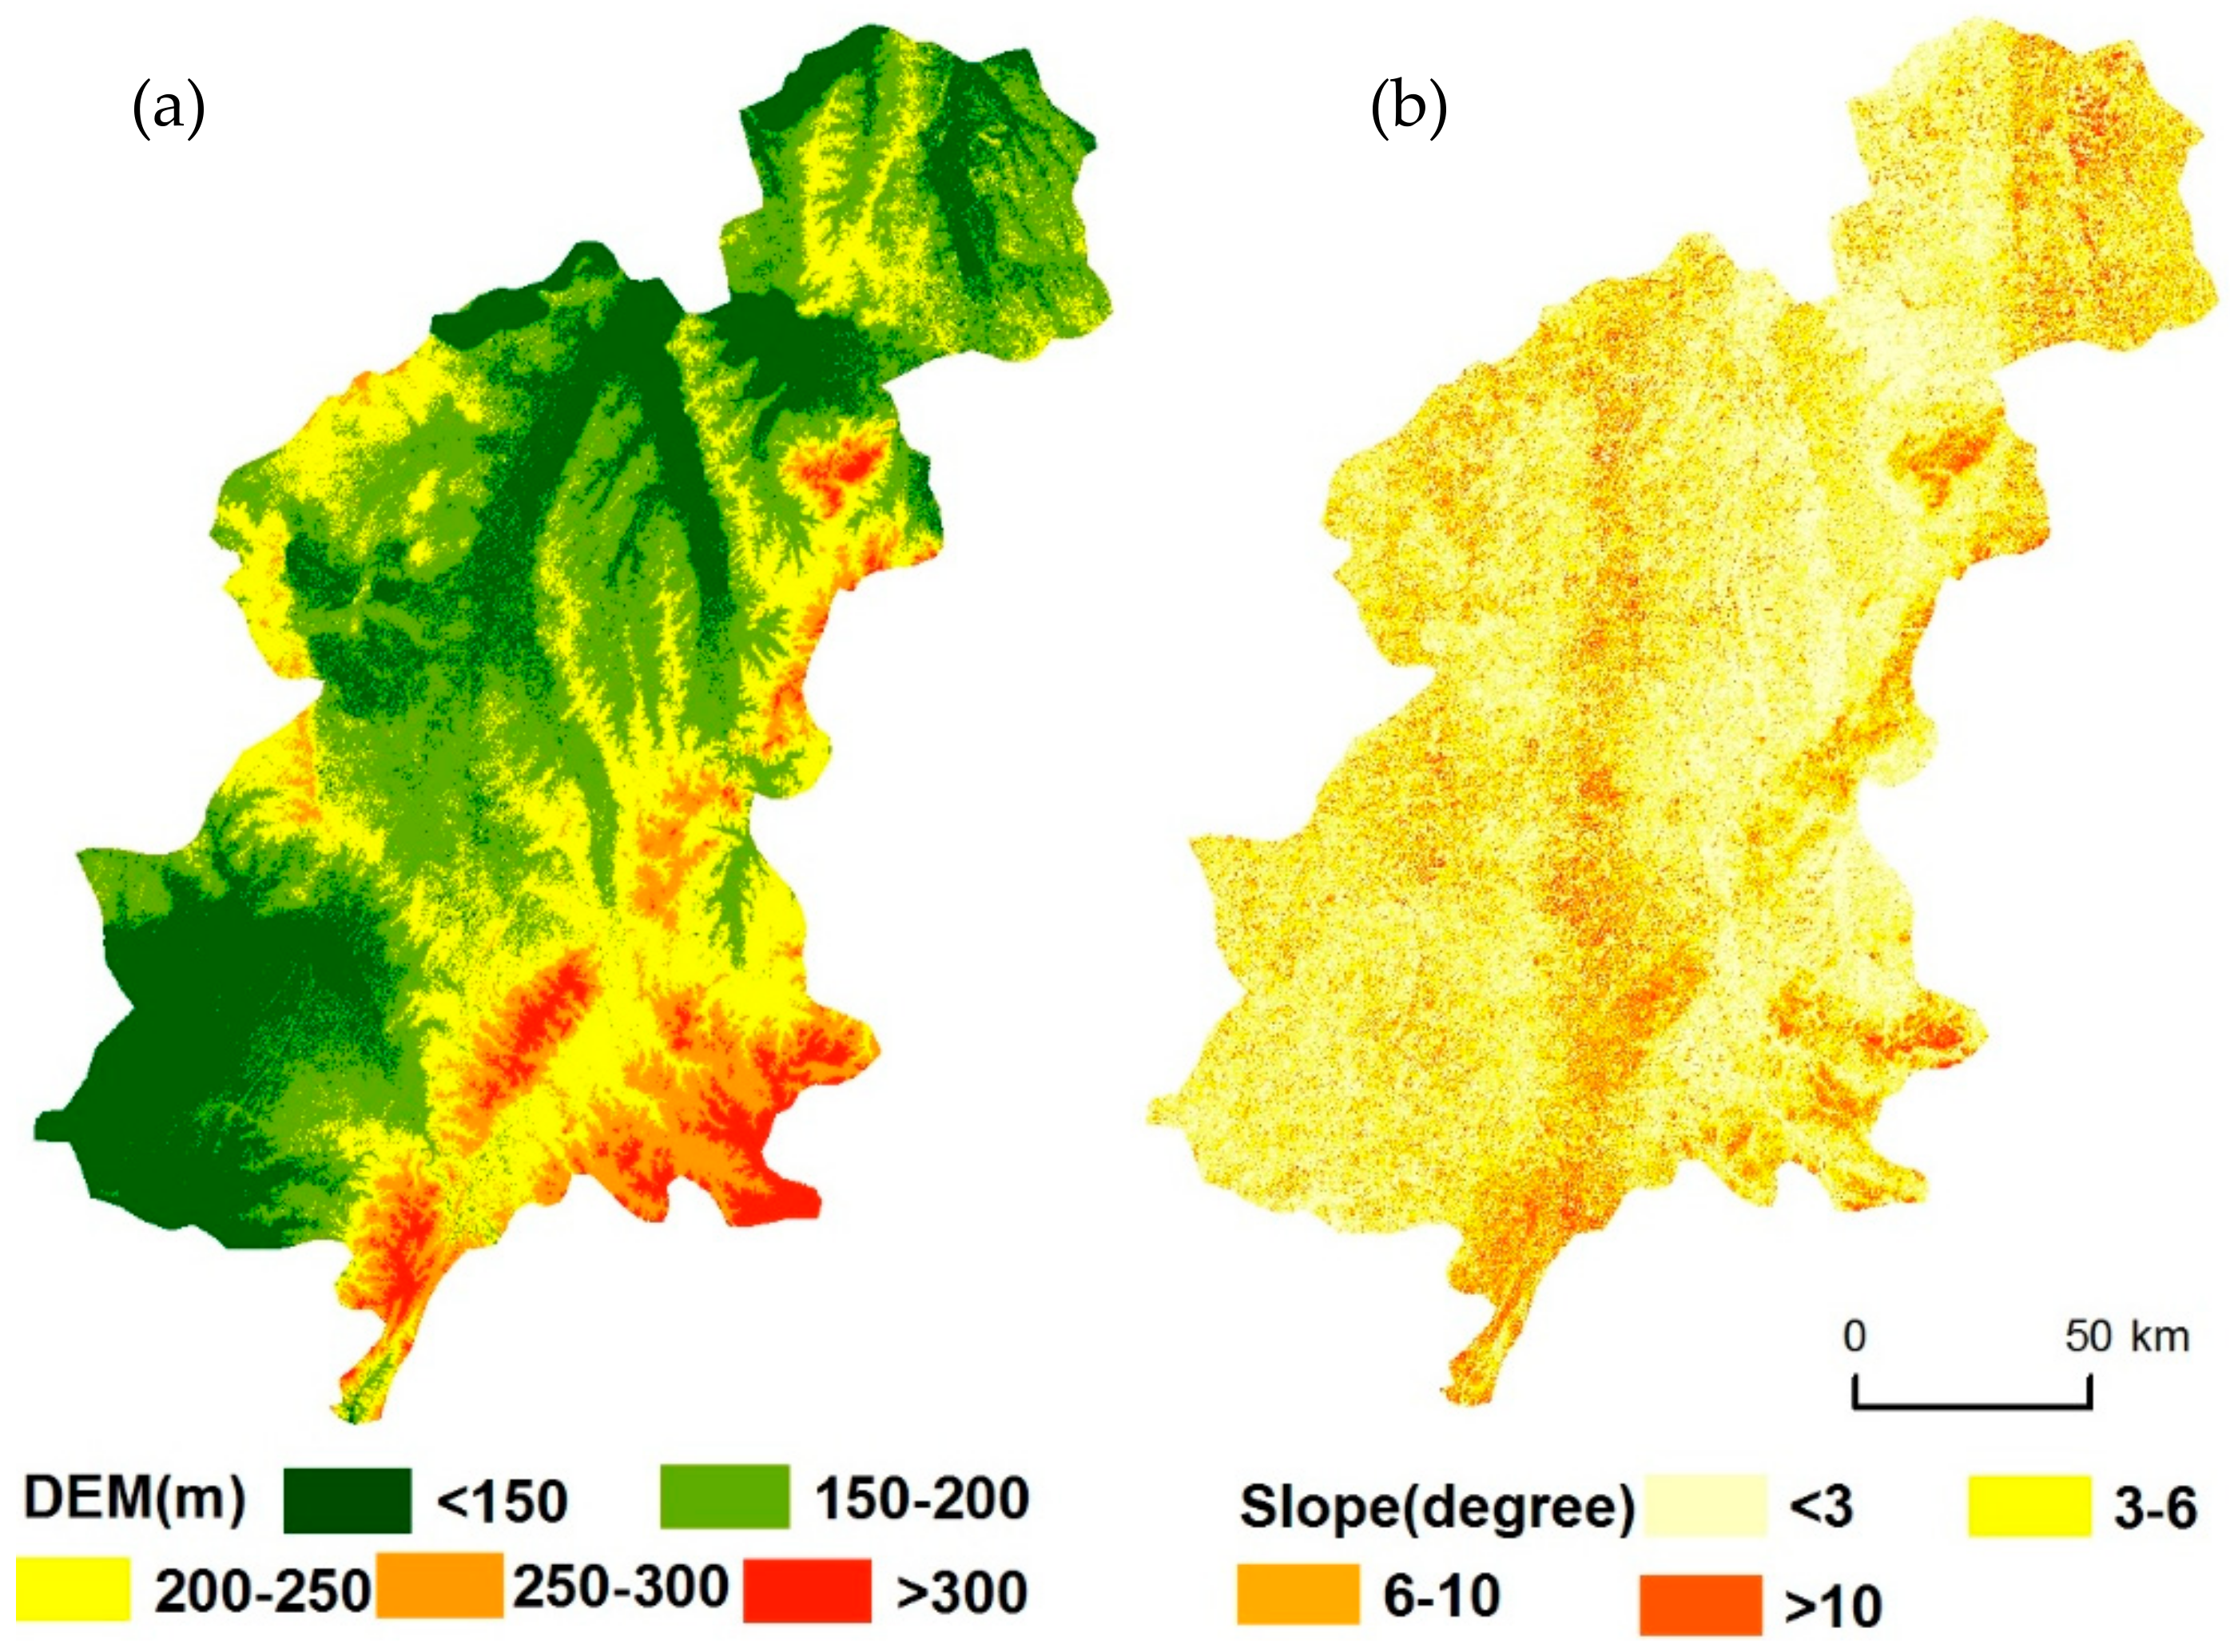
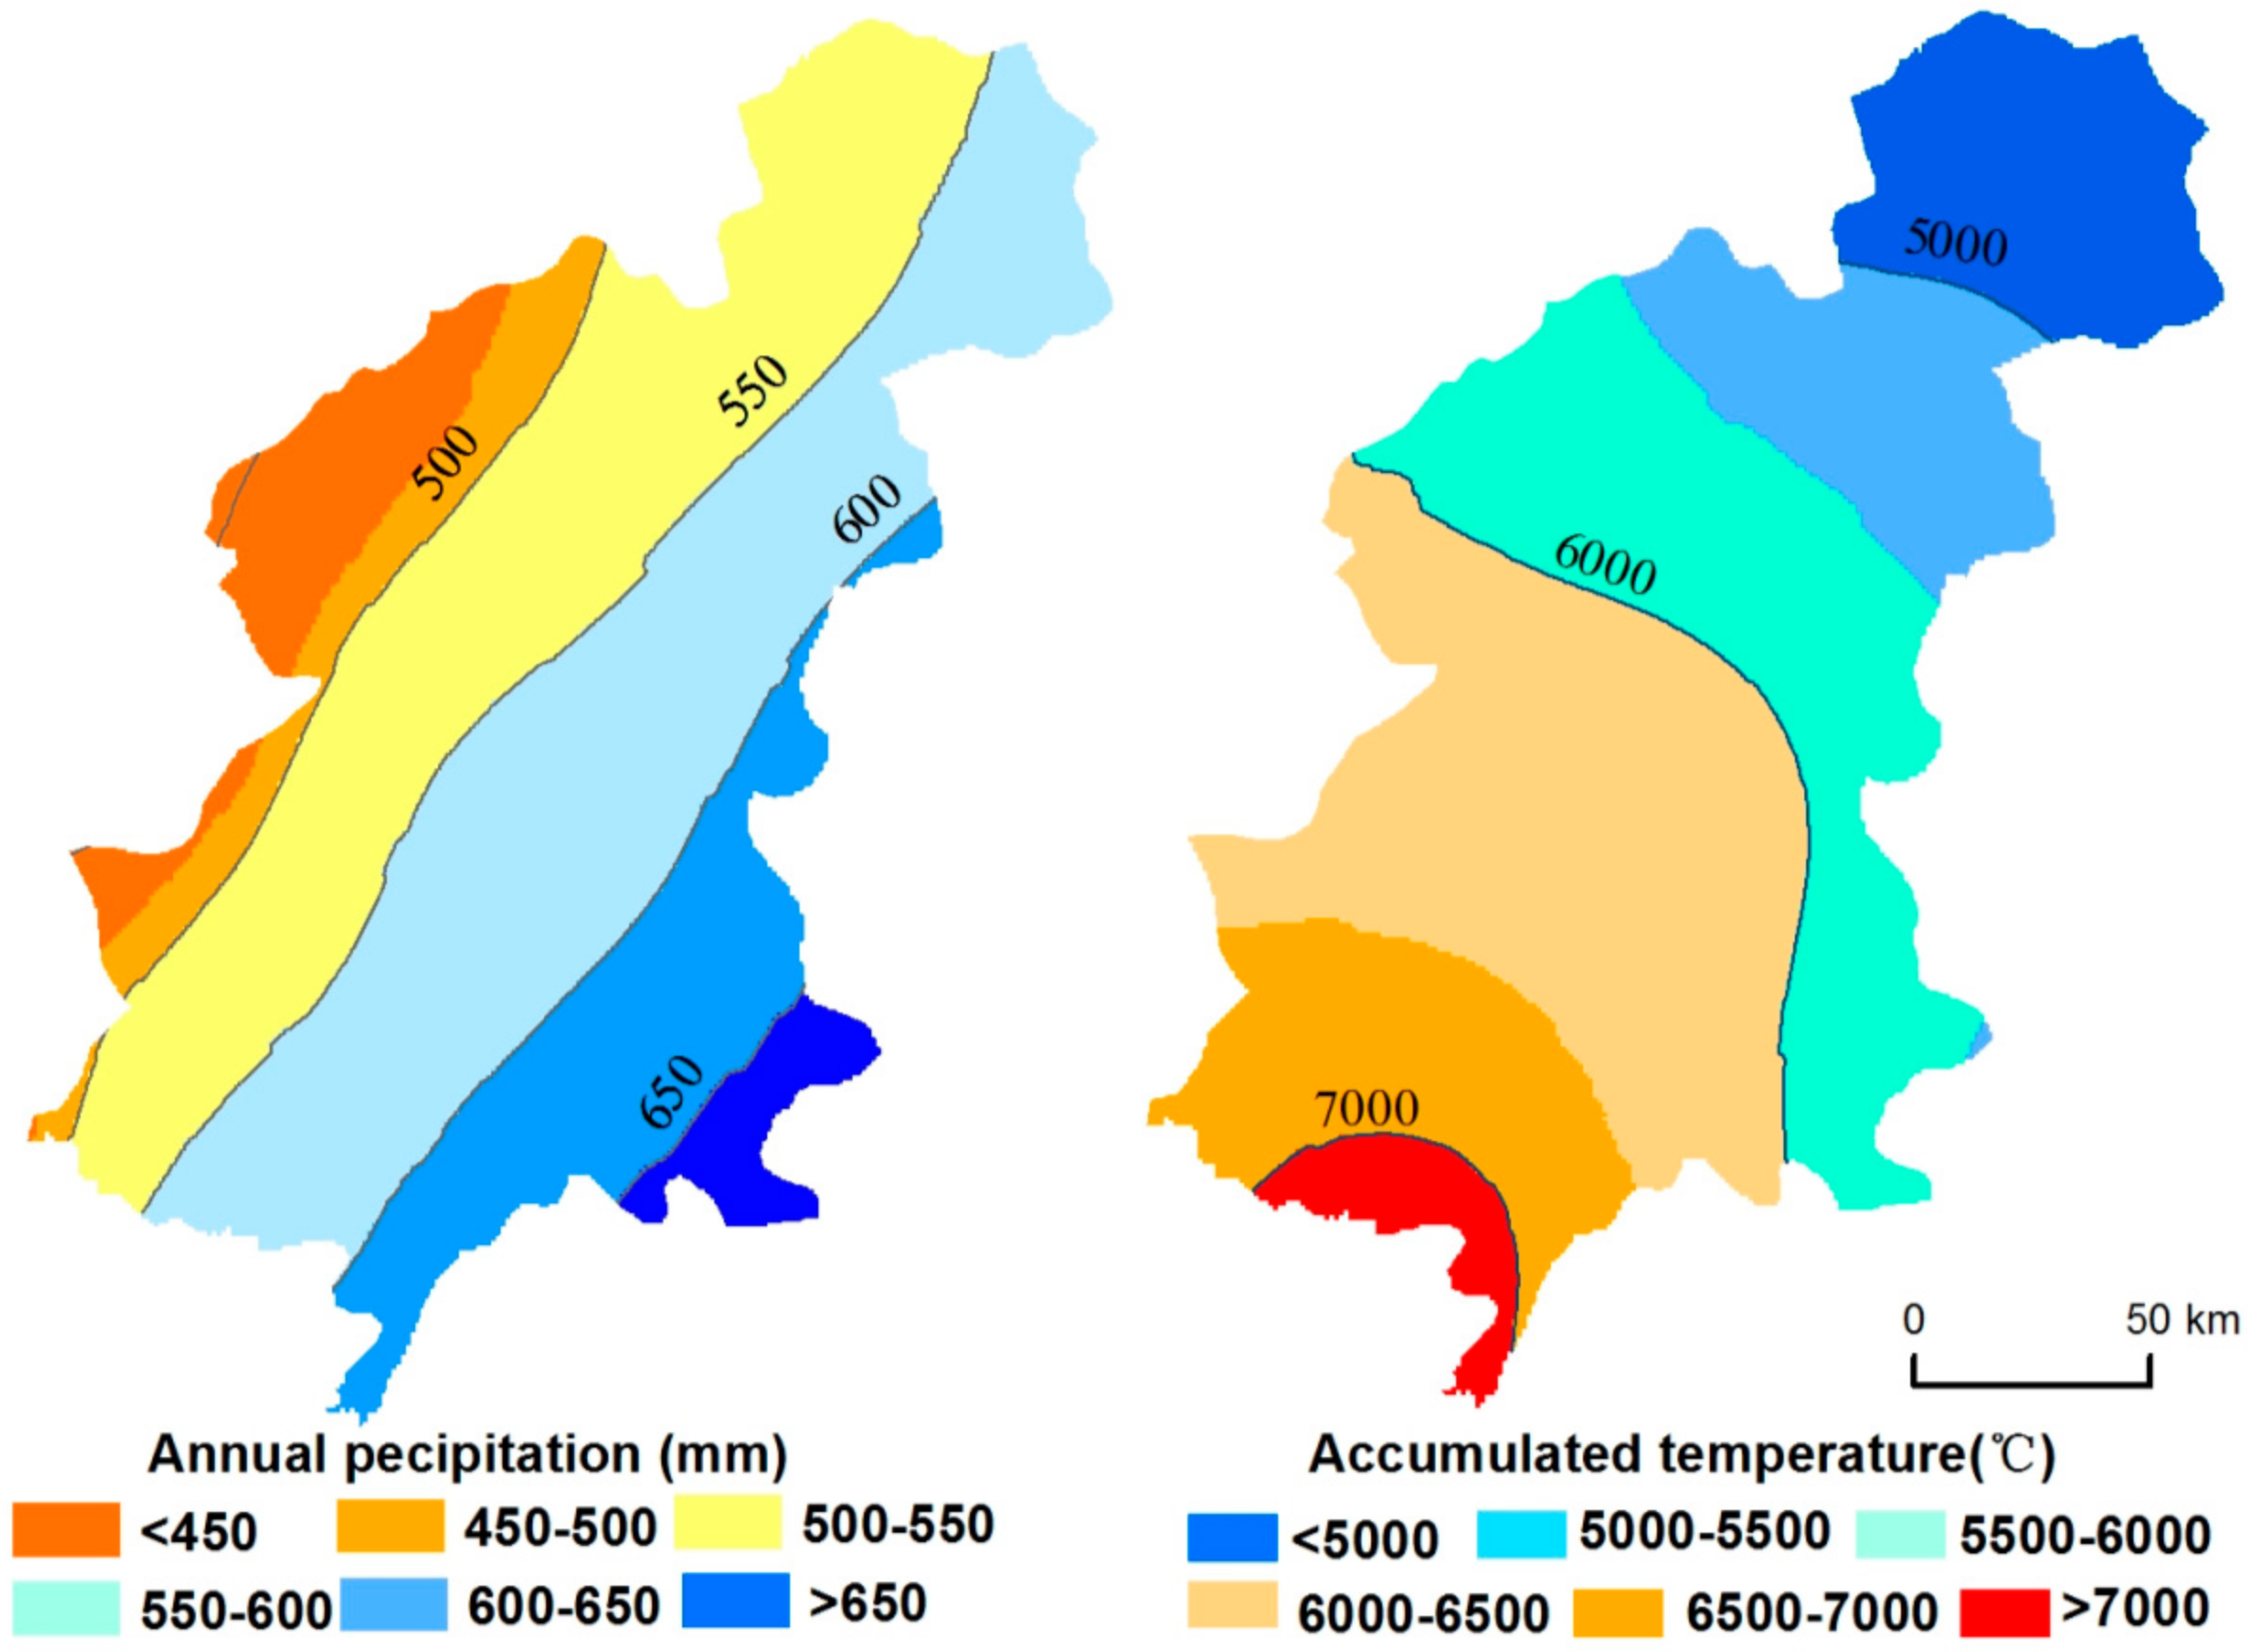
2.3. Environmental Data

A land cover map was obtained from the Northeast Institute of Geography and Agroecology, Chinese Academy of Sciences, which was vector data interpreted from Landsat OLI images of 2013 (Figure 1c). All the images were pseudo color syntheses of 4, 3 and 2 bands by the RGB method, and geo-referenced to 1:100,000 topographic maps with no less than 20 ground control points (GCPs) for each image. The Root Mean Squared Error (RMSE) of the GCP was controlled within 1.5 pixels (45 m). Land cover classification data of this region were acquired by a comprehensive method combined with the object-oriented classification (using eCognition 8.64 software with the nearest neighbor classifiers [19]). In our study, land cover types were grouped into cropland, grassland, woodland, wetland, built-up land, water body and barren land. The mean overall accuracy of the land cover data interpreted from the remote sensing images exceeded 91% [20,21]. Based on the land cover data, the croplands were extracted as the spatial extension of the study area.
Terrain attributes are the most extensively used environmental factors that influence soil quality [22]. In our study, two topographic factors, including elevation and slope gradient, were derived from a 30 m digital elevation model (DEM, cell size is 30 m) (Figure 2). The DEM was also offered by the Northeast Institute of Geography and Agroecology, Chinese Academy of Sciences.
Climate data, including monthly precipitation and daily temperature from 2000 to 2013, were obtained from the Meteorological Bureau of Jilin Province. The mean annual precipitation and accumulated temperature (≥10 °C) were calculated and the data were spatialized via the Kriging method (Figure 3).
ArcGIS 10.0 software was used to analyze the association between spatial distribution of soil quality and different environmental attributes. ANOVA analysis method was used to understand the differences among group means and their associated soil quality. Because of the heterogeneity of the variance for parent material, soil type and chemical fertilizer amount, Dunnett’s model was used to compare the mean value of the IQI between soils of different groups [23].

2.4. Soil Quality Assessment Method

2.4.1. Indicators Selection and Scoring

The indicators selected should reflect various characteristics but each should influence soil quality directly [24]. In this study, the total data set is comprised of sixteen soil characteristics (Table 1). These 16 indicators were available for the whole study area and were sensitive to soil quality change. Soil physical properties, soil fertilization and micro nutrients were all important factors that affect soil quality [5,18]. In this study, the physical condition was reflected by cultivated layer depth (CLD), bulk density (BD), cation exchange capacity (CEC), obstacle horizon depth (OHD) and obstacle horizon thickness (OHT). The latter two factors were indicators limiting crop growth. Soil nutrition reflects the pesticide, fertilization, and crop residual incorporation and was represented by pH, soil organic matter (SOM), total nitrogen (TN), total phosphorus (TP), total potassium (TK), alkali-dissolvable nitrogen (AN), extractable phosphorus (AP) and extractable potassium (AK). Micro nutrients were represented by extractable Cu (ACu), extractable Fe (AFe) and extractable Zn (AZn).
Because of different indicator units, each indicator was transformed and normalized to a value between 0 and 1.0 using the standard scoring function (SSF) method [25]. All soil indicators were divided into three types according to their function on soil quality: lower limit, upper limit and peak limit. Detailed SSF equations for the indicators are listed in Table 1.

2.4.2. Selection of Indicators in the Minimum Data Set

In order to improve the efficiency of the evaluation work, a minimum data set (MDS) of indicators was selected through a principal component analysis (PCA). According to the MDS indicator selection procedure described by Andrews et al. components with eigenvalues ≥1 were considered as principal components (PCs) [25,26]. Within each PC, we calculated the norm value of each variable and only highly weighted variables (within 10% of the highest norm value in each group) were chosen to define the MDS [25] (Table 2). The norm value was calculated using Equation (1):
N i k = i = 1 k ( u i k 2 λ i k )
N i k = i = 1 k ( u i k 2 λ i k ) where, Nik represents the comprehensive load for i variable on PCs with eigenvalues ≥1; uik is the load for the i variable on the principal component of k ; λik indicates the eigenvalue of the i variable on the principal component of k.
When more than one variable was included in a PC, each was considered as a determinant and was retained in the MDS if the correlation coefficient between them were less than 0.6 (r < 0.60) [9]. In our study, eight variables were selected: OHD, OHT, CEC, pH, SOM, TN, TK, and AFe. Because OHD and OHT have a higher correlation coefficient (r = 0.699), OHT, the variable with a larger weighted loading, was retained.

2.4.3. Weight Assignment and Soil Quality Index

The weight of each variable was calculated by its communality [26], which was equal to the ratio of its communality to the sum communalities of all the variables. It varies between 0 and 1.0, and the high value suggests the high contribution to the soil quality. The weights of all indicators, both in the TDS and MDS indicator methods were calculated (Table 3).
Based on the selected indicators and given weight, the integrated quality index (IQI) was calculated to evaluate the soil quality. The IQI was described by Doran and Parkin [3].

2.4.4. Criteria of Soil Quality Grades

The criterions for the IQI were based on the characteristics of the regional environment and the fertility of croplands in Jilin Province. A spatial interpolation method of geostatistic analysis was used to obtain the map of the spatial distribution of the soil quality classes. We compared the results of different methods, including the inverse distance weighting (IDW), Spline and Kriging methods, and the Kriging method was selected as the best model for interpolating because of the lowest root mean square error (RMSE) and the highest r coefficient. Soil quality indices were divided into five grades according to classification criteria (Table A2). Grade I is described as having a high value, which is the most suitable for crop growth. Grade II showed a high IQI value and was suitable for crop growth. Grade III had a moderate value and had some limitation. Grade IV showed a lower IQI value and had more limitations than Grade III. Grade V was characterized as having a very low IQI value and the most severe limitations.

2.4.5. Indices Validation

For appraising reliability, the validity test within the TDS and MDS indicator methods was done by direct comparison, Pearson correlation and linear correlation analysis based on the soil quality grades. A direct comparison tested the number of combinations between indices of the same soil quality grades for each sampling point. The correlation between grades of the TDS and MDS were conducted to better examine the relationships within the indices. All of these tests were completed in the SPSS 19.0 software.

3. Results

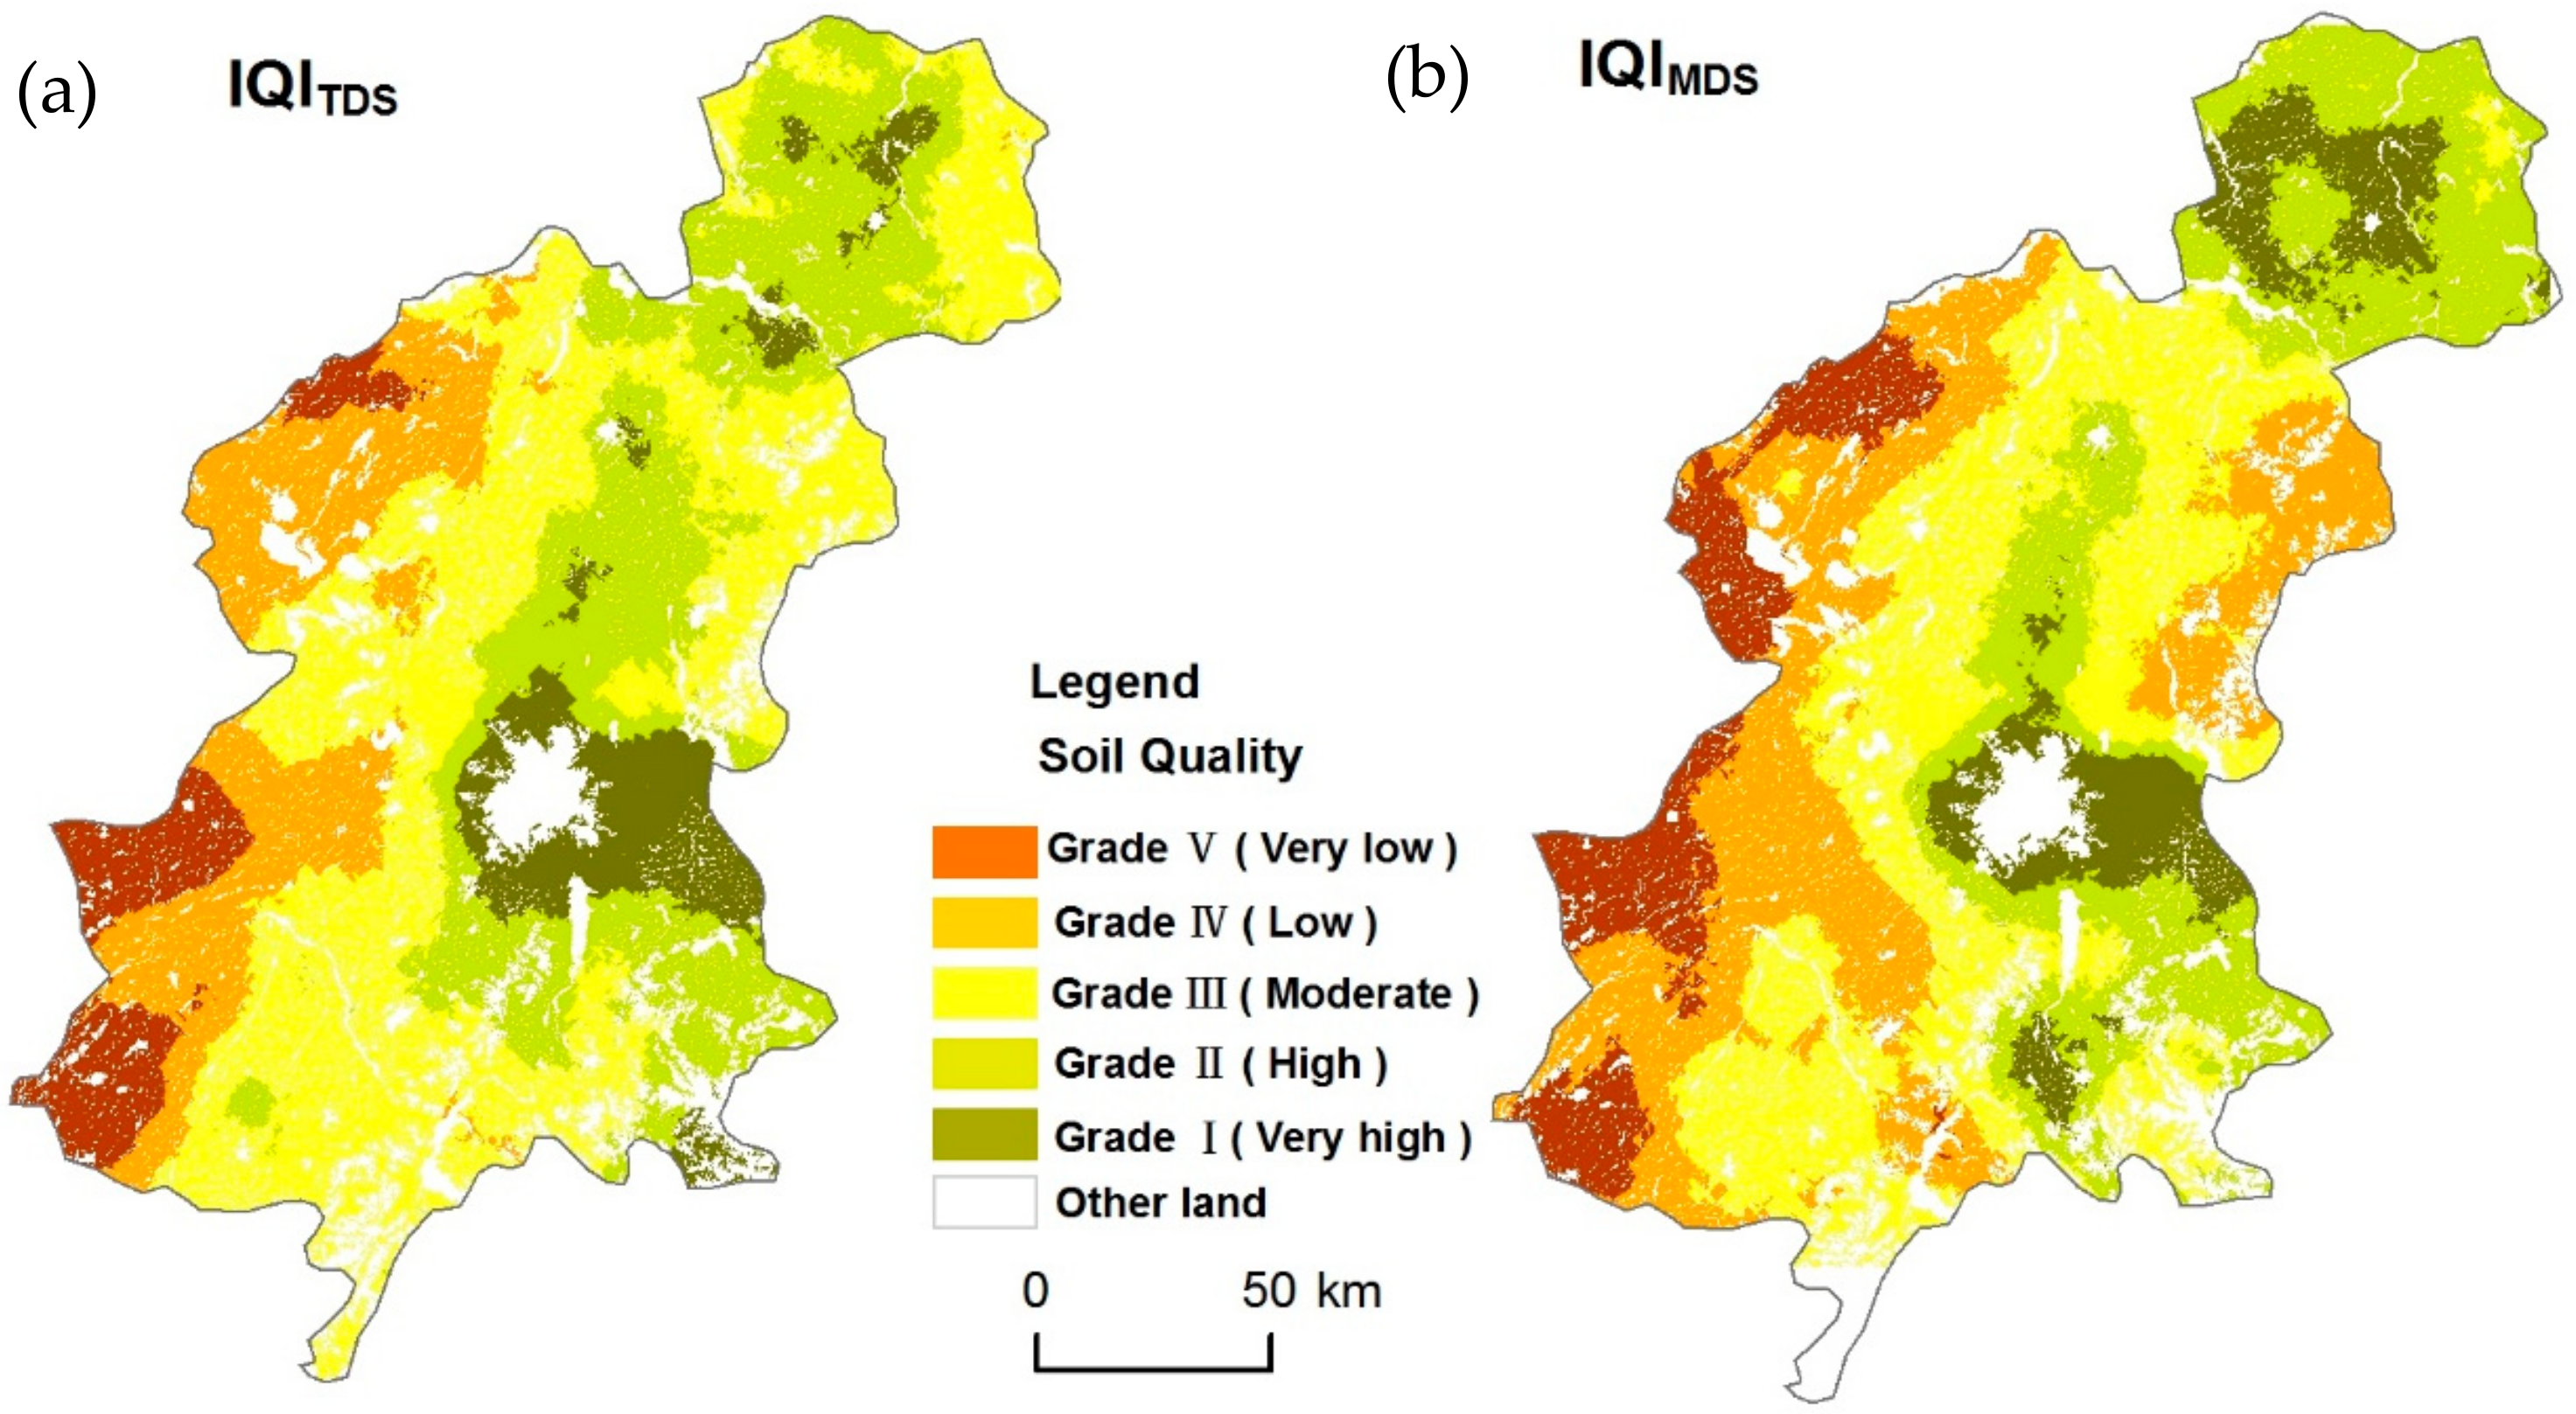
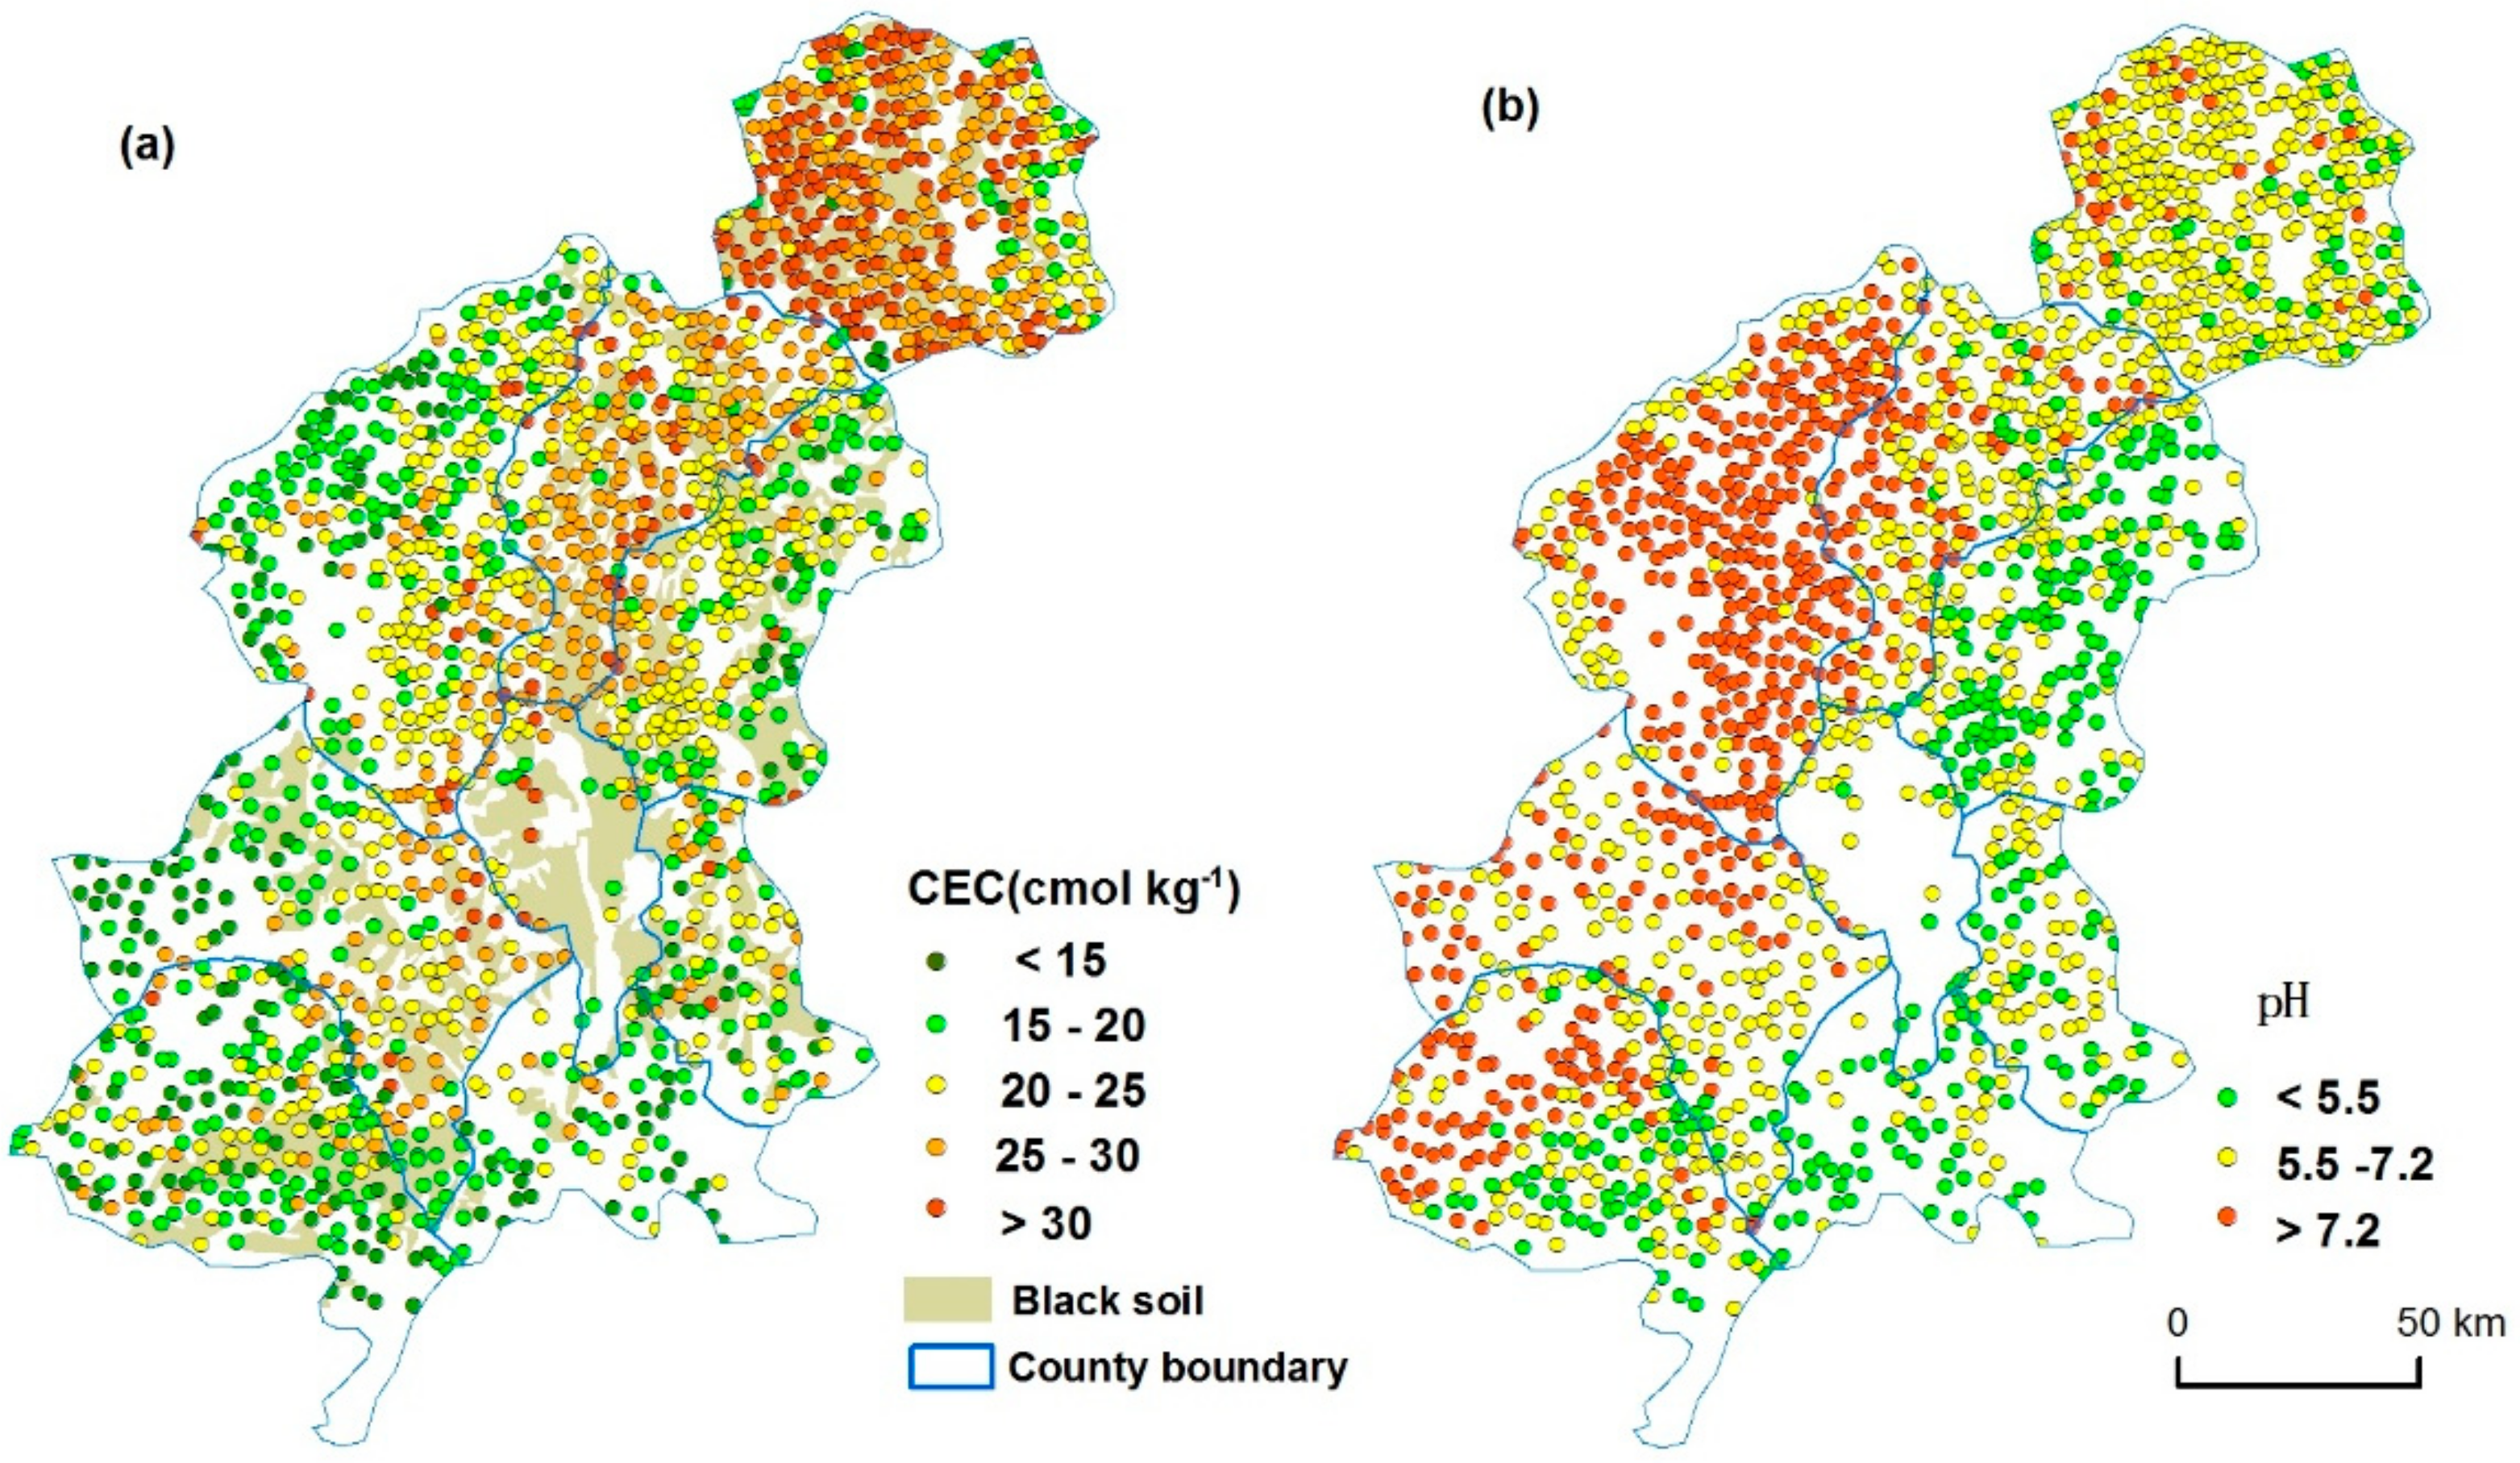
3.1. Soil Quality Assessment Based on the TDS Indicator Method

In this study, sixteen factors were selected to evaluate soil quality. The mean value, standard deviation (SD), the coefficient of variation (CV), and minimum, maximum and range of the selected indicators were measured (Table 4). Higher CEC, SOM, TN and AFe, and lower AZn were observed in the region. A considerable variability was observed for soil OHD, OHT, AN and AFe, while CLD, BD, pH and TK generally had a lower variability. According to the calculated communality and weight value (Table 3), the contribution of the same elements in the two methods is quite different. OHD and TN received the highest weights in the TDS indicator method, but pH and TN received the highest weights in the MDS indicator method. By contrast, BD and AN showed the lowest weights in the TDS indicator method, and OHT and TK showed the lowest weights in the MDS indicator method.
Using the Kriging method, we obtained the distribution map of soil quality (Figure 4) and the area of each grade was counted (Table 5). According to the IQI value calculated by the TDS indicator method, the soil quality of the croplands in the CBNC was moderate, and Grades III and IV were the dominant grades, covering an area of 1,815,854 ha (69.3% of the total area of cropland). Only a little portion of croplands allowed Grade I and Grade V, accounting for 6.5% (170,806 ha) and 8.81% (230,870 ha) respectively. About 402,741 ha of croplands were divided into Grade II, and the proportion of the total croplands was 15.37%. Spatially, the soil quality increased from west to east (Figure 4).
We also calculated the mean value of each county using the TDS and MDS indicator methods (Table 6), and the sequences were very similar. It can be seen that Yushu, Changchun and Shuangyang accounted for the higher value both in the TDS and MDS methods, while the mean values of Nongan, Lishu, and Gongzhuling were lower. When compared to the value calculated by the two methods, there were greater regional differences reflected by the MDS sequence.

3.2. Soil Quality Assessment Based on the MDS Indicator Method

The spatial distribution of the soil quality, calculated via the MDS indicator method, showed the same trend as that of the TDS result (Figure 2). According to the results of the MDS indicator method, grades II and III were the dominated classes and accounted for 24.20% (752,031 ha) and 33.64% (1,045,347 ha) respectively. Compared with the result of the TDS indicator method, the proportion of grade I and grade V increased to 9.4% (covering an area of 292,226 ha) and 10.87% (covering an area of 337,766 ha) respectively. About 21.88% of the total croplands were accounted for grade IV, which was lower than the percentage of grade IV in the TDS indicator method.

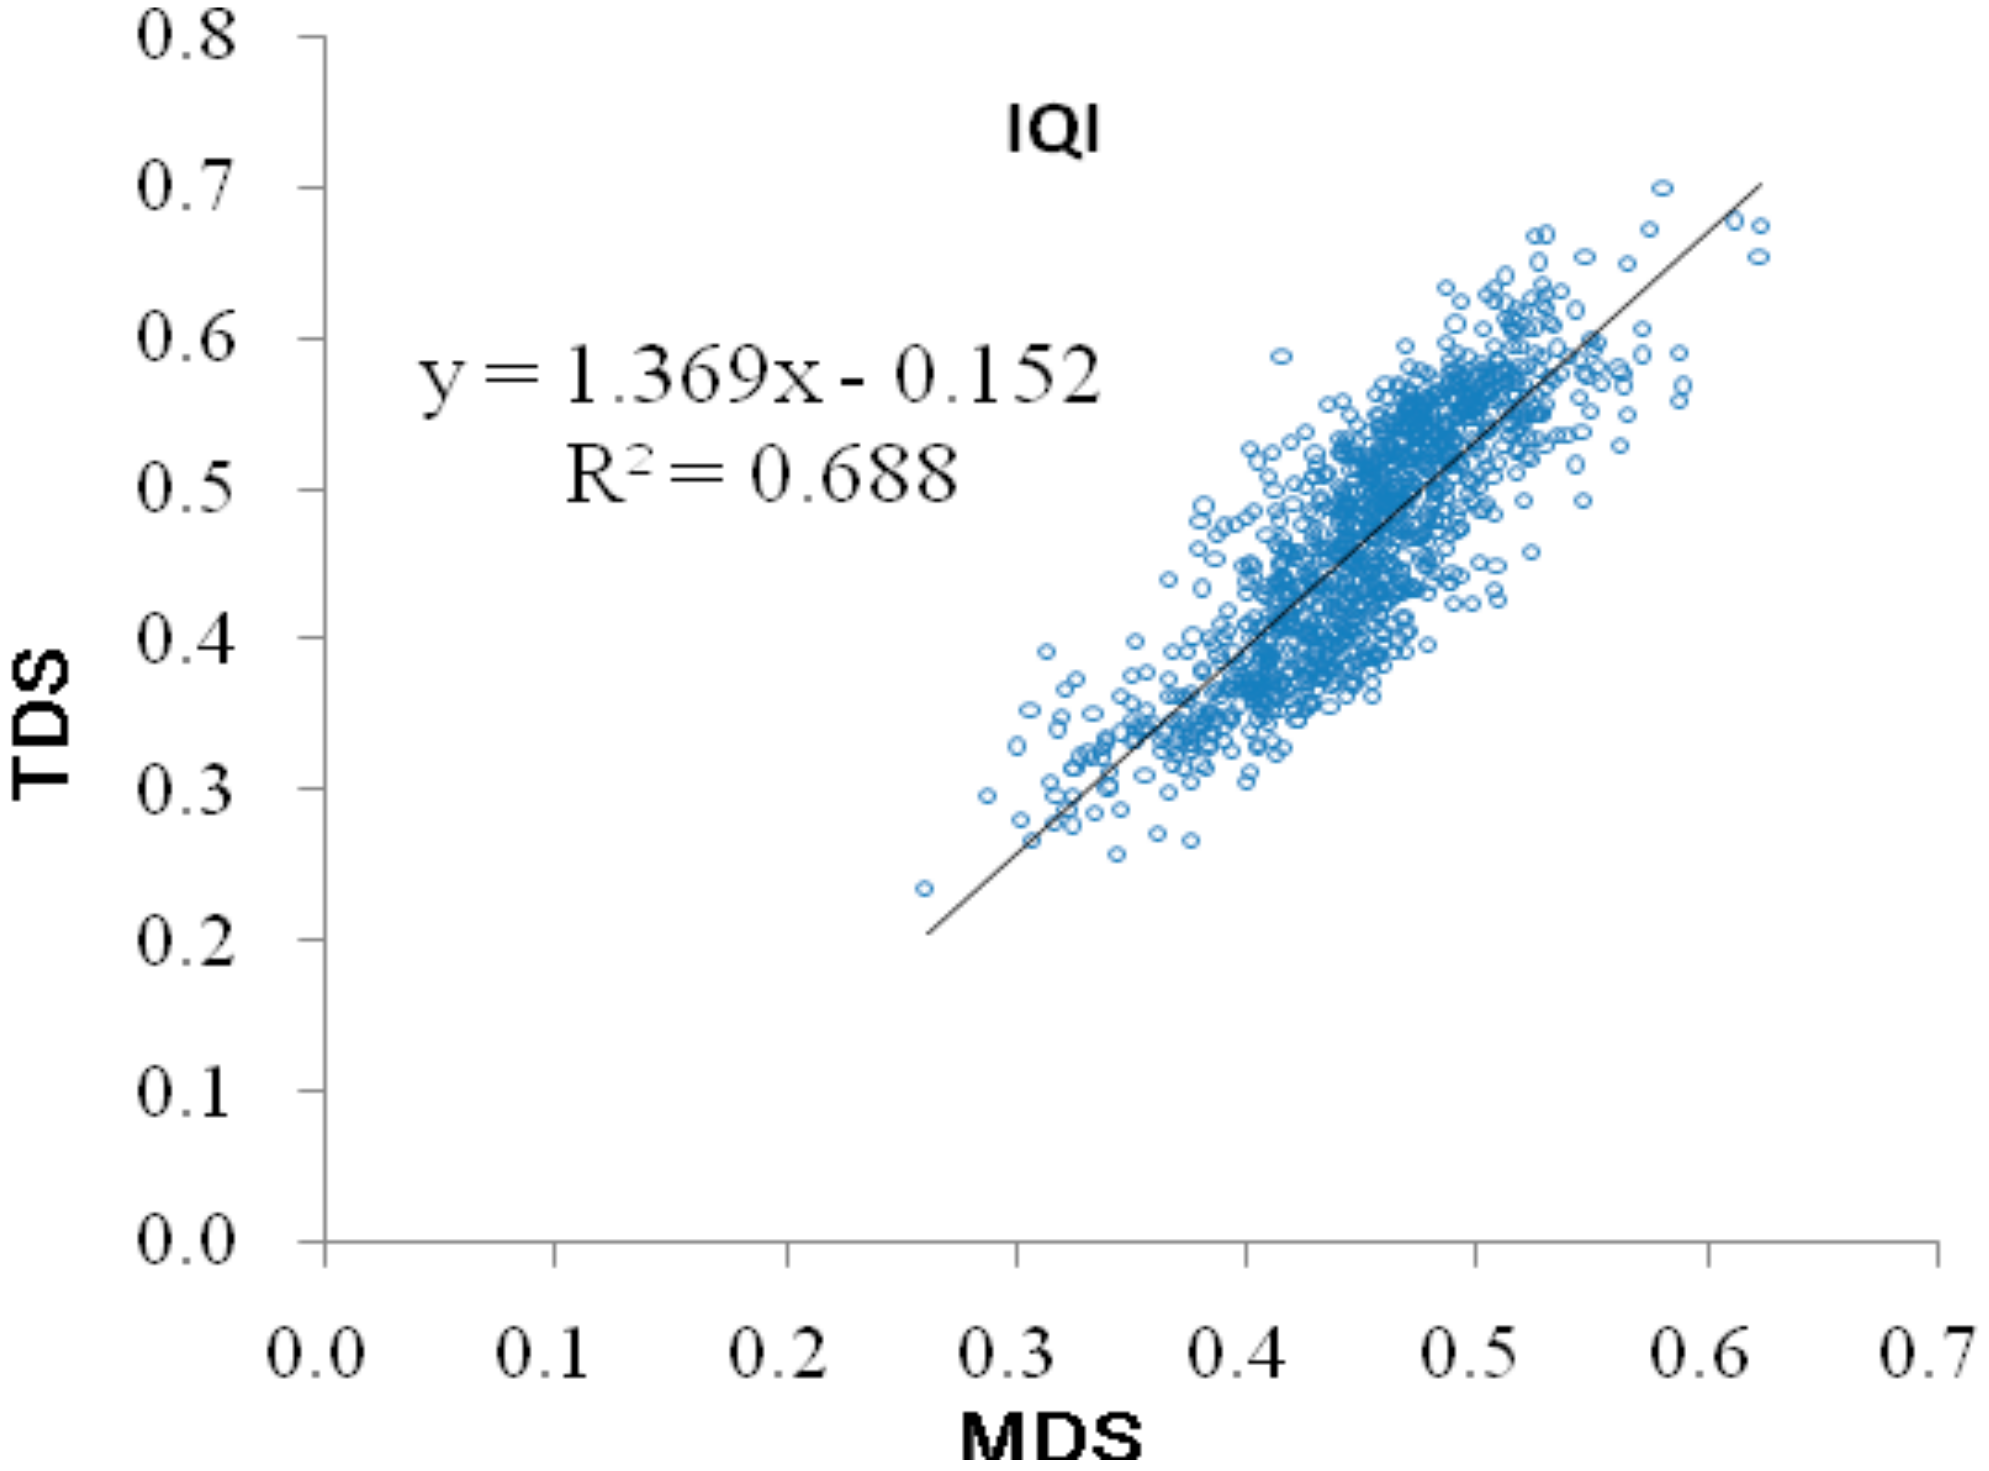
3.3. Indices Validation

Generally, 30% of the total data can be used as test data. We extracted 30% of the sampling points (the number is 507) randomly from overall sampling points to conduct the test analysis via the subset feature function in ArcGIS 10.0. Using a direct comparison, the result showed an agreement of 53.65% between the grades of the TDS and MDS methods (Table A3 and Table A4). The correlation between the TDS and MDS indicator methods for the IQI indices was significant with Pearson coefficients of 0.75 (p < 0.001). The linear relationships among the IQI of the TDS and MDS indicator methods (Figure 5) showed higher correlation coefficients with a R2 value of 0.688.

3.4. Effects of Environmental Attributes

The ANOVA results showed that the mean value of IQI was significantly influenced by elevation (F = 0.152 and p < 0.001), slope gradient (F = 0.542 and p < 0.001) and straw incorporation (F = 0.215 and p < 0.001) (Table 7). With the increase of elevation, gradient and amount of straw incorporation, the mean value of IQI decreased. There was no significant effect on soil quality in this region from annual precipitation and accumulated temperature that ≥10 °C.
There are five different types of soil parent materials in the study area: alluvial deposit, diluvium, lacustrine deposit, aeolian sediment, and loess. The mean value of the IQI for the aeolian sediment was only 0.373 and showed significant differences from all the other types. The lacustrine deposit had a noticeably higher mean value for the IQI but only showed a significant difference with the aeolian sediment.
Soil types were divided into six groups according to the FAO soil classification. Among these soil types, paddy soil and black soil had a higher mean value for the IQI (0.562, and 0.527 respectively) and showed no significant difference between them. In addition, the paddy soil is characterized as having the lowest standard deviation. The mean value of the IQI for the aeolian soilwas the lowest and shows a significant difference with other soil type, except for meadow soil.
Samples were assigned to two chemical fertilizer amount levels: <300 kg/ha and ≥300 kg/ha. The ANOVA results indicated that there was no significant difference between these two groups for the mean value of IQI (F = 0.053 and p = 0.139).
The spatial distribution of the climatic factors has obvious zonal characteristics (Figure 3). Despite being one of the determinants of soil formation, the results in this study of the ANOVA show insignificant differences between the mean values of the IQI and groups of annual precipitation and accumulated temperature.
For the CBNC, the terrain is relatively flat and the areas with a slope gradient of less than 3 degrees account for half of the total croplands (Figure 2). Taking 200 m and 3 degrees as grouping thresholds, the elevation and slope gradient were divided into two groups respectively. The ANOVA analysis for both the elevation and slope gradient showed significant differences between the groups (Table 7).
Though results of the ANOVA show significant difference between the mean value of the IQI and the three grade of straw incorporation (grade 1 = 0; grade 2 < 3500 kg/ha, and grade 3 between 3500 and 6500 kg/ha), the mean value of the IQI decreased when more straws were returned into the field (Table 7).

4. Discussion

4.1. Indicator Method and Indices

Among the seven indicators retained in the MDS, SOM, CEC, pH, TN and TK have generally been found to create MDS in previously studies [12,26]. SOM and available nutrients changed with the increasing of cultivated land depth and 20 cm is the depth that exhibits the better soil quality [26]. Nearly all studies on soil quality contained organic matter [25,27]. In the CBNC, SOM changed from 1.44 to 51 g kg−1 and influenced soil quality greatly. Though it has higher correlation with TN and the correlation coefficient was less than 0.6 (r < 0.6), we still introduced it into the MDS indicators. The value of CEC basically represents the amount of nutrients the soil may maintain, that is, the fertility of the soil [28]. CEC can be used as a sensitive index to assess the soil fertility, and it is also an important basis to improve rational fertilization and soil quality [28]. The higher values of CEC were distributed in the middle part of the CBNC from north to south (Figure 6a), while in the western and eastern parts, the value decreased. Furthermore, through overlaying the soil type data and CEC data, we found that areas with higher values of CEC are also the concentrated distribution areas of black soils (Figure 6a). Based on soil pH, soils were classified from weak acid to moderate sodic (Figure 6b). Higher values were distributed mainly in the west of the CBNC, especially in Nongan and Lishu, and the values of CEC showed low to medium degree. Since farmers often identify soil compaction as an important problem, bulk density is always selected to make up minimum data sets to assess tillage and crop management effects on soil quality [29]. However according to the results of Logsdon and Karlen [30], when soils within the bulk density range encountered (0.8–1.6 mg m−3), BD is not a useful soil quality indicator. In our study, BD has the lowest weight for IQI of the TDS indicator and was not involved in the MDS indicator (Table 3). Except for these general indicators used in soil quality assessment, thickness of obstacle horizons and extractable Fe were also retained in our study, which seldom can be found in other MDS studies. The type, depth and thickness of obstacle horizons affect the growth of corn roots markedly in the crop system [12]. Iron is a structural component element related to metabolic processes and plays a key role in the synthesis of chlorophyll. It participates in the process of photosynthesis and nitrogen fixation [31]. An increased extractable Fe was observed to a depth of 20 cm after continuous N application in the long term, possibly due to the decrease in pH associated with a N application [31,32]. The inclusion of micronutrients in MDS can offer a broader view of soil nutrition for farmers and scientists, who usually take the macroelements such as N, P and K, etc., as references to apply fertilizer.
The indicators of MDS were selected based on those of TDS and the indicator numbers decreased from sixteen to seven. For the TDS indicator, on the one hand, including additional indicators means a more comprehensive analysis and a higher evaluation accuracy. On the other hand, owing to large numbers of indicators, complex experimental analyses are laborious and time-consuming [12]. Many studies suggested that the MDS indicator method can be used to assess soil quality at a regional scale as long as it was verified [12,25]. In our study, there is a better agreement between the grades of TDS and MDS and the correlation was significant (Table A3 and Table A4), which indicated that the MDS indicator method was an effective method to reflect soil quality in croplands of the CBNC. We also found that the same indicators played different roles in the two methods. Unlike the TDS indicator method, in the MDS indicator method pH and AFe have the highest weights and OHD accounted for the lowest weights (Table 3).

4.2. Soil Quality

In general, the soil quality status in the CBNC varies from moderate to high [15,22]. The assessment results of the TDS indicator method indicated that soils with moderate quality (Grades III and IV) were dominant and accounted for 69.30%. Meanwhile, results from the MDS indicator method showed a better quality for soils in this area. Grade II and grade III were the dominant grades and accounted for 57.84%. The proportion of high quality (Grade I) and very low quality (GradeV) increased. The mean value of the IQI using the MDS indicator method was higher than that of the TDS indicator method (Table 6 and Figure 2).
For the TDS and MDS indicator methods, the values of the IQI accounting for the lowest degree of soil quality were distributed in the western part of the CBNC. Moreover, in the west region, chernozem and aeolian soils were found. Due to the limitation on plant growth resulting from obstacles and the impoverishment of the soil, the soil quality was lower. Black soils were distributed in the middle part of the study region from north to south and accounted for mainly grade II and grade III. We also found that soils with the highest quality were distributed around Changchun, which was in accordance with the previous research results [33]. The rapid expansion of urban land in this region came at the cost of high quality croplands despite the protection policy of croplands [33]. How to coordinate the contradiction between rapid urbanization and cropland protection is a problem that requires closer attention for regional sustainable development.

4.3. Association with Environmental Factors and Agricultural Management Practices

Soil quality varies spatially and temporally from a field to a larger region scale, and is affected by both intrinsic (soil formation factors, such as climate, soil parent material, topography, etc.) and extrinsic factors (e.g., soil management practices, pesticides, fertilization and crop rotation) [16].
Parent material is the material basis for forming soil, and many characteristics of parent material are inherent to soil. For example, different parent materials will lead to the heterogeneity of the physical and chemical traits of the soil [31]. In addition, soil parent material is a crucial determinant of bacterial community structure in cultivated soils [32]. Parent material and soil type formed by soil parent material therefore determine the framework for soil quality. We found that the aeolian sediment has the smallest mean value for the IQI and that the mean value of the lacustrine deposit was the largest (Table 7). For soil types, the mean values of the IQI in chernozems and aeolian soils were the lowest. But under the double action of soil erosion and intensive human activity resulting from the cropland utilization in black soil zone, soil properties have been greatly changed, which led to a reduction in the difference of soil quality formed by parent materials and soil types.
The soil quality of the CBNC appeared to be significantly affected by topography. In Northeast China, soil erosion is considered to be one of the important reasons affecting soil quality. According to the study results of Wang et al. [23], soil properties were affected by the slope position significantly. In our study, the mean values of the IQI were significantly influenced by elevation and slope gradient. Soils of the flood plain (elevation < 200 m, slope gradient < 3, depositing) have a statistically higher quality than those from upland areas (elevation > 200 and slope gradient > 3, eroding) (Table 7 and Figure 2). These results demonstrated that topographic factors could be used to help in the understanding of soil quality.
Different fertilization treatments have different effects on soil properties in different crop systems, increasing or decreasing the contents of some soil nutrients [34]. Russell [34] studied the fertilization addition under different N fertilization rates (0, 90, 180 and 270 kg/ha), and found that for continuous corn cropping systems, N fertilizer additions resulted in remarkably lower soil pH (0 to 15 cm depth), lower exchangeable Ca, Mg and K, and CEC [34]. In our study, the result of the ANOVA showed that the difference between the two groups was insignificant. This is possible due to the larger grouping threshold (Table 7, 300 kg/ha). This also showed that the quality of soils could be improved with the increasing fertilization addition within limits and excessive fertilization can cause obvious acidification and heavy salt accumulation in surface soil, resulting in soil compaction, and the degradation of croplands [35]. Rational fertilization is the key to the implementation of precision agriculture and the management of soil sustainability.
Climatic factors affect carbon and nitrogen mineralization directly through changing temperature and soil moisture [36]. We used the annual average precipitation and accumulated temperature that ≥10 °C to test the climatic effects on soil quality, but the effects were insignificant. It is likely that for the CBNC, the regional difference in climate is not too big.
According to previous studies, straw incorporation would help to improve the carbon and nitrogen content of soils and to increase crop yields [34]. In our study, the results of the ANOVA showed that the mean value of the IQI was significantly different between the different groups and the mean value of the IQI decreased when more straws were returned into the field. This can be explained by Yu’s study [37]: In the early stage of straw incorporation, the crop yield was reduced and did not increase until after the third season. This indicated the long term effect of straw incorporation; the most suitable amount of straw returning should be studied to maintain soil fertility balance.

5. Conclusions

This study assessed the soil quality of croplands in the Corn Belt of Northeast China using integrated quality index via both the TDS and MDS indicator methods. All indicators in the TDS indicator method were suitable for soil quality evaluation, whereas, among these indicators, OHT, CEC, pH, SOM, TN, TK, and AFe were included in the MDS indicator method via the PCA method. Though it has been suggested that the MDS indicator method can be used as a suitable tool to evaluate soil quality, a validation test had to be conducted. In this paper, various test methods were used and the results showed a significant correlation for the grades of MDS and TDS, which demonstrated the reliability of the application of MDS in the CBNC. For IQIs calculated via the TDS and MDS indicator methods, a generally moderate soil quality was identified as a dominant grade for the CBNC. There were obvious regional differences in the IQI values, and soil quality increased from west to east spatially. For the mean value of each county, the sequences were very similar. The soil quality of Yushu, Changchun and Shuangyang had higher values, and that of Nongan was the lowest. Parent material and soil type were intrinsic factors and determined the base of soil properties, while topographic factors and agricultural management practices were extrinsic factors that changed soil properties. Because soil erosion is one of the most important factors that lead to the soil degradation in this region, the effect of terrain on soil quality is significant. The influence of agricultural activities on soil quality is shown in two aspects. On the one hand, soil compaction, soil pollution and soil loss due to the excessive use of chemical fertilizers and the unreasonable use of agricultural machinery, which lead to soil degradation and deterioration of soil quality; on the other hand, the reasonable agricultural management will promote sustainable utilization of soil. Due to small longitudinal and latitudinal spans, climate was not the principal factor affecting soil quality in the study region.

Acknowledgments

This work is supported by the by the Natural Science Foundation of China (No. 41671219), the Key Project for Field Station Alliance, Chinese Academy of Sciences (KFJ-SW-YW026), and the Regional Project: Comparative study on land use and geochemistry in global black soil zones (No. DD201601).

Author Contributions

Xiaoyan Li conceived and wrote the paper; Huiying Li and Limin Yang analyzed the data; and Yongxing Ren analyzed and summed up the literatures concerned.

Conflicts of Interest

The authors declare no conflict of interest.

Appendix A

Table A1. Methods used in laboratory analysis for selected indicators.
IndictorProtocolReference
Bulk density, BDCore method[20]
Soil organic matter, SOMPotassium dichromate oxidation[20]
pHSaturated soil paste[20]
Cation exchange capacity, CECAmmonium acetate extraction[20]
Total nitrogen, TNKjeldahl[20]
Total phosphorus, TPDigestion, spectrophotometer detection[21]
Total potassium, TKNaOH fusion[20]
Alkali-dissolvable nitrogen, ANAlkaline hydrolysis diffusion[20]
Extractable phosphorus, APSodium bicarbonate Olsen method[21]
Extractable potassium, AKFlame photometric method[20]
Extractable Cu, ACuFlame photometer detection[20]
Extractable Fe, AFeFlame photometer detection[20]
Extractable Zn, AZnFlame photometer detection[20]
Table A2. Classification criteria of the soil quality.
Indicator MethodItemsSoil Quality Grade
Grade I
Very High
Grade II
High
Grade III
Moderate
Grade IV
Low
GradeV
Very Low
TDSclass>0.600.48–0.600.45–0.480.40–0.45<0.40
MDSclass>0.600.54–0.600.44–0.540.38–0.44<0.38
Table A3. Crossvalidation of MDS and TDS grades.
MDS Grades
12345Total
TDS grades1231830044
26415740108
309123446182
40052649125
5001262148
Total296823613836507
Table A4. Verification results of three methods.
Test MethodDirect ComparisonPearson
value53.650.75 *
* p < 0.001.

References

  1. Liu, Z.J.; Zhou, W.; Shen, J.B.; Li, S.T.; Liang, G.Q.; Wang, X.B.; Sun, J.W.; Ai, C. Soil quality assessment of acid sulfate paddy soils with different productivities in Guangdong Province, China. J. Integr. Agric. 2014, 13, 177–186. [Google Scholar] [CrossRef]
  2. Andrews, S.S.; Karlen, D.L.; Cambardella, C.A. The soil management assessment framework: A quantitative soil quality evaluation method. Soil Sci. Soc. Am. J. 2004, 68, 1945–1962. [Google Scholar] [CrossRef]
  3. Doran, J.W.; Parkin, T.B. Defining and assessing soil quality. In Defining Soil Quality for a Sustainable Environment; Doran, J.W., Ed.; Special Publication No. 35; SSSA: Madison, WI, USA, 1994; pp. 3–21. [Google Scholar]
  4. Karlen, D.L.; Mausbach, M.J.; Doran, J.W.; Cline, R.G.; Harris, R.F.; Schuman, G.E. Soil quality: A concept, definition, and framework for evaluation. Soil Sci. Soc. Am. J. 1997, 61, 4–10. [Google Scholar] [CrossRef]
  5. Zornoza, R.; Acosta, J.A.; Bastida, E.; Dominguez, S.G.; Toledo, D.M.; Faz, A. Identification of sensitive indicators to assess the interrelationship between soil quality, management practices and human health. Soil 2015, 1, 173–185. [Google Scholar] [CrossRef]
  6. Klingebiel, A.A.; Montgomery, P.H. Land capability classification. In USDA Handbook; United States Department of Agriculture: Washington, DC, USA, 1961; Volume 210. [Google Scholar]
  7. Maurício, R.C.; Cássio, A.T.; Douglas, K. Soil Quality Evaluation Using the Soil Management Assessment Framework (SMAF) in Brazilian Oxisols with Contrasting Texture. Rev. Bras. Ciênc. Solo. 2017, 41. [Google Scholar] [CrossRef]
  8. Sun, B.; Zhou, S.L.; Zhao, Q.G. Evaluation of spatial and temporal changes of soil quality based on geostatistical analysis in the hill region of subtropical China. Geoderma 2003, 115, 85–99. [Google Scholar] [CrossRef]
  9. Legaz, B.V.; De, S.; Maia, D.; Teixeira, R.F.M.; Anton, A.; Putman, B.; Sala, S. Soil quality, properties, and functions in life cycle assessment: An evaluation of models. J. Clean. Prod. 2017, 140, 502–515. [Google Scholar] [CrossRef]
  10. Larson, W.E.; Pierce, F.J. The dynamics of soil quality as a measure of sustainable management. In Defining Soil Quality for a Sustainable Environment; Doran, J.W., Ed.; Special Publication No. 35; SSSA: Madison, WI, USA, 1994; pp. 37–51. [Google Scholar]
  11. Andrews, S.S.; Karlen, D.L.; Mitchell, J.P. A comparison of soil quality indexing methods for vegetable production systems in Northern California. Agric. Ecosyst. Environ. 2002, 40, 25–45. [Google Scholar] [CrossRef]
  12. Guo, L.L.; Sun, Z.; Zhu, O.; Han, D.R.; Li, F.D. A comparison of soil quality evaluation methods for Fluvisol alongthe lower Yellow River. Catena 2017, 152, 135–143. [Google Scholar] [CrossRef]
  13. Andrews, S.S.; Carroll, C.R. Designing a soil quality assessment tool for sustainable agroecosystem management. Ecol. Appl. 2001, 11, 1573–1585. [Google Scholar] [CrossRef]
  14. Zhang, Q.; Zhang, J.Q.; Guo, E.L.; Yan, D.H.; Sun, Z.Y. The impacts of long-term and year-to year temperature change on corn yield in China. Theor. Appl. Climatol. 2015, 119, 77–82. [Google Scholar] [CrossRef]
  15. Liu, D.W.; Wang, Z.M.; Zhang, B.; Song, K.S. Spatial distribution of soil organic carbonand analysis of related factors in croplands of the black soil region, Northeast China. Agric. Ecosyst. Environ. 2006, 113, 73–81. [Google Scholar] [CrossRef]
  16. Gao, J.F.; Li, C.F.; Zhang, H.H. Soil spatial analysis and agricultural land use optimization by use optimization by using GIS. Chin. Geogr. Sci. 2003, 13, 25–29. [Google Scholar] [CrossRef]
  17. Liu, X.B.; Zhang, X.Y.; Wang, Y.X.; Sui, Y.Y.; Zhang, S.L.; Herbert, S.J.; Ding, G. Soil degradation: A problem threatening the sustainable development of agriculture in Northeast China. Plant. Soil. Environ. 2010, 56, 87–97. [Google Scholar]
  18. Qi, Y.B.; Jeremy, L.D.; Huang, B.; Zhao, Y.C.; Sun, W.X.; Gu, Z.Q. Evaluating soil quality indices in an agricultural region of Jiangsu Province, China. Geoderma 2009, 149, 325–334. [Google Scholar] [CrossRef]
  19. Definiens, A.G. Definiens Professional 8.6 User Guide; Definiens AG: Munchen, Germany, 2011. [Google Scholar]
  20. Li, X.Y.; Li, H.Y.; Zhang, Y.N.; Yang, L.M. Spatial Patterns and the regional Differences of rural settlements in Jilin Province, China. Sustainability 2017, 9, 2170. [Google Scholar] [CrossRef]
  21. Man, W.D.; Wang, Z.M.; liu, M.Y.; Lu, C.Y.; Jia, M.M.; Mao, D.H.; Ren, C.Y. Spatio-temporal Dynamics analysis of cropland in Northeasst China during 1990–2013 based on remote sensing. Trans. CSAE 2016, 32, 1–10. [Google Scholar]
  22. Zhang, S.L.; Jiang, L.L.; Liu, X.B. Soil nutrient variance by slope position in a Mollisol farmland area of Northeast China. Chin. Geogr. Sci. 2016, 26, 508–517. [Google Scholar] [CrossRef]
  23. Wang, Z.M.; Zhang, B.; Song, K.S. Soil orgainic carbon under different landscape attributes in croplands of Northeast China. Plant. Soil. Environ. 2008, 54, 420–427. [Google Scholar]
  24. Govaerts, B.; Sayreb, K.D.; Deckersa, J. A minimum data set for soil quality assessment of wheat and corn cropping in the highlands of Mexico. Soil. Tillage Res. 2006, 87, 163–174. [Google Scholar] [CrossRef]
  25. Fazel, R.; Rossana, M.; Hossein, A.B.; Zahra, F.; Sima, R.B. Assessment of soil quality indices in agricultural lands of Qazvin province, Iran. Ecol. Indic. 2014, 40, 19–26. [Google Scholar]
  26. Shukla, M.K.; Lala, R.; Ebinger, M. Determining soil quality indicators by factor analysis. Soil. Tillage Res. 2006, 87, 194–204. [Google Scholar] [CrossRef]
  27. Zhang, X.Y.; Sui, Y.Y.; Zhang, X.D.; Meng, K.; Herbert, S.J. Spatial variability of nutrient properties in black soil of northeast China. Pedosphere 2007, 17, 19–29. [Google Scholar] [CrossRef]
  28. Smaling, E.M.A.; Braun, A.R. Soil fertility research in Sub-Saharan Africa: New dimension new challenges. Commun. Soil Sci. Plan. 1996, 3–4, 365–386. [Google Scholar] [CrossRef]
  29. Rezaei, S.A.; Gilkes, R.J.; Andrews, S.S. A minimum data set for assessing soil quality in rangelands. Geoderma 2006, 136, 229–234. [Google Scholar] [CrossRef]
  30. Logsdon, S.D.; Karlen, D.L. Bulk density as a soil quality indicator during conversion to no-tillage. Soil. Tillage Res. 2004, 78, 143–149. [Google Scholar] [CrossRef]
  31. Alfaro, F.D.; Manzano, M.; Marquet, P.A.; Gaxiola, A. Microbial communities in soil chrono sequences with distinct parent material: The effect of soil pH and litter quality. J. Ecol. 2017, 105, 1709–1722. [Google Scholar] [CrossRef]
  32. Augustine, K.O.; Maysoon, M.M.; Johnathan, D.H.; Phillip, W.S. Changes in soil surface chemistry after fifty years of tillage and nitrogen fertilization. Geoderma 2017, 308, 46–53. [Google Scholar]
  33. Li, W.B.; Wang, D.Y.; Li, H.; Liu, S.H. Urbanization-induced site condition changes of peri-urban cultivated land in the black soil region of northeast China. Ecol. Indic. 2017, 80, 215–223. [Google Scholar] [CrossRef]
  34. Russell, A.E.; Laird, D.A.; Mallarino, A.P. Nitrogen fertilization and cropping system impacts on soil quality in Midwestern Mollisols. Soil. Sci. Soc. Am. J. 2005, 70, 249–255. [Google Scholar] [CrossRef]
  35. Schwab, A.P.; Owensby, C.E.; kulyingyong, S. Change in soil chemical properties due to 40 years of fertilization. Soil Sci. 1990, 182, 19–34. [Google Scholar] [CrossRef]
  36. Olesen, J.E.; Bindi, M. Consequences of climate change for European agricultural productivity, land use and policy. Eur. J. Agron. 2002, 16, 239–262. [Google Scholar] [CrossRef]
  37. Yu, Y.F.; Xion, G.Y.; Zhang, J.M. The effect of straw reapplication on yields of grain crops and soil fertility in Jianghan Plain. Huibei Agric. Sci. 2008, 47, 169–173. (In Chinese) [Google Scholar]
Figure 1. The study region and locations of soil sampling sites. (a) the location of the CNBC, China; (b) administrative boundary; (c) land cover map; (d) soil sampling locations.
Sustainability 10 00248 g001
Figure 2. (a) Altitude map and (b) slope gradient map of the study area.
Sustainability 10 00248 g002
Figure 3. Spatial distributions of climatic factors.
Sustainability 10 00248 g003
Figure 4. Spatial distribution map of soil quality of croplands using (a) the TDS method and (b) the MDS method.
Sustainability 10 00248 g004
Figure 5. The linear relationship between the TDS and MDS indicators.
Sustainability 10 00248 g005
Figure 6. Dot distribution maps of CEC (a) and pH (b) of the study area.
Sustainability 10 00248 g006
Table 1. Standard scoring functions and parameters of quantitative soil indicators in the CBNC.
IndicatorsFT x 1 x 2 SSF
CLD (cm)U(x)1020 U ( x ) = { 0.1 x x 1 0.9 × x x 1 x 2 x 1 + 0.1 x 1 < x < x 2 1 x x 2
L ( x ) = { 1 x x 1 1 0.9 × x x 1 x 2 x 1 x 1 < x < x 2 0.1 x x 2
P ( x ) = { 0.1 x x 1 0.9 × x x m i n x m a x x m i n + 0.1 x 1 < x < x 2 1 0.9 × x x m i n x m a x x m i n x x 2
OHD (cm)U(x)0100
CEC (cmol kg−1)U(x)4.944
SOM (g kg−1)U(x)1050
TN (g kg−1)U(x)0.752.86
TP (g kg−1)U(x)0.41
TK (g kg−1)U(x)1030
AN (mg kg−1)U(x)15.11140
AP (mg kg−1)U(x)5100
AK (mg kg−1)U(x)40100
Acu (mg kg−1)U(x)25
Afe (mg kg−1)U(x)240
Azn (mg kg−1)U(x)0.53
OHT (cm)L(x)1025
BD (g cm−3)L(x)1.252
pHR(x)4.68.4
Table 2. Results of the principal component analysis for soil quality indicators.
PCsPC1PC2PC3PC4PC5
Eigenvalue2.4592.0451.6631.6271.181
Percent15.37112.78110.39210.1677.38
Cumulative percent15.37128.15238.54448.71156.091
EigenvectorsPC1PC2PC3PC4PC5GroupingNorm value
CLD0.0520.4950.0770.284−0.21520.839
BD0.053−0.428 0.1420.195−0.03820.692
OHD−0.5280.2640.575 −0.186−0.30931.244
OHT0.614 −0.294−0.4450.2220.30611.275
CEC0.612 0.369−0.180−0.297−0.06711.184
pH0.1770.594 −0.3340.242−0.01621.039
SOM0.658 −0.1220.424−0.016−0.11111.187
TN0.663 0.3100.299−0.266−0.15511.253
TP0.064−0.3900.2840.475 0.12240.916
TK−0.2660.4910.028−0.0600.598 51.047
AN0.352−0.0170.443 0.121−0.15430.827
AP−0.1950.0930.420 0.2320.38830.819
AK0.404−0.3480.232−0.439 0.25741.063
ACu0.2640.558 0.0960.0930.17020.934
AFe0.1440.046−0.1110.743 −0.35041.057
AZn0.1720.1520.406 0.3950.37230.901
The number of underlined figures indicated the largest contribution among five pricipal components, which assighedtocorresponding principal component groups.
Table 3. The communality and weight value of all variables in the TDS and MDS indicator methods.
IndicatorTDSMDSIndicatorTDSMDS
COMWeightCOMWeightCOMWeightCOMWeight
CLD0.38040.0424TP0.47710.0532
BD0.24600.0274TK0.67380.07510.59710.1337
OHD0.80500.0897AN0.35880.0400
OHT0.80900.09010.30340.0679AP0.42770.0477
EC0.63600.07090.66620.1491AK0.59660.0665
pH0.55470.06180.76430.1711ACu0.42820.0477
SOM0.64030.07130.66730.1494AFe0.70880.07900.69490.1556
TN0.72020.08020.77420.1733AZn0.51210.0571
Table 4. Statistical characteristics of the selected indicators.
IndicatorsMeanStandard DeviationCV (%)MinimumMaximumRange
CLD (cm)19.322.5713.3014.0025.0011.00
BD (g cm−3)1.320.2317.421.002.001.00
OHD (cm)2.908.13280.340.00100.00100.00
OHT (cm)4.7412.17256.751.0065.0064.00
CEC (cmol kg−1)22.826.7229.454.9044.3139.41
pH6.511.0516.134.658.453.80
SOM (g kg−1)24.446.4226.271.4451.0049.56
TN (g kg−1)1.300.4232.310.102.862.76
TP (g kg−1)0.590.2542.370.101.461.36
TK (g kg−1)20.895.1224.515.9547.2641.31
AN (mg kg−1)121.9142.3834.7615.101140.001124.90
AP (mg kg−1)25.5525.64100.350.30180.45180.15
AK (mg kg−1)136.6952.1538.1539.22326.93287.71
ACu (mg kg−1)3.032.6888.450.0519.3319.28
AFe (mg kg−1)31.8627.7987.231.38208.00206.62
AZn (mg kg−1)1.661.1971.690.0010.1310.13
Table 5. Soil quality grades for the TDS and MDS indicator methods.
Indicator MethodItemsSoil Quality Grade
Grade IGrade IIGrade IIIGrade IVGrade V
TDSArea (ha)170,806402,7411,127,540688,314230,870
Area%6.5215.3743.0326.278.81
MDSArea (ha)292,226752,0311,045,347679,934337,766
Area%9.4024.2033.6421.8810.87
Table 6. The mean value of IQI in different counties calculated via the TDS and MDS indicator methods.
YushuNonganDehuiJiutaiGongzhulingLishuYitongChangchunShuangyang
IQITDS0.4720.4230.4680.4630.4260.4250.4640.4840.489
IQIMDS0.5340.4380.4970.4550.4380.4440.5010.5220.531
Table 7. The mean values of the IQI of soils under different environmental factors at a 0.05 level.
FactorsClassesUnitIQISDIQI
Parent materialalluvial deposits0.493 a0.090
deluvium0.461 b0.055
lacustrine deposit0.524 a,b0.114
aeolian sediment0.373 c0.073
loess0.490 a0.088
Soil typeblack soil0.527 b0.0711
dark brown forest soil0.499 a0.072
Chernozems0.464 c0.090
aeolian soil0.431 d0.097
paddy soil0.562 b0.069
meadow soil0.454 a,c,d0.088
Fertilizer amount<300kg/ha0.485 a0.073
≥3000.480 a0.066
Annual precipitation<550mm0.4650.068
≥5500.5050.065
≥10 °C accumulated temperature<2900°C0.5210.055
≥29000.4410.059
DEM<200m0.457 a0.048
≥2000.446 b0.050
slope<3degree0.491 a0.070
>30.472 b0.068
Straw incorporation00.565 a0.074
<3500kg/ha0.519 b0.082
3500–65000.439 c0.078
Means followed by the same letter within a factor are not significantly different among classes. No letter showed that the class shows an insignificant difference with all the other classes within the factor.

