Review

The Race to Document Archaeological Sites Ahead of Rising Sea Levels: Recent Applications of Geospatial Technologies in the Archaeology of Polynesia

Department of Anthropology, Southern Methodist University, P.O. Box 750336, Dallas, TX 75275-0336, USA
Sustainability 2018, 10(1), 185; https://doi.org/10.3390/su10010185
Submission received: 22 December 2017 / Revised: 10 January 2018 / Accepted: 11 January 2018 / Published: 13 January 2018
(This article belongs to the Special Issue Geospatial Technologies for Sustainable Natural Resources)

Abstract

:
Marine environments are rich in natural resources, and therefore, have been targeted for human occupation from at least the Pleistocene. In the modern day, the preservation and documentation of the physical archaeological evidence of human occupation and use of coasts, islands, and the ocean must now include mitigating the impacts of global climate change. Here, I review recent efforts to document archaeological sites across the islands of Polynesia using geospatial technology, specifically remote sensing, high-resolution documentation, and the creation of archaeological site geodatabases. I discuss these geospatial technologies in terms of planning for likely future impacts from sea level rise; a problem that will be felt across the region, and based on current evidence, will affect more than 12% of all known sites in New Zealand (Aotearoa).

“In coastal regions around the world, we need to accelerate our own efforts to inventory, investigate, and interpret the history of endangered coastal sites … We must pull our heads from the proverbial sand for we are literally racing a rising tide.”
[1]

1. Introduction

Marine environments are rich in natural resources, and therefore, have been targeted for human occupation in the Pacific from at least the Pleistocene (see [2] for a recent review). The physical evidence of human activity in the past is often referred to as a “cultural resource” because, like natural resources, the archaeological sites where we find ancient artifacts, human remains, and architecture have significant scientific and humanitarian value and are finite (see [3] for a brief outline of use of the term cultural resources in the United States). In the modern day, the preservation and documentation of the physical archaeological evidence of human occupation and use of coasts, islands, and the ocean must now include mitigating the impacts of global climate change, especially projected rising sea levels.
Known trends in sea level rise [4,5,6,7,8,9,10,11] and coastal erosion [12,13,14] makes sites located in marine environments especially vulnerable to the impacts of climate change. Within the past decade, research on the effects of climate change on cultural resources has risen steeply, representing a range of disciplines and methods [15]. But, at present, research is geographically uneven, with many studies focusing on Europe and North America, and it is exceedingly rare for archaeological investigations to deal directly with modern climate change on coastal and islands sites in the Pacific [16,17,18,19,20].
There is a pressing need in archaeology to engage in a rapid evaluation of the utility of technology and the results of impact studies to stay ahead of the “rising tide” [1]. The suite of geospatial technologies available to archaeologists—including GPS, GIS, remote sensing, and laser scanning—are useful tools for documenting and analyzing evidence and communicating the results of our research [21,22]. Current research on the effects of climate change on cultural resources employs geospatial technologies like remote sensing, GIS, and modeling [15].
Here, I review recent efforts to document archaeological sites in different coastal and marine environments across the islands of Polynesia using geospatial technology, specifically remote sensing, high-resolution documentation, and archaeological site geodatabases. I address two questions: how have we recently used geospatial technology in the archaeology of Polynesia? And, how can we use it better in the future to address the coming consequences of climate change?
The topics addressed here—geospatial technology, coastal and island archaeology, and climate change—cover a lot of issues and literature that have been summarized or discussed elsewhere (e.g., [23,24,25]), and so to begin, I want to be clear about the scope of this review.
First, I have tried to include examples of a wide range of geospatial technologies. Some of these technologies, such as GPS and remote sensing using satellite imagery, are so pervasive that it would be impossible to include every study. Other technologies that might be applied, for example declassified satellite imagery, simply have not been used in the region. Still other technologies, such as the use of Unmanned Aerial Vehicles, are not yet well represented in peer-reviewed literature when it comes to studies relevant to the effects of climate change on coasts.
Second, I am primarily concerned with the impacts of sea level rise. There are of course other consequences of climate change that will impact archaeology, for example drought and increased occurrences of wild fires, but my focus here is on coasts and near shore marine environments. These same environments are also prone to many other threats, specifically, urban development.
Third, I have focused on the archaeology of Polynesia, in part because it is my field of expertise, but also because sea level rise has the potential to have a proportionally greater devastating impact compared to other regions. In longer settled islands and coasts, archaeological sites that exist today have survived a number of changes in sea levels. In the case of Polynesia, the chronology of human settlement is, by world standards, extremely recent with the longest settlements going back less than 3000 years (2838 ± 8 years before present; [26]), and some islands did not have human inhabitants until 700 years ago (1270–1309 AD, [27]). In this paper, I primarily discuss the scientific losses due to climate change with the recognition that all of these locations have cultural value to the communities that live there today [28].

2. Remote Sensing

For archaeologists, remote sensing includes a range of tools used to detect and classify targets at a distance. I begin with two types of remote sensing commonly used in the region: imagery from aircrafts and satellites, and the use of LiDAR (Light Detection and Ranging) mounted on aircraft. Next, since much of what archaeologists are concerned with lay buried underground, I outline how archaeologists use geophysical survey techniques such as electronic resistivity/conductivity, magnetometry, and ground penetrating radar. Finally, I highlight several special challenges for applying remote sensing in near shore maritime environments.

2.1. Airborne and Satellite Imagery

The first large scale push to photograph the islands of Polynesia came during World War II. After the war, more color imagery becomes available, and we see aerial photography become a regular part of archaeology in New Zealand (Aotearoa) and in the Hawaiian Islands throughout the 1960s and 1970s.
In New Zealand, the focus was initially on large earthwork sites, hilltop fortifications created by Maori, which is not surprising given that there are over 6000 of these types of sites across the country [29,30]. In the 1990s, concern was raised over the property rights involved with photographing these iconic sites, specifically, if local Maori could claim air images as their cultural property, as has been done with rock art [31].
In the Hawaiian Islands, air photography played a key role in the first full-coverage surveys aimed at recording settlement patterns evident over large sections of land. In valley environments, these surveys recorded networks of irrigated pondfields, many of which were still in use. In places that were extremely important for non-irrigated agriculture it was air photography that first gave archaeologists the notion that there were abandoned “field systems” that were of equal or greater importance to traditional farming [32]. The first GIS studies of non-irrigated agriculture were based on digitized versions of air photo maps [33].
Declassified images from the Cold War era satellites have been applied successfully to archaeological remote sensing in many places in the world [34], except in Polynesia despite having surprisingly good coverage (Figure 1). I had a closer look at declassified images of Rapa Nui (Easter Island) in the hopes of determining why these had not been applied. Rapa Nui is a small island by world standards (165 sq km), and small among volcanic islands in the Pacific, but substantially larger the region’s coral atolls. Certainly, the number of images available on EarthExplorer (USGS) are limited (n = 12), which makes it difficult to find days where clouds are not blocking areas of interest, and the quality is far too low resolution to show archaeological features (Figure 2; note that CORONA images range in quality from 2 to 140 m).
Commercial satellites have made high resolution image analysis possible (Figure 3). For example, high resolution satellite images have been used on Rapa Nui to map the trails used to move the famous moai statutes from the island’s quarry [35], and the systematic classification of land used for farming [36]. The latter study used Worldview 2 imagery (0.5 m panchromatic; 2 m multispectral) of the entire island. About a third of the island was deemed not appropriate for analysis because it was either cloudy or developed. The study’s target—gardens with a layer of stones placed across the ground surface to cut down on soil erosion—were identified based on a supervised automated processes, with GPS survey data to help train the model. From this data, it was estimated that between 2.5 and 12% of island was gardened. Importantly, the coastal zone (0–50 m asl) was identified as an extremely active location for gardening (highest median classification), but yielded the largest error bars (min, max), making the coastal zone in great need for further survey aimed at tracking agricultural development.
The sequence of air and satellite images now available for Pacific Islands is making it possible to track shoreline erosion and accretion, and there are good GIS tools to do so (see [37] use of the USGS Digital Shoreline Analysis System). Shorelines are of course dynamic and require careful attention to defining specifically how features are changing. A study on the western coast of Hawai‘i Island looked at the changes in the coastline due to both anthropogenic and natural processes [38]. It showed that even two beaches within a short distance of one another were undergoing directly opposite processes (Figure 4). In this specific case, both are likely to impact archaeological sites.

2.2. Airborne LiDAR

Within the past decade we have started to see more regular use of airborne LiDAR in archaeology in general [39], and in Polynesia specifically (see [40] for a recent review). The high cost of flying this type of remote sensing has for the most part been shouldered by government agencies with an interest in planning for natural disasters and climate change. In New Zealand, vast regions of the country have been flown, and datasets are available (Land Information New Zealand, LINZ) (for an archaeological application, see [41]).
The first applications of airborne LiDAR in Polynesia were in the North Kohala District of Hawai‘i Island and were aimed at creating detailed maps of surface architecture over large study areas (Figure 5; [42,43,44], see also [45]). These are landscapes where field surveys had made progress recording features but the sheer size and high density of targets proved impossible to record completely through primary fieldwork. LiDAR derived datasets allowed for the quantification of agricultural development to a degree that would have not been possible otherwise and helped refine models of the evolution of the larger political economy as it related to food surplus.
New applications of airborne LiDAR in the islands of Tonga [45] and Sāmoa [46] and have made advances in the identification of features through automated or semi-automated feature extraction [45], and the documentation of full archaeological landscapes [46]. In Sāmoa, a range of features were mapped; habitation terraces, agriculture, and monuments. In Tonga, most mapping focused on burial mounds, with other studies on a large earthwork hillfort and monumental complex on coast. While these projects were not designed with climate change in mind their results may prove especially useful for future planning.
To date, we have only seen one application of airborne LiDAR focused on the impacts of sea level rise on the archaeological record of Polynesia (Figure 6) [19]. Johnson et al. [19] began by the impacts of higher than usual coastal surges up to 1 m above current sea level following the 2011 tsunami off Honshu, Japan. The study focused on the site of the political and religious center at Hōnaunau, Hawai‘i Island. Using LiDAR provided by FEMA [47], they modeled different scenarios of the impacts of sea level rise up to 1.9 m above current levels and found that the spatially extensive impacts of the tsunami corresponded to different models of sea level rise in different portions of the coast—some 0.5–1.0 m and others closer to the 1.0–1.5 m models. They concluded that local bathymetry is important to predicting the impacts of extreme events. Further, because the islands of the Hawaiian chain are slowly rising or falling at different rates, the problem of predicting impacts is linked to good models of those rates.

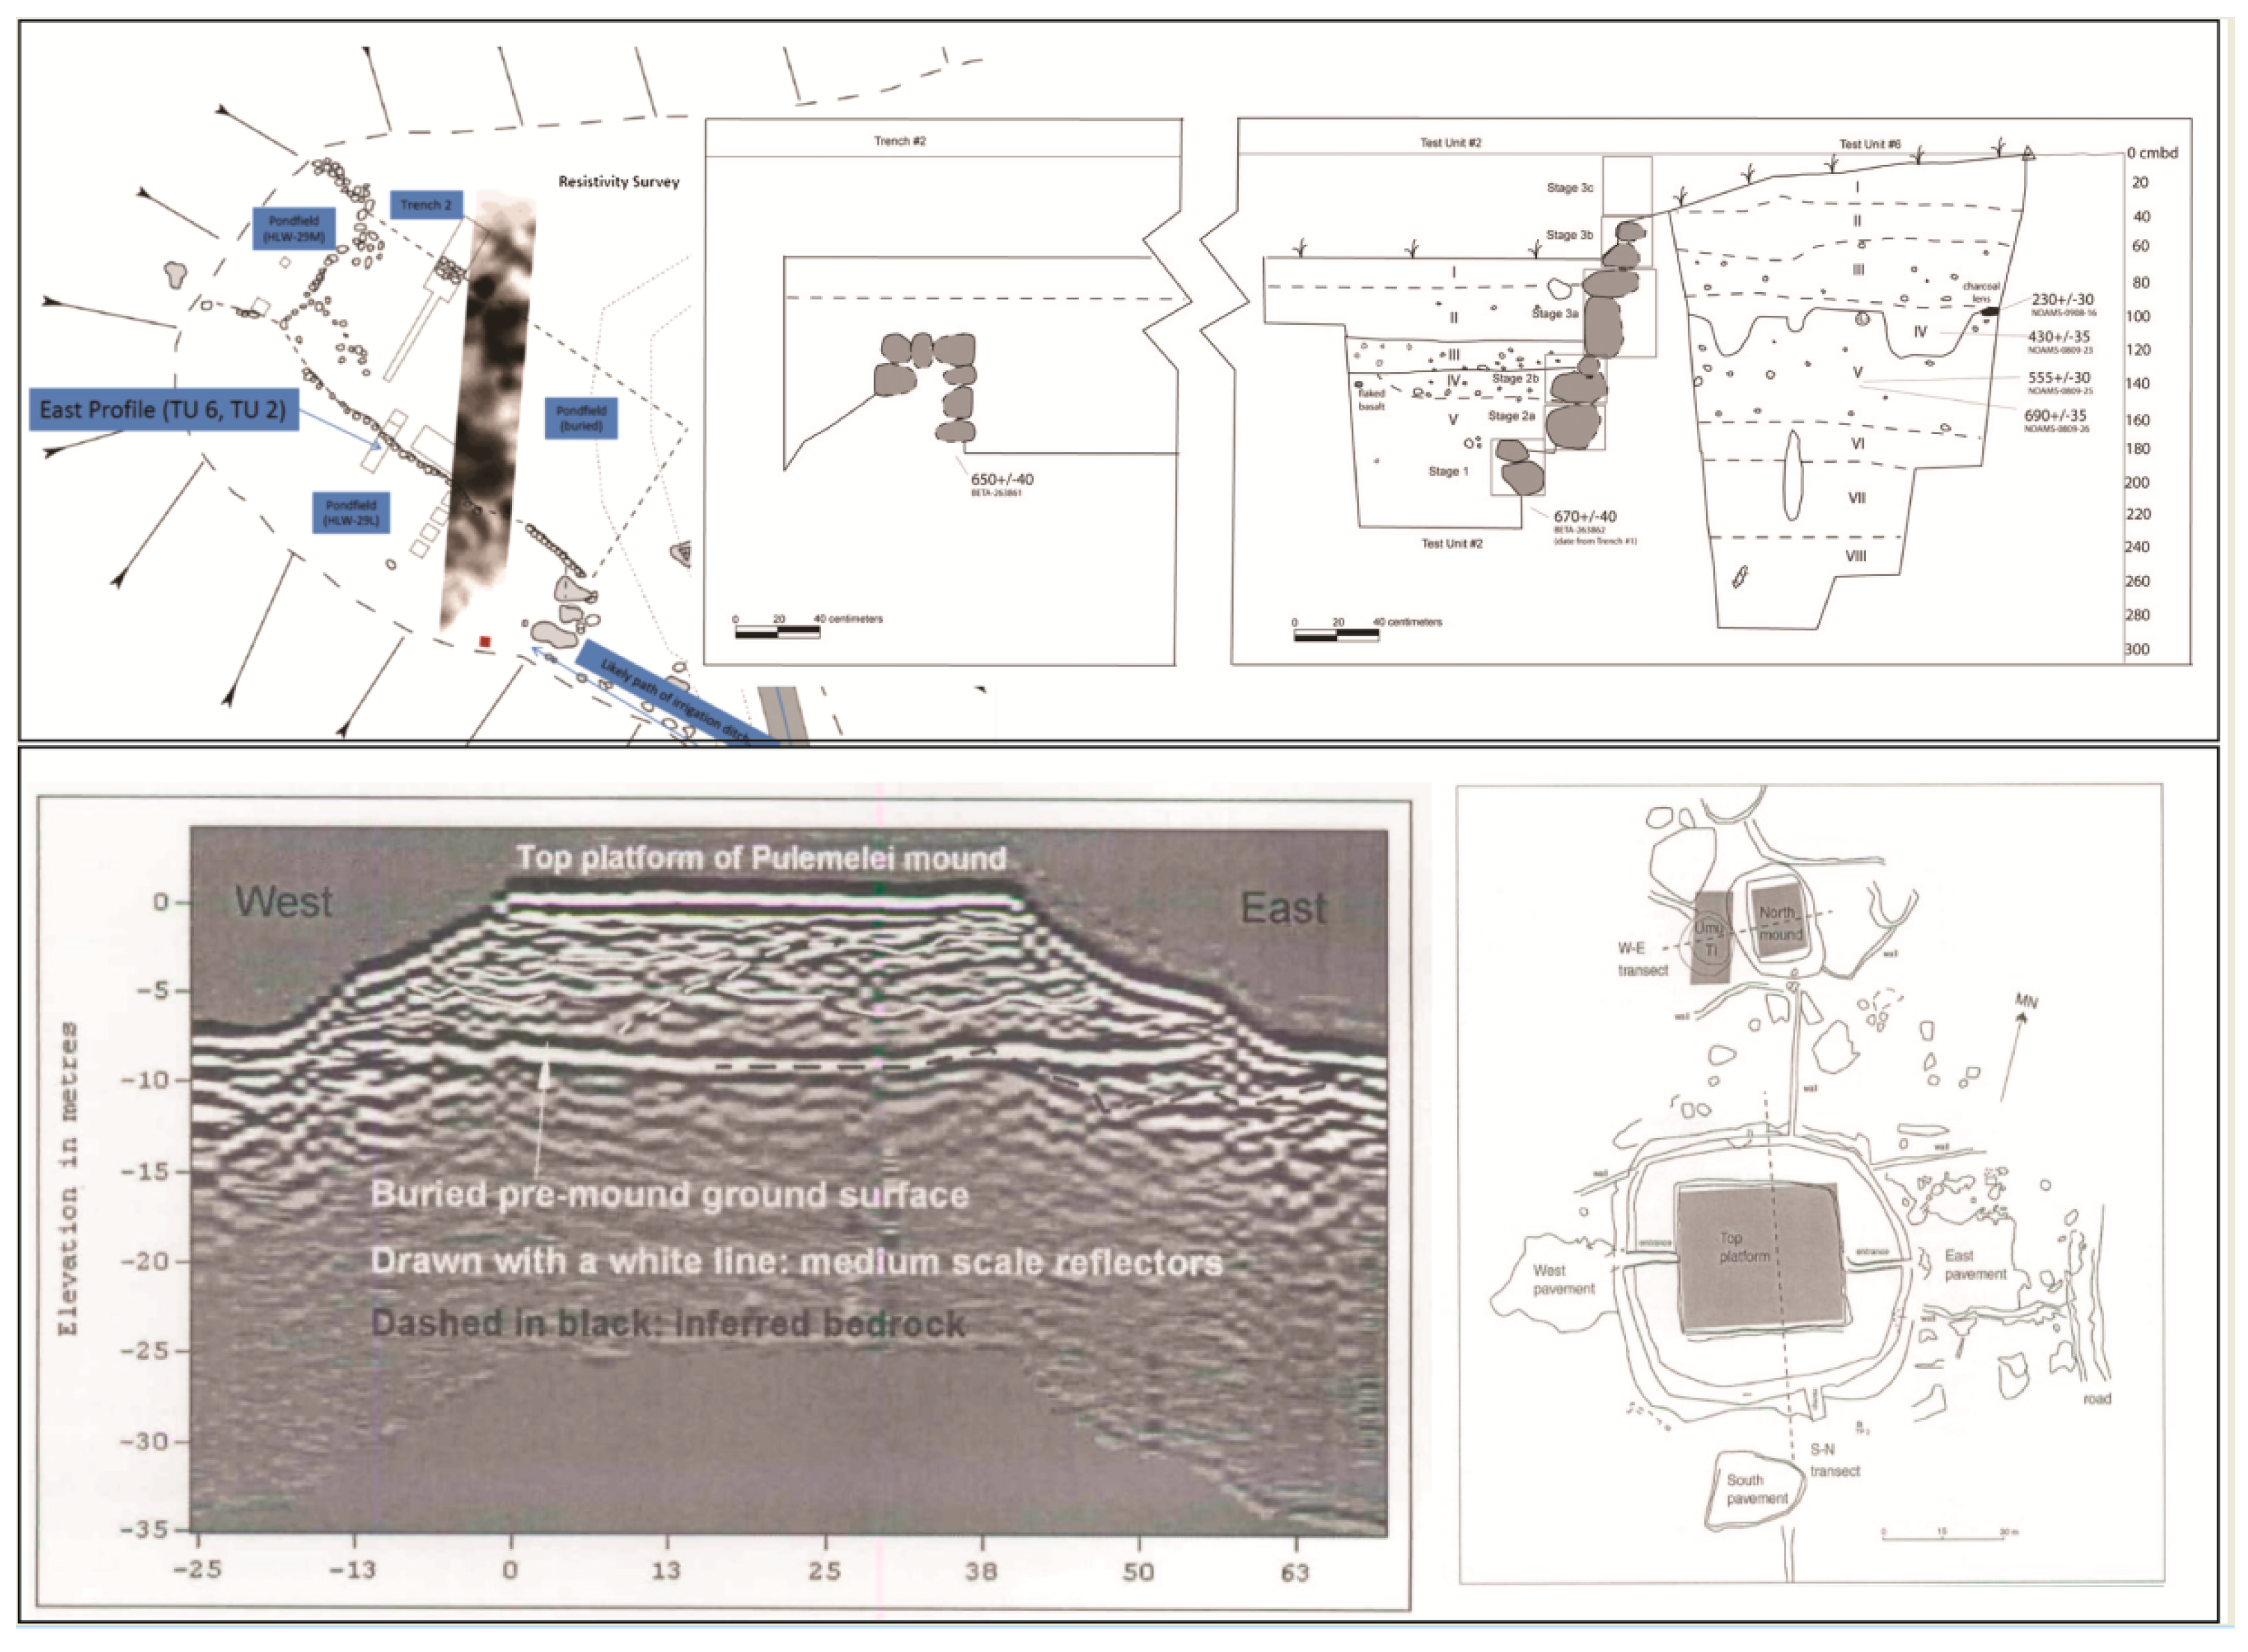
2.3. Geophysical Survey

The application of geophysical techniques to detect and map buried archaeological deposits and features is practiced all over the world. In the islands of the Pacific, there are two communities of practitioners, one in New Zealand (Figure 7) and the other spread over the rest of the region but mainly in Polynesia (Figure 8). Figure 7 shows how relatively large scale magnetometry survey was used to identify the layout of an early village site. Note that anomalies were test excavated to determine confidence levels on data interpretation. Figure 8 shows examples of how geophysical survey has been used to identify and excavate stone architecture to reveal its construction history.
Dialog about best practices [48,49] and broadly conceived tests of methods [50,51] are rare, but show a commitment to using the technology wisely. Geophysical survey is somewhat regularly used in contract archaeology, and also paired with academic excavations in Polynesia [52,53,54,55]. However, paring of excavation with geophysical survey is by no means always the case. Since geophysical survey is often used as a technique to learn more about an area that would be too culturally sensitive to excavate surveys are rarely validated through excavation. There is also a tendency to interpret results based on current surface architecture and/or historic maps without excavating to test interpretations.

2.4. Near-Shore Maritime Survey

Maritime environments require a different set of remote sensing tools and direct survey is considerably more logistically difficult than on land. In the Hawaiian Islands, Van Tilburg [56] has noted that there are a remarkable number of examples of pre-European contact era sites in near-shore shallow water environments (Figure 9). These include temple sites (in Hawaiian called heiau) built on top of coral reefs, like the better-known site of Nan Madol in Micronesia, and fishponds defined by thick stone wall sea breaks. Sailors and Honda [57] used a suite of techniques to identify a portion of a former fishpond that is not visible, or barely visible, on air and satellite imagery. Underwater transects across coral reef environments off Oahu Island has shown greater than expected density of traditional fishing gear on the sea floor around areas of high biodiversity, suggesting these may have been favored as fishing spots in the past [58].

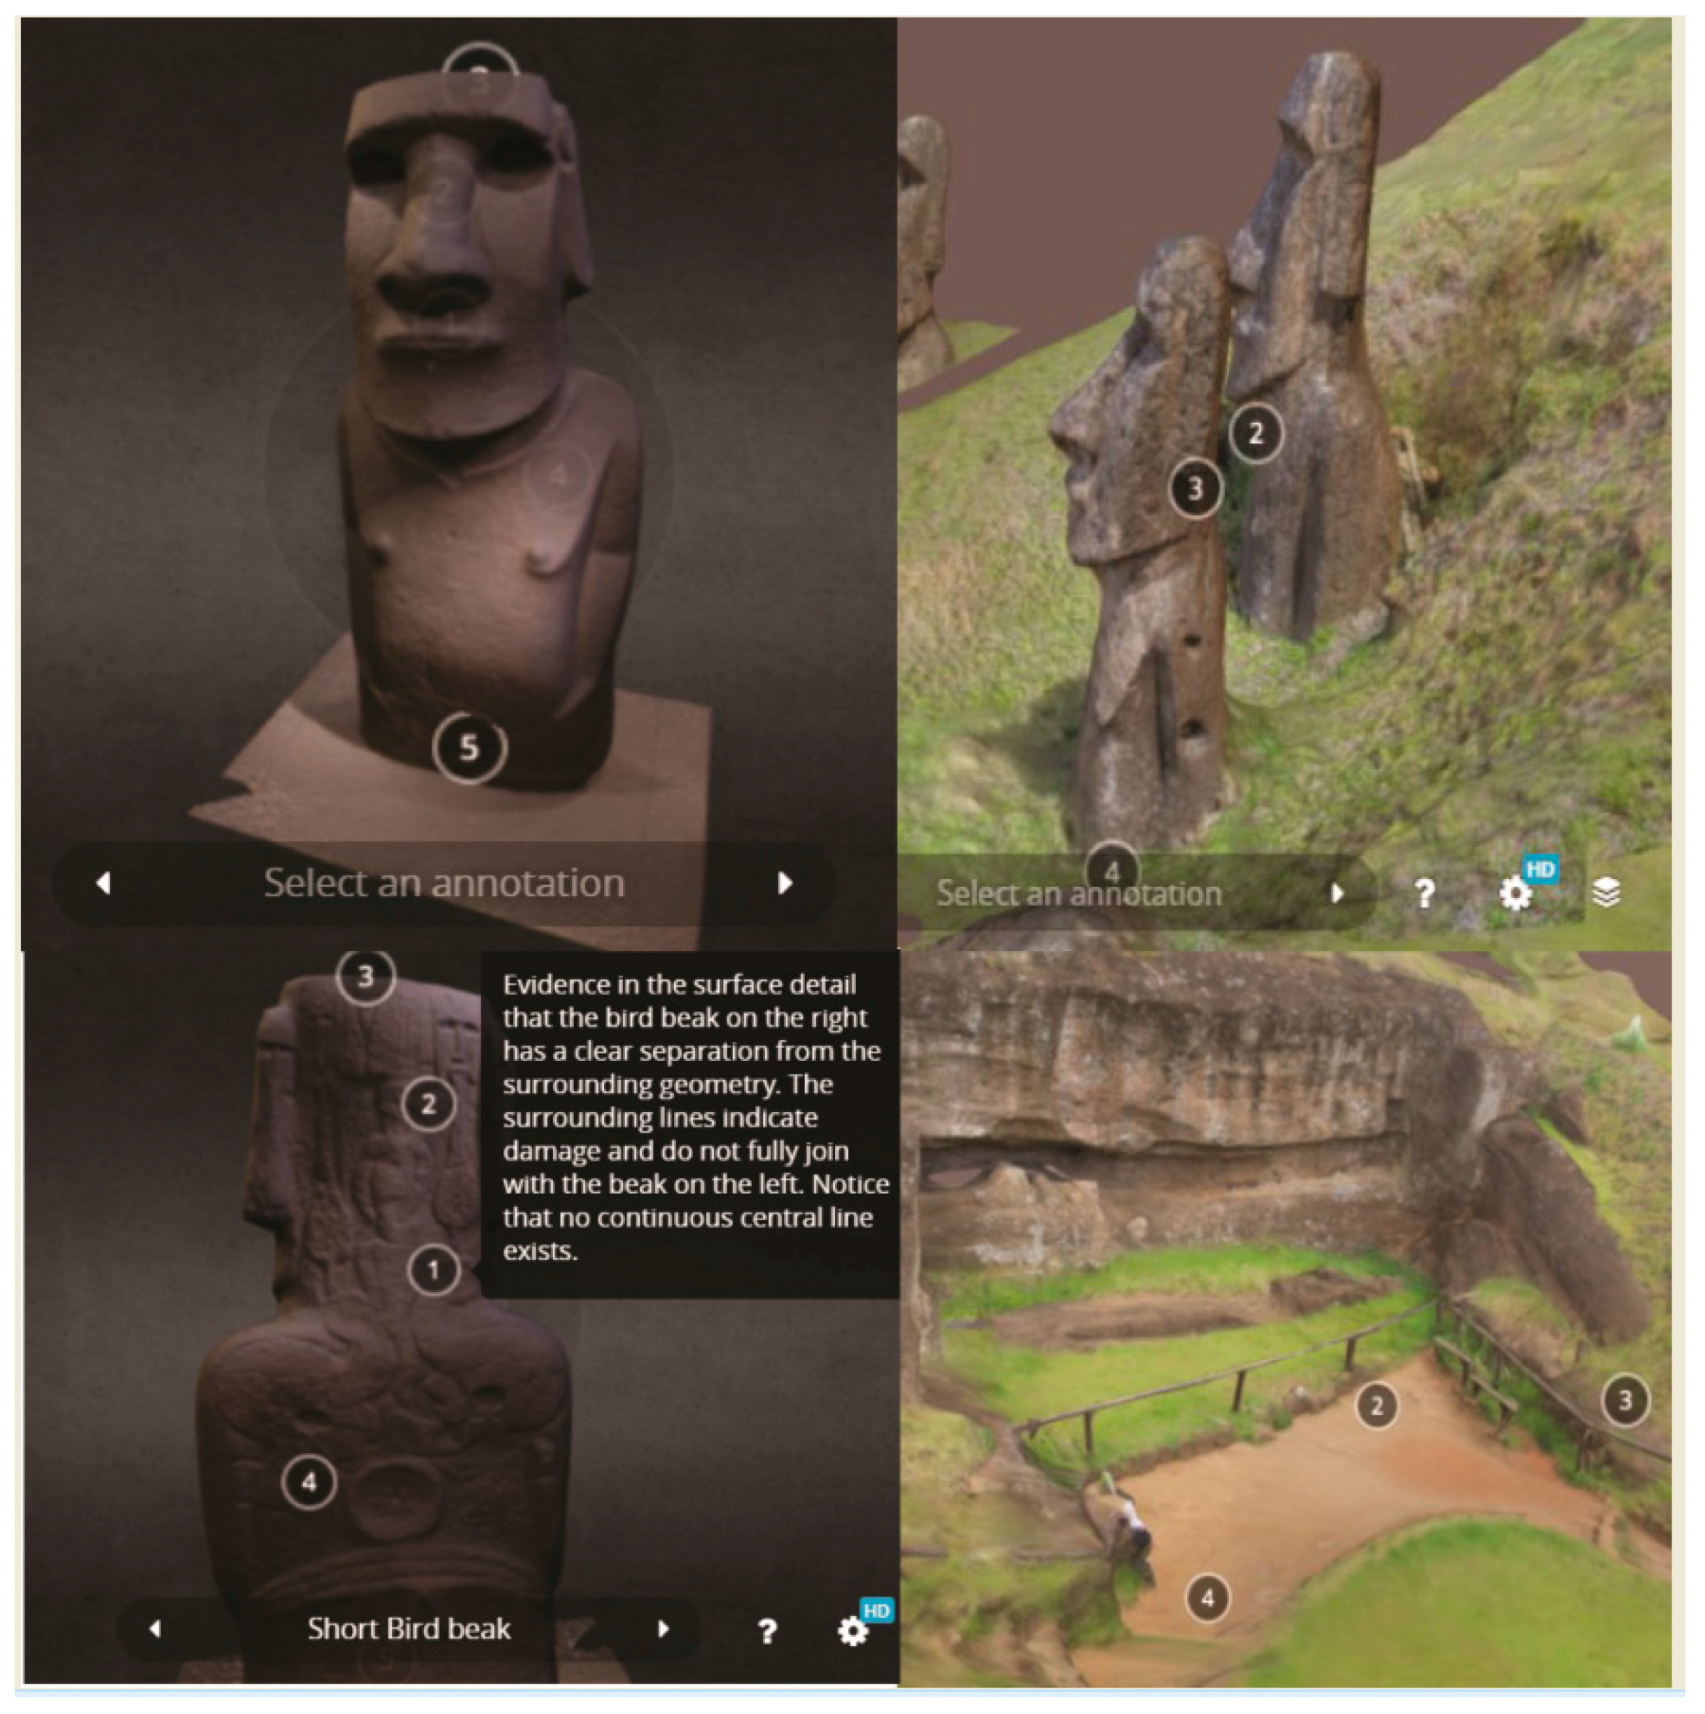
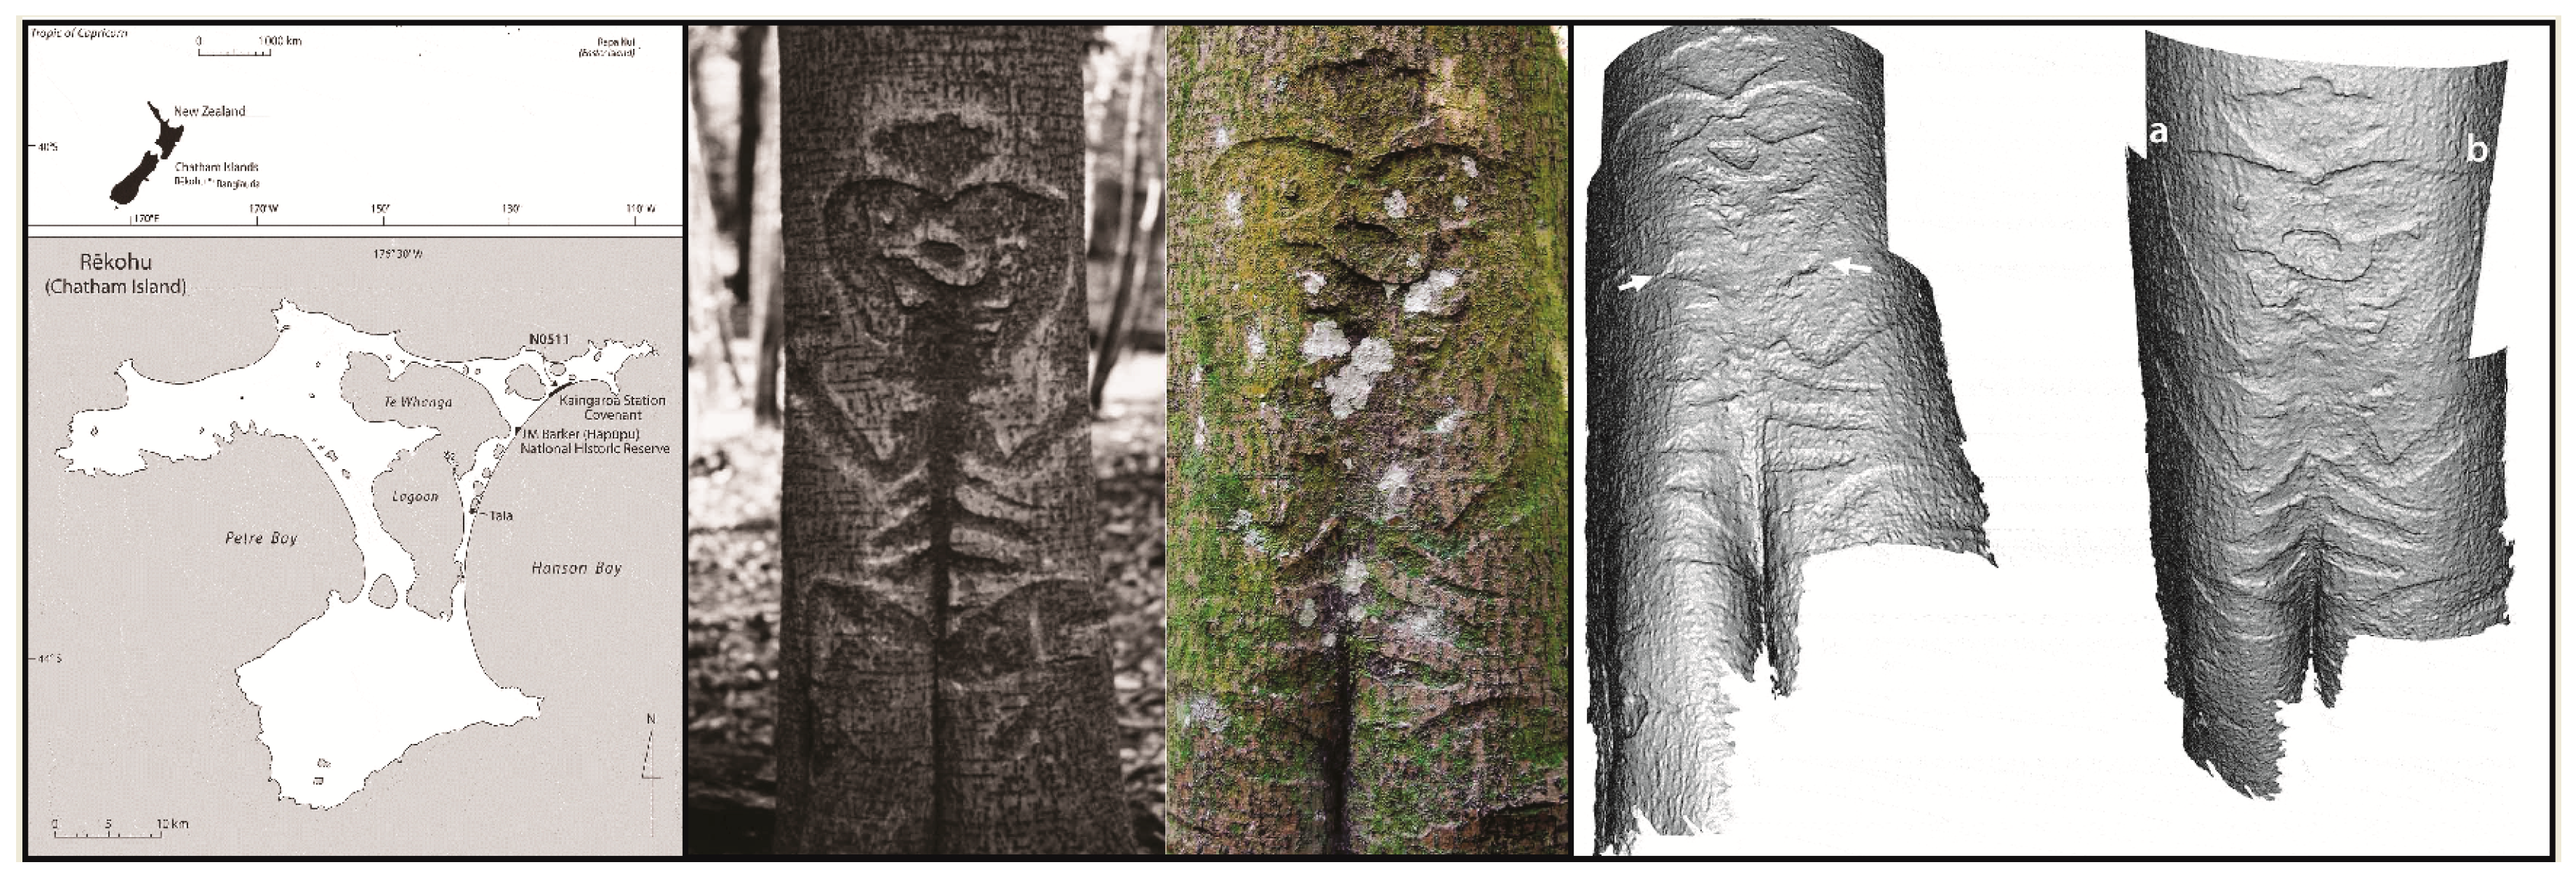
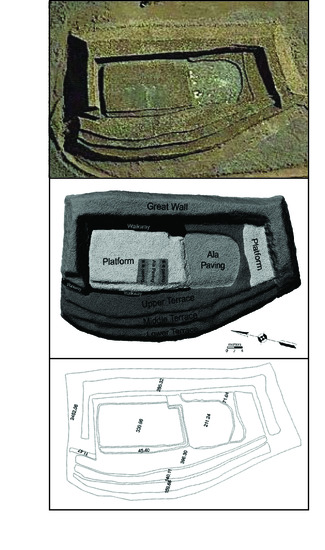
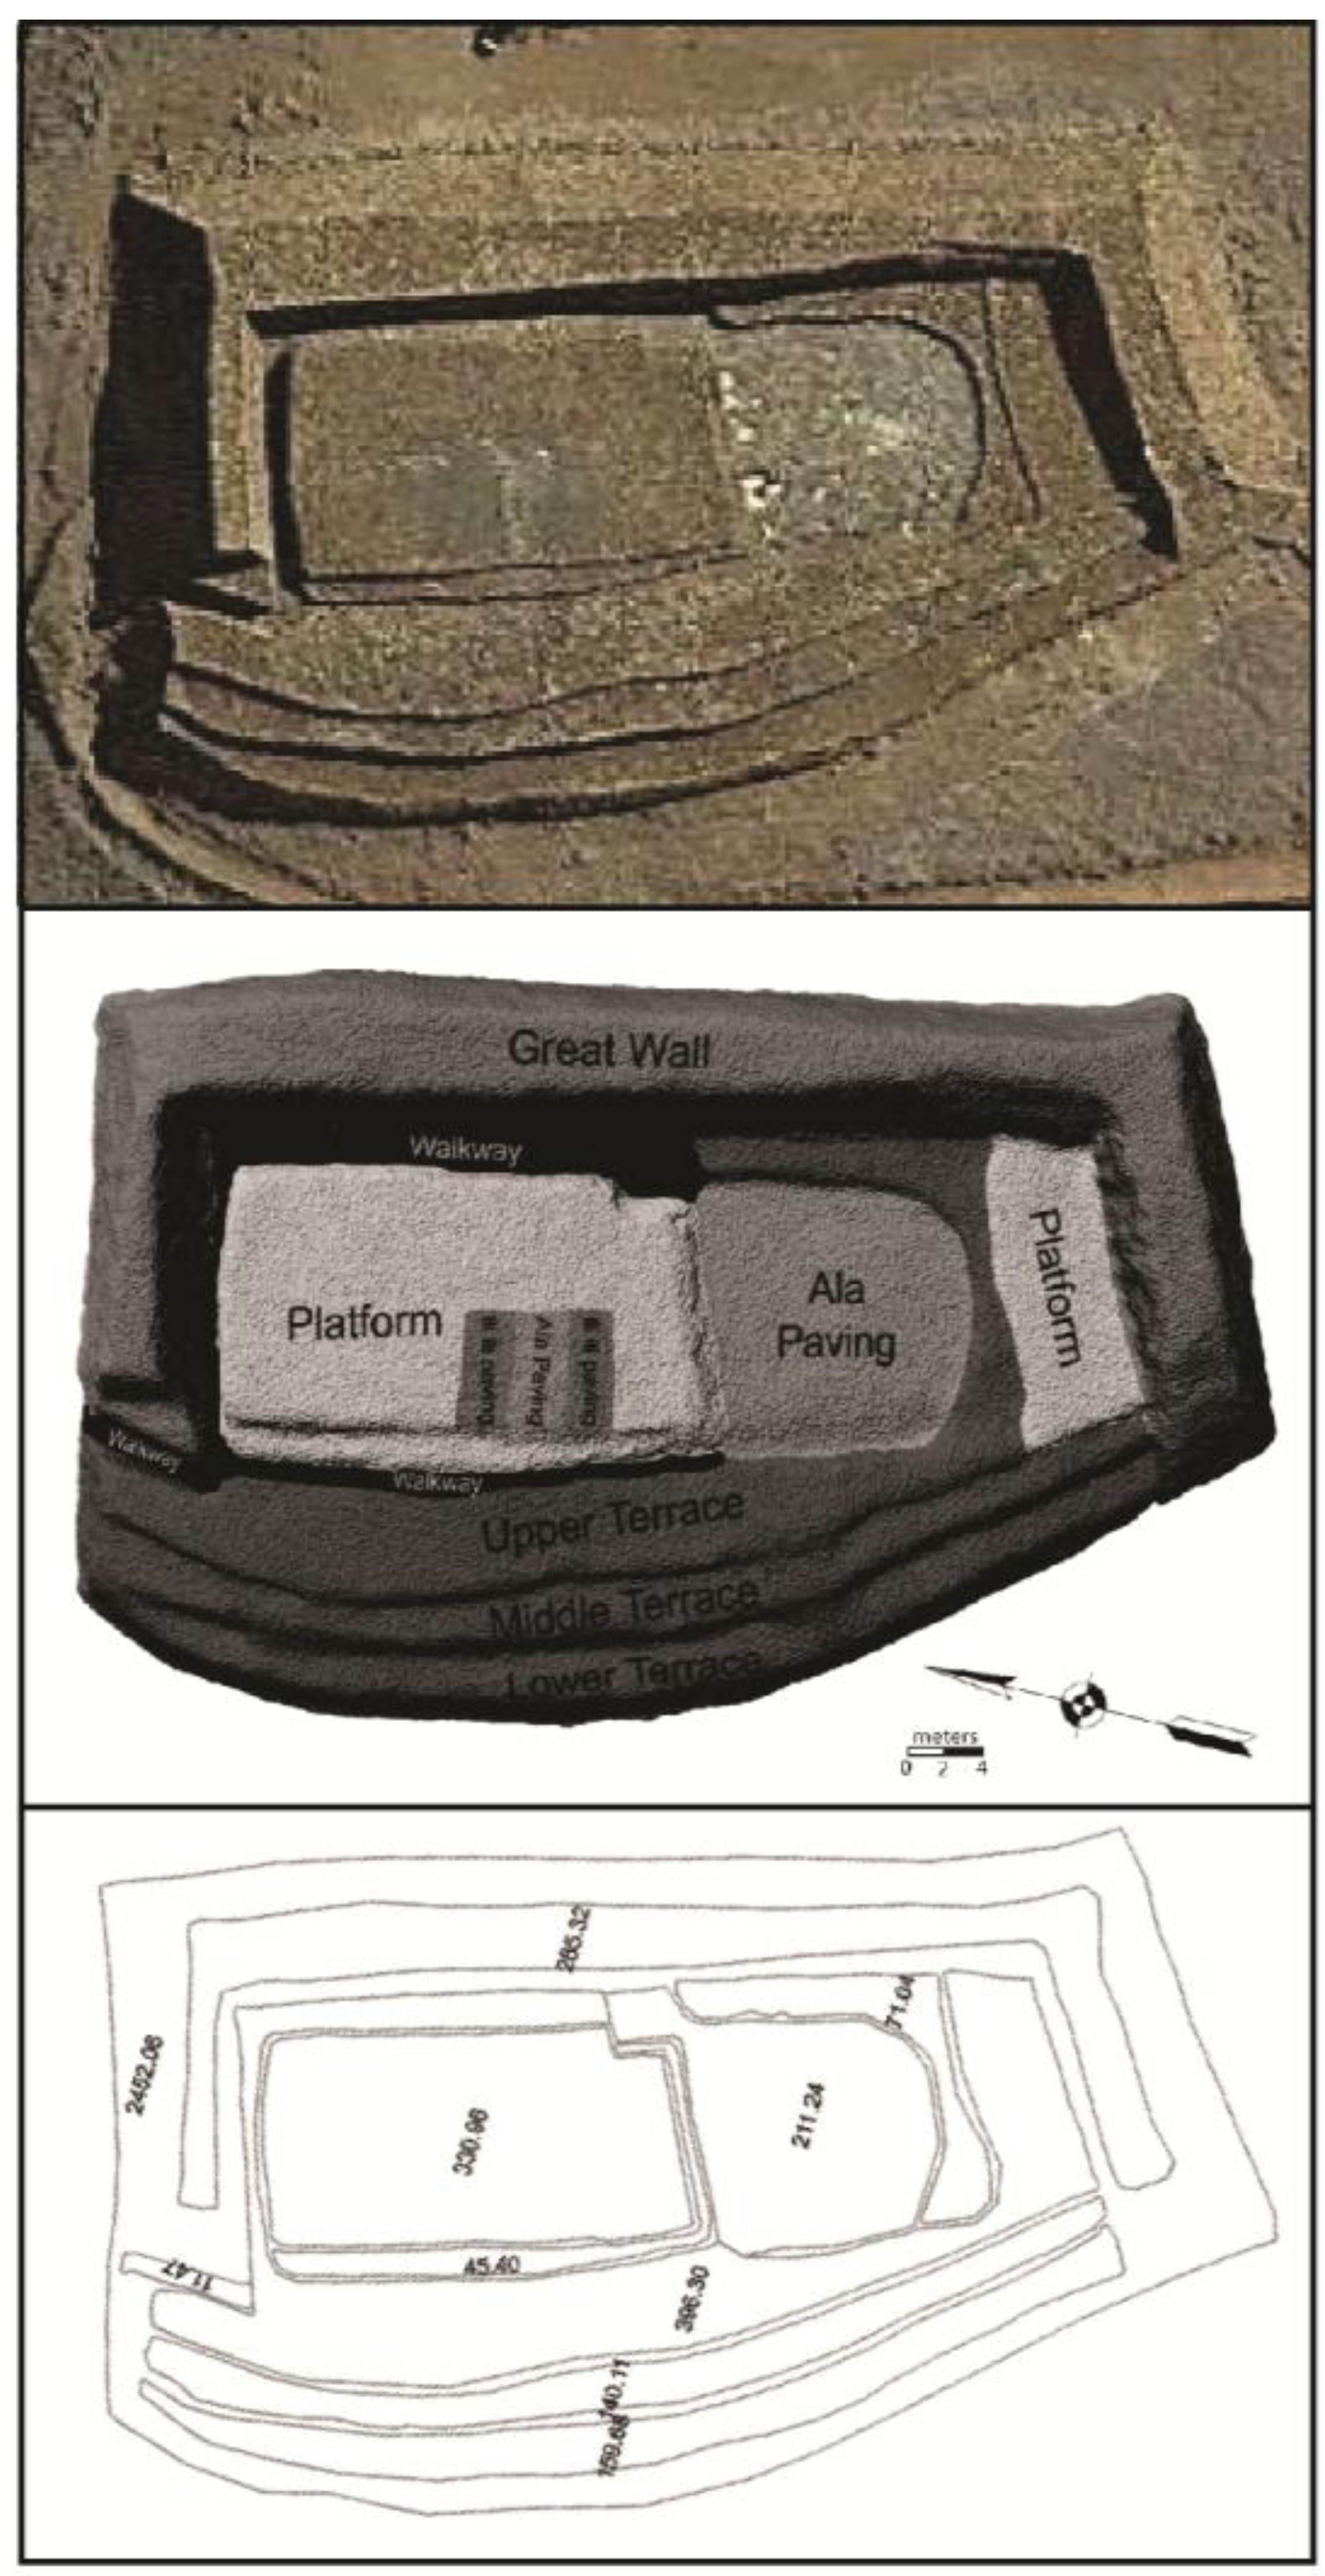
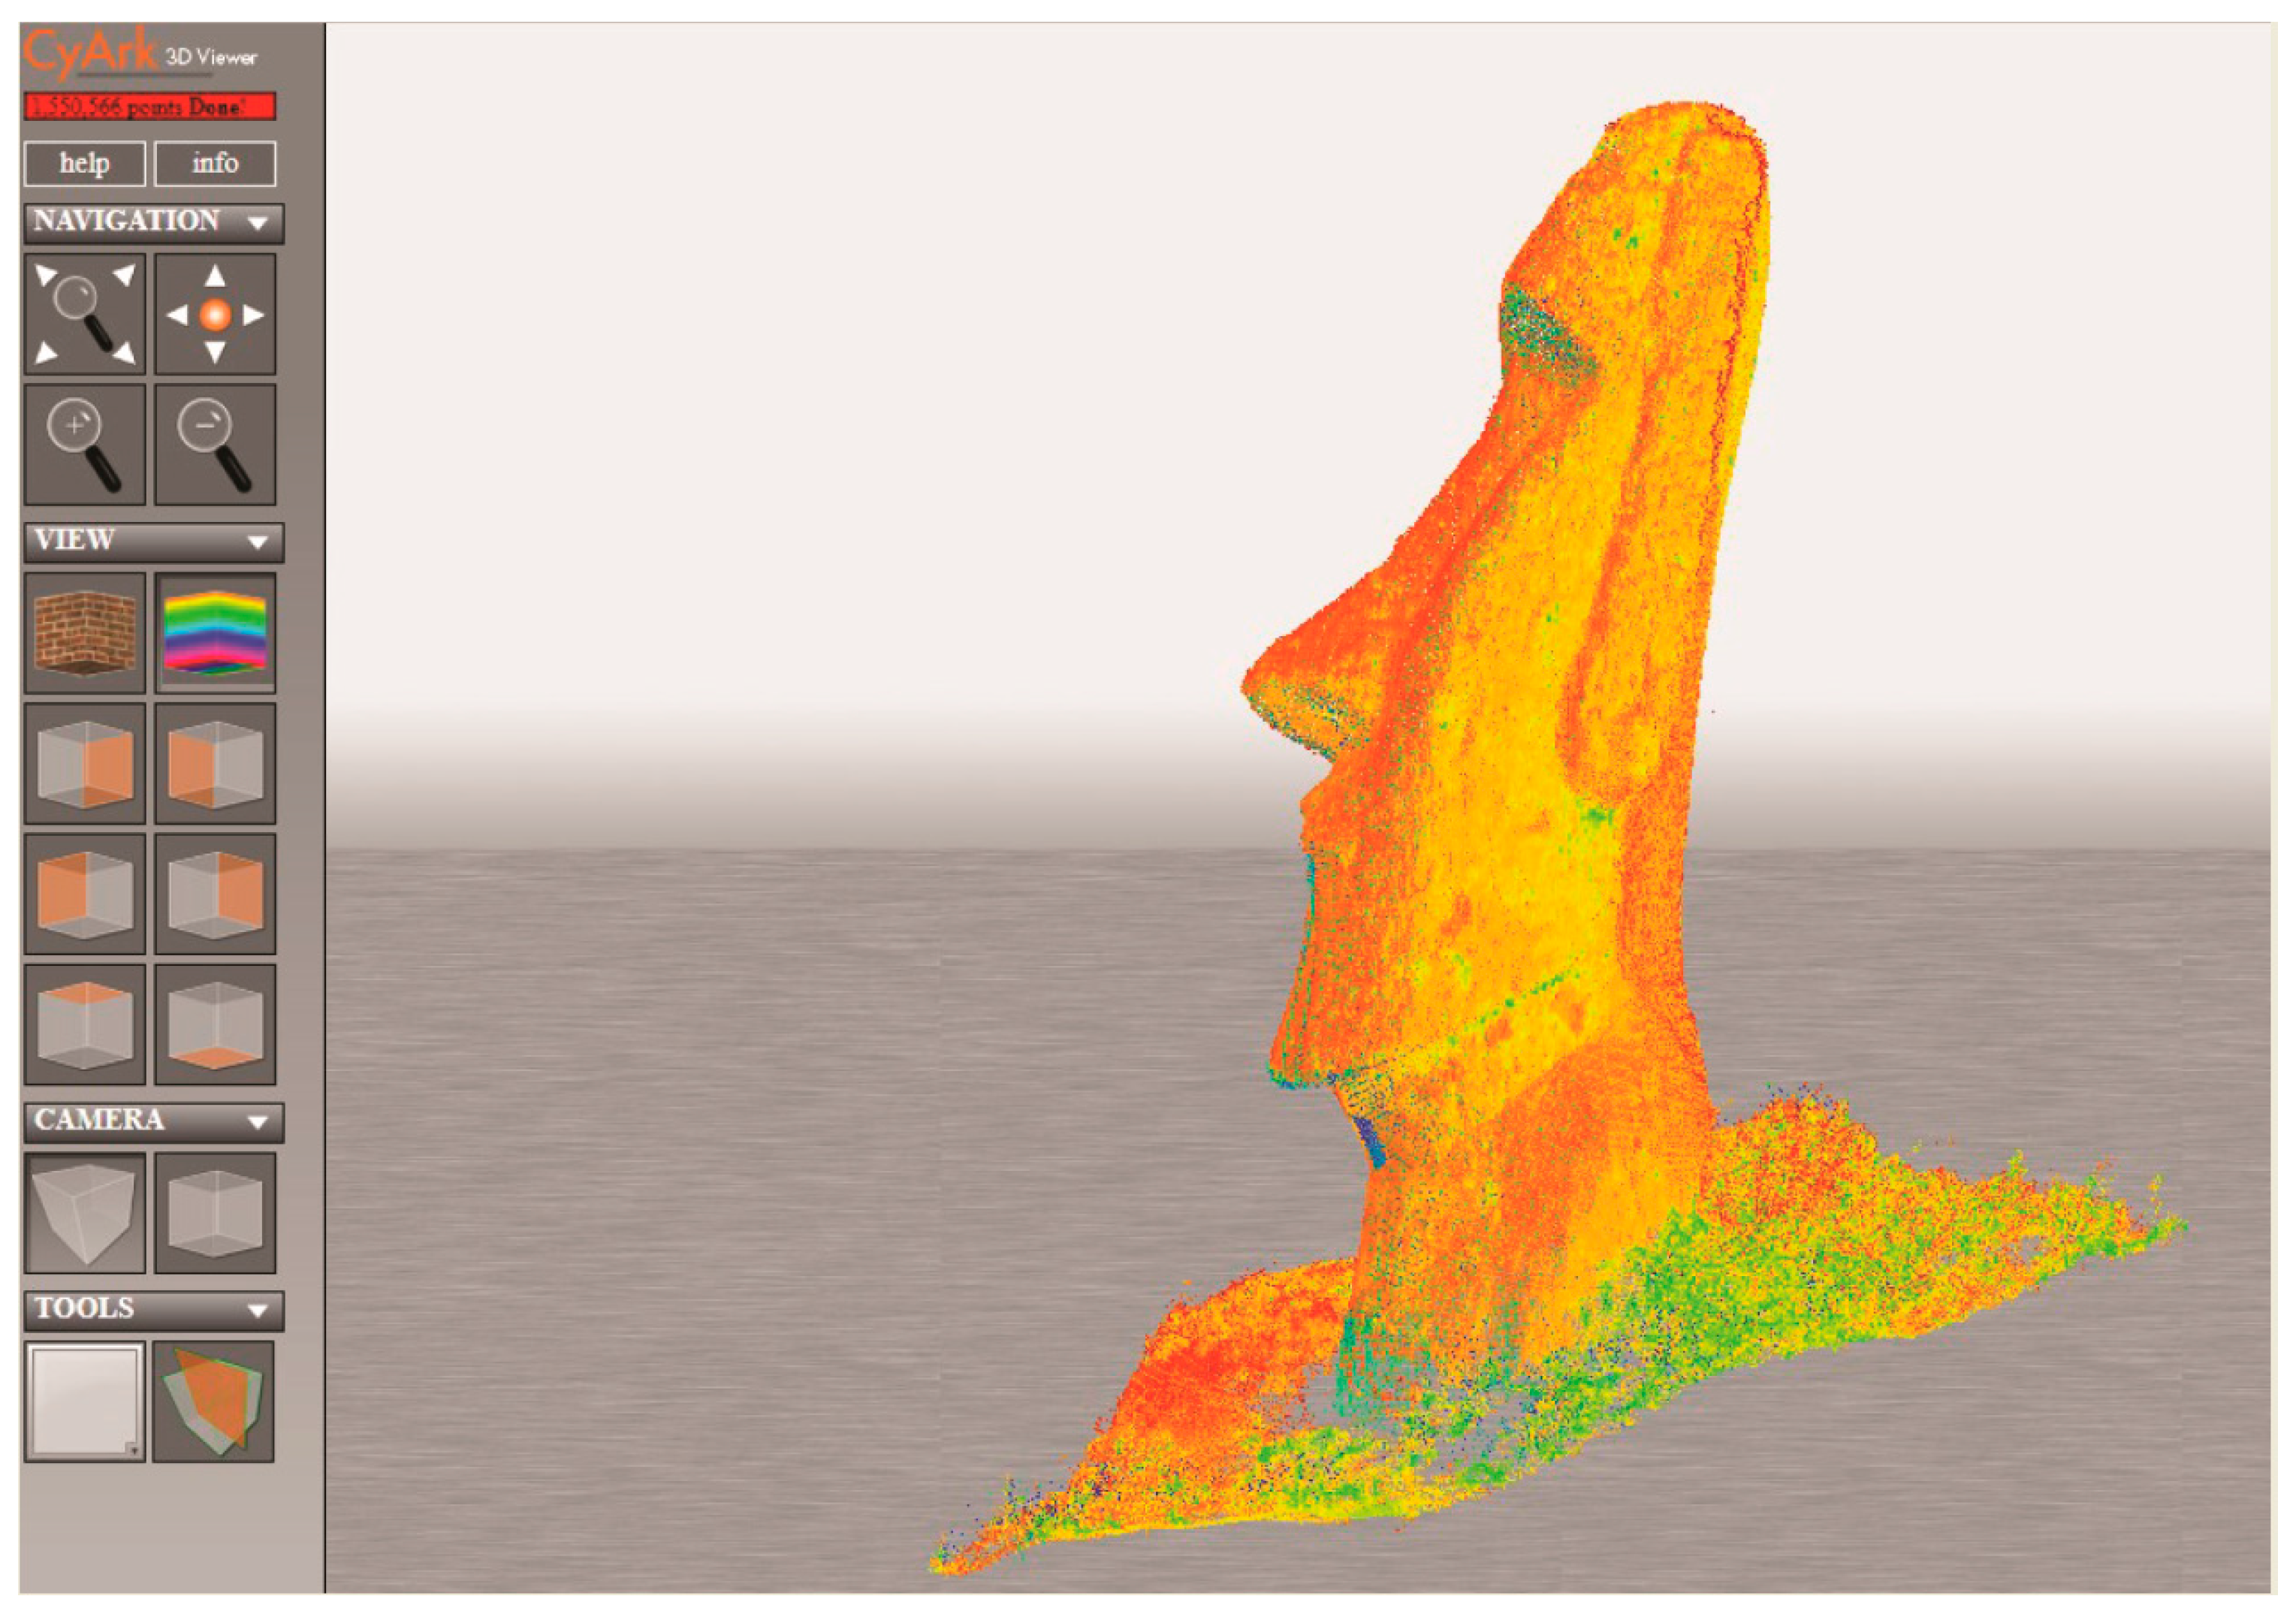
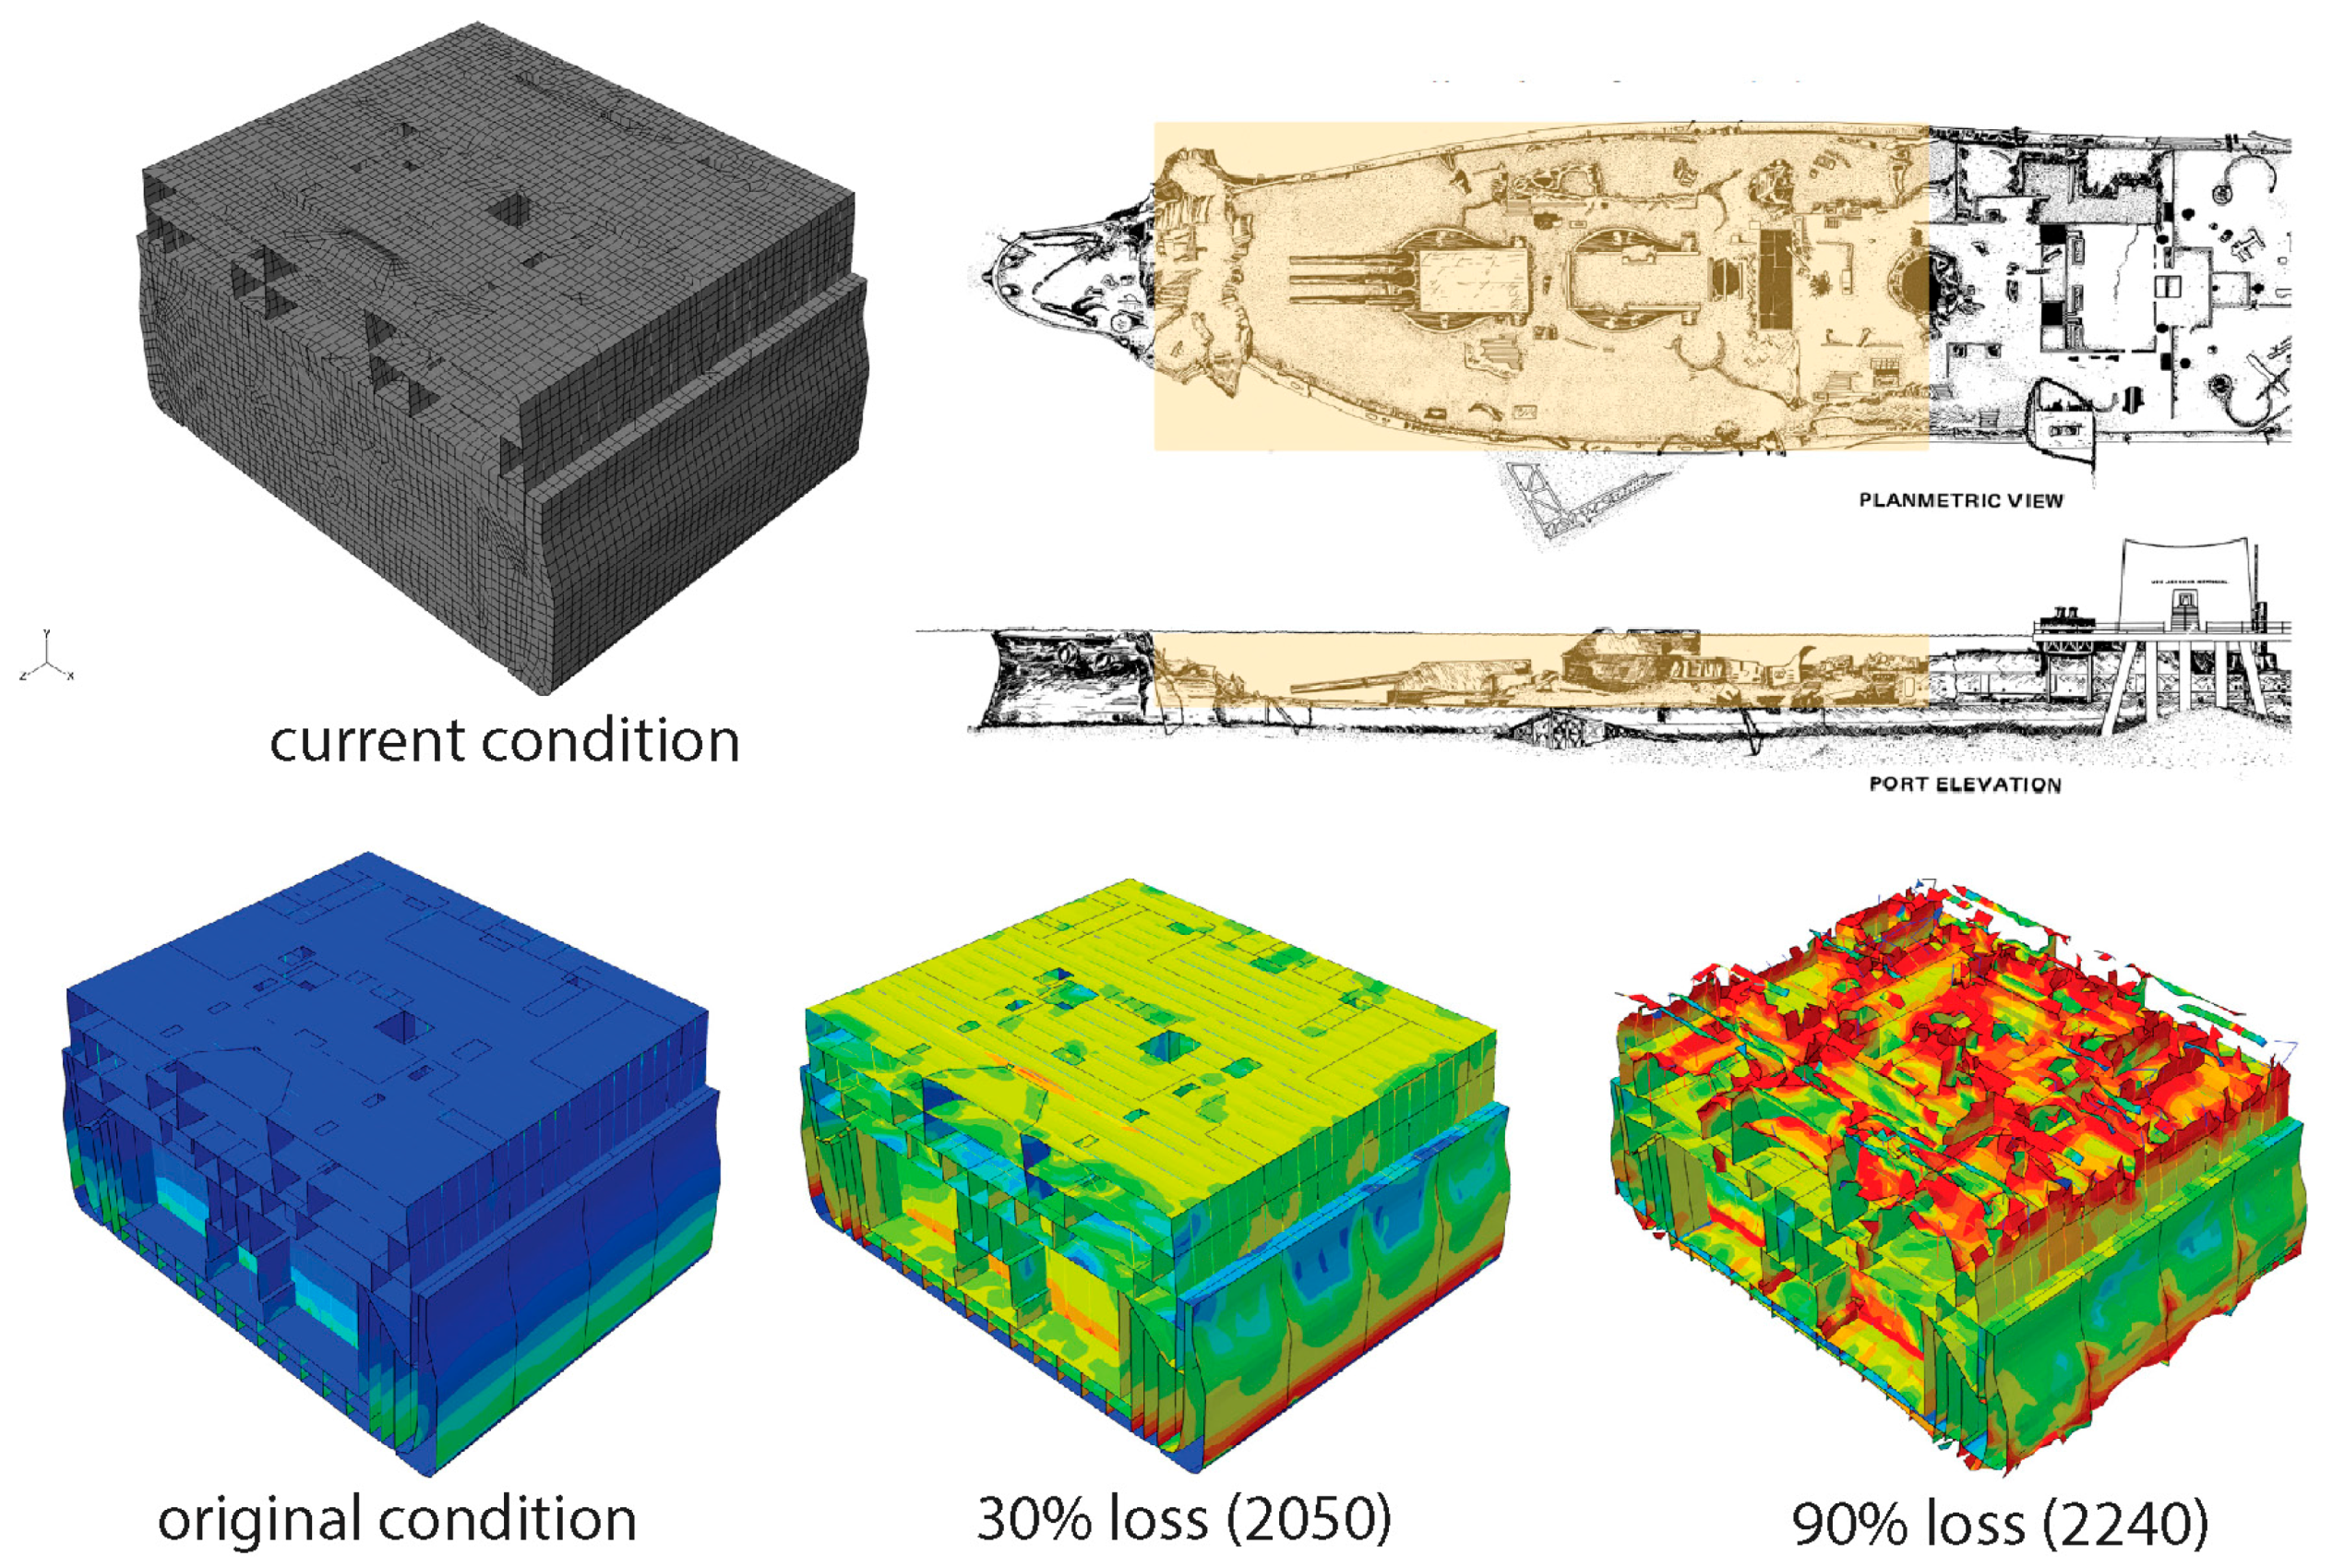
3. High-Resolution Documentation

Archaeology has rapidly adopted a suite of methods to document sites, features, and objects with incredibly high resolution. Advances in the translation of digital photographs to 3D models through photogrammetry has allowed for detailed models of the famous moai statues—both in museums and on Rapa Nui (Easter Island). Examples can be seen as photorealistic meshes that can easily be annotated with interpretive text and accessed online (Figure 10).
One particularly challenging feature to document and preserve for archaeologists are the tree carvings of the Chatham Islands [59]. Known by the technical term dendroglyphs (tree images), these carvings are only located in a few coastal stands of trees (Figure 11). Barber et al. [59] used handheld 3D scanner to record dendroglyphs, technique that uses a different set of technology, one based on the time-of-flight of the laser, rather than on photogrammetry.
In Polynesia, terrestrial laser scanners (TLS) are being used more and more to create 3D models of the current state of the foundations of monumental structures. Mulrooney et al. [60] used a tripod-mounted TLS to collect millions of points that were then meshed together into architecturally discrete sections of the foundation of Pu‘ukohala Heiau (Figure 12). The volume of these sections, along with details in local history about the site’s construction history, were used to make labor estimates. More recently, earthquake damage to the site was followed by a reconstruction that was carefully documented with TLS [61]. Similar TLS-based approached have been applied in other locations, including on moai statues (Figure 13).
One other application of high resolution documentation that shows real potential for cultural resource managers that look after WWII-era shipwrecks in their areas is the finite element model (FEM) of the battleship USS Arizona (Figure 14) [62]. Created by Foecke et al. [62], it is a “computer-manipulated mathematical model that calculates theoretical stresses and shape changes in a structure under load using experimental variables based on observationally-derived data.” It uses the building specifications of the ship, current condition, and engineering software, to predict exactly where and how degradation will occur in the future.

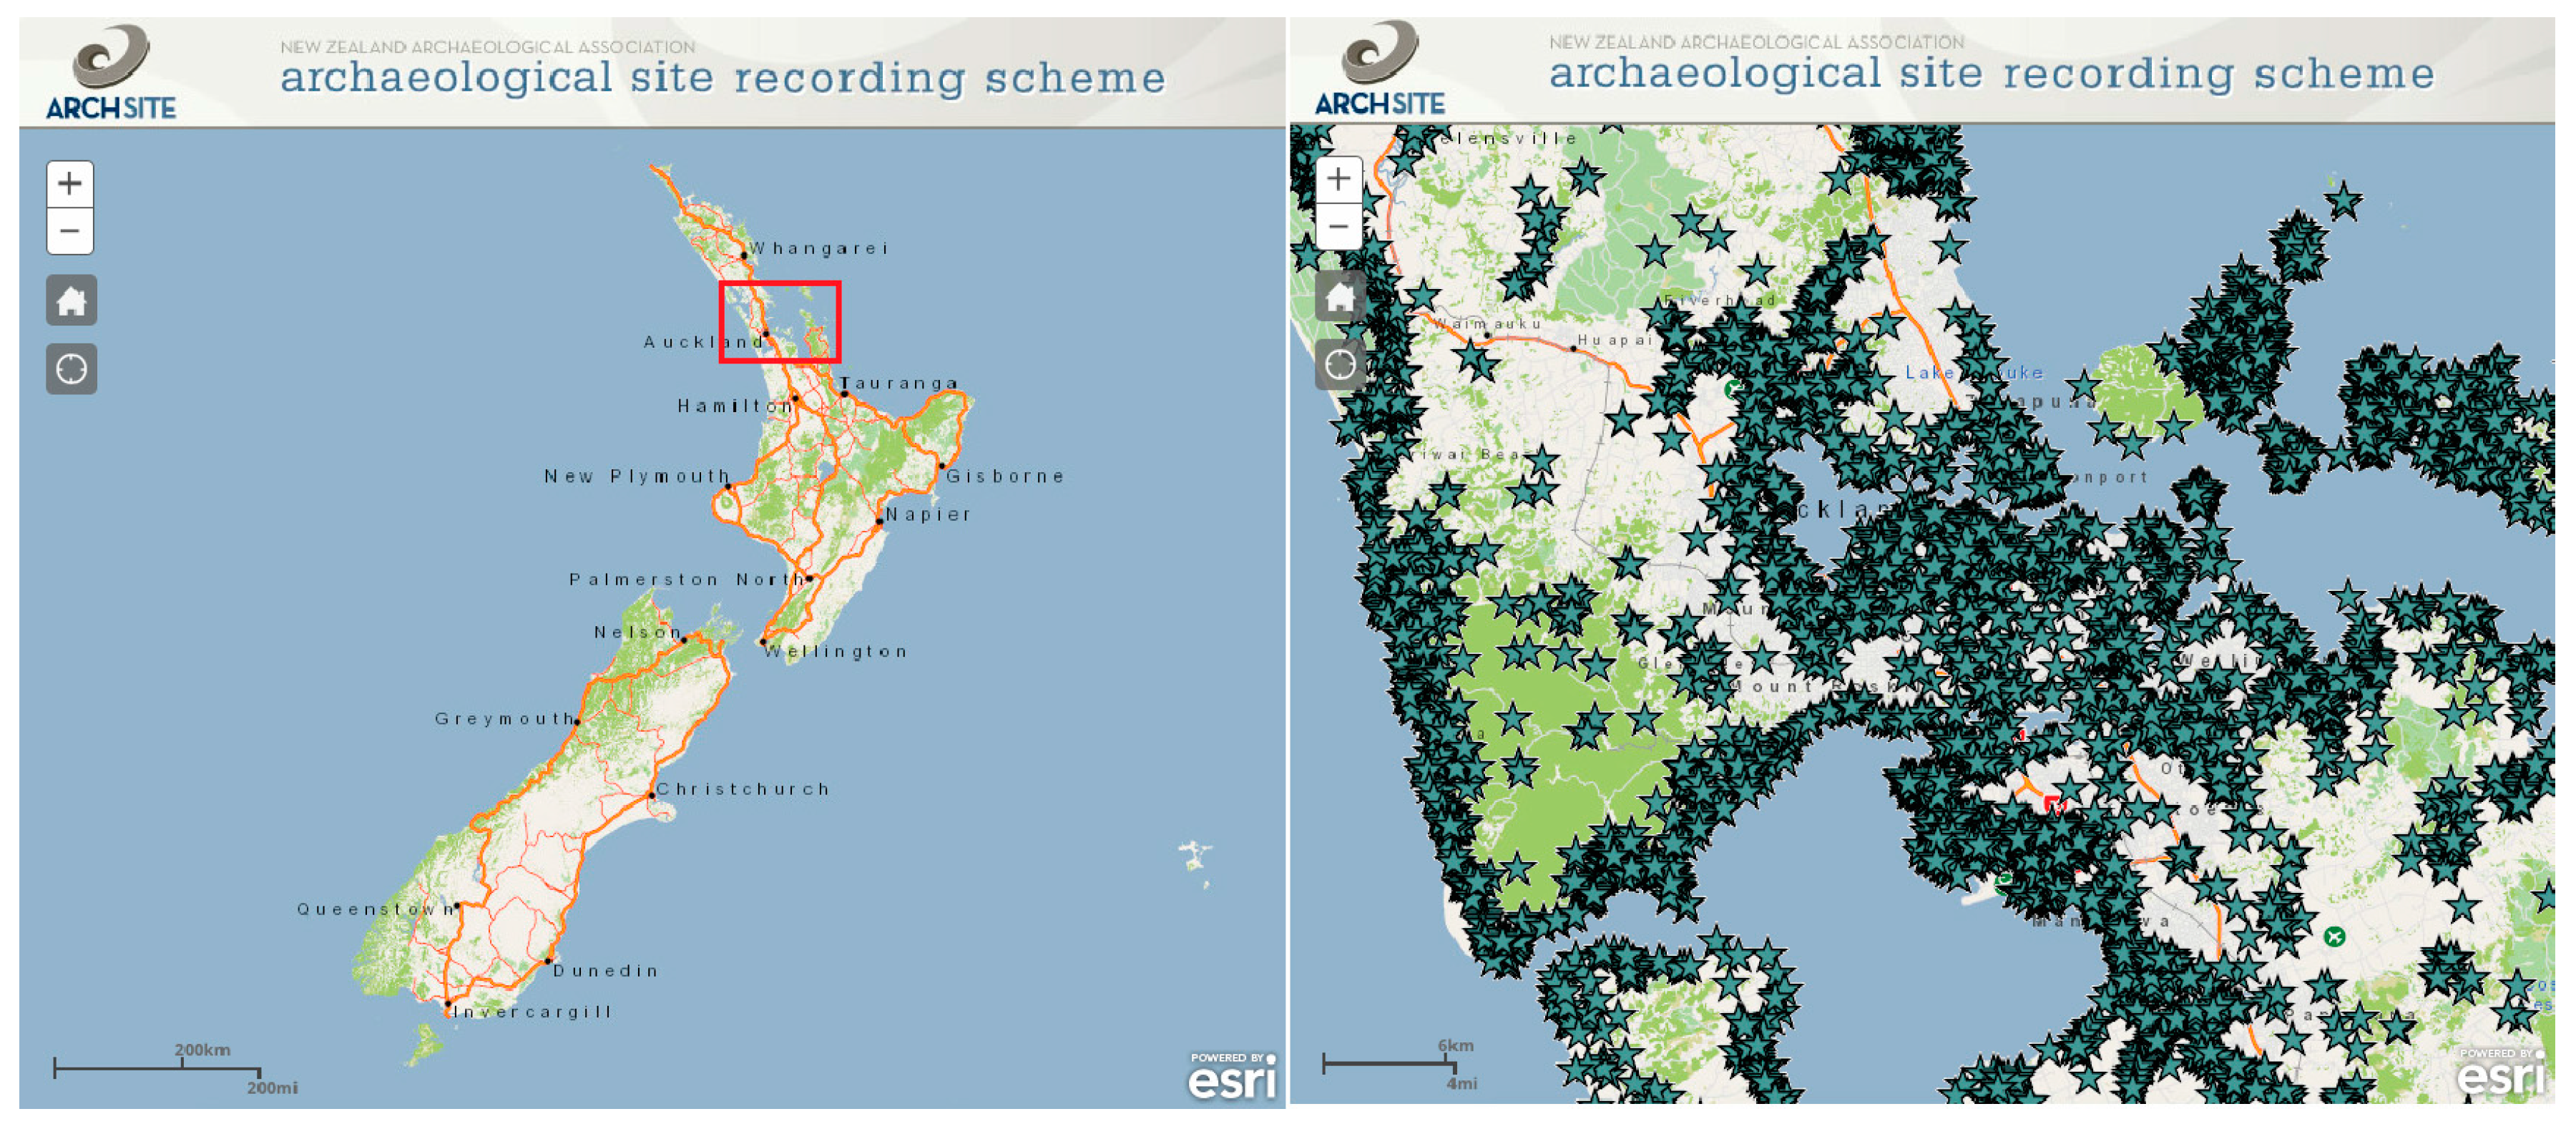
4. Archaeological Site Geodatabases

One of the fundamental tools available for working toward mitigating the impacts of climate change on cultural resources are archaeological site geodatabases. In practice, there are a number of different types of these geodatabases, including data repositories, locational indexes, radiocarbon databases, project websites, and academic sources [41]. Government and private cultural resource management geodatabases tend to be the least accessible due to the sometimes sensitive nature of locational data. There are few academic geodatabases for the Pacific like the Rapa Nui Archaeological Database, which has archived versions of select data from past projects.
In the Pacific, the largest archaeological site geodatabase is maintained by the New Zealand Archaeological Association and is called ArchSite (archsite.org.nz) (Figure 15). It is an integrative web hosted site database that has a public viewer and a private logon for professionals. The public face of ArchSite does not allow visitors to zoom in to a level that would allow them to navigate sites, and only the NZAA site number is listed. It has migrated from a paper-based recording system where site locations were represented by coordinates (centers of sites) estimated within 100 m error. A major upgrade to the database in recent years has meant that a portion of the site locations are now established by GPS. At present, it includes 68,753 sites [63].
The data model used by ArchSite—points representing sites with a wide range of sizes, ages, and components—is common to archaeology because it allows us to index previously recorded data and communicate our results to others. One of the major disadvantages of points-as-sites is they can be misleading at different scales. For example, at the scale of the entire country, ArchSite appears to be a complete physical survey of New Zealand. But, it is clear that the professional database, while far more complete than other representations of sites, there are also locations that have not been surveyed (un-surveyed locations shown in Figure 16). At a much closer scale, we find something that is more important to planning for sea level rise—many sites are so close to the coast that they plot just off shore.
With the caveat that ArchSite represents our best current database of sites, and that site locations represented as points have known inherent issues, I wanted to determine how many were likely at risk for damage given projected global sea level rise. Following Anderson et al. [16], sites were classified by elevation above current sea level (Table 1). In total, 9430 sites, or 14% of all sites, are within 5 m of current sea level, with the greatest proportion plotting at, or below, sea level today (Figure 17). If sea level rise is more-or-less constant, then this result suggests the most rapid impacts will be in the immediate future, followed by a steady rate of loss. Two areas that will be especially hard hit by sea level rise are the northern half of the North Island, and the northern half of the South Island. Figure 18 shows the distribution of sites in these areas. It would appear that the shallow harbors and off-shore islands that were often targeted for intense settlement in the past are in the greatest danger.
To determine if the coarseness of the digital elevation model (DEM) used (25 m resolution) may be painting a far direr picture than is the case, I reevaluated a small sub-section around the city of Auckland, this time using an 8 m resolution DEM (LINZ). The average difference in estimated elevation between the two DEMs is +0.27 m (s.d. = 2.44, min = −18.97, max = +15.22); a small difference in most cases. The absolute difference between sites classified as less than 5 m above current sea level is minimal, n = 26 sites, or a less than 2% difference (25 m DEM, n = 357 out of n = 1567 below 5 m; 8 m DEM, n = 331 out of n = 1567). If we extrapolate out to the scale of the entire country, it may be that the initial estimate of ~14% of sites to be impacted is slightly high, and should be lowered to ~12%. More broadly, it is fair to say that more than 12% of known archaeological sites are likely to be impacted along with an unknown number of additional unrecorded coastal sites.
If we look more closely, the net change in classification is more informative than the absolute difference in the number of sites that might be impacted. In this case the net change is n = 66 sites. It is calculated by the number of sites initially classified as below 5 m asl that are re-classified as above (n = 46 sites), plus the number of sites that moved in the opposite direction (n = 22). In Figure 19, reclassification is broken down by elevation. The reclassification of the higher sites (3–5 m asl) accounts for a most of the net change (51 out of 66 sites) and is likely due to differences in DEM interpolation. The reclassification of sites near sea level is understandable in that even small differences in the DEM along the coast could shift the estimated elevation a great deal. In this case, it was about twice as likely to revise sites below the cut off.
While national scale DEM are largely consistent in estimates of archaeological site elevations, it is important to note that we should not expect this same degree of continuity with 1 m resolution airborne LiDAR–derived DEM data. For example, Figure 20 shows the location of a shell midden first recorded in 1996. This site’s record indicates a recent update to correct its coordinates and describes it as, “eroding out of a section and trampled by public walkers.” It was initially estimated to have an elevation of 0.0 m asl (25 m DEM), then an elevation of 1.2 m asl (8 m DEM). In both estimates, the site would have correctly been identified as among those currently, or in the immediate future, to be impacted by sea level rise. The LiDAR derived 1 m DEM shows elevation values around the point at the center of the site are 3.35 to 3.85 m asl, values that could be misleading if not looked at in a more fine-grained site-specific analysis.

5. Discussion

Recent applications of geospatial technology in the archaeology of Polynesia, while rarely explicitly concerned with the problem of future sea level rise, highlight a number of tools for identifying, documenting, and preserving coastal and marine archaeological sites. The comparison of remote sensing via air photography and satellite imagery shows an enormous potential to classify coastal erosion with specificity in terms of both location and degree of severity. For example, in one study from small atolls in the Western Pacific [64], imagery from the end of World War II and much more recent imagery were used to calculate an estimated loss of total sandy beach area weighted to account for the inconsistent timing of when images were flown. The use of large-scale digital elevation models combined with archaeological site geodatabases is also useful at identifying “hot spots” on different scales.
Looking forward, coastal airborne LiDAR surveys offer an even greater degree of accuracy and precision, and will be especially useful when—like air images—we will have LiDAR from across a number of years to quantify coastal change over time. Johnson et al.’s [19] study employed coastal LiDAR to show that the serge from a tsunami did not fit the generalized model for sea level rise in that it had uneven effects linked to local conditions. At this stage, it is unclear how high-energy storms (e.g., typhoons), which we are likely to see more of as a consequence of climate change and that will be far more difficult to predict, will change how we approach identifying sites in danger.
Archaeology continues to come to terms with the overwhelmingly massive scale of the problem of sea level rise [1]. Geospatial technologies like geophysical survey and terrestrial laser scanning, ideally speaking, offer a partial solution by allowing for rapid survey without the time-consuming task of large full-scale excavations. Those that are non-destructive or minimally destructive also have the considerable advantage of being techniques that can potentially be used in culturally sensitive locations and can be repeated to monitor the condition sites. However, recent applications of geospatial technology highlight several problems for the efforts to document and preserve sites in addition to the sheer size of the task. For example, while we have developed guidelines for best practices in using techniques like geophysical survey, including advice specific to island environments [50], there continues to be no centralized for data [65], making it impossible to work cumulatively, or compare results. The points-as-sites data model solves this indexing problem. However, with the exception of New Zealand, these databases are non-existent or inaccessible. This is especially problematic for low-lying islands that will be the first to be impacted.
One avenue that may prove useful in dealing with the large geographic scale of the impacts of sea level rise is the shift toward more regular use of distributive data models [66]. A recent study of Great Mercury Island, a small island off of New Zealand’s North Island, is a good example of an approach to field work and spatial analyses that takes a site-less survey approach [67]. Specifically, arbitrary units of observation (25 × 25 m) were used to create an inventory of evidence visible on the ground surface, with the explicit acknowledgement that these represent a palimpsest of centuries of activity. It is not difficult to imagine how a similar approach could be used to aid in both rapid documentation and evidence-based decision making for coastal regions.
The use of volunteer networks of people to collect geographic information on archaeological sites has generally been under used in Polynesia. This is understandable, given potentially intractable issues of land access, site preservation through the deliberate withholding of locational information, and concern about the quality of the information produced (e.g., [68]). One alternative is to consider how archaeology in public spaces might be better documented and monitored through volunteer information, as has been seen in places like Scotland (i.e., Scottish Coastal Archaeology and the Problem of Erosion, SCAPE, http://www.scharp.co.uk/).

6. Conclusions

For archaeology, there is a pressing need to stay ahead of the impacts of sea level rise and climate change. This makes it critical to effectively use geospatial technology now and in the future. In the islands of Polynesia, remote sensing is especially useful in identifying where coastal erosion will likely impact archaeological sites. A number of different tools have been used to document sites, including geophysical survey and terrestrial laser scanning. Nonetheless, the sheer scale of the problem will require a reorientation of academic research and cultural resource management. Here I used available data to estimate that more than 12% of recorded archaeological sites in New Zealand will likely to be impacted, a total more than 8250 sites, with about half of sites within 1 m of current sea level.
Based on this review, I want to highlight two general topics that, in my view, archaeologists need to explicitly consider both within Polynesia and elsewhere in future:
More and better data sharing. Today, we are grossly underutilizing the capacity of geospatial technology to make our research discoverable and accessible to other scholars. The tasks of identifying sites in danger and staying ahead of the problem of sea level rise will require archaeologists to find new ways to make our results useable beyond the original study.
Making the case for investigating coastal archaeological sites. Today, we are seeing more uses of geospatial technology to make it clear what the specific impacts of sea level rise will be on archaeological sites, but our geodatabases represent sites of all kinds and time periods and do not include the many archaeological sites that are currently unrecorded. It is especially important to use site inventory studies, like the one presented here, to make it clear to the public that to learn the true future impacts of sea level rise requires a great deal more investigation.

Acknowledgments

I wish to thank two anonymous reviewers for their helpful suggestions and the editors, Ashraf Dewan and Todd Robinson for their efforts on this special issue, and Thegn Ladefoged for discussions of remote sensing in Polynesia.

Conflicts of Interest

The author declares no conflicts of interest.

References

  1. Erlandson, J.M. Racing a Rising Tide: Global warming, rising seas, and the erosion of human history. J. Isl. Coast. Archaeol. 2008, 3, 167–169. [Google Scholar] [CrossRef]
  2. Jeradino, A. On the origins and significance of Pleistocene coastal resource use in southern Africa with particular reference to shellfish gathering. J. Anthropol. Archaeol. 2017, 41, 213–230. [Google Scholar] [CrossRef]
  3. What are “Cultural Resources”? Available online: www.npi.org/NEPA/what-are (accessed on 12 January 2018).
  4. Allison, I.; Bindoff, N.; Bindschadler, R.; Cox, P.; de Noblet, N.; England, M.; Francis, J.; Gruber, N.; Haywood, A.; Karoly, D.; et al. The Copenhagen Diagnosis 2009: Updating the World on the Latest Climate Science; The University of New South Wales Climate Change Research Centre (CCRC): Sydney, Australia, 2009. [Google Scholar]
  5. Church, J.A.; Clark, P.U.; Cazenave, A.; Gregory, J.M.; Jevrejeva, S.; Levermann, A.; Merrifield, M.A.; Milne, G.A.; Nerem, R.S.; Nunn, P.D.; et al. Sea Level Change. In Climate Change 2013: The Physical Science Basis; Stocker, T.F., Qin, D., Plattner, G.-K., Tignor, M., Allen, S.K., Boschung, J., Nauels, A., Xia, Y., Bex, V., Midgley, P.M., Eds.; Contribution of Working Group I to the Fifth Assessment Report of the Intergovernmental Panel on Climate Change; Cambridge University Press: Cambridge, UK; New York, NY, USA, 2013. [Google Scholar]
  6. Intergovernmental Panel on Climate Change (IPCC). Climate Change 2014: Synthesis Report; Core Writing Team, Pachauri, R.K., Meyer, L.A., Eds.; Contribution of Working Groups I, II and III to the Fifth Assessment Report of the Intergovernmental Panel on Climate Change; IPCC: Geneva, Switzerland, 2014. [Google Scholar]
  7. Intergovernmental Panel on Climate Change (IPCC). Climate Change 2013: The Physical Science Basis; Stocker, T.F., Qin, D., Plattner, G.-K., Tignor, M., Allen, S.K., Boschung, J., Nauels, A., Xia, Y., Bex, V., Midgley, P.M., et al., Eds.; Contribution of Working Group I to the Fifth Assessment Report of the Intergovernmental Panel on Climate Change; Cambridge University Press: Cambridge, UK, 2013. [Google Scholar]
  8. Rahmstorf, S.; Perrette, M.; Vermeer, M. Testing the robustness of semi-empirical sea level projections. Clim. Dyn. 2012, 39, 861–875. [Google Scholar] [CrossRef]
  9. Perrette, M.; Landerer, F.; Riva, R.; Frieler, K.; Meinshausen, M. A scaling approach to project regional sea level rise and its uncertainties. Earth Syst. Dyn. 2013, 4, 11–29. [Google Scholar] [CrossRef] [Green Version]
  10. Vermeer, M.; Rahmstorf, S. Global sea level linked to global temperature. Proc. Natl. Acad. Sci. USA 2009, 106, 21527–21532. [Google Scholar] [CrossRef] [PubMed]
  11. Walsh, J.; Weuebbles, D.; Hayhoe, K.; Kossin, J.; Kunkel, K.; Stephens, G.; Thorne, P.; Vose, R.; Wehner, M.; Willis, J.; et al. Chapter 2: Our changing climate. In Climate Change Impacts in the United States: The Third National Climate Assessment; Melillo, J., Richmond, T., Yohe, G., Eds.; U.S. Global Change Research Program: Washington, DC, USA, 2014; pp. 19–67. [Google Scholar]
  12. Bruun, P. Sea-level rise as a cause of shoreline erosion. J. Waterw. Harb. Div. 1962, 88, 117–139. [Google Scholar]
  13. Leatherman, S.P.; Zhang, K.; Douglas, B.C. Sea level rise shown to drive coastal erosion. EOS Trans. 2000, 81, 55–57. [Google Scholar] [CrossRef]
  14. Zhang, K.; Douglas, B.C.; Leatherman, S.P. Global warming and coastal erosion. Clim. Chan. 2004, 64, 41–58. [Google Scholar] [CrossRef]
  15. Fatorić, S.; Seekamp, E. Are Cultural Heritage and Resources threatened by Climate Change? A systematic literature review. Clim. Chan. 2017, 142, 227–254. [Google Scholar] [CrossRef]
  16. Anderson, D.G.; Bissett, T.G.; Yerka, S.J.; Wells, J.J.; Kansa, E.C.; Kansa, S.W.; Myers, K.N.; DeMuth, R.C.; White, D.A. Sea-level rise and archaeological site destruction: An example from the southeastern United States using DINAA (Digital Index of North American Archaeology). PLoS ONE 2017, 12, e0188142. [Google Scholar] [CrossRef] [PubMed]
  17. Bird, M.K. The impact of tropical cyclones on the archaeological record: An Australian example. Archaeol. Ocean. 1992, 27, 75–86. [Google Scholar] [CrossRef]
  18. Rowland, M.J. Climate change, sea-level rise and the archaeological record. Aust. Archaeol. 1992, 34, 29–33. [Google Scholar] [CrossRef]
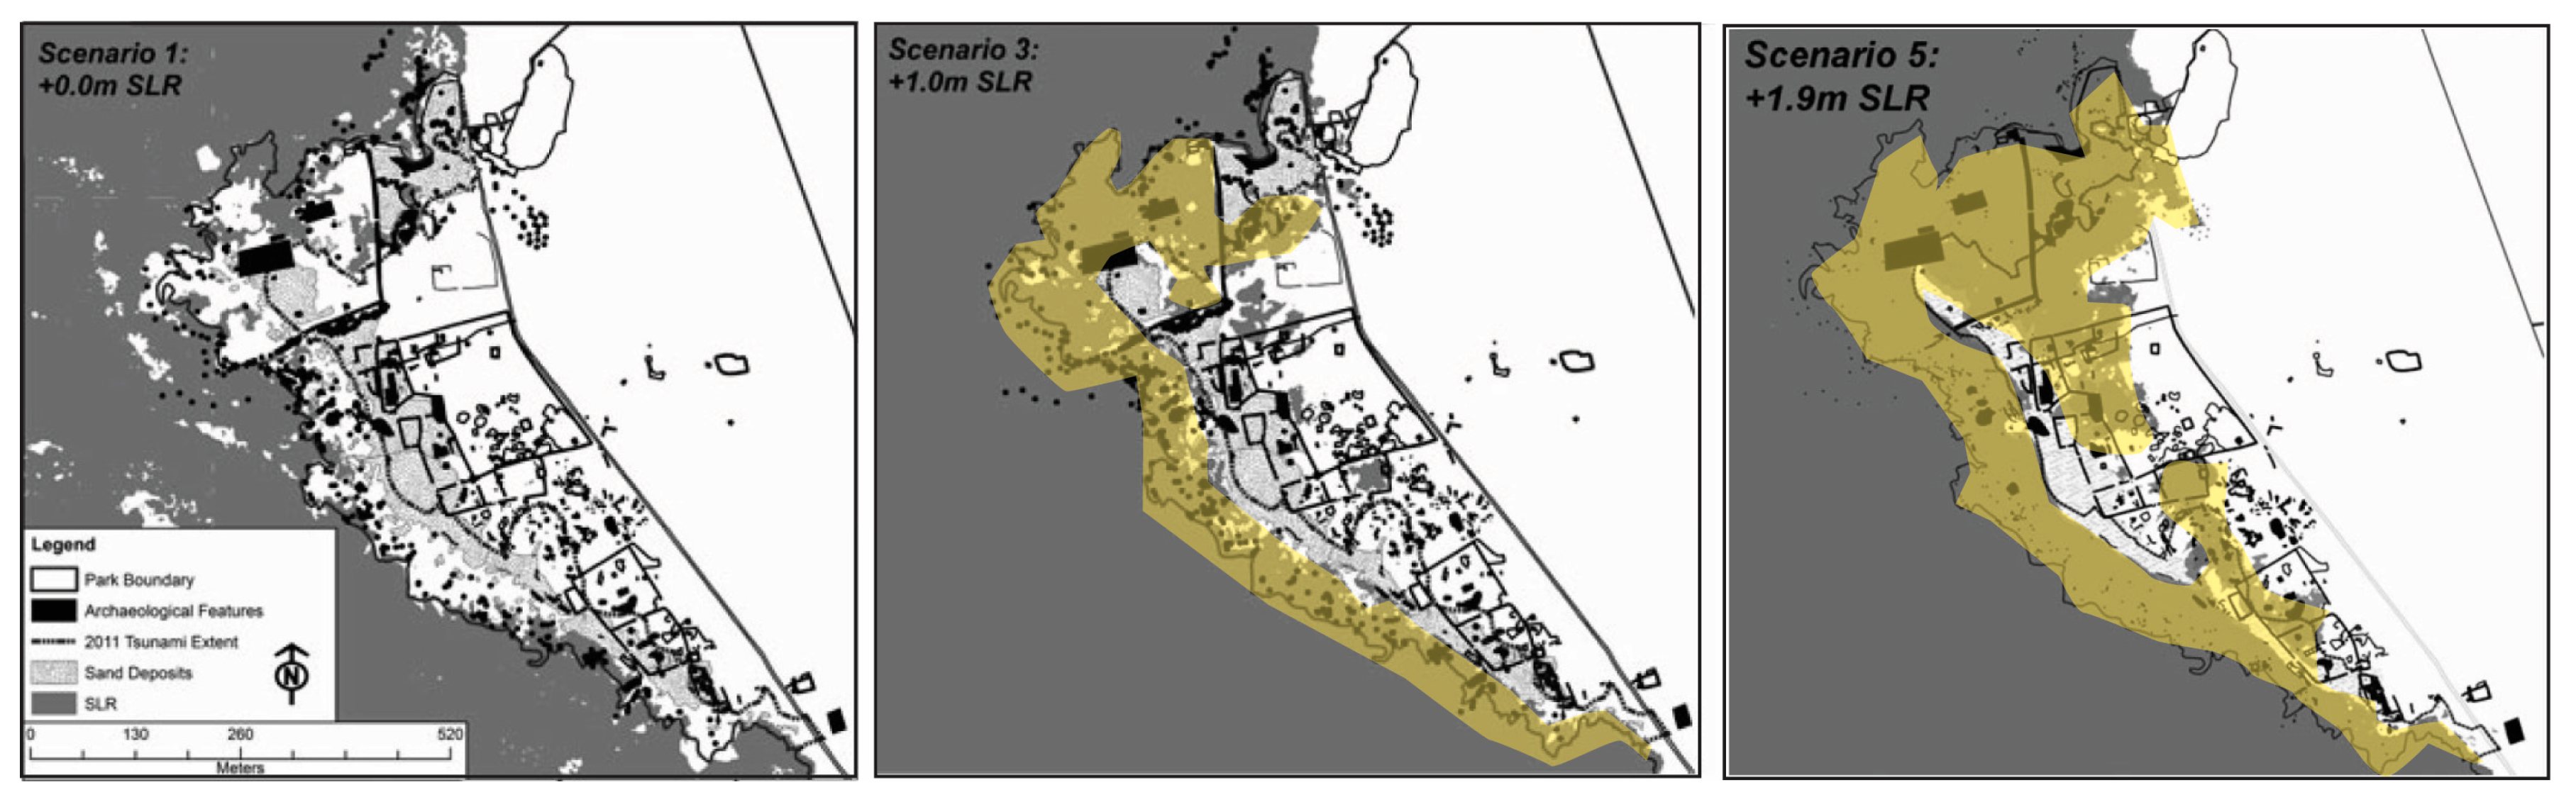
  19. Johnson, A.; Marrack, L.; Dolan, S. Threats to Coastal Archaeological Sites and the Effects of Future Climate Change: Impacts of the 2011 Tsunami and an Assessment of Future Sea-Level Rise at Hōnaunau, Hawai‘i. J. Isl. Coast. Archaeol. 2015, 10, 232–252. [Google Scholar] [CrossRef]
  20. Knott, S.; Szabó, K.; Ridges, M.; Fullagar, R. Vulnerability of Indigenous Heritage Sites to Changing Sea Levels: Piloting a GIS-Based Approach in the Illawarra, New South Wales, Australia. Archaeol. Rev. Camb. 2017, 32, 78–97. [Google Scholar]
  21. Kvamme, K. Recent directions and developments in geographical information systems. J. Archaeol. Res. 1999, 7, 153–201. [Google Scholar] [CrossRef]
  22. McCoy, M.D.; Ladefoged, T.N. New developments in the use of spatial technology in archaeology. J. Archaeol. Res. 2009, 17, 263–295. [Google Scholar] [CrossRef]
  23. Erlandson, J.M.; Fitzpatrick, S.M. Oceans, islands, and coasts: Current perspectives on the role of the sea in human prehistory. J. Isl. Coast. Archaeol. 2006, 1, 5–33. [Google Scholar] [CrossRef]
  24. Fitzpatrick, S.M.; Rick, T.C.; Erlandson, J.M. Recent progress, trends, and developments in island and coastal archaeology. J. Isl. Coast. Archaeol. 2015, 10, 3–27. [Google Scholar] [CrossRef]
  25. Rick, T.C.; Erlandson, J.M. (Eds.) Human Impacts on Ancient Marine Ecosystems: A global Perspective; University of California Press: Berkeley, CA, USA, 2008. [Google Scholar]
  26. Burley, D.; Weisler, M.I.; Zhao, J. High precision U/Th dating of first Polynesian settlement. PLoS ONE 2012, 7, e48769. [Google Scholar] [CrossRef] [PubMed]
  27. Dye, T.S. Dating human dispersal in Remote Oceania: A Bayesian view from Hawai’i. World Archaeol. 2015, 47, 661–676. [Google Scholar] [CrossRef]
  28. Kawelu, K.L. Kuleana and Commitment: Working Toward a Collaborative Hawaiian Archaeology; University of Hawaii Press: Honolulu, HI, USA, 2015. [Google Scholar]
  29. Palmer, G.B. New Zealand archaeology and air photography. J. Polyn. Soc. 1947, 57, 233–241. [Google Scholar]
  30. Gorbey, K. Aerial photography in New Zealand archaeology. N. Z. Archaeol. Assoc. Newsl. 1967, 10, 167–175. [Google Scholar]
  31. Jones, K.L. Aerial Photography in New Zealand Archaeology. Aust. Hist. Archaeol. 1996, 14, 25–33. [Google Scholar]
  32. Newman, T.S. Hawaiian Fishing and Farming on the Island of Hawaii in A.D. 1778; Hawaii Division of State Parks: Honolulu, HI, USA, 1970.
  33. Ladefoged, T.N.; Graves, M.W.; Jennings, R.P. Dryland agricultural expansion and intensification in the Kohala, Hawai’i Island. Antiquity 1996, 70, 861–880. [Google Scholar] [CrossRef]
  34. Casana, J.; Cothren, J. The CORONA Atlas Project: Orthorectification of CORONA Satellite Imagery and Regional-Scale Archaeological Exploration in the Near East. In Mapping the Archaeological Landscape from Space; Comer, D.C., Harrower, M.J., Eds.; Springer: Berlin, Germany, 2012; pp. 33–43. [Google Scholar]
  35. Lipo, C.P.; Hunt, T.L. Mapping the Prehistoric Statue Roads on Easter Island. Antiquity 2005, 79, 158–168. [Google Scholar] [CrossRef]
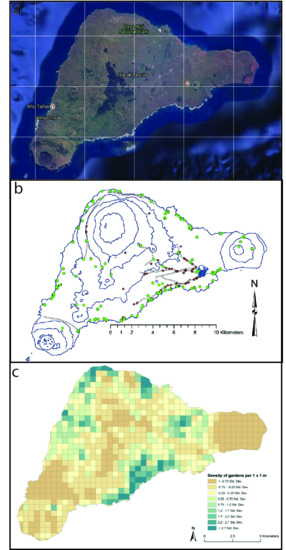
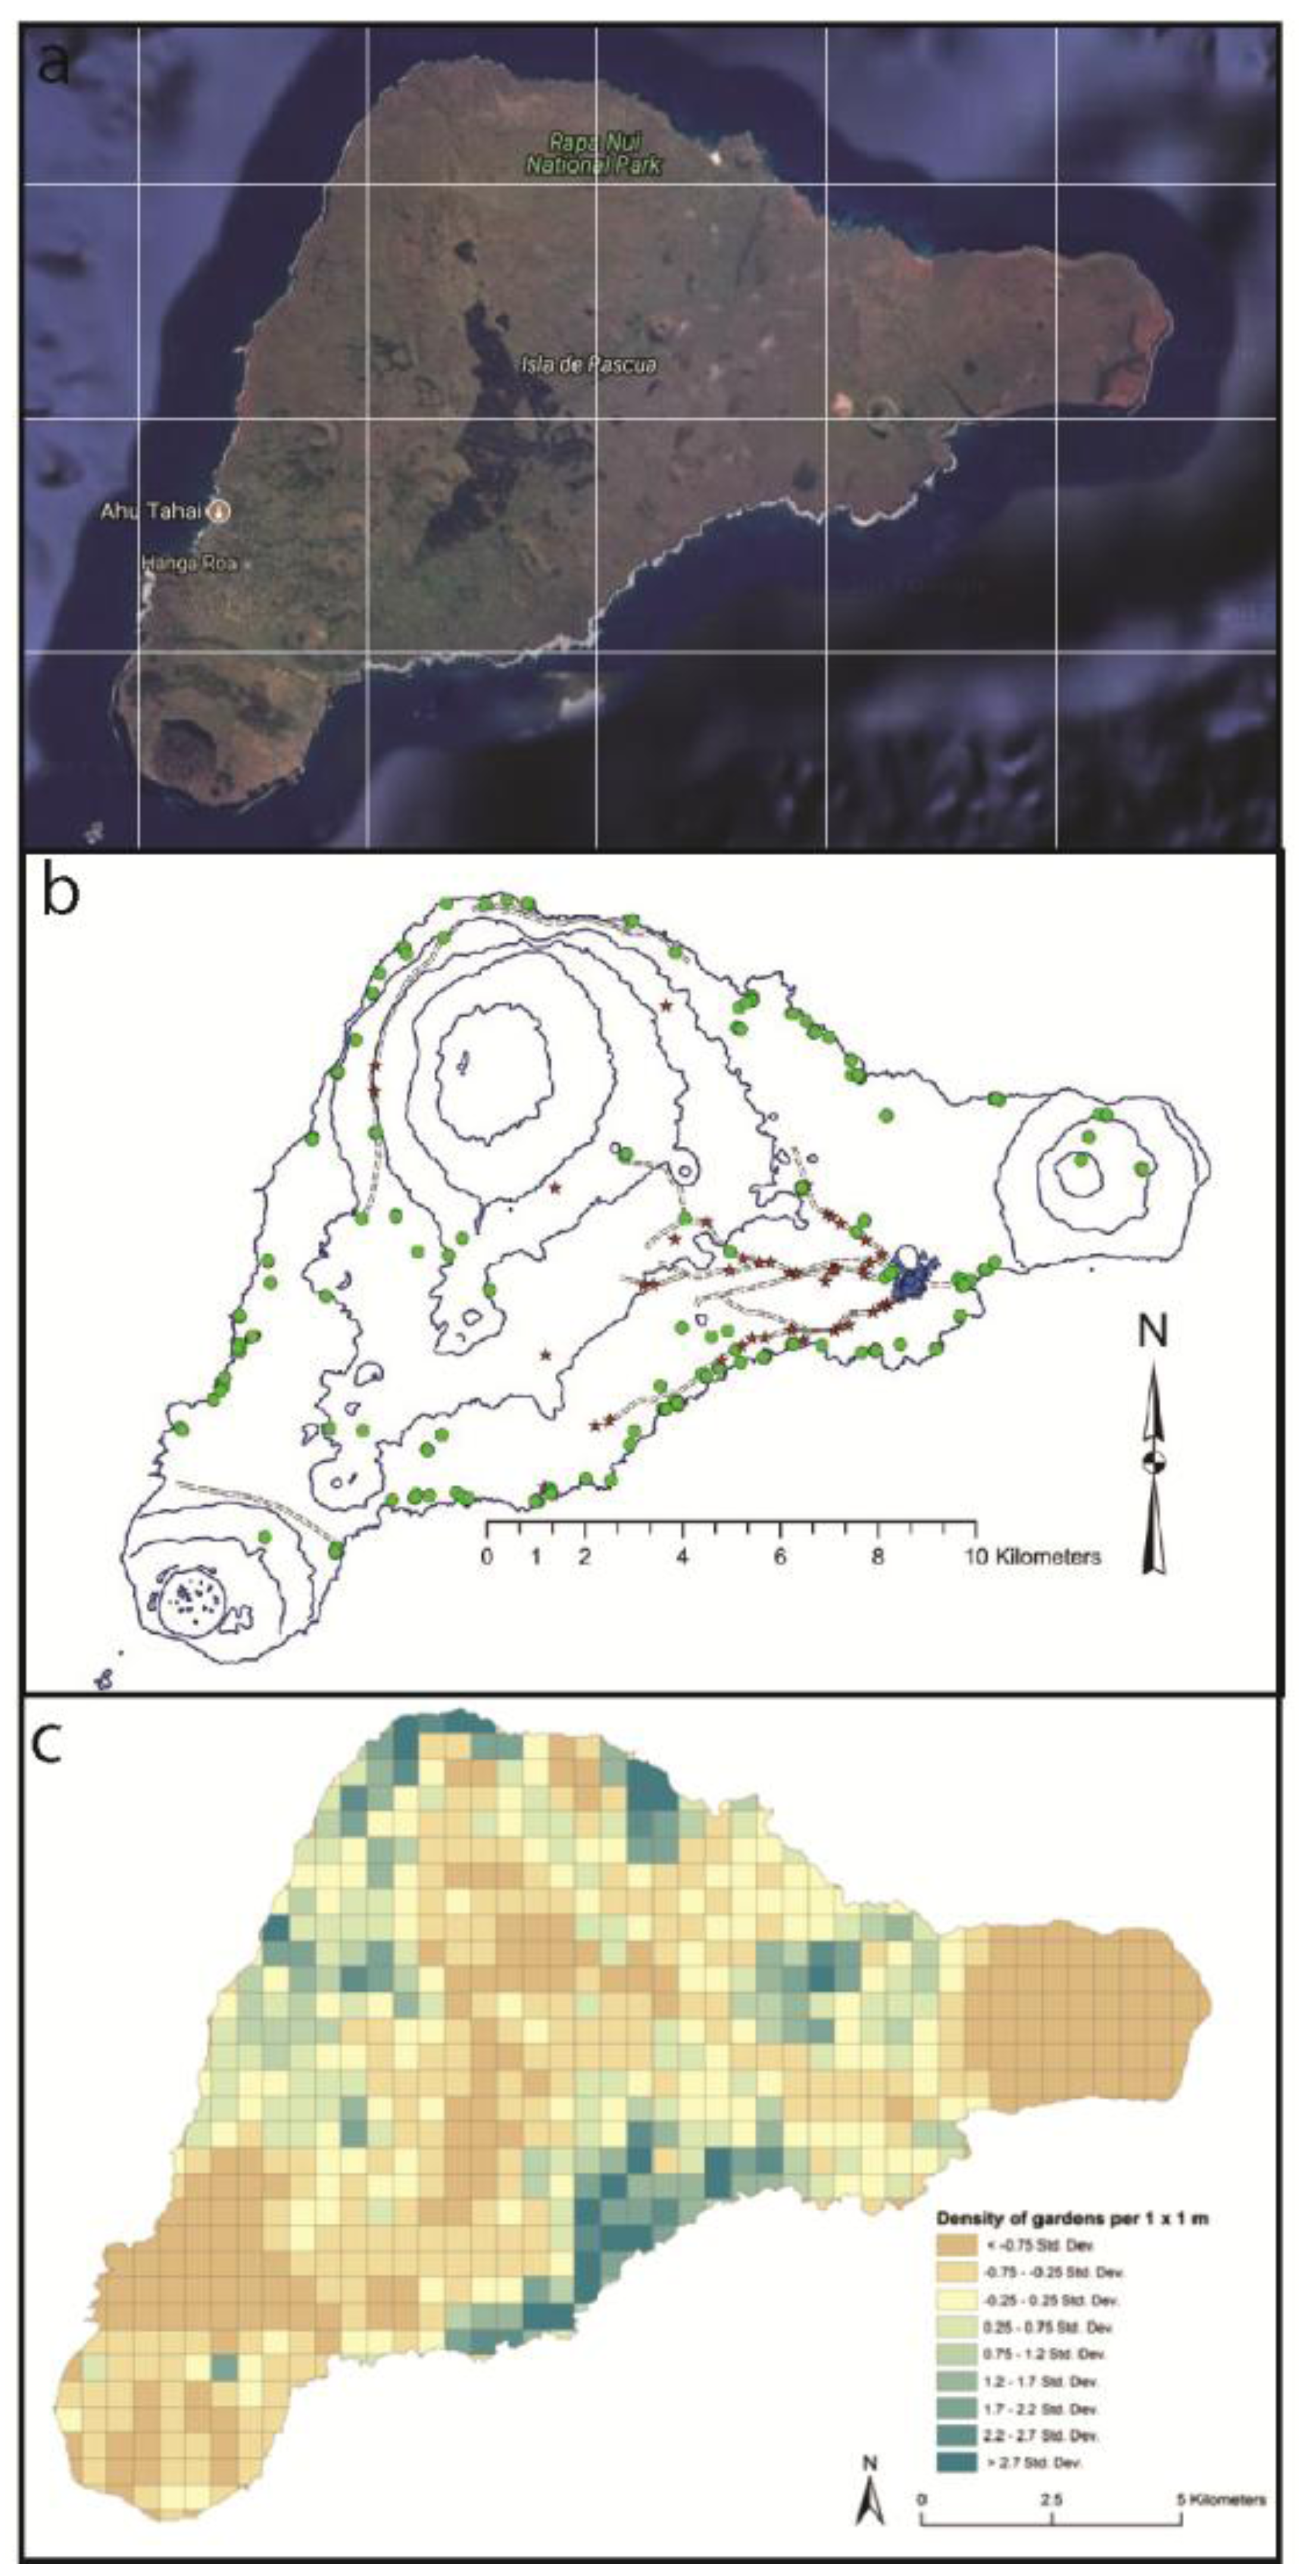
  36. Ladefoged, T.N.; Flaws, A.; Stevenson, C.M. The distribution of rock gardens on Rapa Nui (Easter Island) as determined from satellite imagery. J. Archaeol. Sci. 2013, 40, 1203–1212. [Google Scholar] [CrossRef]
  37. O’Rouke, M.J.E. Archaeological Site Vulnerability Modelling: The Influence of High Impact Storm Events on Models of Shoreline Erosion in the Western Canadian Arctic. Open Archaeol. 2017, 3, 1–16. [Google Scholar] [CrossRef]
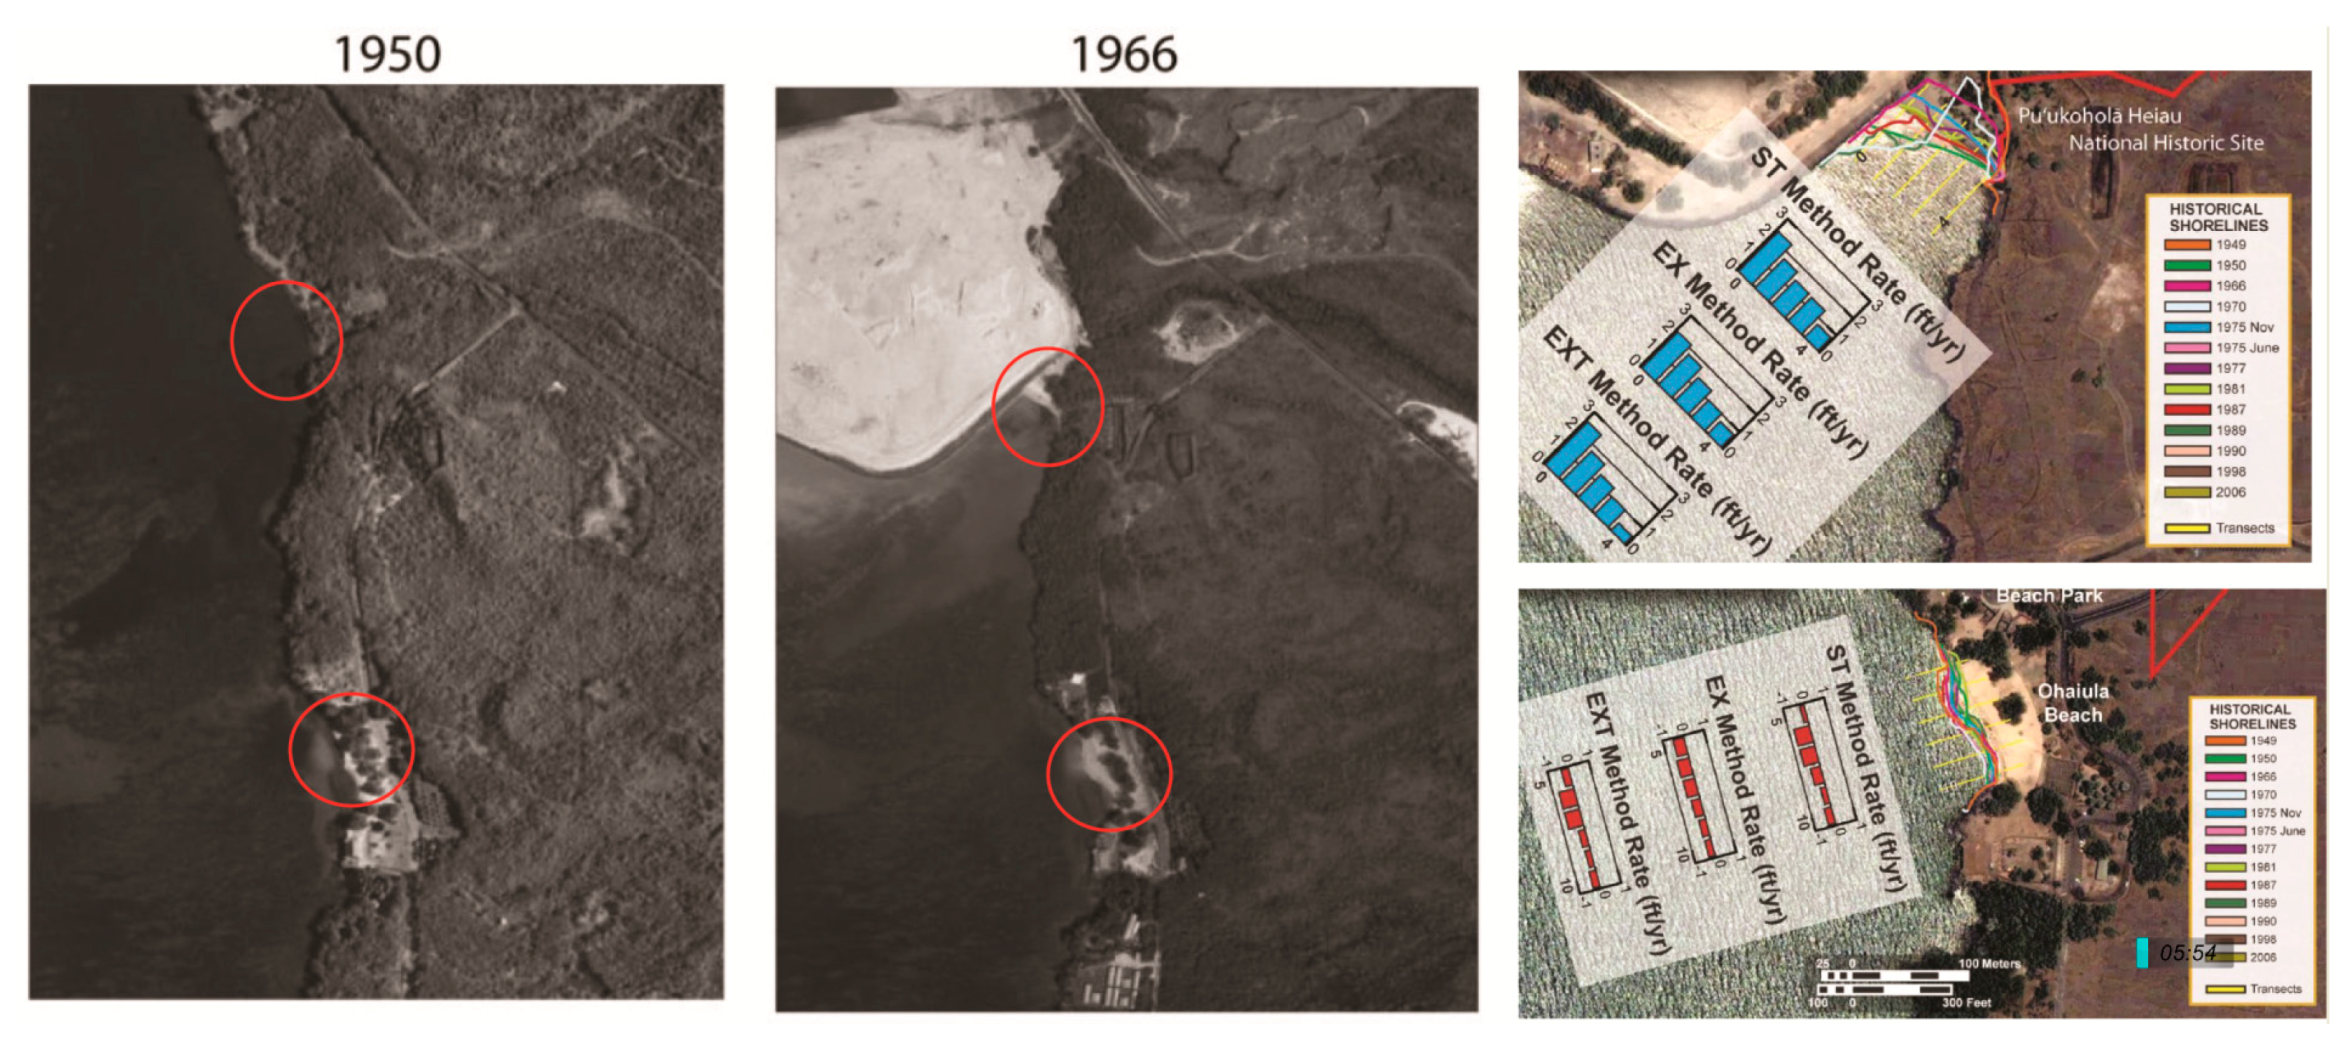
  38. Vitousek, S.; Barbee, M.M.; Fletcher, C.H.; Richmond, B.M.; Genz, A.S. Pu’ukoholā Heiau National Historic Site and Kaloko Honokōhau Historical Park, Big Island of Hawai’i Coastal Hazard Analysis Report; National Park Service: Washington, DC, USA, 2009.
  39. Chase, A.F.; Chase, D.Z.; Fisher, C.T.; Leisz, S.J.; Weishampel, J.F. Geospatial revolution and remote sensing LiDAR in Mesoamerican archaeology. Proc. Natl. Acad. Sci. USA 2012, 109, 12916–12921. [Google Scholar] [CrossRef] [PubMed]
  40. Quintus, S.; Day, S.S.; Smith, N.J. The Efficacy and Analytical Importance of Manual Feature Extraction Using Lidar Datasets. Adv. Archaeol. Pract. 2017, 5, 1–24. [Google Scholar] [CrossRef]
  41. McCoy, M.D. Geospatial Big Data in Archaeology: Problems and prospects too great to ignore. J. Archaeol. Sci. 2017, 84, 74–94. [Google Scholar] [CrossRef]
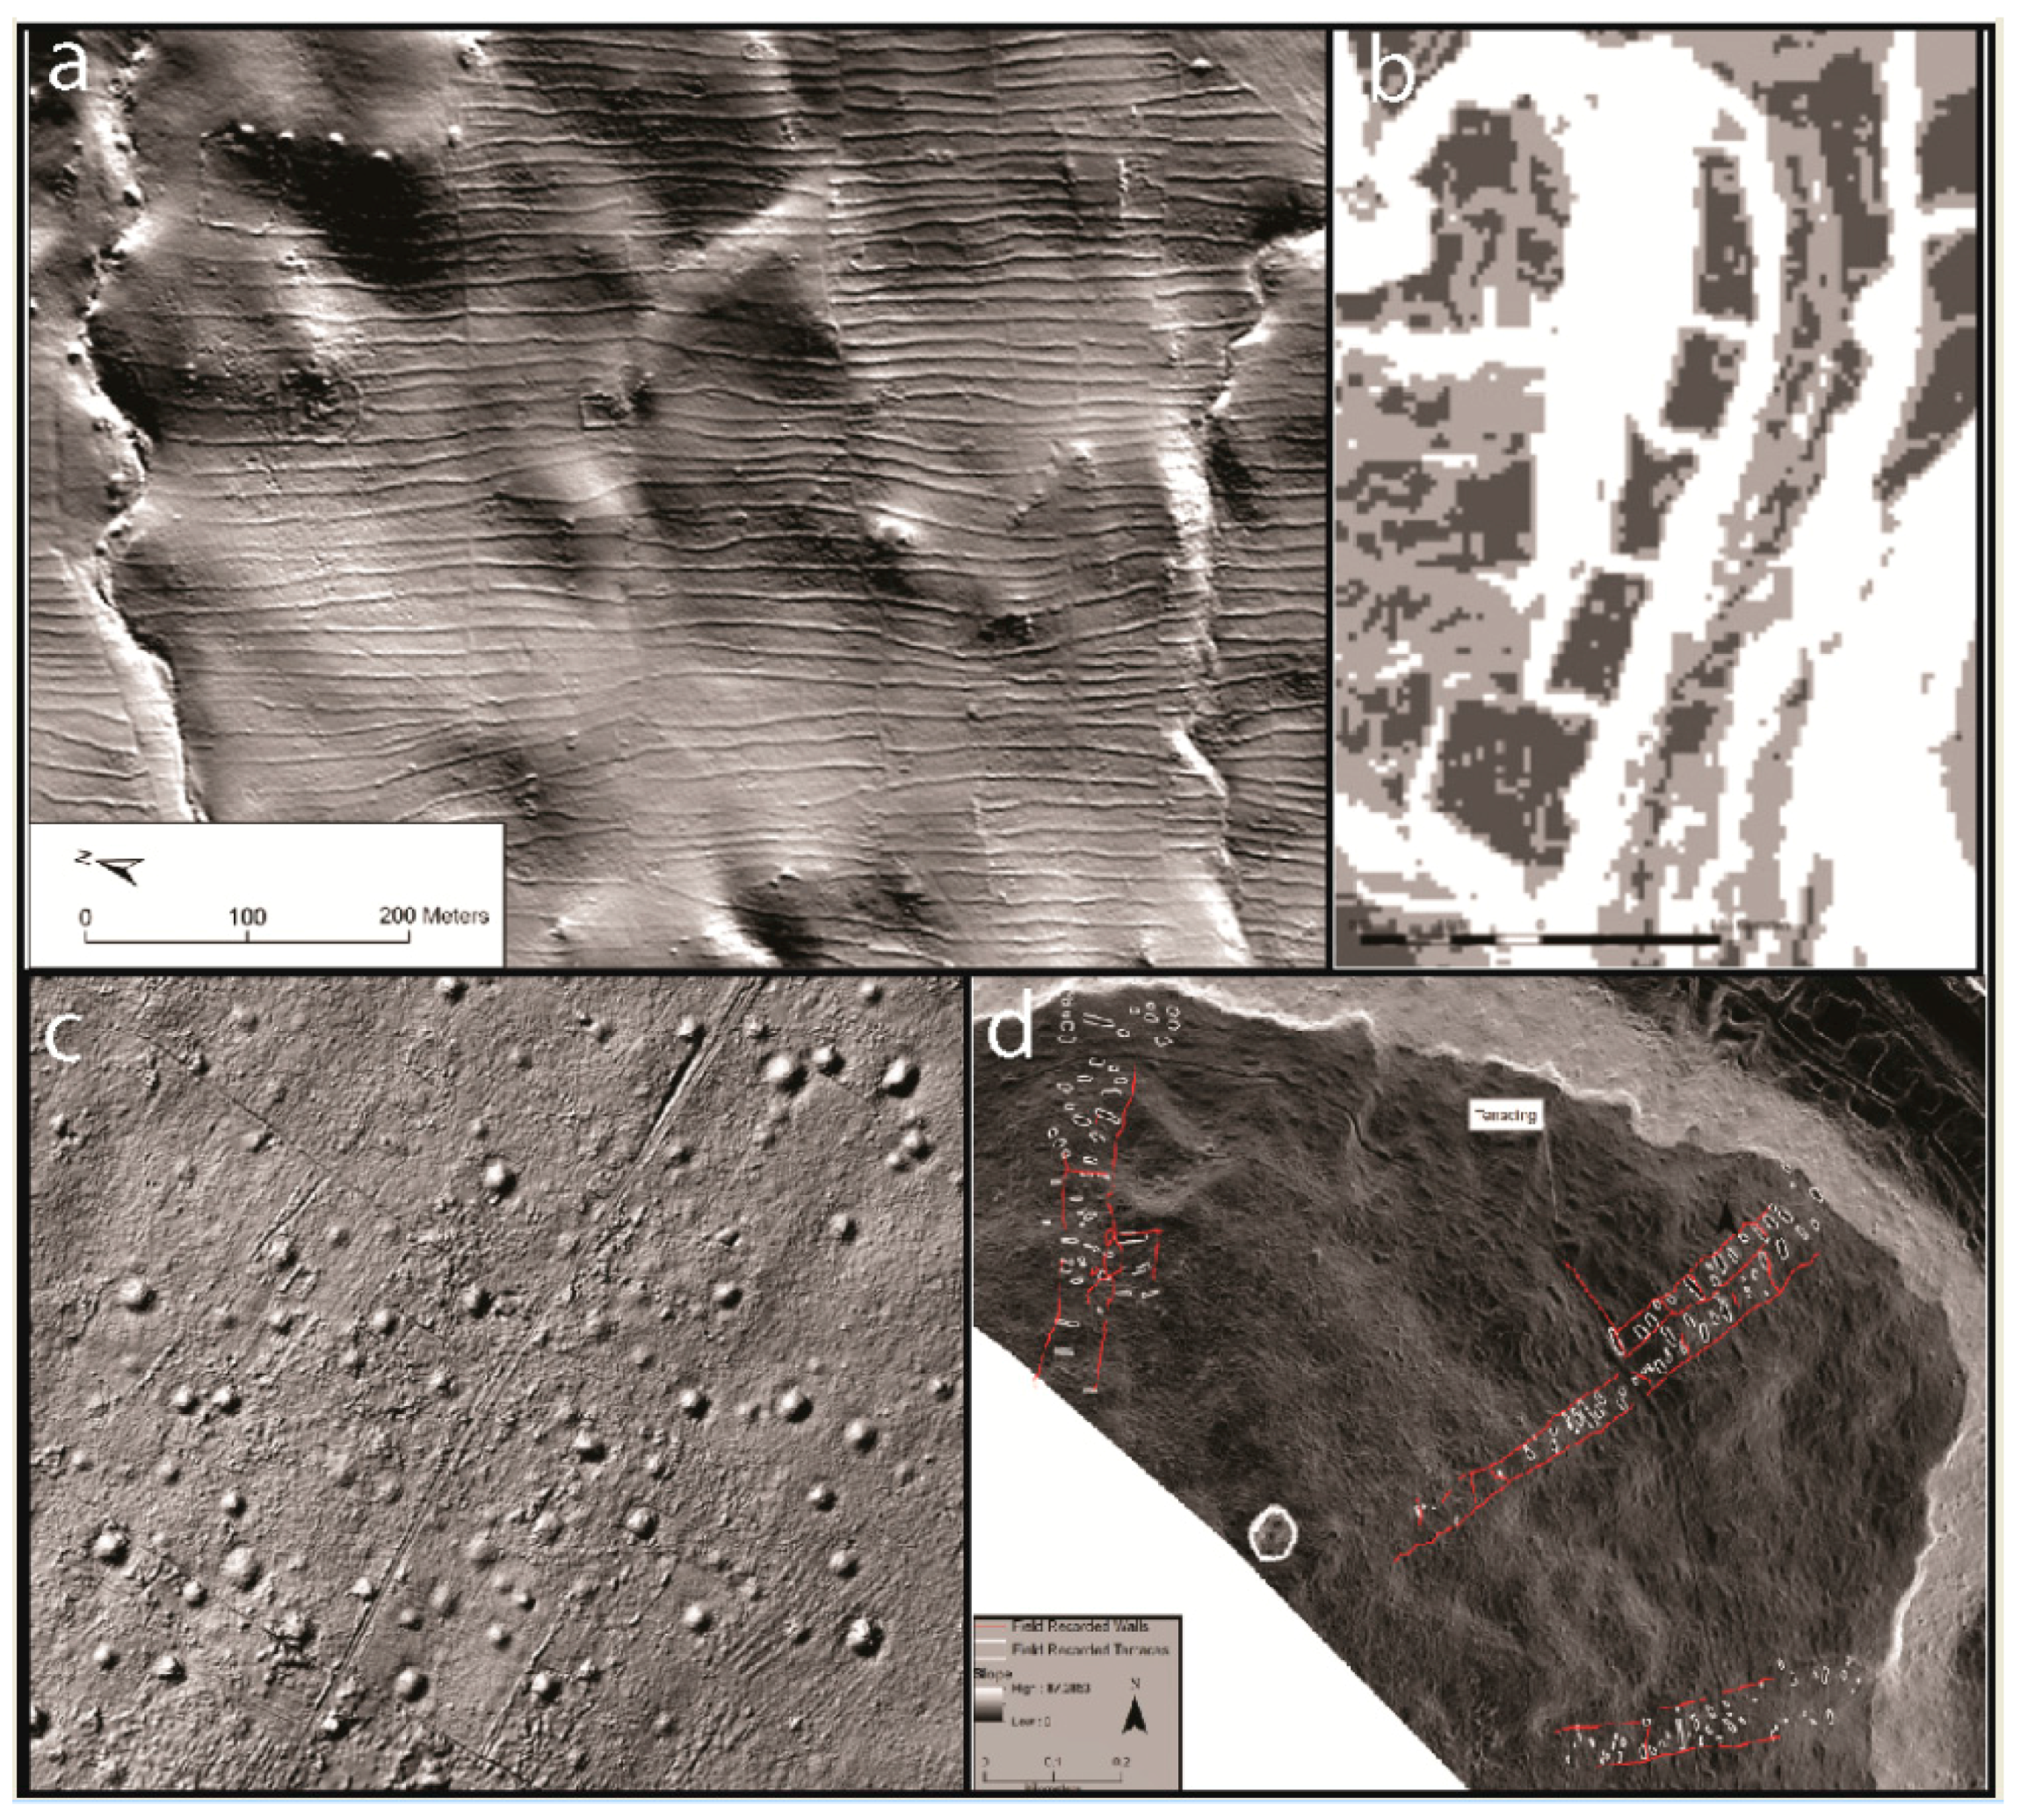
  42. Ladefoged, T.N.; McCoy, M.D.; Asner, G.P.; Kirch, P.V.; Puleston, C.O.; Chadwick, O.A.; Vitousek, P.M. Agricultural potential and actualized development in Hawai’i: An airborne LiDAR survey of the leeward Kohala field system (Hawai’i Island). J. Archaeol. Sci. 2011, 38, 3605–3619. [Google Scholar] [CrossRef]
  43. McCoy, M.D.; Asner, G.P.; Graves, M.W. Airborne lidar survey of irrigated agricultural landscapes: An application of the slope contrast method. J. Archaeol. Sci. 2011, 38, 2141–2154. [Google Scholar] [CrossRef]
  44. McIvor, I.H.; Ladefoged, T.N. Intermittent irrigation in the Waimea Field System, Hawai’i Island: A computational fluid dynamics model. J. Archaeol. Sci. Rep. 2018, 17, 335–345. [Google Scholar] [CrossRef]
  45. Freeland, T.; Heung, B.; Burley, D.V.; Clark, G.; Knudby, A. Automated Feature Extraction for Prospection and Analysis of Monumental Earthworks from Aerial LiDAR in the Kingdom of Tonga. J. Archaeol. Sci. 2016, 69, 64–74. [Google Scholar] [CrossRef]
  46. Quintus, S.; Clark, J.T.; Day, S.S.; Schwert, D.P. Investigating Regional Patterning in Archaeological Remains by Pairing Extensive Survey with a Lidar dataset: The Case of the Manu’a Group, American Samoa. J. Archaeol. Sci. Rep. 2015, 2, 677–687. [Google Scholar] [CrossRef]
  47. 2006 FEMA Lidar: Hawaiian Islands. Available online: https://coast.noaa.gov/htdata/lidar1_z/geoid12a/data/1393/2006_HI_fema_metadata.html (accessed on 12 January 2018).
  48. Irwin, G.J.; Ladefoged, T.N.; Wallace, R.T.; Jones, M.D.; Ross, S.C.; Clout, S.D. Experimental geophysical survey on Motutapu Island 1994–1996. Archaeol. N. Z. 1997, 40, 266–277. [Google Scholar]
  49. Bickler, S.H.; Low, J.M. “Lies, damned lies and geophysics”: Uses and abuses of remote sensing techniques in New Zealand heritage management. Archaeol. N. Z. 2007, 50, 195–210. [Google Scholar]
  50. Conyers, L.B.; Connell, S. An analysis of ground-penetrating radar’s ability to discover and map buried archaeological sites in Hawai’i. Hawaii. Archaeol. 2007, 11, 61–76. [Google Scholar]
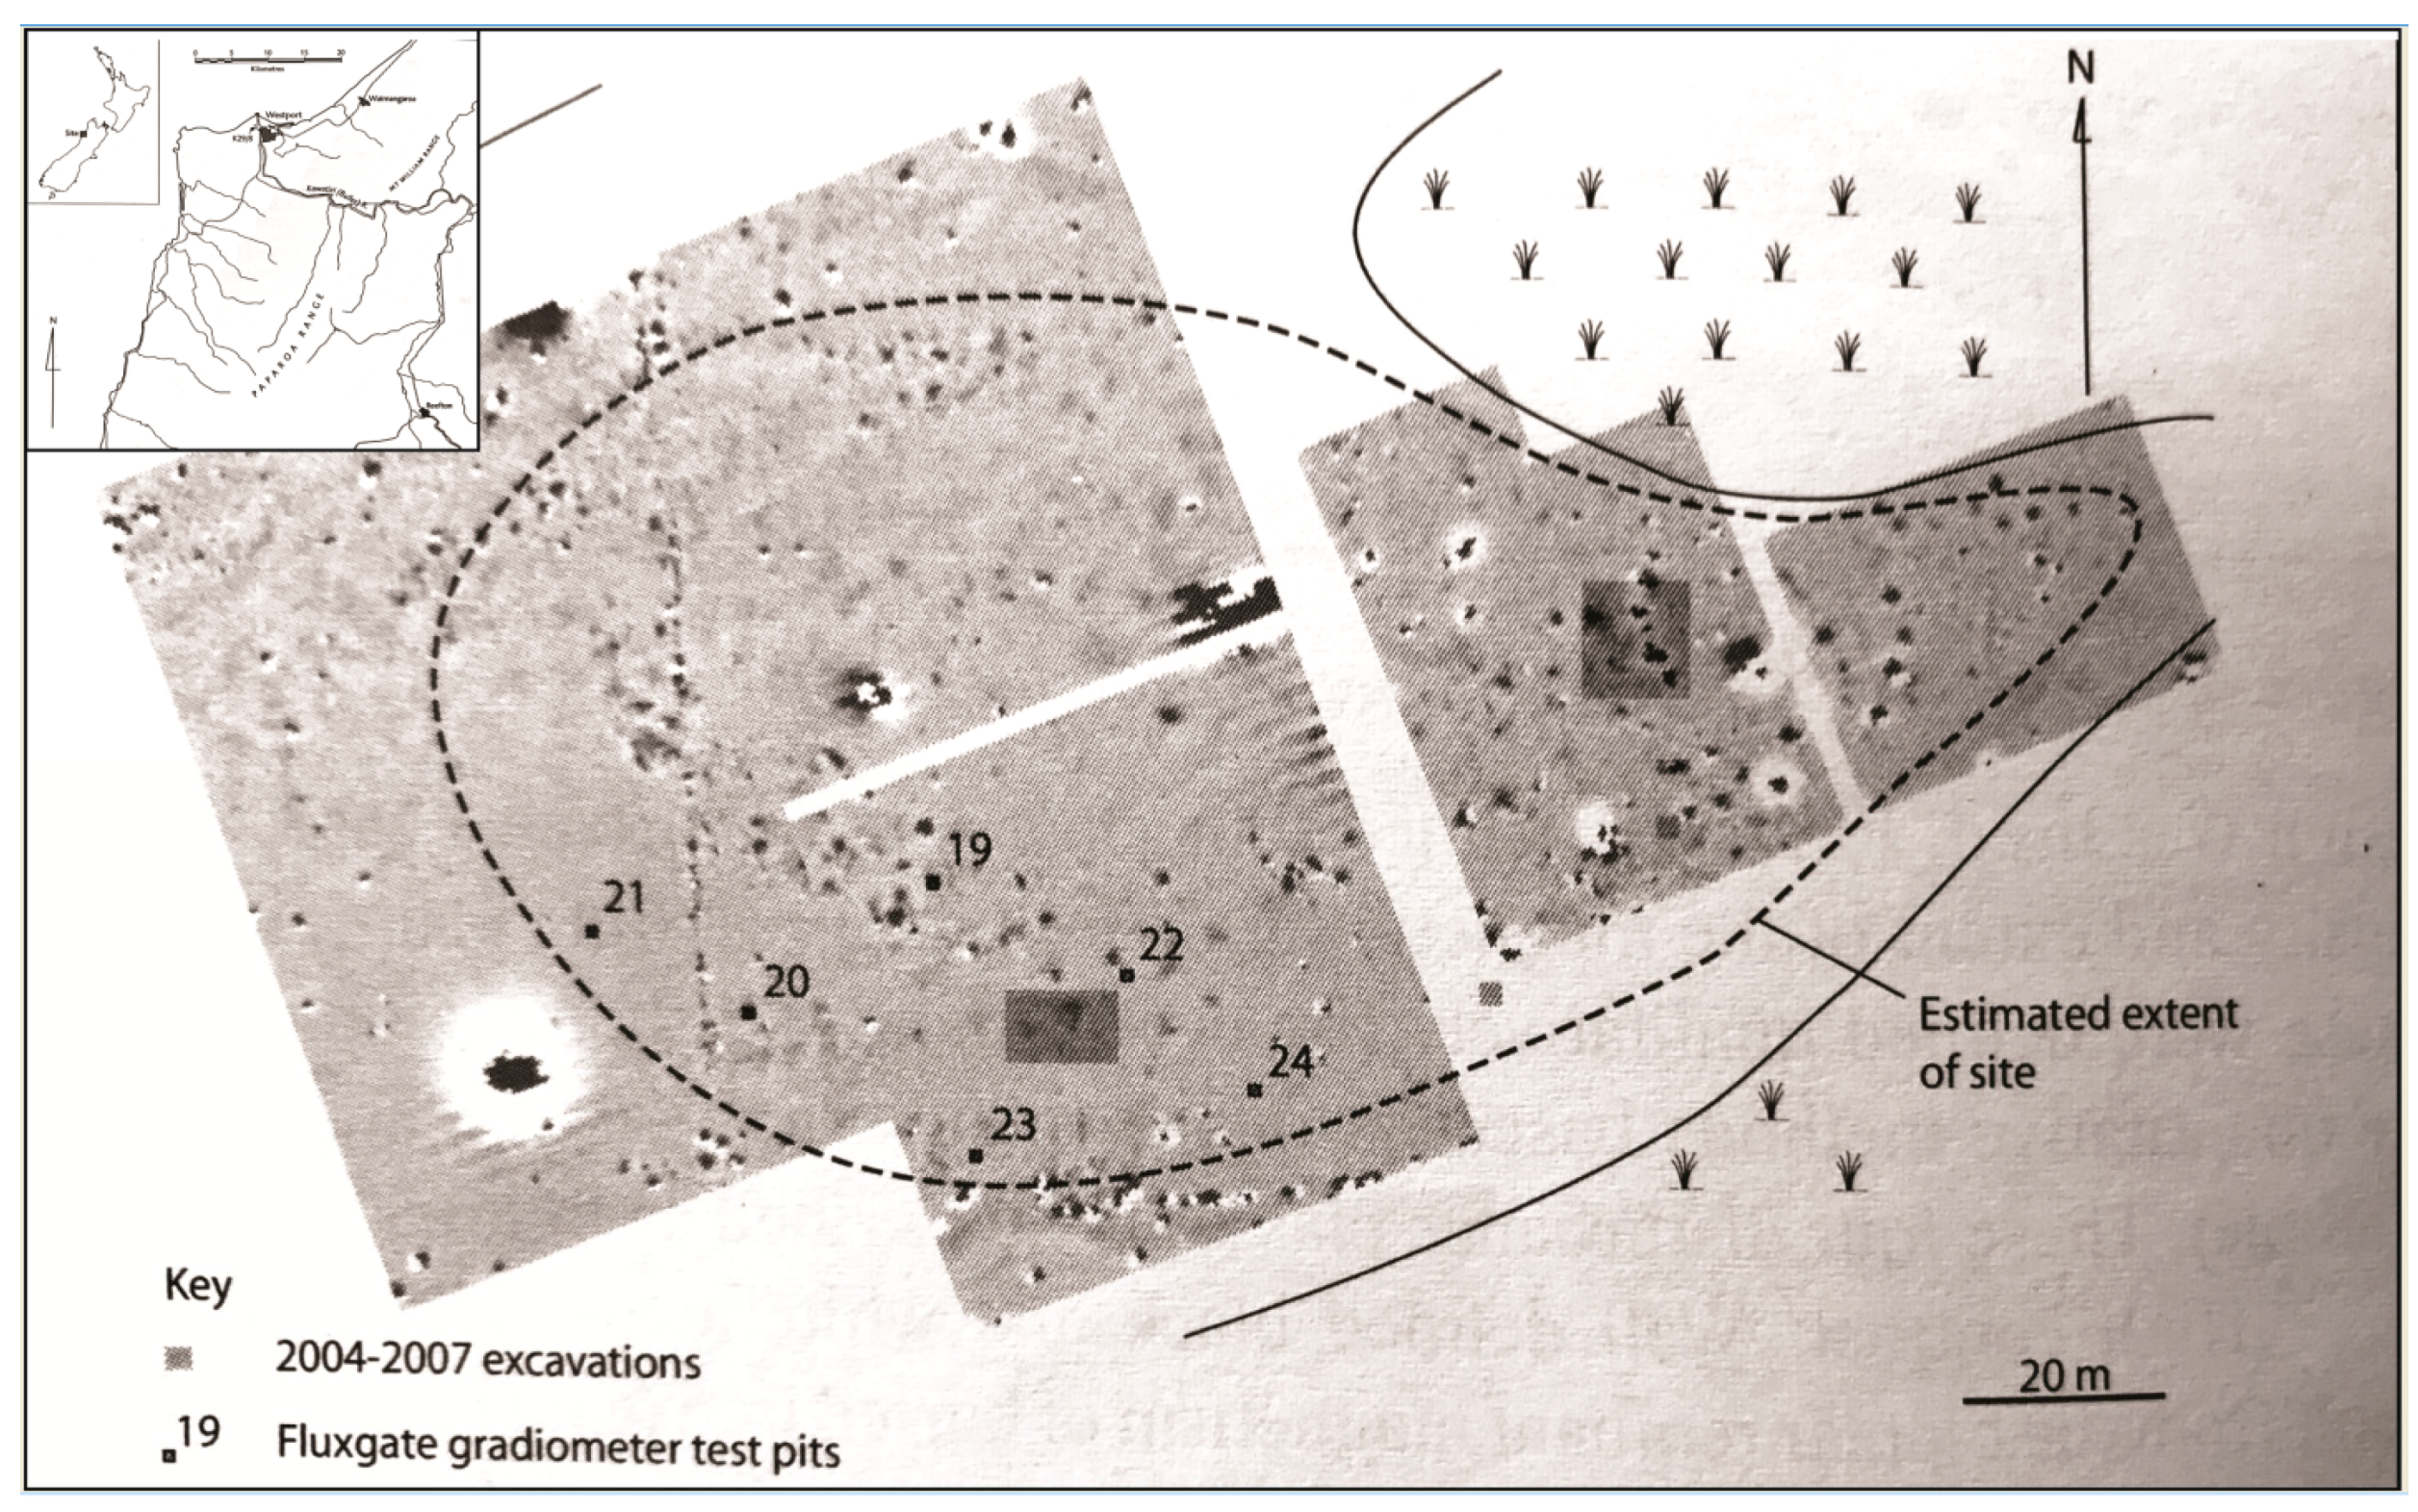
  51. Shaw, B.; Jacomb, C.; Walter, R. The potential of the fluxgate gradiometer as a research tool in New Zealand. Archaeol. N. Z. 2008, 51, 121–129. [Google Scholar]
  52. Pearl, F.B.; Sauck, W.A. Geophysical and geoarchaeological investigations at Aganoa Beach, American Samoa an early archaeological site in Western Polynesia. Geoarchaeology 2014, 29, 462–476. [Google Scholar] [CrossRef]
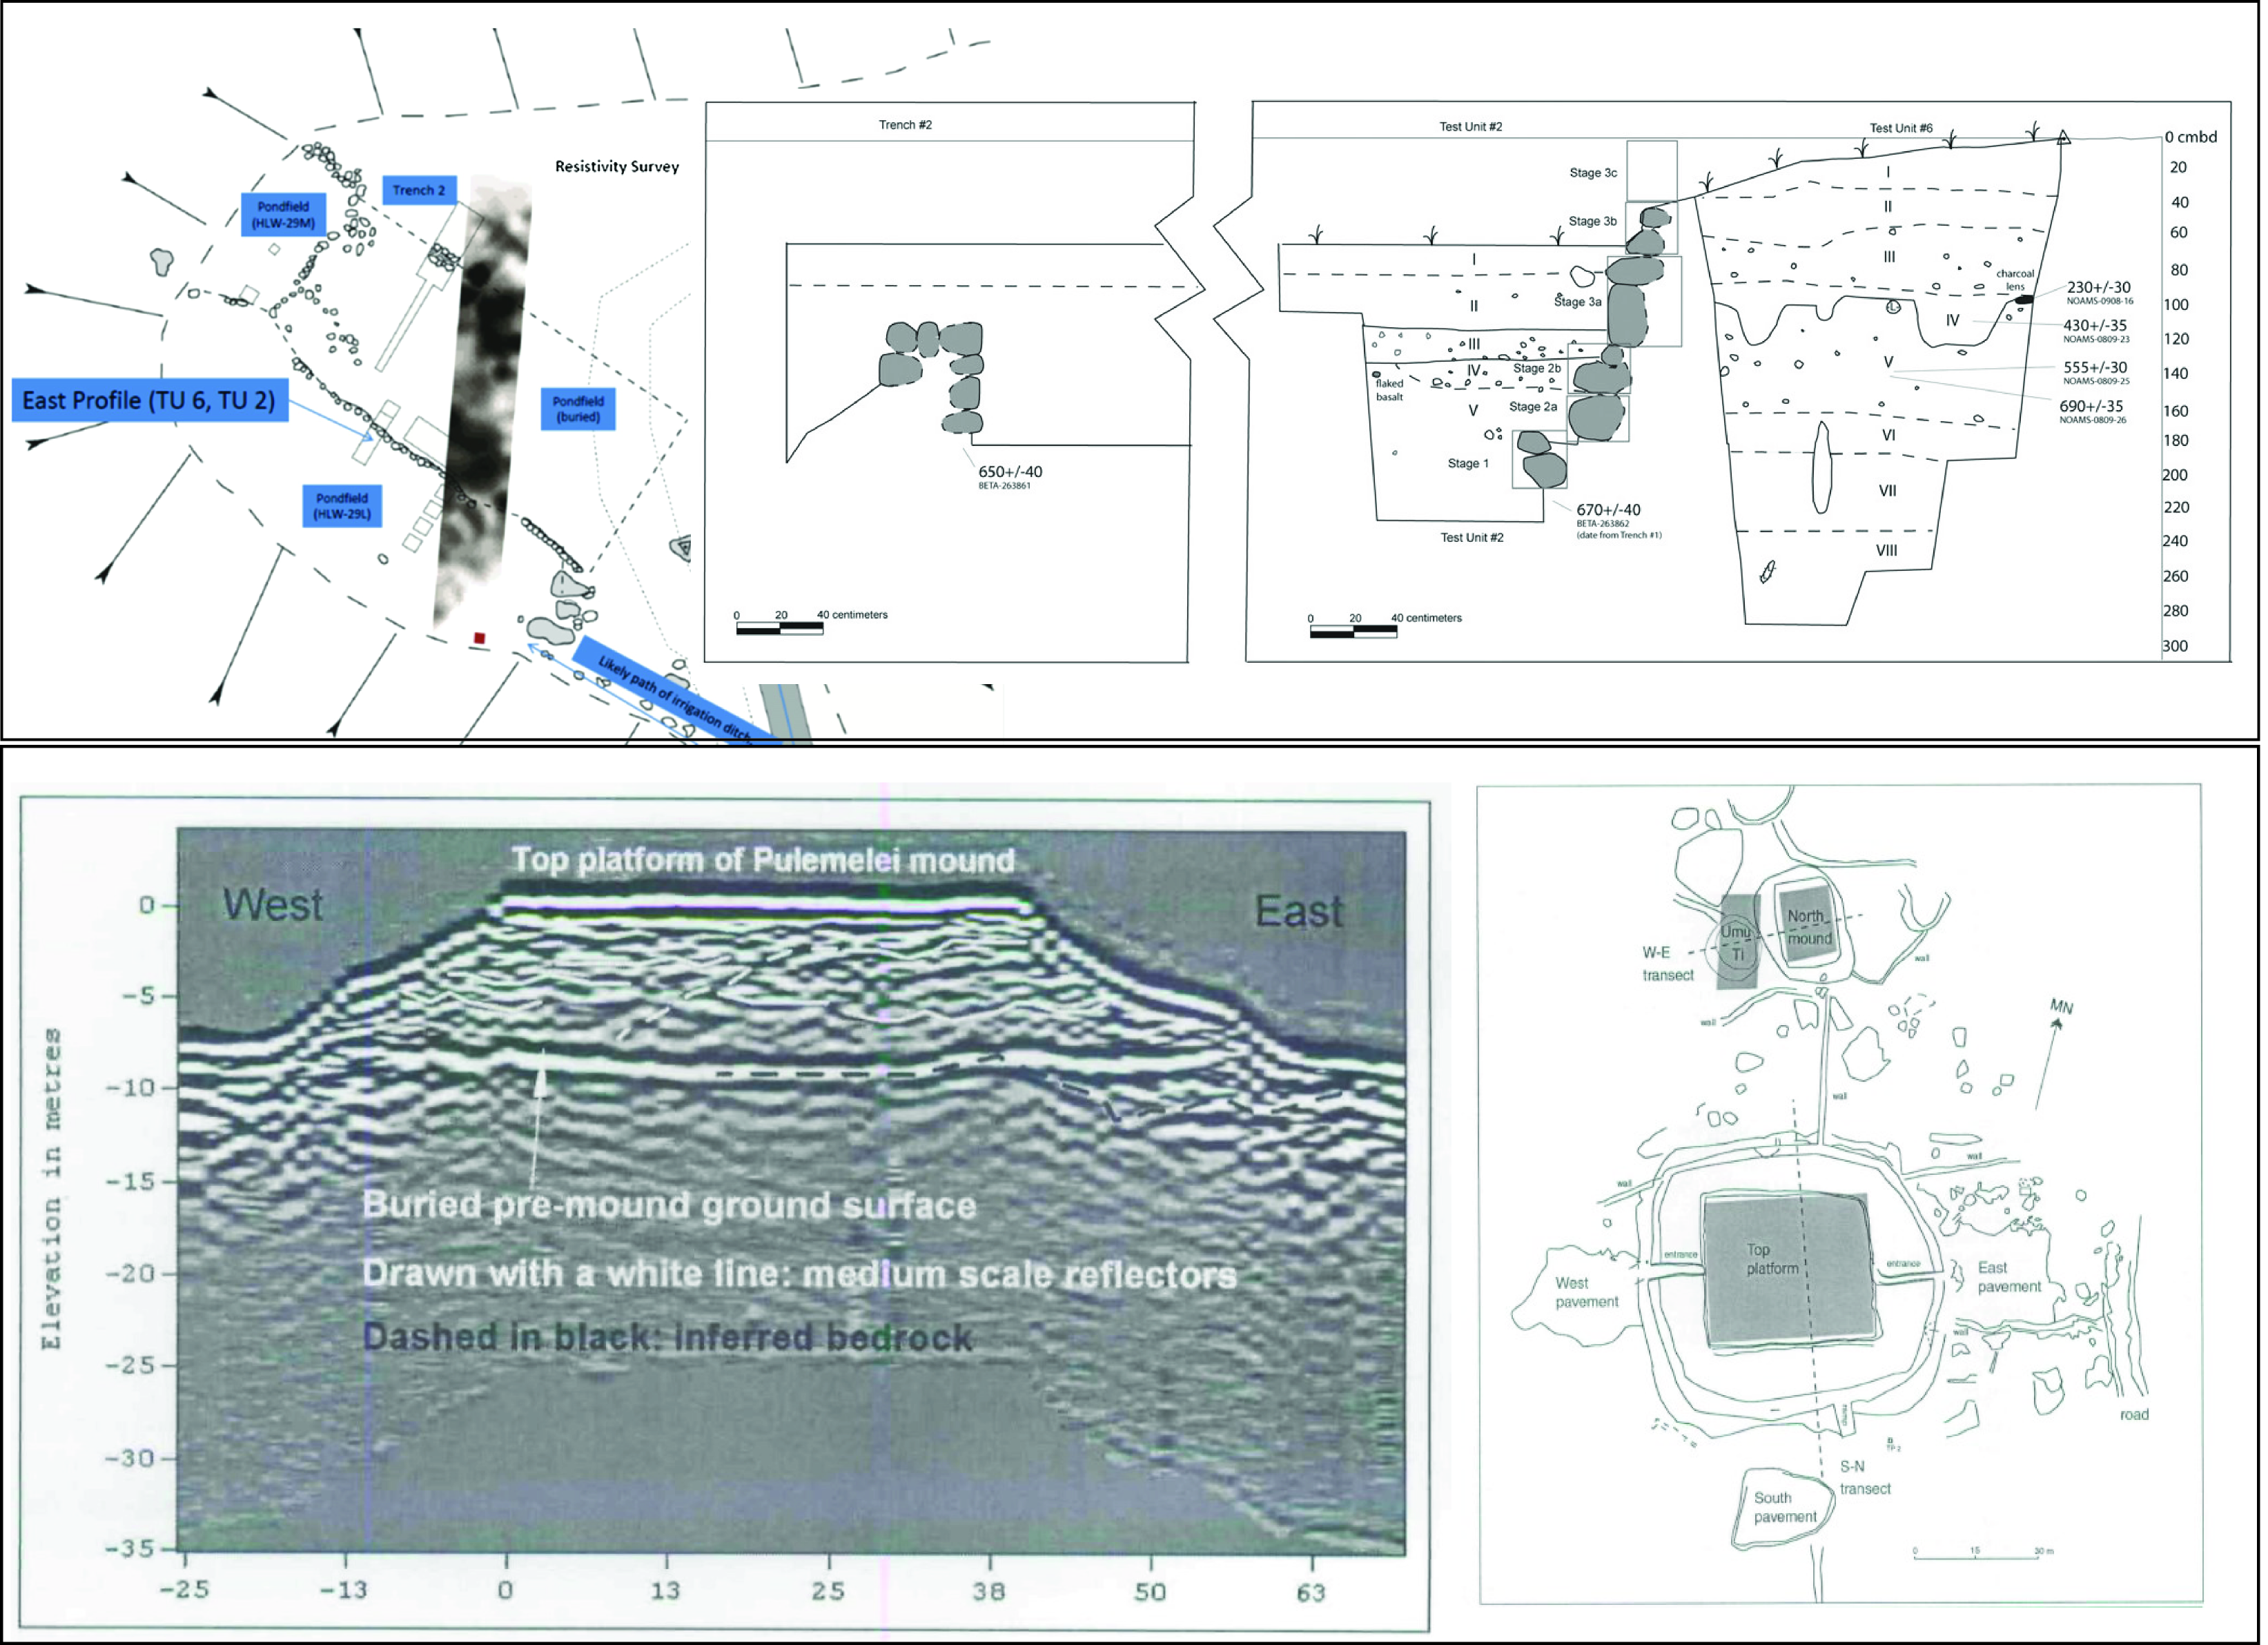
  53. McCoy, M.D.; Browne Ribeiro, A.T.; Graves, M.W.; Chadwick, O.A.; Vitousek, P.M. Taro (Colocasia esculenta) farming in ancient Hawaii: Sedimentology and soil nutrient analyses of irrigated pondfield soils. J. Archaeol. Sci. 2013, 40, 1528–1538. [Google Scholar] [CrossRef]
  54. Clark, G.; de Biran, A. Geophysical investigations at the Pulemelei mound. Archaeol. Ocean. 2007, 42, 60–70. [Google Scholar] [CrossRef]
  55. Brooks, E.; Jacomb, C.; Walter, R. Archaeological investigations at Wairau Bar. Archaeol. N. Z. 2009, 52, 259–268. [Google Scholar]
  56. Van Tilburg, H. Underwater archaeology, Hawaii style. In International Handbook of Underwater Archaeology; Ruppe, C.V., Barstad, J.F., Eds.; Kluwer Academic/Plenum Publishing: New York, NY, USA, 2002; pp. 247–266. [Google Scholar]
  57. Sailors, D.; Honda, S.S. Remote Survey of a Near-Coastal Archaeological Alignment at Kualoa, Hawai’i Using Worldview 2 Satellite, LiDAR and UAV Imagery. 2014. Available online: https://www.academia.edu/16518333/Remote_Survey_of_a_Near-Coastal_Archaeological_Alignment_at_Kualoa_Hawaii_Using_Worldview_2_Satellite_LiDAR_and_UAV_Imagery (accessed on 12 January 2018).
  58. Pfeffer, M. Distribution and design of Pacific octopus lures: The Hawaiian octopus lure in regional context. Hawaii. Archaeol. 1995, 4, 47–56. [Google Scholar]
  59. Barber, I.G.; Maxwell, J.J.; Hemi, R. Growing images: Generating 3D digital models to investigate archaeological Moriori carvings on live trees. World Archaeol. 2014, 46, 63–77. [Google Scholar] [CrossRef]
  60. Mulrooney, M.A.; Ladefoged, T.N.; Gibb, R.; McCurdy, D. Eight million points per day: Archaeological implications of laser scanning and three-dimensional modeling of Pu‘ukohola Heiau. Hawaii. Archaeol. 2005, 10, 18–28. [Google Scholar]
  61. Johnson, A. Shifting stones and data points: Using terrestrial laser scanning to assess damage to monumental architecture in Hawai‘i. In Proceedings of the Computer Applications and Quantitative Methods in Archaeology Conference, Atlanta, GA, USA, 14–16 March 2017. [Google Scholar]
  62. Foecke, T.; Ma, L.; Russell, M.A.; Conlin, D.L.; Murphy, L.E. Investigating archaeological site formation processes on the battleship USS Arizona using finite element analysis. J. Archaeol. Sci. 2010, 37, 1090–1101. [Google Scholar] [CrossRef]
  63. New Zealand Archaeological Association’s ArchSite: Archaeological Site Recording Scheme. Available online: www.archsite.org.nz (accessed on 12 January 2018).
  64. Mann, T.; Westphal, H. Assessing Long-Term Changes in the Beach Width of Reef Islands Based on Temporally Fragmented Remote Sensing Data. Remote Sens. 2014, 6, 6961–6987. [Google Scholar] [CrossRef]
  65. Kvamme, K.L. Integrating Multiple Geophysical Datasets. In Remote Sensing in Archaeology James Wiseman; El-Baz, F., Ed.; Springer: New York, NY, USA, 2006; pp. 345–374. [Google Scholar]
  66. Howey, M.C.L.; Brouwer Burg, M. Assessing the state of archaeological GIS research: Unbinding analyses of past landscapes. J. Archaeol. Sci. 2017, 84, 1–9. [Google Scholar] [CrossRef]
  67. McIvor, I.H.; Ladefoged, T.N. A multi-scalar analysis of Māori land use on Ahuahu (Great Mercury Island), New Zealand. Archaeol. Ocean. 2015, 51, 45–61. [Google Scholar] [CrossRef]
  68. Foody, G.M.; See, L.; Fritz, M.; van der Velde, M.; Perger, C.; Schill, C.; Boyd, D.S. Assessing the Accuracy of Volunteered Geographic Information arising from Multiple Contributors to an Internet Based Collaborative Project. Trans. GIS 2013, 17, 847–860. [Google Scholar] [CrossRef]
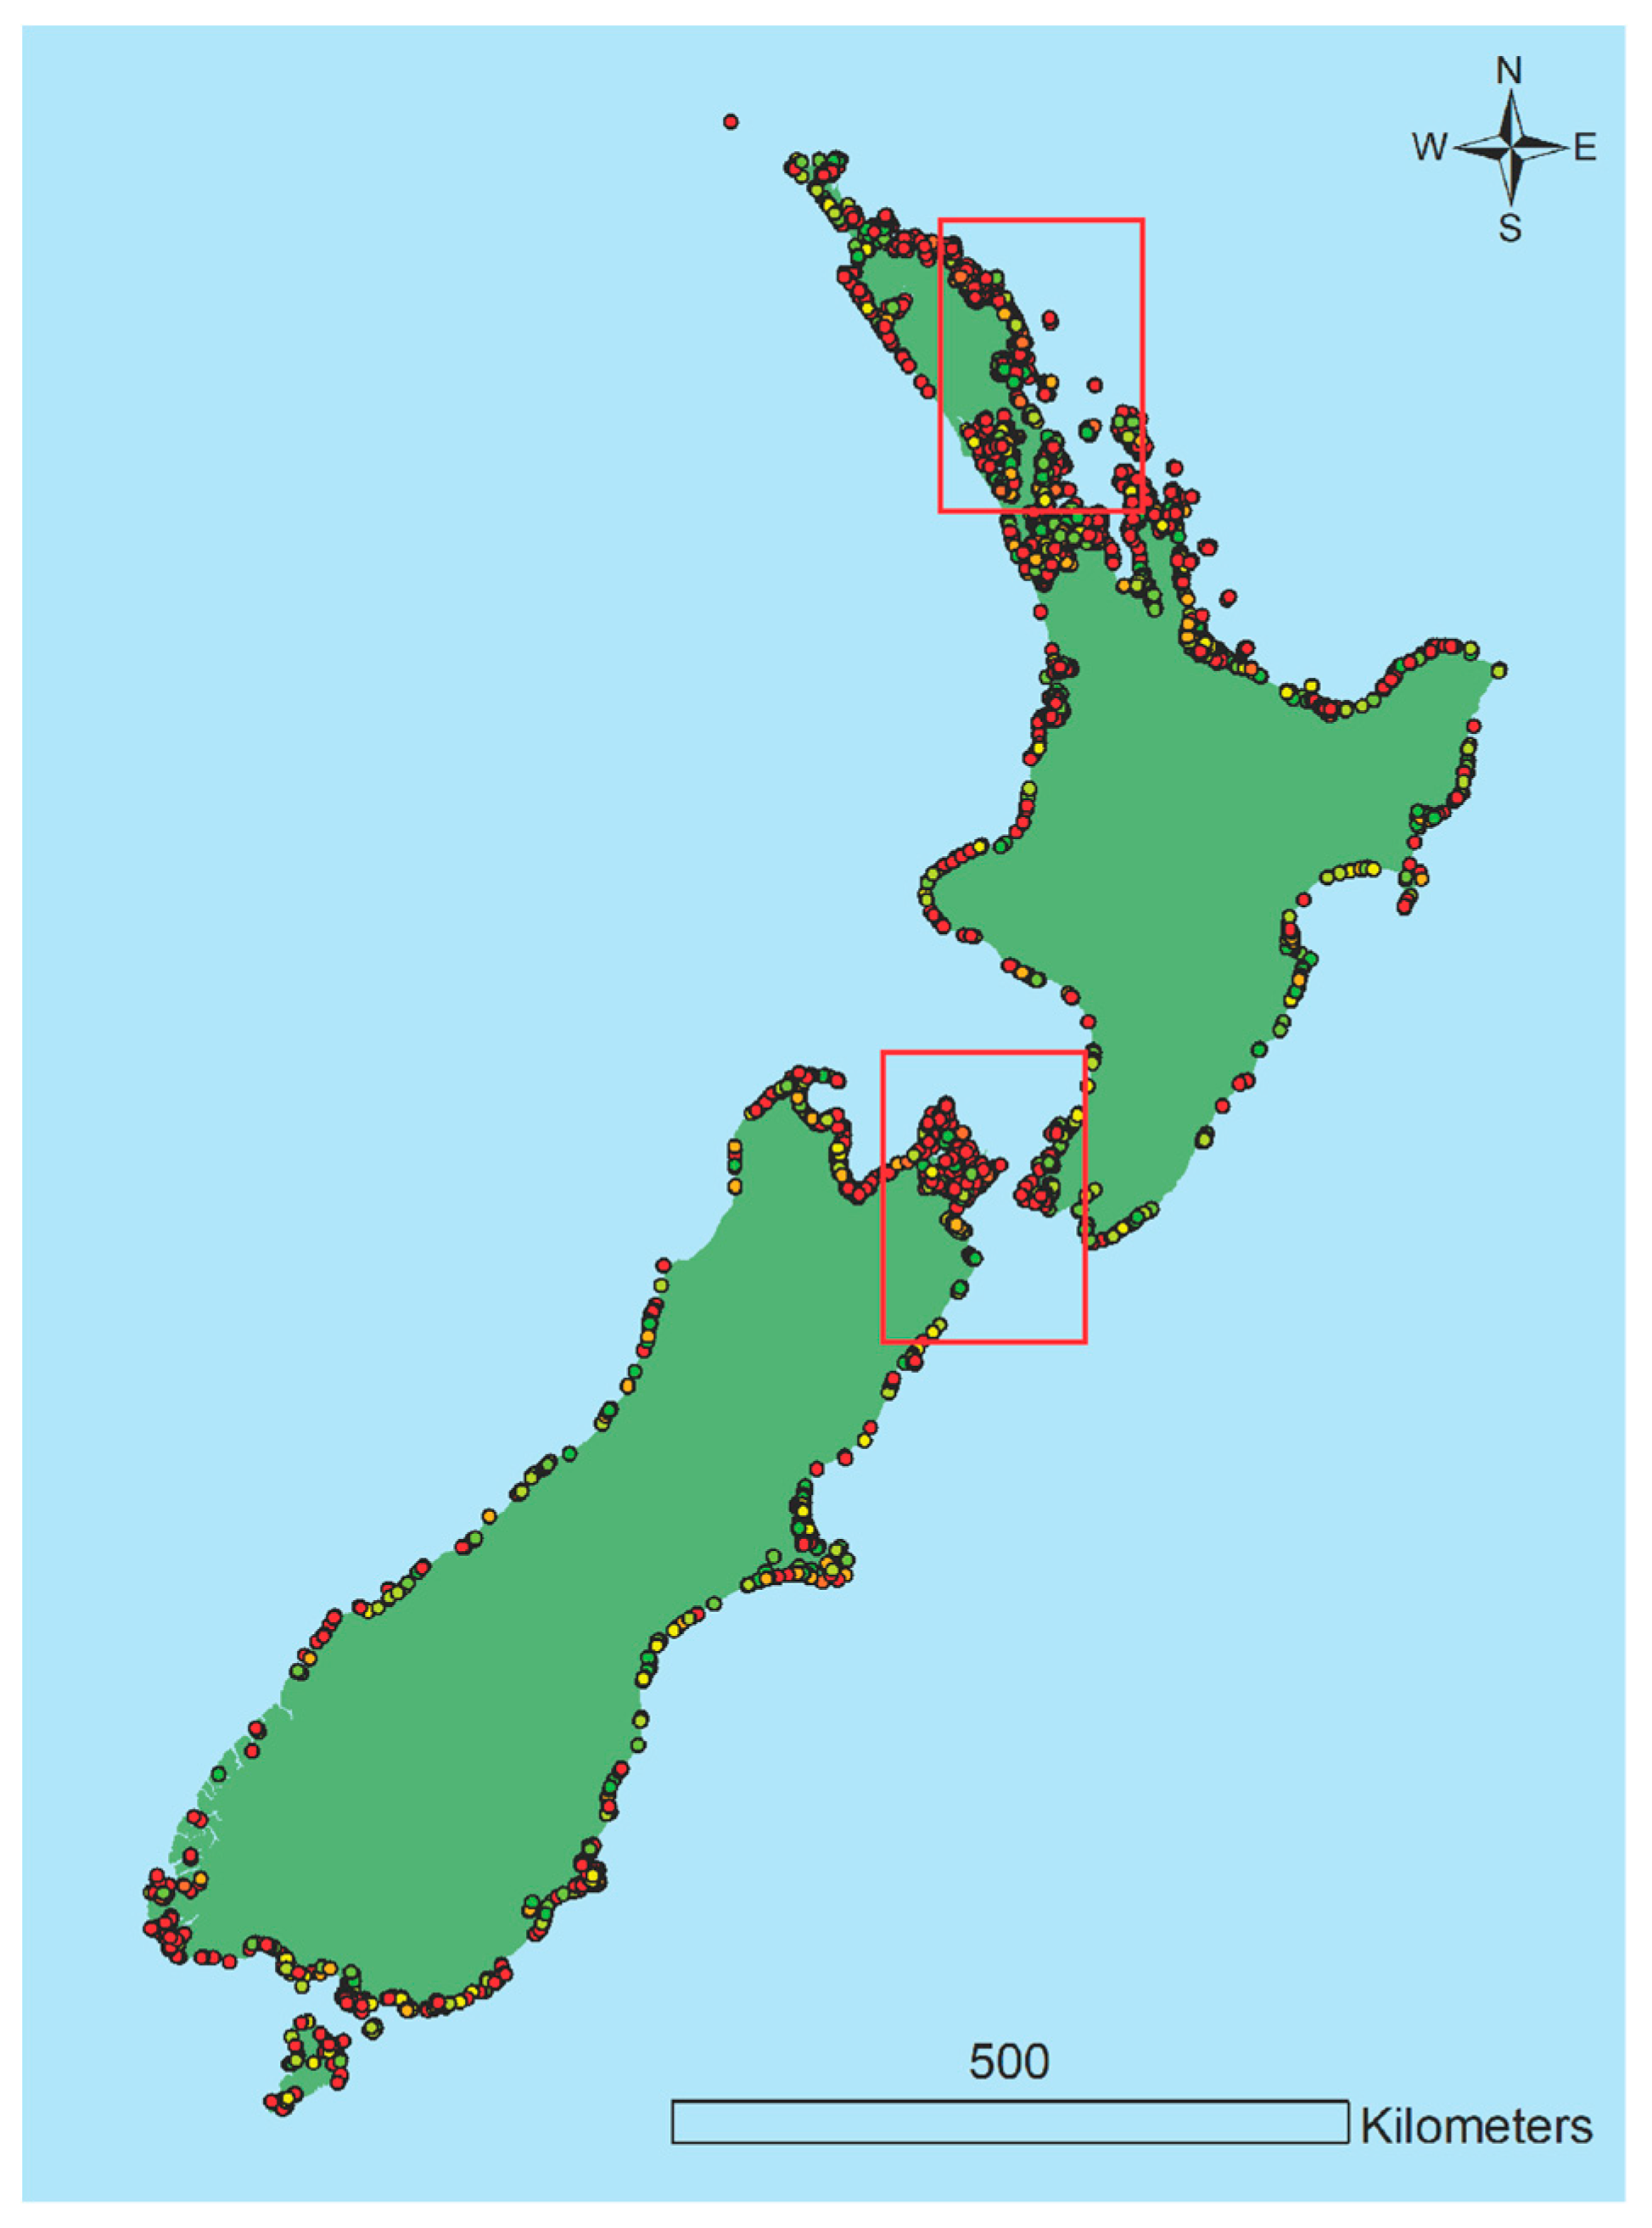
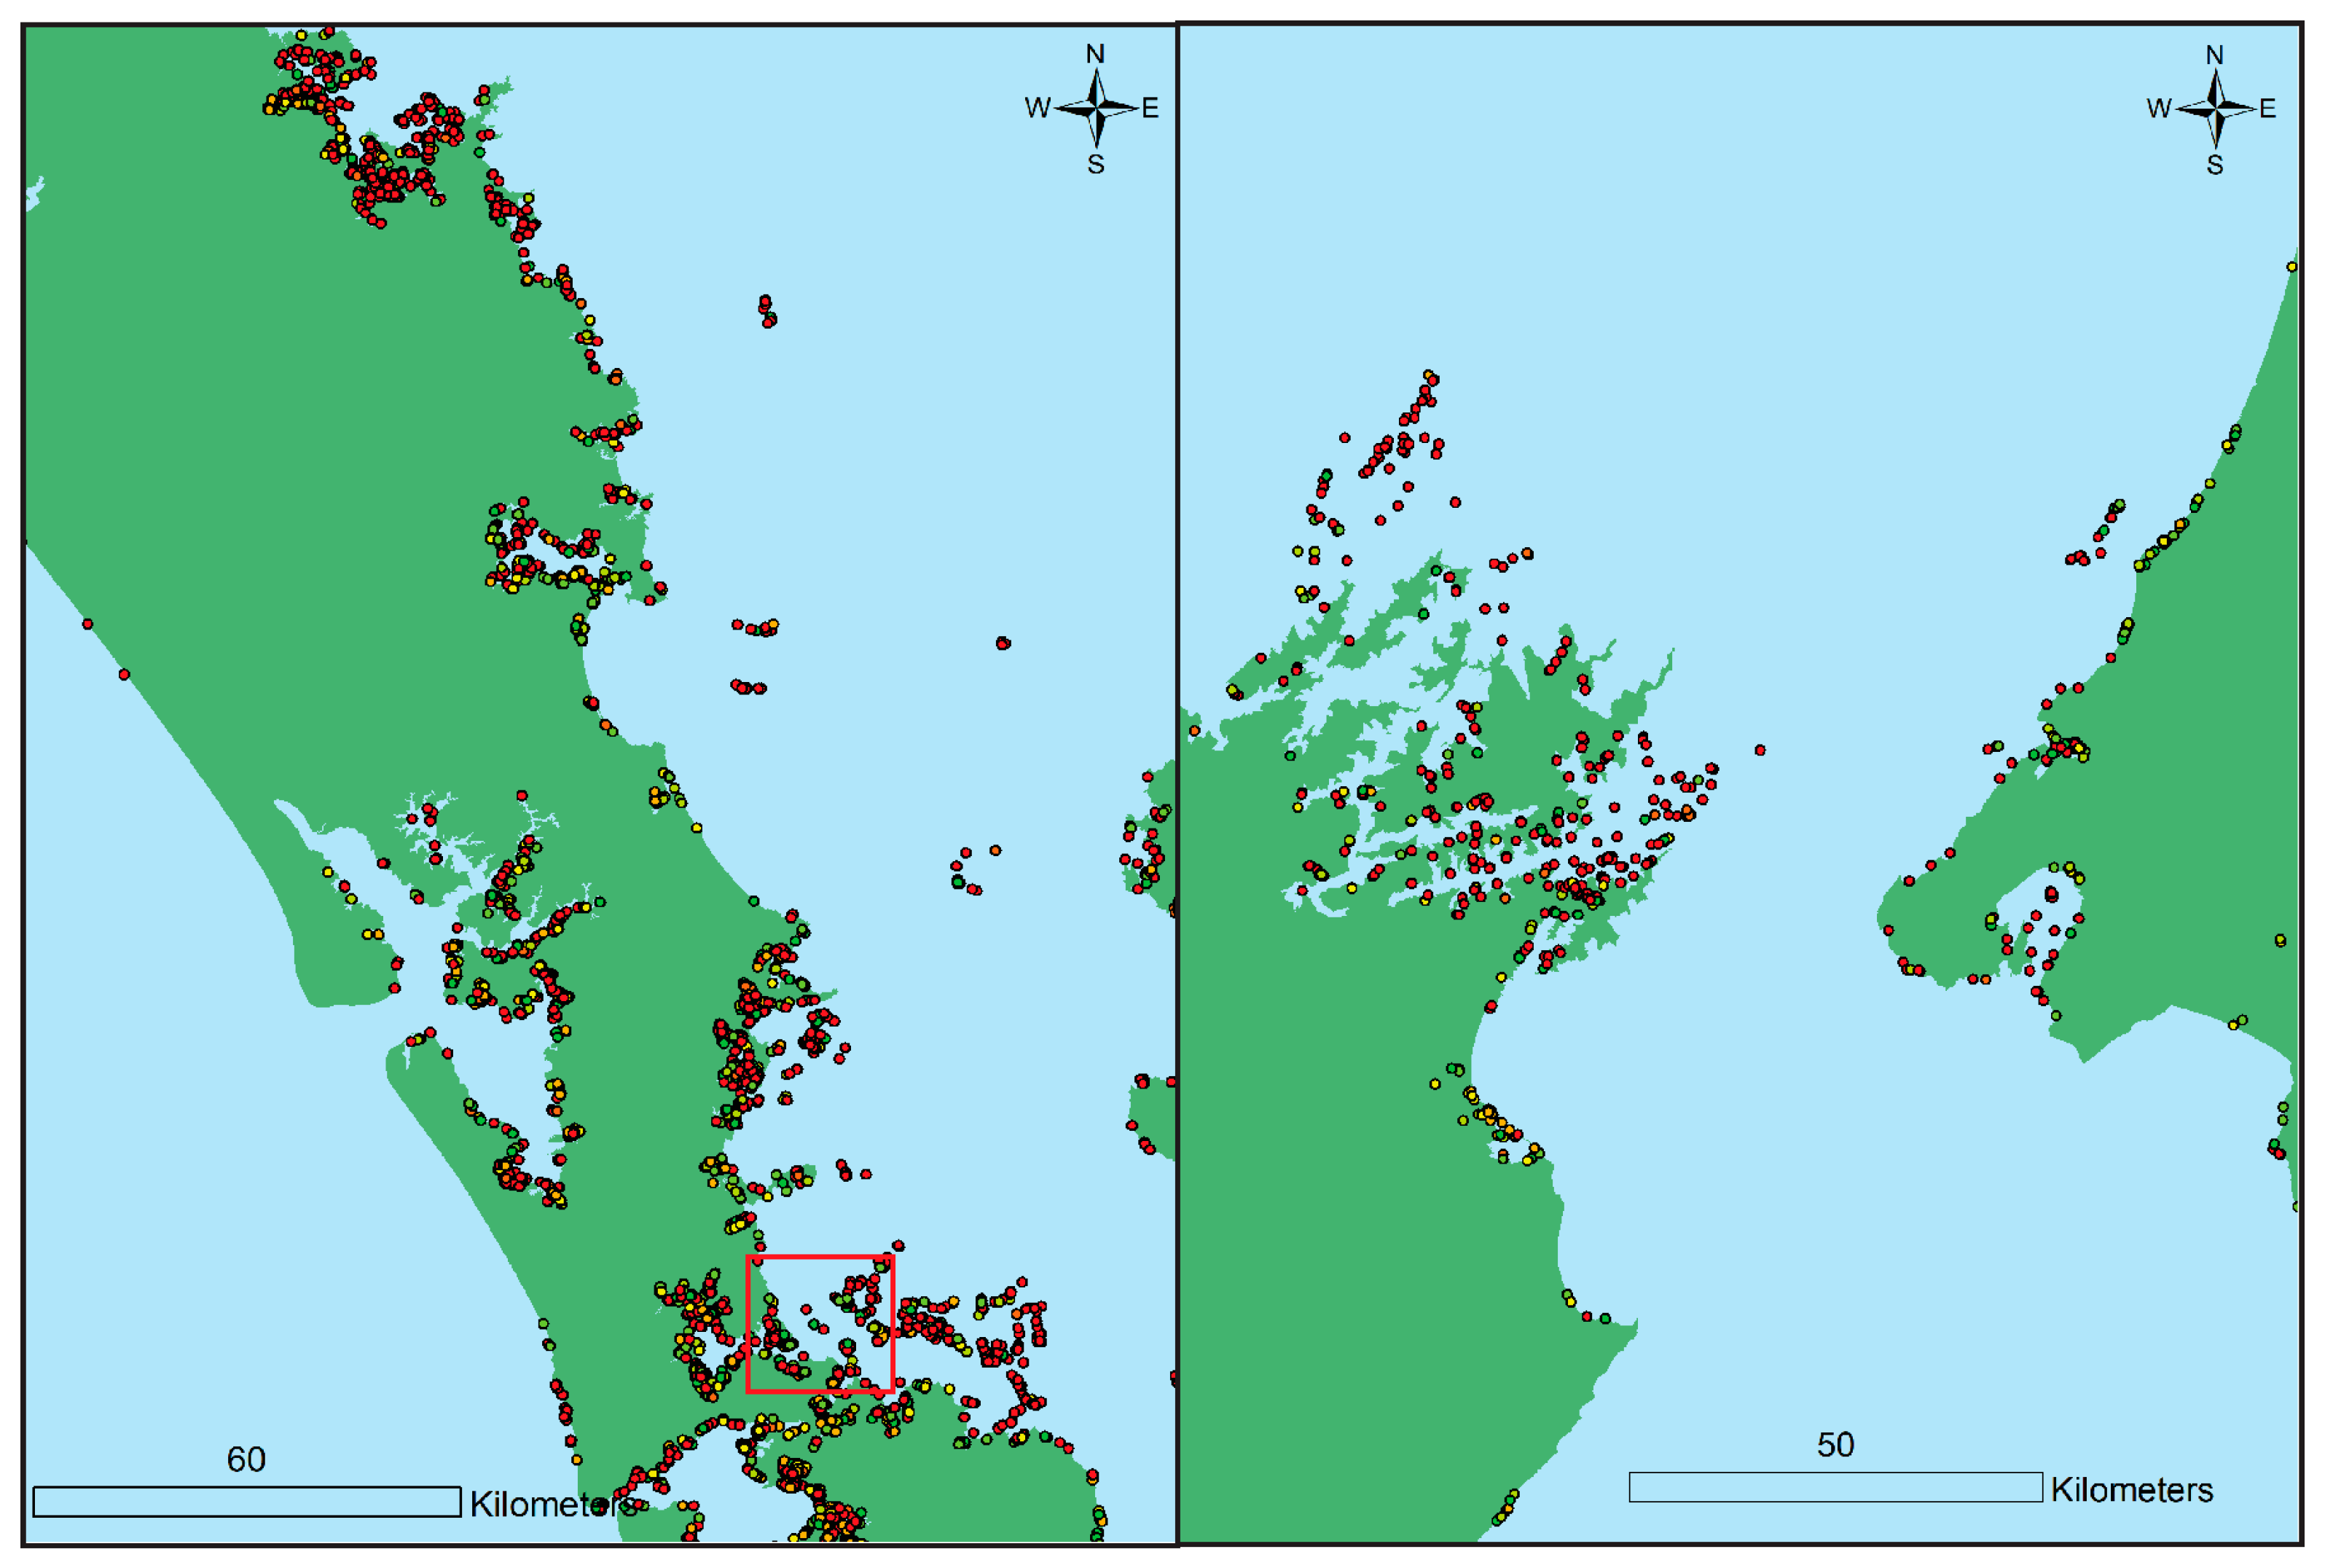
Figure 1. Locations of in the Pacific of Declassified Cold War Era Satellite Imagery. Blue line indicates the location of the islands of Polynesia. Source: EarthExplorer, USGS.
Sustainability 10 00185 g001
Figure 2. Example of declassified corona image from Rapa Nui (Easter Island, Chile). Taken on 29 October 1963. DS09059A031MC056. Source: EarthExplorer, USGS.
Sustainability 10 00185 g002
Figure 3. Applications of commercial-grade high-resolution imagery on Rapa Nui (Easter Island, Chile). These studies of Rapa Nui (a) mapped formal pathways for statue transport (b) and areas of likely gardening (c). Sources: [33,34].
Sustainability 10 00185 g003
Figure 4. Comparisons of rates of coastline change derived from historic imagery at Pelekane Beach and Ohalula Beach, Hawai‘i Island. These beaches show signs of accretion (Pelekane) and erosion (Ohalula). Source: [36].
Sustainability 10 00185 g004
Figure 5. Airborne LiDAR used to map various archaeological features in Polynesia. Examples show study areas in Hawaii (a,b), Tonga (c) and Samoa (d).
Sustainability 10 00185 g005
Figure 6. Airborne LiDAR used to model future sea level rise at Hōnaunau, Hawai‘i. Source: [18].
Sustainability 10 00185 g006
Figure 7. Geophysical survey in New Zealand. In this example, an early settlement layout defined by geophysical survey and test excavated. Source: [49].
Sustainability 10 00185 g007
Figure 8. Geophysical survey in Hawai‘i and Samoa. In these examples, buried architectural features were suspected, located by geophysical survey, and excavated. See text for description of studies.
Sustainability 10 00185 g008
Figure 9. Examples of pre-European contact–era sites in shallow water, Hawai’i. Examples of temple sites (b), fishponds (a,c), and survey aimed at using remote sensing (AD). Sources: Google Earth, [57].
Sustainability 10 00185 g009
Figure 10. Photogrammetric 3D model of moai statues from Rapa Nui (Easter Island). This includes a moai in the British Museum (top) and photos taken on tours (bottom). Source: Sketchfab. Models by James Miles and Barthelemy dAns—Planetarium.
Sustainability 10 00185 g010
Figure 11. Handheld 3D laser scan of carvings on a coastal stand of trees, Chatham Islands. See [56] for interpretation of results. Source: [56].
Sustainability 10 00185 g011
Figure 12. Tripod-mounted terrestrial 3D laser scan of temple architecture, Pu‘ukohala Heiau, Hawai‘i Island. Sources: Google Earth, [60].
Sustainability 10 00185 g012
Figure 13. Tripod-mounted terrestrial 3D laser scan of moai. Source: CyArk.
Sustainability 10 00185 g013
Figure 14. Computer model of the USS Arizona with projected decay of structure. Source: [62].
Sustainability 10 00185 g014
Figure 15. New Zealand’s ArchSite database. Open access version shown.
Sustainability 10 00185 g015
Figure 16. Comparison of ArchSite with public data on Hillforts. Note that even in coastal locations that the professional database out performs in the location of hillforts. Source: [41].
Sustainability 10 00185 g016
Figure 17. New Zealand’s coastal sites likely to be impacted by sea level rise (25 m resolution digital elevation model (DEM)).
Sustainability 10 00185 g017
Figure 18. Major areas of impacts to coastal sites, New Zealand. (25 m resolution DEM). Red box shows extent of Figure 19a.
Sustainability 10 00185 g018
Figure 19. Sea level rise modeling with higher resolution digital elevation model (8 m resolution DEM). Map of detailed study area (a) shows sites at risk. If we assume that the 8 m resolution DEM provides a better estimate of the position of sites relative to current sea level, than it would appear the 25 m DEM performed well (b).
Sustainability 10 00185 g019
Figure 20. Example of highest current resolution digital elevation model. This site location is shown relative to 1 m resolution DEM (LiDAR) compared with 8 m resolution DEM. On 25 m resolution DEM, this site is estimated to be at sea level.
Sustainability 10 00185 g020
Table 1. Estimated number of archaeological sites impacted by projected sea level rise (After [16]). Elevations derived from 25 m resolution DEM (LINZ).
Elevation (m asl)Archaeological Sites (n = )Archaeological Sites (% Total Sites)Map Symbol
Less than 042086.1%Red
0–110961.6%Orange
1–29951.5%Yellow
2–39511.4%Yellow-Green
3–410431.5%Light Green
4–511371.7%Green

