Article

Incorporating Road User Costs into Integrated Life-Cycle Cost Analyses for Infrastructure Sustainability: A Case Study on Sr-91 Corridor Improvement Project (Ca)

1
Graduate School of Engineering Mastership, Pohang University of Science and Technology (POSTECH), 77 Cheongam-Ro, Nam-Ku, Pohang 37673, Korea
2
SR-91 Corridor Improvement Project, Riverside County Transportation Commission, CA 92879, USA
3
Construction Engineering and Management, Department of Civil, Environmental and Architectural Engineering, University of Colorado, Boulder, CO 80203, USA
*
Author to whom correspondence should be addressed.
Sustainability 2018, 10(1), 179; https://doi.org/10.3390/su10010179
Submission received: 31 December 2017 / Revised: 9 January 2018 / Accepted: 10 January 2018 / Published: 12 January 2018

Abstract

:
Life-cycle cost analysis (LCCA) is a decision-making tool that allows governing agencies the ability to assess several long-term alternative investment options. This paper presents a LCCA analysis process which integrates the Federal Highway Administration (FHWA) program, RealCost (a road user cost calculation program), the FHWA-endorsed Construction Analysis for Pavement Rehabilitation Strategies (CA4PRS) and Caltrans specific design tools (CalFP and CalAC), into the existing Caltrans LCCA process (a modified version of the FHWA LCCA process). In using tools backed by the FHWA and validated through previous agency use, the presented process has a potential to be replicated on urban corridor improvement projects across the US while aiding agencies in achieving economical sustainability throughout the infrastructure maintenance phases. This paper also fills the gap identified by Ozbay et al. in 2004, incorporating road user cost calculations into the LCCA process. Validation was achieved through the execution of the recently completed $1.4 B US California SR-91 Corridor Improvement Project. The SR-91 team used the presented tool to choose one of the two alternatives (maintain HOV SR-91 lane and add I-15 HOV lane using long-life Portland Cement Concrete Pavement or add Express Lane to SR-91 and I-15 using long-life Continuously Reinforced Concrete Pavement and Asphalt Concrete Pavement), equating to an estimated life-cost savings of $32 M.

1. Introduction

The American Society of Civil Engineers have estimated a $825 billion backlog of highway and bridge capital needs for the US infrastructure [1]. With this backlog, it is important for state agencies to maximize value gained by making decisions that result in efficiently spending present and future taxpayer dollars. One such process used by agencies that ensures efficient, long-term government spending is the Life-Cycle Cost Analysis (LCCA). Through a case study of the Riverside, California SR-91 Corridor Improvement Project (SR-91 CIP) widening and rehabilitation project, the following paper presents the use of the Construction Analysis for Pavement Rehabilitation Strategies (CA4PRS) program to incorporate road user and agency costs into a modified US Federal Highway Administration (FHWA) LCCA process, incorporating pavement design tools (such as CalFP, CalAC and RealCost software).
One of the main focuses within this paper is the inclusion of an accurate and cost-effective road user cost (RUC) calculation process. Road user costs are the estimated daily costs to the traveling public resulting from construction work being performed (primarily referring to the costs associated with the added road user travel time). These costs were identified as one of the major gaps between identified best practices and agencies’ actual practices [2]. Flannery et al. [3] found that only 40% of agencies include RUCs even though monitoring these costs constitute as “one of the great advances in public-sector infrastructure management and decision making.” Similarly, existing LCCA literature includes only limited discussions of mitigating the complexity of the RUCs. Those that do discuss RUCs do not incorporate said models into the FHWA suggested LCCA process [4,5,6,7]. This paper attempts to fill the gap between literature’s LCCA best practices and industry’s implementation, the lack of RUC [2]. It also contributes to the current body of knowledge by presenting an alternative LCCA model than previous literature [4,5,6] and enhances the LCCA model presented by Lee et al. [7], incorporating it within the FHWA eight-step suggested LCCA process. In incorporating the presented model into existing processes and validating its effectiveness through SR-91 CIP industry implementation, this paper’s findings can be replicated by transportation agencies across the US and other urban regions with potentially similar cost savings.

2. Life Cycle Cost Analysis

LCCA is an analytical technique that uses economic principles to evaluate long-term alternative investment options for highway construction. This process has been an integral part of agencies’ decision-making process for selecting different pavement types, rehabilitation strategies and pavement design life for many years [8]. It was ushered into the transportation domain in the 1960s through the works of engineering economist Winfrey and the American Association of State Highway and Transportation Officials (AASHTO) “Red Book” [9,10]. In the 1980’s the federal government endorsed the use of LCCA as a means for economic evaluation [11] and presented LCCA state-of-practices in transportation agencies [12]. The 1992 Intermodal Surface Transportation Equity Act suggested LCCA be considered in highway construction and the National Highway System Designation Act of 1995 mandated its use on projects larger than $25 million in value [8].
Although the mandated use of LCCA was rescinded by the USA 1998 Transportation Equity Act for the 21st Century (TEA-21) [8], using LCCA as a decision support tool is still advocated by the FHWA. This is depicted through the FHWA publications such as the LCCA in Pavement Design Participant’s Notebook [13], Interim Technical Bulletin [14], Life-Cycle Analysis Primer [8], NCHRP Report 703 on Pavement-Type Selection [15], NCHRP Report 483 on Bridge LCCA [16] and NCHRP Synthesis 494 on highway LCCA practices [3]. These documents have successfully promoted the use of LCCA and provide guidance to agencies as described below.

2.1. US Federal LCCA Process for Highway Construction

The FHWA LCCA suggested practices have been disseminated to state agencies through publications previously listed. The first step in the LCCA process is the decision to perform an LCCA. TEA-21 requires value engineering be performed for all projects over $25 million and recommend that LCCA be a part of the value engineering reviews, though it is not currently mandated [8]. Once the decision is made to pursue LCCA, it must be conducted as early as possible, FHWA suggests during the project design stage [14].
The inputs for a pavement design LCCA are very robust and typically include but are not limited to, the following: discount rate; annual growth rate of traffic; free flow capacity; value of time for passenger cars, single unit trucks and combination trucks; agency construction and maintenance costs; user work-zone costs, work-zone capacity and work-zone duration; maintenance frequency; activity service life; and uncertainty/risk data as applicable [3]. Once a project is selected for LCCA, FHWA’s suggested process has eight steps: (1) establish alternative pavement design strategies; (2) determine performance periods and activity timing; (3) estimate agency costs; (4) estimate RUCs; (5) develop expenditure diagrams; (6) compute net present value; (7) analyze results; and (8) reevaluate strategies [14].

2.2. Life-Cycle Cost Analysis Existing Literature

Efforts have been made to document LCCA state-of-practice for highway construction across the US (i.e., Peterson [12], Zimmerman et al. [17], Ozbay et al. [2], Rangaraju et al. [18], Babashamsi et al. [19], Flannery et al. [3]) though implementation still varies significantly from state to state. To aid agencies in their LCCA implementation, existing literature has also been dedicated to optimizing the process models. Early research in pavement LCCA was dedicated to proposing models that analyzed pavement life-cycle costs [9] and optimized life-cycle disutility, the ratio of costs and performance [20]. Research has continued to build upon the foundational LCCA models, adding uncertainty-based approaches to handle the input variabilities and project risks [21,22,23,24] and incorporating variables such as energy consumption and greenhouse gas emissions in the analysis Zhang et al. [25]. Despite literature’s attempt to aid agencies, in an investigation of the differences between state-of-practice and state-of-art, Ozbay et al. [2] found several gaps between the theoretical and actual LCCA applications including the treatment of uncertainty, timing of future rehabilitation activities and the inclusion of RUCs.
The issue of the inclusion of RUCs into the LCCA process is echoed throughout literature. Calculation of RUCs is the area that agencies are most significantly lacking in their LCCAs (Peterson [12], Walls and Smith [14], Papagiannakis and Delwar [4], Ozbay et al. [2], Yu et al. [6], Morgado and Neves [25], Babashami et al. [19], Flannery et al. [3]. Existing literature also depicts between 50% to 70% of agencies are not incorporating RUCs in their LCCA analysis [2,3]. There is some contention that RUCs hinder the LCCA process [25] but literature generally agrees that RUC are required for an accurate LCCA. The NCHRP Synthesis 494 goes as far as to say that “one of the great advances in public-sector infrastructure management and decision making has been the more widespread assessment and inclusion of RUCs …” [3].
Morgado and Neves’s [25] contention of RUC comes from the finding that on highly trafficked roads, RUCs can often be the determining factor in choosing a project, negating the true purpose of the LCCA. To combat this, both Morgado and Neves [25] and Heravi and Esmaeeli [26] introduced multi-criteria decision tools into pavement LCCA that weighs, among other attributes, RUCs. Alternatively, Papagiannakis and Delwar [4], Zheng et al. [5], Yu et al. [6] and Lee et al. [7] developed models that incorporated RUC models into highway agency decision-analyses, especially converting RUC to agency costs equivalent with some discount-factors. Papagiannakis and Delwar [4] presented one of the early computer software programs, outputting the net annualized savings in RUCs from reducing pavement roughness. Zheng et al. [5] incorporated two RUC tools, MicroBENCOST and HDM-4, RUC tools, into the current Canadian asset management system and compared their ability to output RUC-benefit analyses. Yu et al. [6] also presented incorporating work-zone RUCs into China LCCA cost models, relying on agency computations versus software for costs and impacts. Lee et al. [7] presented the use of RealCost and CA4PRS as LCCA tools, validated through the California Interstate 710 Project in Long-Beach (Phase 1), the 1st long-life ACP reconstruction in California.
All these are important additions to the current body of LCCA highway pavement design literature though none properly discuss RUCs integration into the current agency LCCA process. Both Morgado and Neves [25] and Heravi and Esmaeeli [26] attempt to mitigate road user impacts through multi-decision analyses yet do nothing to increase the RUCs accuracies. Papagiannakis and Delwar [4] present a maintenance/rehabilitation decision tool but do not incorporate it into the existing highway LCCA. Zheng et al. [5] review two RUC estimation processes but incorporate them into a benefit-cost analysis not the LCCA process with NPV (net present value) calculation and merely focus more on the comparison of the two models than their use as a LCCA tool. Yu et al. [6] work is meant for Chinese implementation and not state-of-the art in the US. Lee et al. [7] present the use of RealCost and CA4PRS to perform a LCCA but fail to present how it is incorporated into the existing highway construction LCCA process.
The integrated model presented is a contribution to the LCCA body of literature in mitigating RUC inaccuracies through state-of-the-art programs, backed by the FHWA and already in use for many agencies. Unlike previous LCCA literature, this model was also validated through implementation into a working project from the scoping phase. This paper builds off Lee et al. [7] existing research, by integrating the existing suggested FHWA LCCA process.

3. Research Objectives and Methods

The objective of this paper is to develop a LCCA process that can be easily integrated into existing agency practices, accurately and aptly estimating and incorporating RUCs into the final valuation on urban corridor improvement projects for sustainable maintenance. To address this objective, the researchers: (1) chose an apt highway improvement project, (2) performed a review of agency LCCA processes, (3) integrated state-of-the-art design, RUC and LCCA analysis programs and (4) validated the LCCA process with a recommendation for alternative selection through the chosen project.

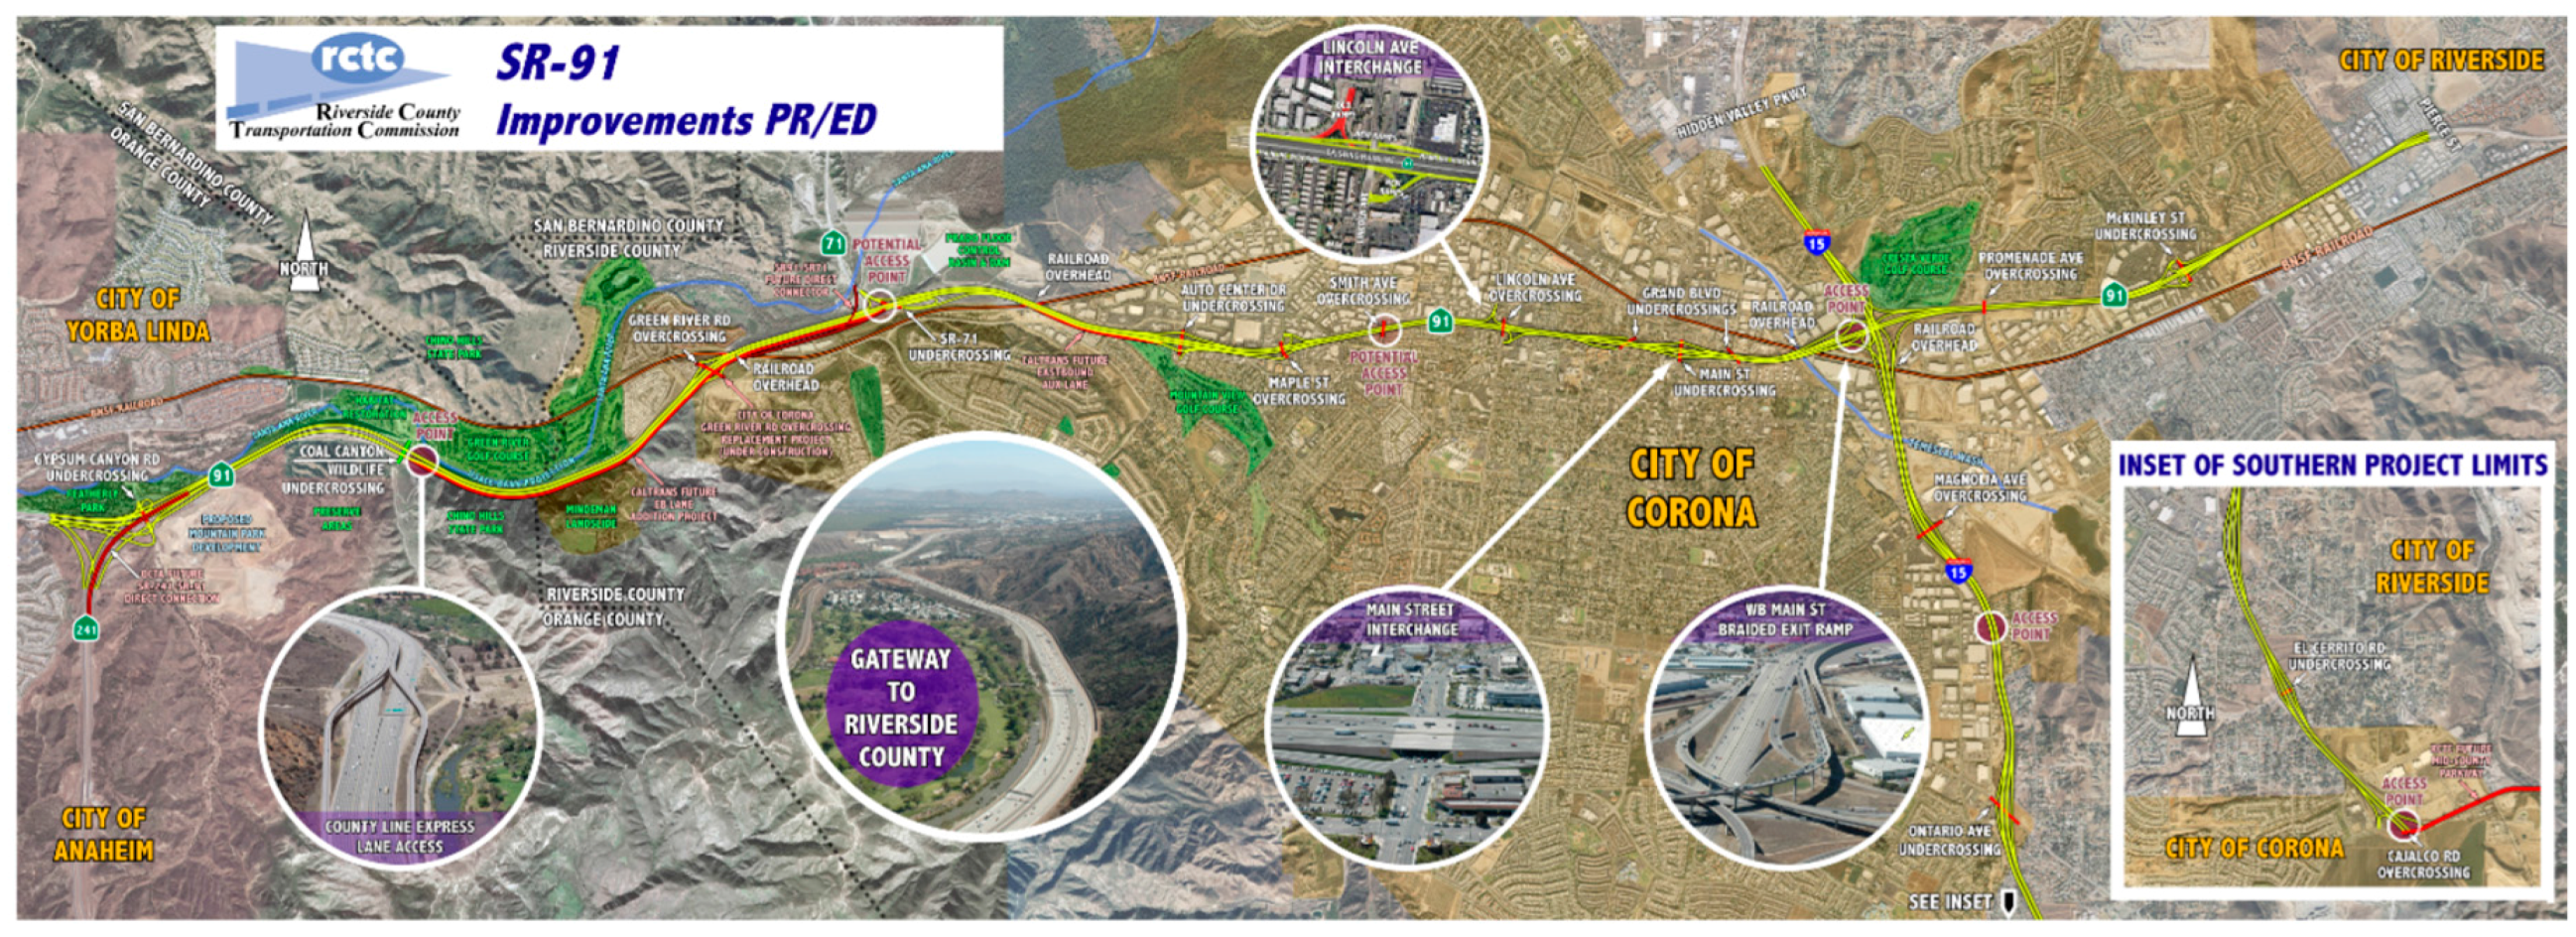
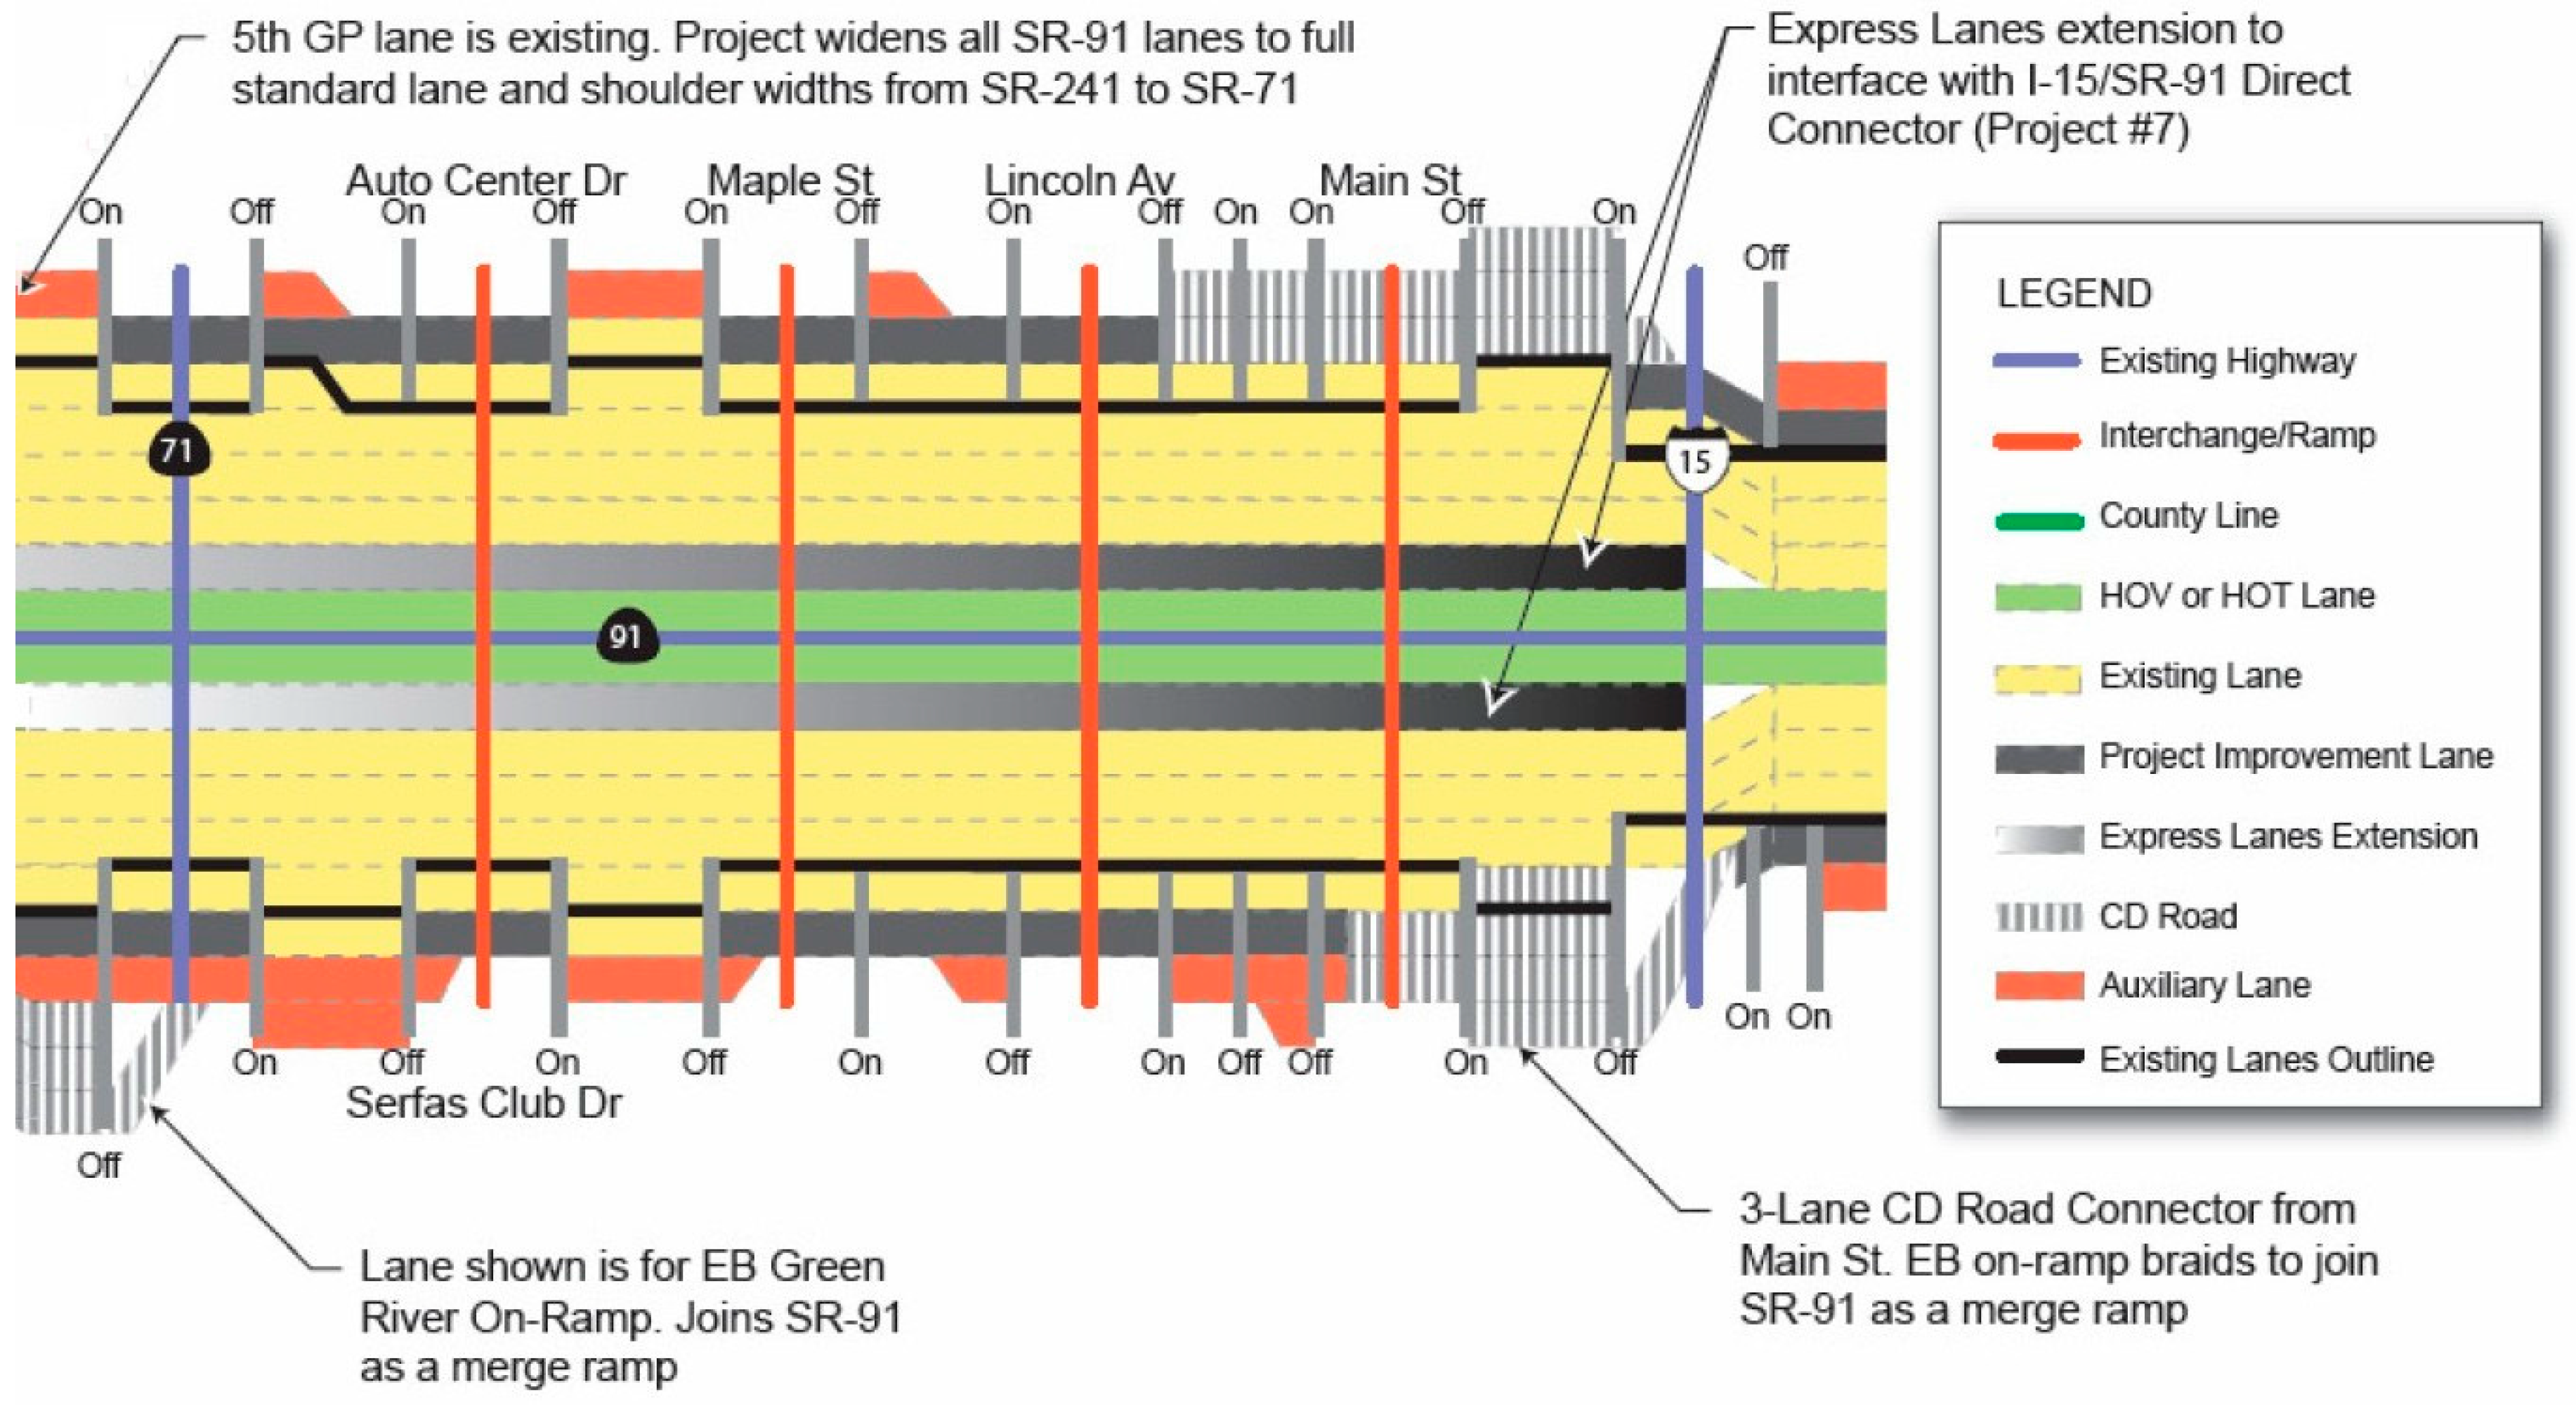
3.1. Choosing a Project: SR-91 Corridor Improvement Project

The authors sought out a project within an agency with experience using both RealCost and CA4PRS (use is defended below), with large RUC impacts in urban corridor network, with multiple, viable and dissimilar design alternatives and in the scoping phase of project development. The project chosen for this study was the SR-91 CIP which met all requirements: it’s within the State of California who has extensive experience with both RealCost and CA4PRS programs, has significant RUCs with an annual average daily traffic (AADT) over 250,000, identified three alternatives (including the no build alternative) and had a project initiation document phase that coincided with the beginning of this study [27].
The SR-91 CIP is in Orange and Riverside Counties, southern California along SR-91 from the junction of SR-91 and State Route 241 to the junction of SR-91 and Pierce Street in Riverside County, including the connections to Interstate 15 (I-15) in Riverside County. The project also includes a study area on I-15, which begins at Cajalco Road, approximately 5 miles south of SR-91 and extends to Hidden Valley Parkway, approximately 1 mile north of SR-91. The LCCA shown in this paper excludes right of way, earthwork and structures [27]. The SR-91 CIP graphical layout can be seen in Figure 1.
Two design alternatives were considered for SR-91 CIP. Alternative 1 included adding one general purpose (GP) lane in each travel direction along SR-91 while maintaining the existing High Occupancy Vehicle (HOV) lane on SR-91 and adding HOV connector to I-15 both using Portland Cement Concrete Pavement. Alternative 2 included adding one GP lane, replacing the existing HOV lane to tolled Express Lane using Continuously Reinforced Concrete Pavement and adding Express Lane connectors to I-15 using Asphalt Concrete Pavement. This paper only discusses partial scope and the estimated cost for the complete SR-91 CIP scope ranged between $1.0 to $1.5 billion with an expected construction of 2012 to 2016 [28]. SR-91 CIP roadway sections with typical lane configuration is illustrated in Figure 2.

3.2. LCCA Process in California Practice

Caltrans (California Department of Transportation) has adopted an LCCA process that is slightly modified from the FHWA process described above. Caltrans requires LCCA be performed on all projects that include pavement installation with few exceptions, defined by the Highway Design Manual (HDM) Topics 612 and 619 [29]. Like the FHWA, Caltrans practice is to perform the LCCA early in the process, both at the scoping of a project and during the Project Approval/ Environmental Document (PA/ED) phase. For this paper, the findings will be presented using the Caltrans LCCA process, which is state-specifically customized with more detailed guidelines, defined below [30]:
Step 1:
Define Pavement Alternatives: the LCCA begins with the selection of pavement alternatives that will accomplish the same performance objectives for a project. The Caltrans LCCA manual includes decision tree flowcharts to guide selection of pavement alternatives but are not shown here as it is outside the purview of this research.
Step 2:
Analysis Period is the duration in which the initial and future costs for project alternatives will be evaluated. FHWA’s Policy recommends at least 35 years [14]. Caltrans uses 20 years for Capital Preventive Maintenance (CAPM) projects, 35 years for a 20-year design life and 55 years for any design life longer than 20 years with the analysis period chosen based on the longest design life of alternatives.
Step 3:
Traffic Data needed to conduct LCCA are as follows: construction year AADT, total truck percentage, 2-axle percentage truck AADT, annual growth rate of traffic percentage, traffic index and lane closure chart. The Caltrans Traffic Data Branch website is used for the traffic demand and truck percentage for the calculation of the Traffic Index (TI) for the pavement design [31].
Step 4:
Discount Rate is the interest rate by which future dollars are converted to present value. FHWA recommends 3% to 5% [14] and Caltrans 4% [30].
Step 5:
Future Maintenance and Rehabilitation (M&R) Schedules identify the sequence and timing of future activities that are required to maintain and rehabilitate the pavement over the analysis period. For Caltrans, the M&R schedules are pre-defined within their manual and chosen based on the project and maintenance characteristics. Interim maintenance treatments between each scheduled major activity are converted into an annualized routine maintenance cost in dollars per lane mile for step 6.
Step 6A:
Agency Costs are initial, maintenance, rehabilitation, support and service life costs. There is an Agency Cost module in the CA4PRS program which is used to validate cost estimates for initial costs and future maintenance and rehabilitation costs.
Step 6A.1:
Initial Construction Costs: for each design alternative, the initial construction costs are determined from the engineer’s estimate. Construction costs for mainline and shoulder pavement, base and subbase, joint seals, earthwork and time-related overhead should be included. All non-pavement (i.e., traffic, drainage, specialty, storm water protection), add-on (i.e., minor, supplemental, mobilization, contingencies) and project support costs are not included in the LCCA per policy. Construction costs that will not change between alternatives may be excluded if those costs can be separated from the rest of the estimate.
Step 6A.2:
Maintenance Costs include costs for routine, preventative and corrective maintenance. Caltrans uses annualized maintenance costs per historical, project-backed data and maintenance activities based on “Pavement M&R Decision Trees” prepared by each district and depicted in the LCCA manual.
Step 6A.3:
Rehabilitation Costs include costs for all the necessary appurtenance work for drainage, safety and other features.
Step 6A.4:
Future Support Costs should be estimated based on the costs identified in the proposed future activity for each alternative. The RealCost Version 2.5-CA program has a default Agency Support Cost Multiplier for these costs.
Step 6A.5:
Remaining Service Life Costs is activities whose service life exceed the analysis period and are calculated by prorating the user/agency costs of the activity.
Step 6B:
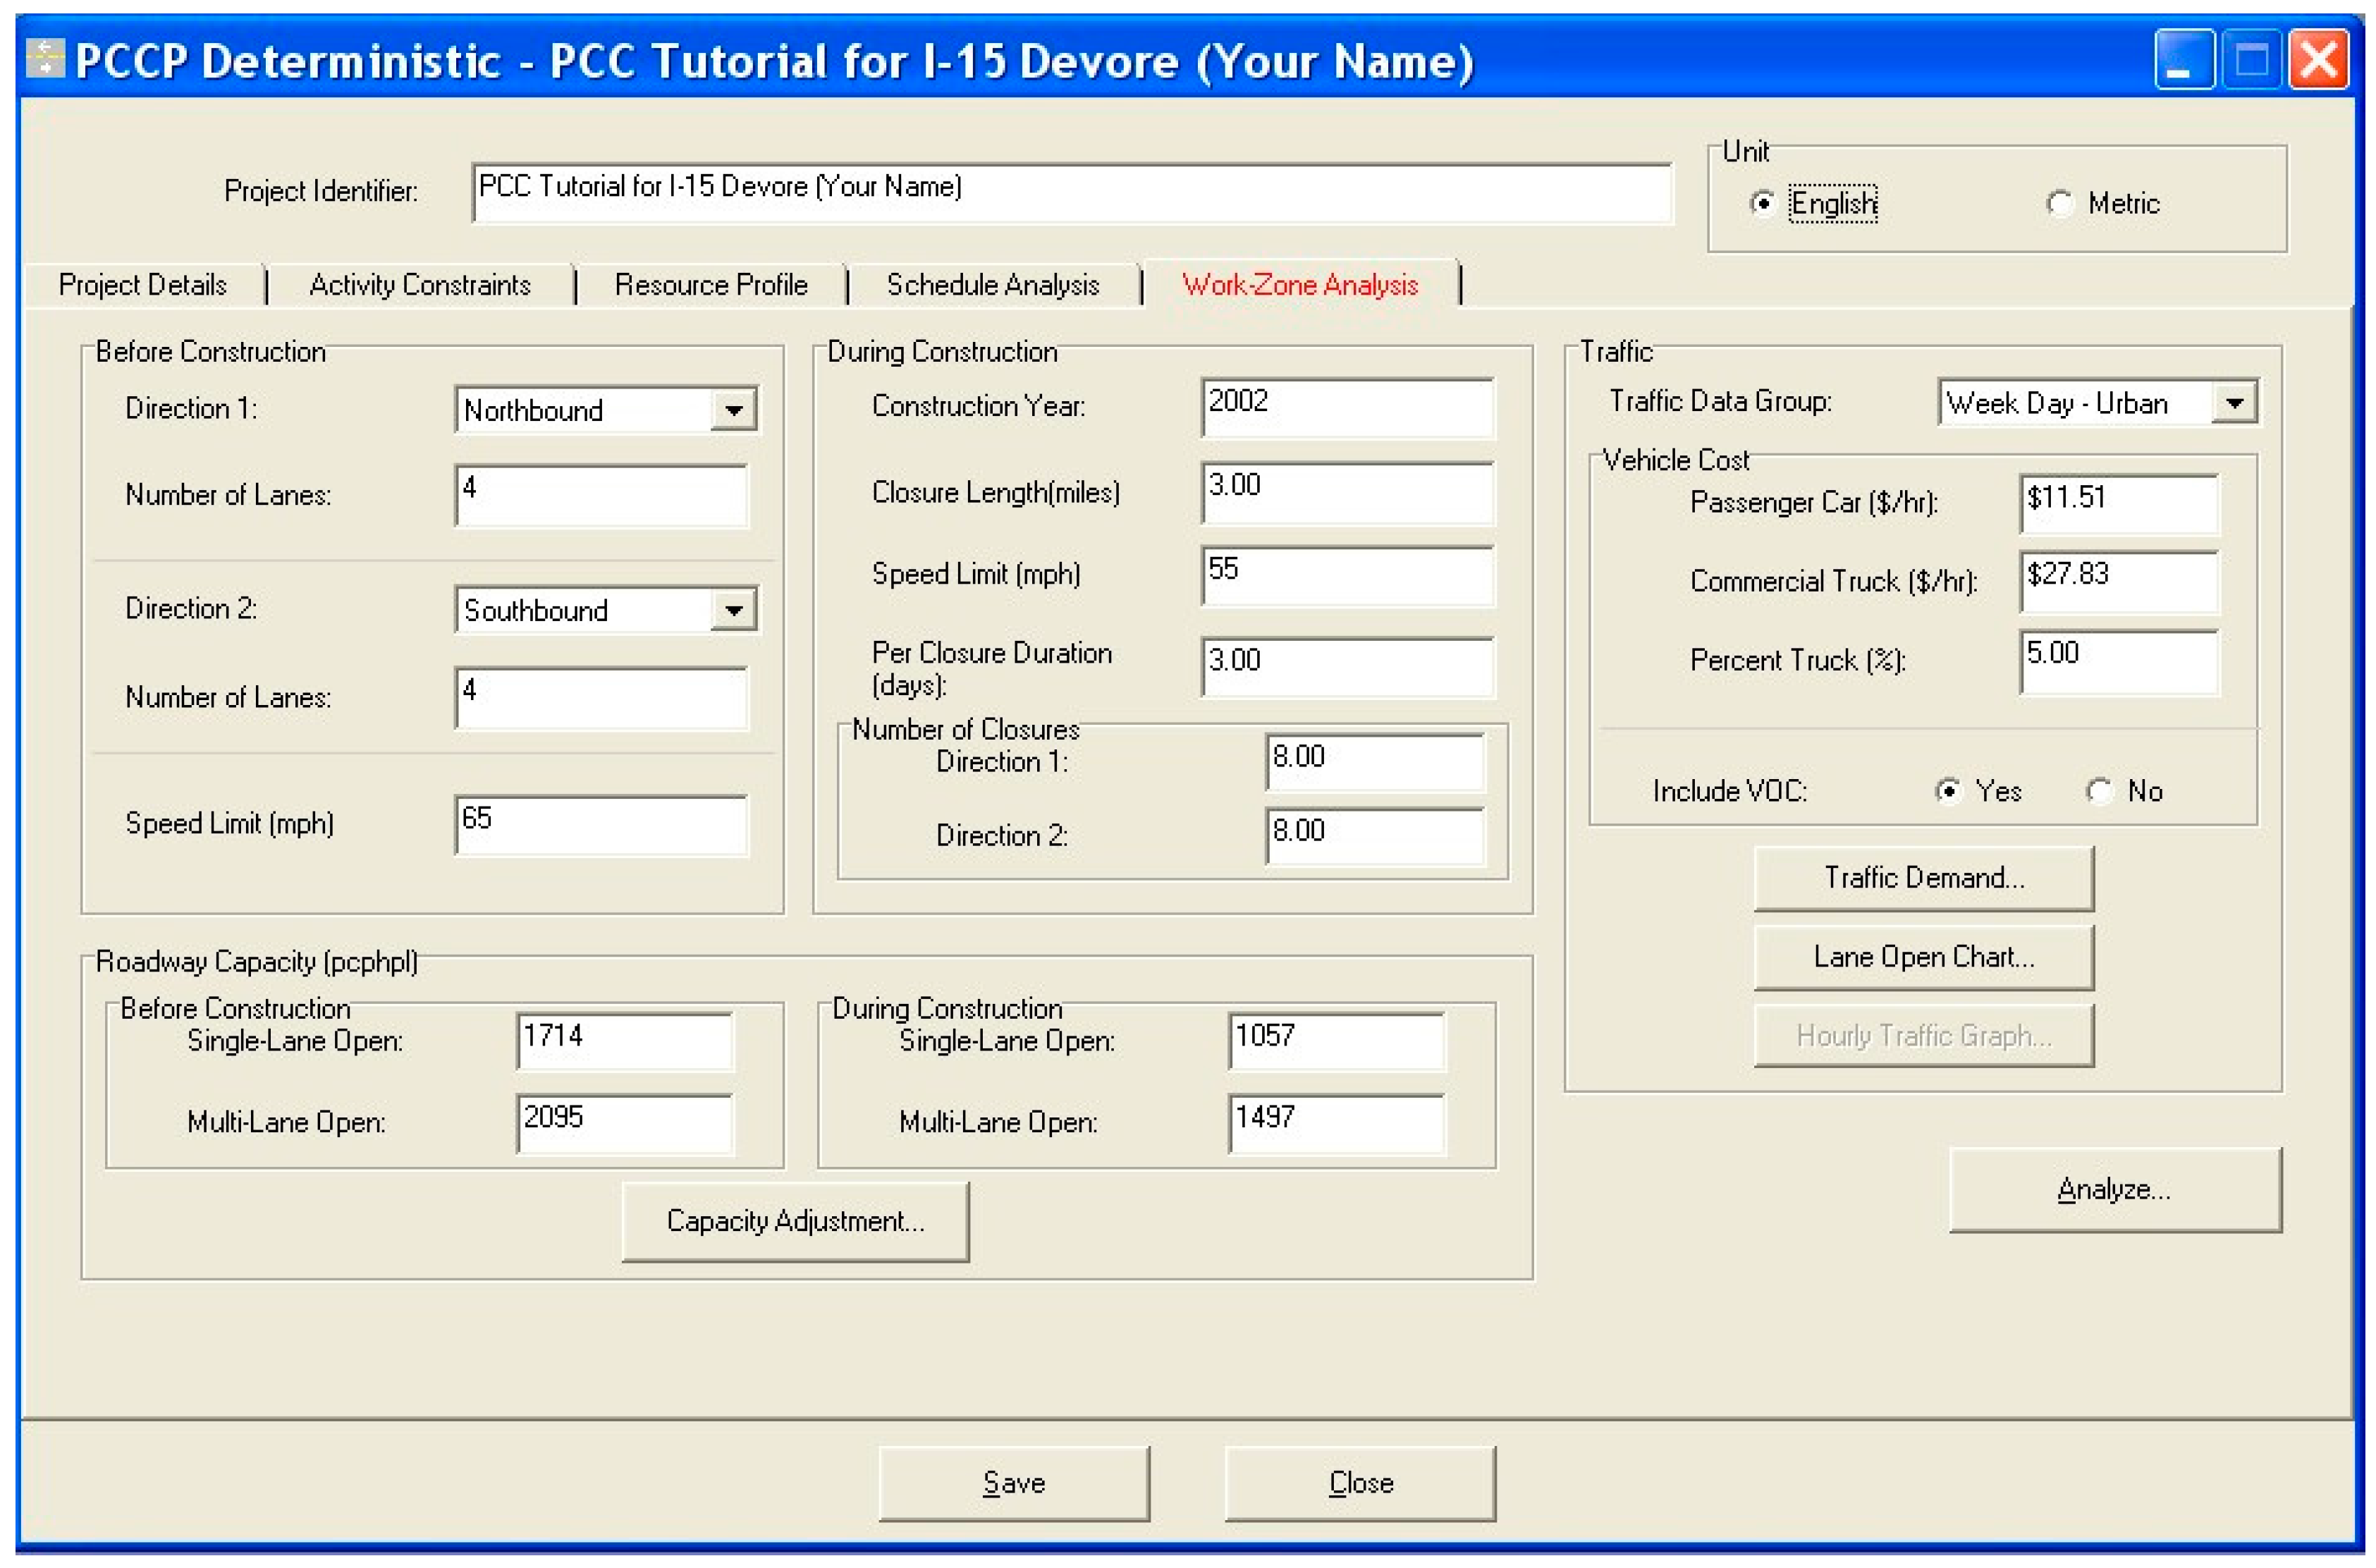
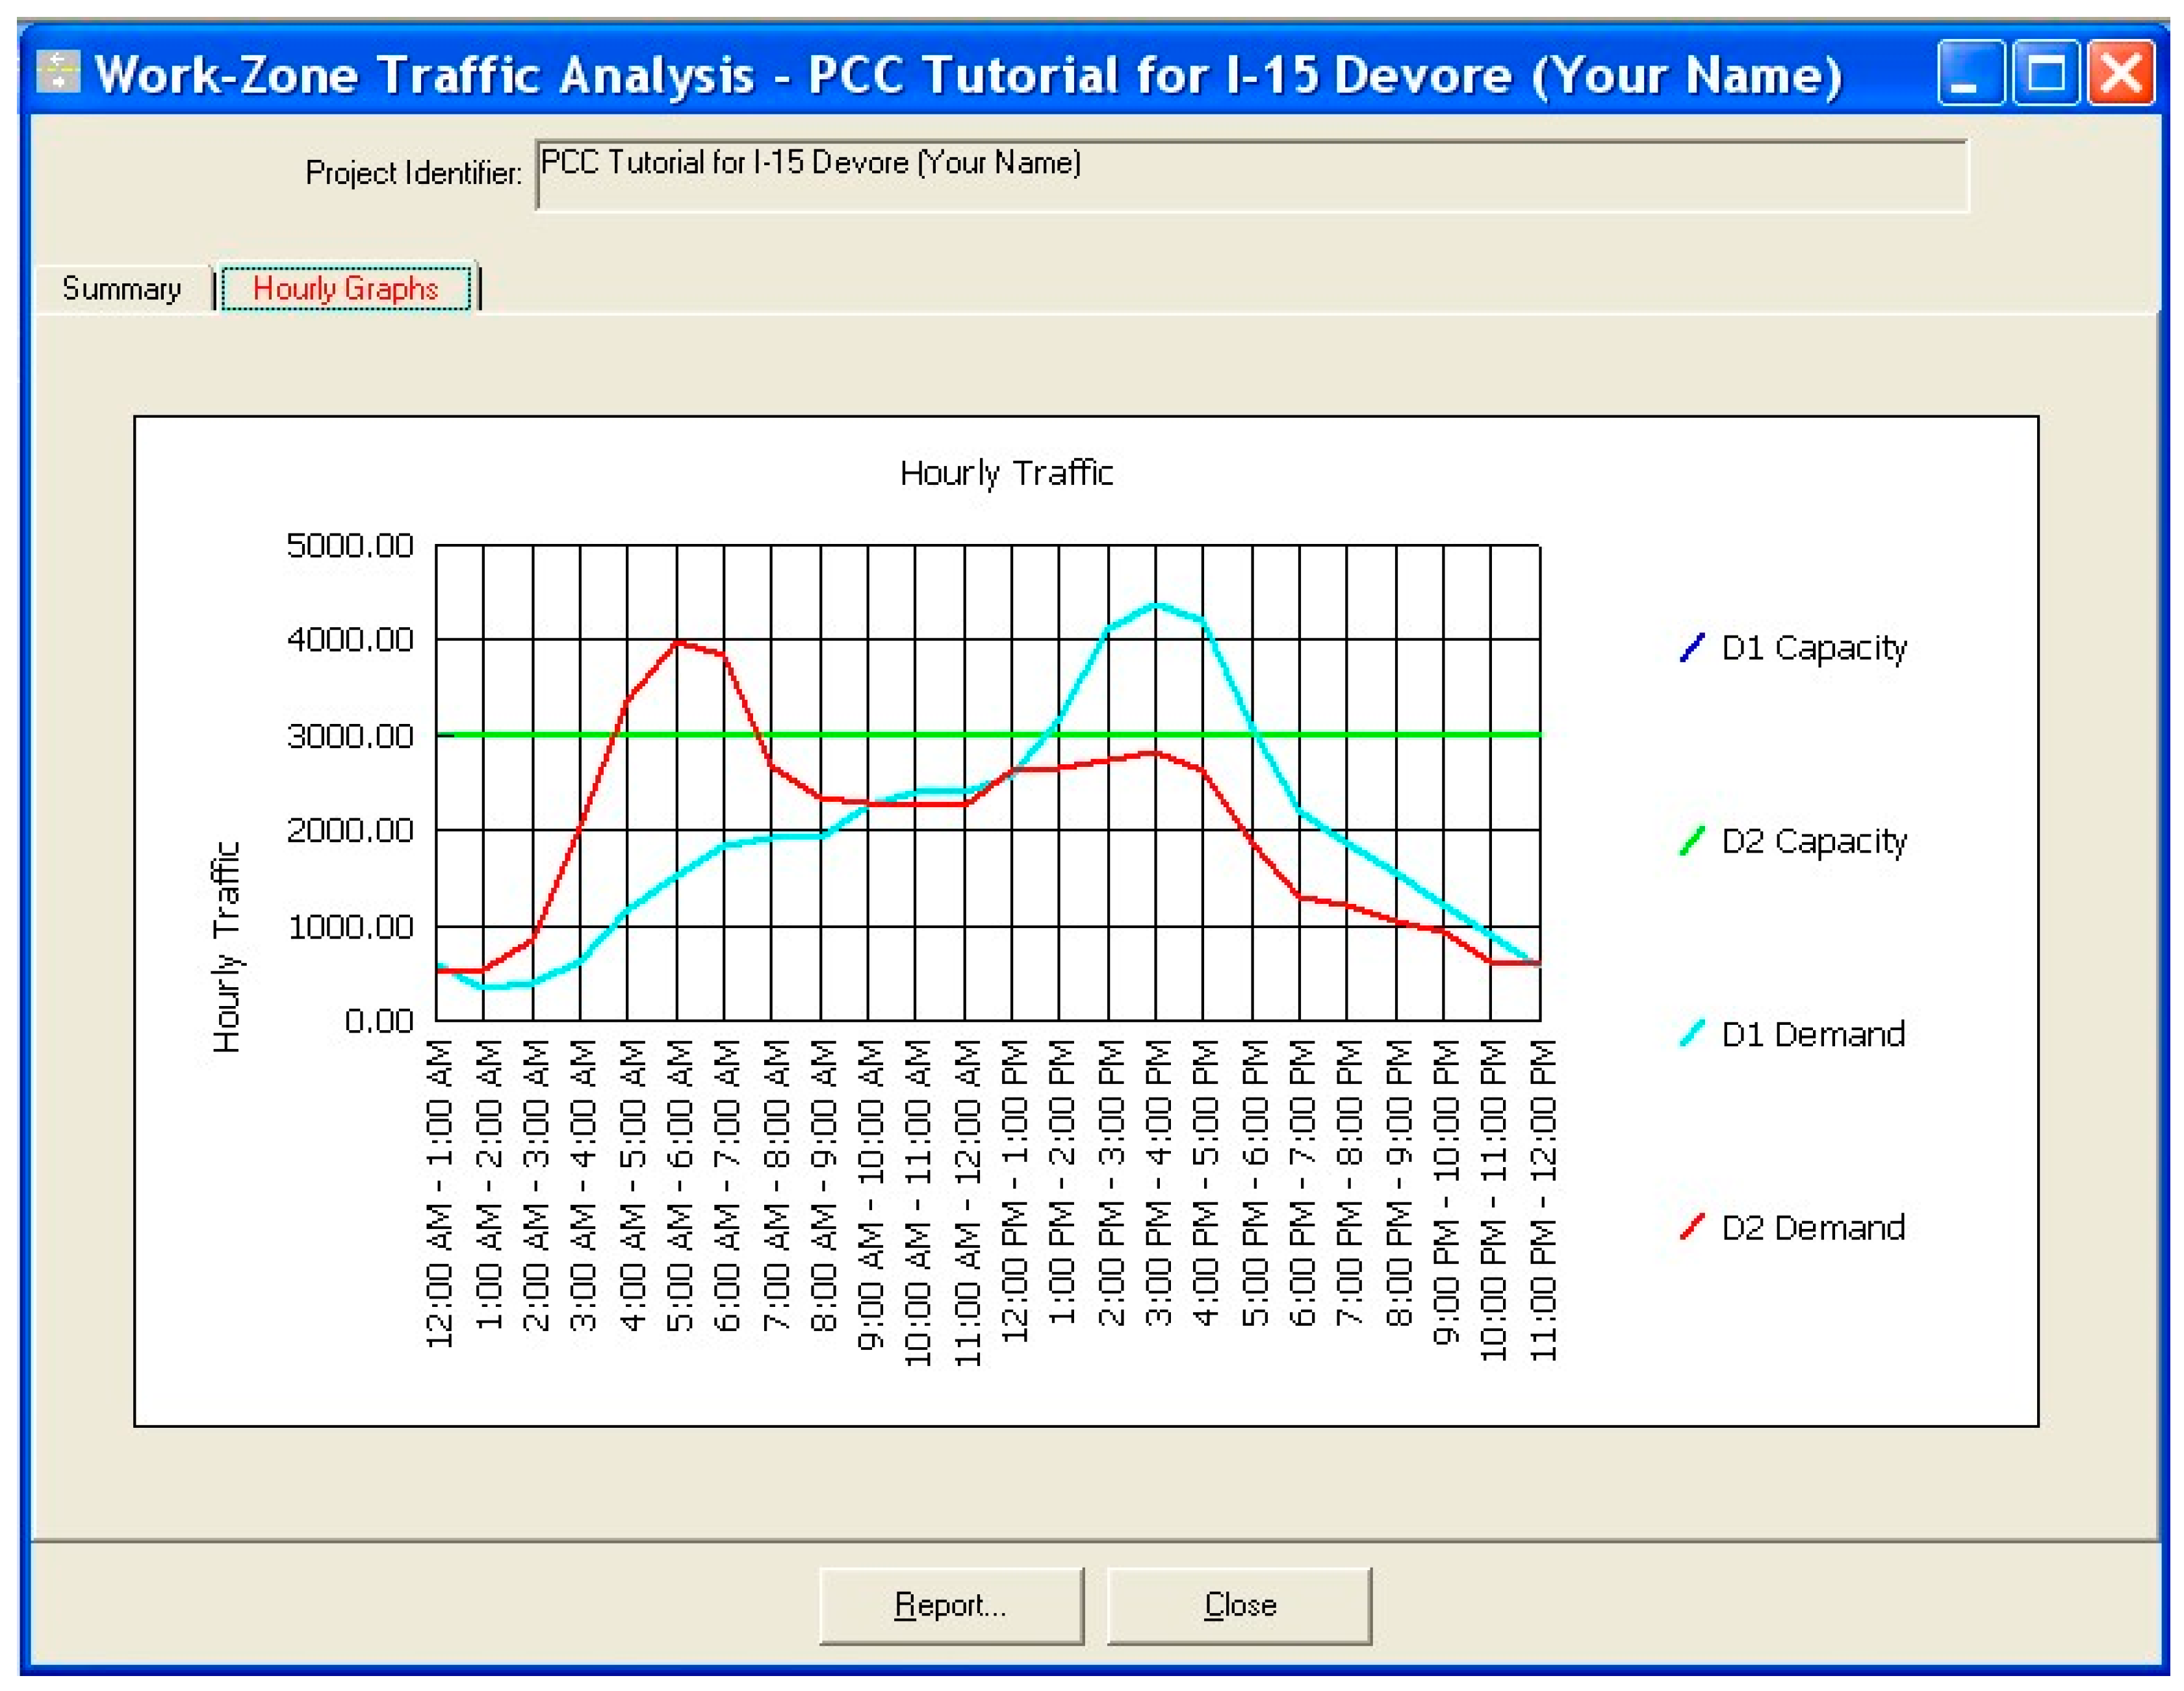
RUC are costs associated with additional travel time and vehicle operating costs incurred by the traveling public through work-zone due to construction traffic delays with lane closures. There are several RUC models and significant literature dedicated to accurate RUC calculations. This paper and Caltrans, use the CA4PRS program (Work-zone module) which is defined below.
Step 6C:
Calculating Life-Cycle Costs involves direct comparison of the total life-cycle costs of each alternative at the present value. Future monies are brought to present values through a process called discounting. Caltrans uses the net present value (NPV) approach, shown below:
N P V = F 1 ( 1 + i ) n
where F = future cost at the end of nth years i = discount rate n = number of years.
Step 7:
LCCA through Software (RealCost): due to the large quantity of variables and robust data sets from which said variables come from, a program is required for final LCCA. Caltrans uses a California-specific modified form of FHWA RealCost called “RealCost Version 2.5-CA”, which is described below along with detailed reasoning and defense of its use [30].

3.3. Life-Cycle Cost Analysis Tools Incorporated

3.3.1. Pavement Design Tools: CalFP and CalAC Software

The SR-91 CIP used CalFP (v1.1) and CalAC (v3.2) for pavement design development (Both CalFP and CalAC were developed by the California Department of Transportation (Caltrans) headquartered in Sacramento, California, USA and available for free download at http://www.dot.ca.gov/hq/maint/Pavement/Offices/Pavement_Engineering/Software.html). CalFP is a Windows-based program which estimates how much pavement can be rehabilitated under differing traffic closure strategies, considering project design, constraints and lane closures. It is based on historical pavement performance of both rehabilitation and new flexible pavement design and validated through several test tracks. CalAC (v3.2) is a Windows-based program to design rehabilitation alternatives for flexible pavements and follows update of the Caltrans HDM and used for pavement design LCCA inputs [32].

3.3.2. LCCA Calculation Tool: RealCost Software

The RealCost software was developed to automate FHWA’s LCCA methodology, calculating life-cycle values for both agency and RUCs associated with construction and rehabilitation for a highway project (RealCost was developed by FHWA headquartered in Washington, D.C., USA and available for free download at https://www.fhwa.dot.gov/infrastructure/asstmgmt/lccasoft.cfm). The software has the simplified capability to calculate work-zone RUCs with user assumption inputs of work-zone closure duration, though it does not have the capacity to estimate agency costs or to predict service lives for individual construction or rehabilitation activities (inputted by the agency analyst). Although RealCost compares agency and user life-cycle costs of alternatives, the outputs alone cannot be used to identify the best choice for implementing a project [33].
RealCost was used for this study as it is both the commonly-used and the most apt for agency LCCA analysis. Through an analysis of the LCCA programs currently used by agencies across the US, Rangaraju et al. [18] surmised that the RealCost software was best suited for their agency due to the simplicity, flexibility and user-support offered by FHWA. This decision was further supported by their finding that over half of the states using LCCA software used RealCost either solely or in conjunction with other software. Caltrans has customized RealCost to estimate future M&R costs and improve its efficiencies, leading to the modified RealCost 2.5-CA being the official California LCCA tool [34]. However, one of the drawbacks of this software is the lack of support in the design of the work-zones with some manual inputs required and the determination of RUC values without scheduling of lane closure schedule [35], which is why the authors have supplemented the RealCost software with CA4PRS.

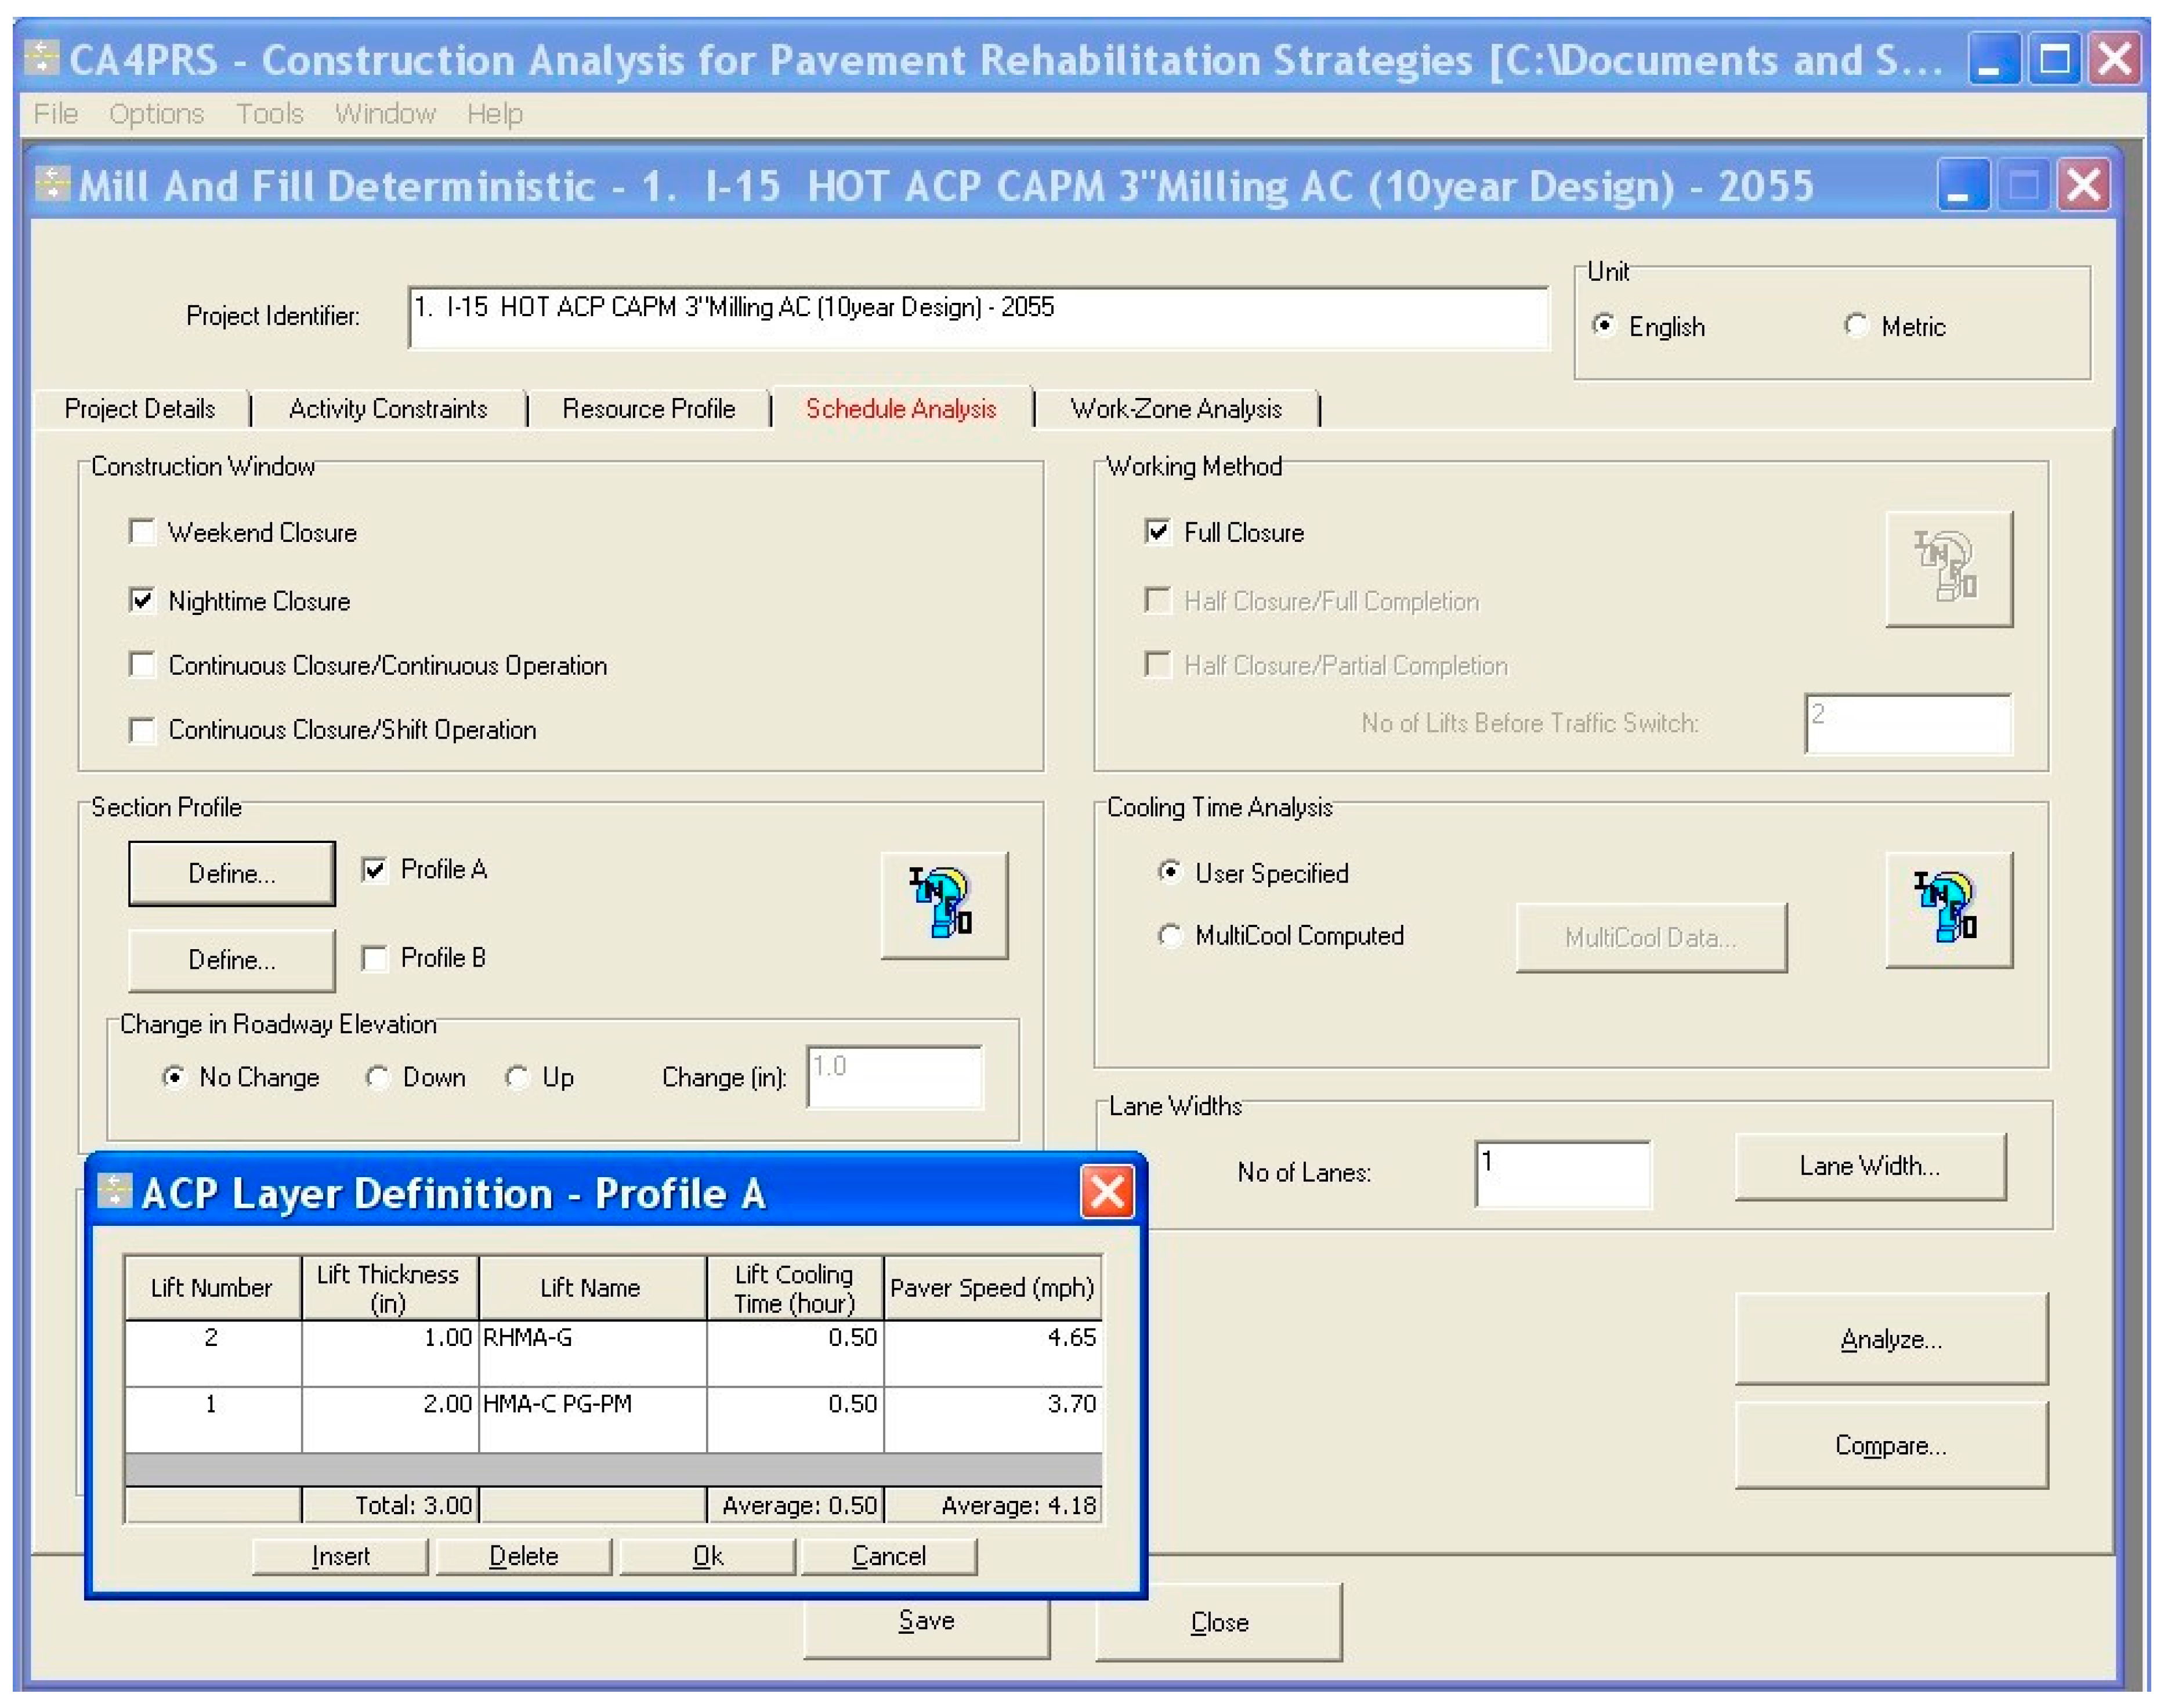
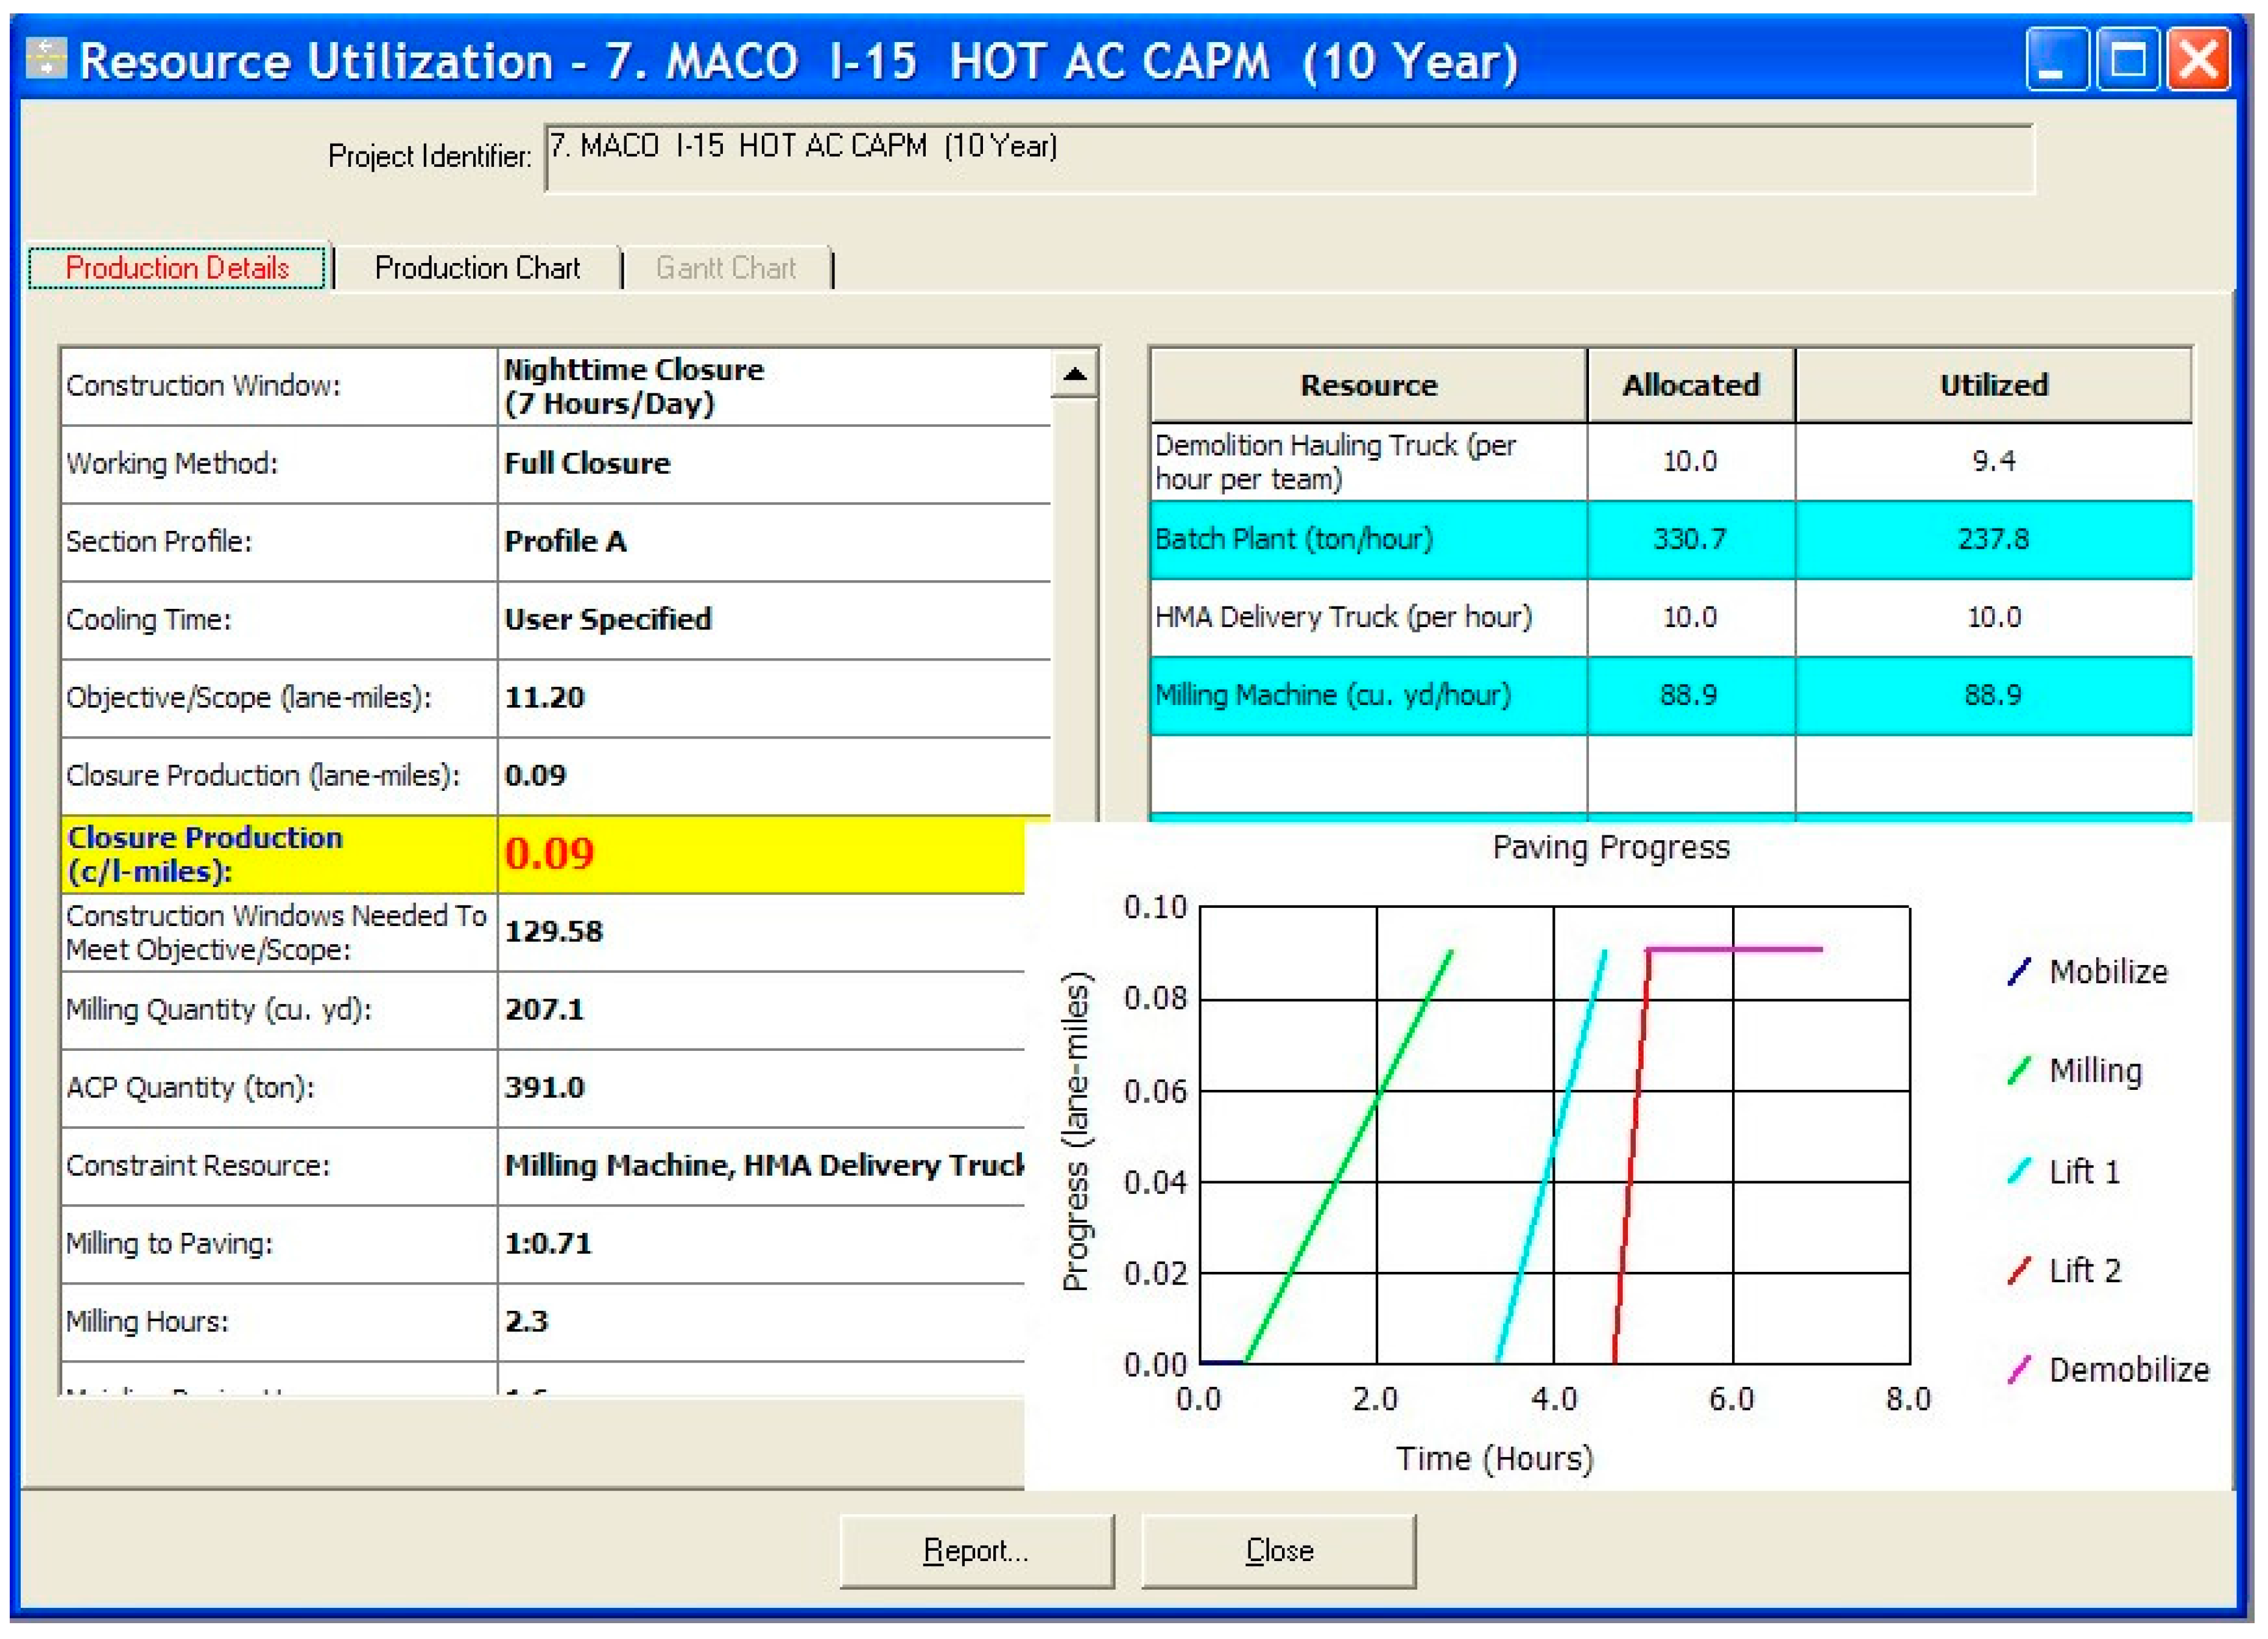
3.3.3. Schedule—Traffic-Cost Estimate Tool: CA4PRS Software

CA4PRS is an integration tool for work-zone analysis with schedule analysis, RUC calculation and agency costs estimating that helps planners and designers select effective and economical highway construction strategies [36] (CA4PRS was developed by the Institute of Transportation Studies at the University of California at Berkeley, headquartered in Berkeley, California, USA, under an FHWA pooled-fund). The software’s Schedule module estimates highway project duration, incorporating alternative strategies for pavement design, lane-closure tactics and contractor logistics with their resource mobilization constraints. CA4PRS’s Work-zone module quantifies the impact of construction work-zone closures on the traveling public in terms of RUC and a maximum queue length. Agency Cost module in CA4PRS estimates the total project cost for each pavement design alternative based on roadway unit costs incorporated with Caltrans contractors’ bid data base and agency support costs with multipliers. The use of CA4PRS is especially beneficial for transportation agencies when it is implemented during the planning and design stages of highway project development to balance schedule (construction production), inconvenience (traffic delay) and affordability (agency budget).
CA4PRS supplemented the LCCA analysis as it accurately calculates RUCs based on estimated work-zone durations and its interaction with agency databases. Collura et al. [37] analyzed four RUC programs (QUEWZ, CA4PRS, CORSIM and QuickZone) finding all models apt for projecting construction work-zone impact on road users. With all the main RUC programs having an equal valuation, the researchers chose to incorporate CA4PRS as the FHWA and AASHTO endorsed it as a priority, market-ready technology ready for nationwide deployment and also the International Read Federation granted 2007 Global Road Achievement to CA4PRS [38]. It has been used to minimize total construction costs for urban freeway reconstruction [36], aided integration analysis, (i.e., lane closure scheduling analysis + work-zone RUC calculation +Agency costs estimate) in an accelerated urban highway rehabilitation project [39] and has been validated through several major highway rehabilitation projects in several states including California, Washington and Minnesota [38].
As this paper is focused on RUC calculations and the CA4PRS software used to calculate them, a discussion on these methods is warranted. The most commonly used method for estimating traffic delay associated with CWZ closures is a Demand-Capacity model, where the demand for the CWZ is measured from historical data and the capacity is estimated using the HCM (Highway Capacity Manual). Detailed delay formulas can be found in Chapter 29 of the HCM 2000 [40]. The user delay calculation in the Demand-Capacity model uses traffic demand and roadway capacity. Where the demand exceeds capacity, the road user delay (measured in vehicle-hours) can be estimated by comparing the accumulated demand and capacity curves.
Road user costs refer to the dollar values assigned to three user cost components: (1) user delay (including detour delay) costs, (2) vehicle operating costs (VOC) and (3) crash costs incurred to highway users resulting from lane closure in work zones for construction, maintenance, or rehabilitation. They are a function of: (i) the timing, duration, frequency, scope and characteristics of the work zone; (ii) the volume and operating characteristics of the traffic affected; (iii) and the dollar cost rates assigned to vehicle operating, delay and crashes. User costs are calculated by multiplying the quantity of the various additional user cost components (user delay, VOC and crash) incurred by the unit cost for those cost components. RUC is obtained by multiplying the total delay in vehicle-hours by a dollar value of time.
The Demand-Capacity model in CA4PRS, based on the HCM, coded with Visual Basic and MS Access database to calculate work zone traffic delays in terms of maximum queue length per closure and road user cost (RUC) during highway rehabilitation. The prototype of CA4PRS Traffic module to support in developing the traffic management plan was validated on several highway rehabilitation projects in urban network especially in Southern California, including the I-15 Devore reconstruction project [41].
An input screenshot and output screenshot of the CA4PRS Work-zone module for RUC calculation is shown in Figure 3 and Figure 4, respectively. Especially, Hourly Graphs tab in the output shows hourly traffic flow (demand) in comparison with WZ roadway capacity and Summary tab indicates RUC for each direction and hourly travel speed through work zone and hourly queue length as well.

3.4. Validation of Proposed LCCA Processes

The above LCCA process which follows the Caltrans seven steps and incorporates the state-of-art programs CalFP, CalAC, RealCost2.5-CA and CA4PRS was validated through implementation on the SR-91 CIP project. The results of said validation are detailed below.

4. SR-91 CIP Life-Cycle Cost Analysis: Step-by-Step Process

4.1. Step 1: Define Pavement Alternatives

Caltrans identified two build alternatives for the SR-91 CIP. A “No-Build” Alternative, also entertained, maintains current SR-91 configurations. Under this alternative, there would be no additional GP lanes and no change in the existing configuration of preferential lanes. Though smaller, localized projects could be considered, approved and implemented on their own merits, no major corridor improvements are assumed to occur in the No-Build Alternative. Continuing congestion with degraded peak hour levels of service would be expected under this alternative. The No-Build Alternative provides a baseline for comparing the impacts associated with the Build Alternatives since reviews must consider the effects of not implementing the proposed project. This paper introduces the no build alternative as a concept but not within its LCCA.
Caltrans LCCA Manual recommends a Rigid Jointed Plain Concrete Pavement in the design of a new roadway, especially for high traffic demand conditions (TI > 15.0 and < 17.0) [30]. This recommendation is based on the notion that concrete pavements provide longer life and require less future maintenance and rehabilitation, compared with asphalt concrete pavements. It further describes that “Caltrans currently does not have a flexible pavement design for TI > 15.0”. As the SR-91 GP lanes are in the category of this high traffic demand resulting from a relatively high TI (>15.0), the LCCA chose long-life Rigid Jointed Plain Concrete Pavement installation, which is also known as Portland Cement Concrete Pavement (PCCP) as the Alternative 1 LCCA baseline. Alternative 2 uses Continuously Reinforced Concrete Pavement (CRCP) for the SR-91 portion and Asphalt Concrete Pavement (ACP) for the I-15 sections. The Alternatives compared with typical lane configuration for SR-91 CIP is summarized in Table 1 [42].

4.2. Step 2: Analysis Period

The “Alternative Design-life” is approximately 40 years and the “LCCA Analysis Period” is 60 years. The LCCA Procedures Manual, recommends using a minimum of 55 years for the analysis period when a long-life pavement design alternative is involved [30]. However, the project team decided to use 60 years for the analysis period to minimize the remaining service life value of the last activity which is consistent with the period of the SR-91 CIP Toll Feasibility Study.

4.3. Step 3: Traffic Data

The existing condition of the daily and truck traffic for SR-91 at the time of the PA/ED stage is summarized in Table 2. As shown in the table, current truck percentages along SR-91 range between five and eight percent. Table 3 summarizes the future traffic in the year 2035 and the TI calculation for the SR-91 GP lanes [28]. As shown in the table, the 40-year TI are all 16.0 for the SR-91 GP lanes and between 11 and 12 for I-15 lanes.
Assumptions for the TI calculations are worth noting. The HDM requires using one-way traffic in AADT in the calculation of TI for the pavement design. However, AADT in traffic engineering is typically represented as both directions of traffic (the current HDM has ambiguity in this specification). Therefore, the ESALs and TIs in Table 2 are calculated using the one-direction of AADT, which is 50 percent of total AADT. Also, AADT for the TI calculation should cover traffic on both GP lanes and Express lanes. Therefore, the TI calculation for SR-91 GP lanes use traffic (one-way AADT of target year) combining the GP and Express lanes for each route.

4.4. Step 4: Discount Rate

The discount rate is four percent as specified in the LCCA Procedures Manual [30].

4.5. Step 5: Future M&R Schedules

Based on the TI calculation for the future design years and the pavement design guidelines in the HDM, the selection of the pavement type (cross-sections and materials) for the initial widening and the sequencing of the future M&R activities are described in detail in the following sections.

4.5.1. Pavement Alternative 1

As indicated in the Caltrans LCCA Procedure Manual used for SR-91 CIP, it was assumed that the long-life PCCP provides 45 years of service-life for a design life of 40 years for the new or widened rigid pavement in the Inland Valley region [30]. The typical sequence and timeline of the future M&R activities for the long-life PCCP follows the guideline in the LCCA Procedures Manual for PCCP new construction and widening for the Inland-Valley Region. The M&R sequencing and timeline are shown in the Summary Section below.

4.5.2. Pavement Alternative 2

As indicated M&R Table R-1, Caltrans LCCA manual, it was assumed that the long-life CRCP provides 50 years of service-life for a design life of 40 years for the new or widened rigid pavement in the Inland Valley region [30]. As CRCP pavement design is rare in Caltrans practice, some details of the design, analysis and estimate relied on the Caltrans new CRCP design guideline: Continuously Reinforced Concrete Pavement Design and Construction Guide [43]. The M&R sequencing and timeline are shown in the Summary Section below.

4.5.3. Summary of M&R Activities

The summary of M&R activities is shown below in Table 7, Section 4.6.2, depicting the scheduling of future M&R for the SR-91 CIP project. The last M&R activity scheduled at the end of the analysis period for each of the LCCA alternatives (i.e., 3rd M&R PCCP CAPM (CPR A) for the SR-91 PCCP at year 60 listed above) is not included in the M&R sequencing. No life cycle cost for that last activity is charged to the analysis period.

4.6. Step 6: Total Life-Cycle Cost Estimate and Analysis

Once the design details for pavement cross-sections, M&R sequencing and timeline are established, the next step for the LCCA is to estimate project costs for each of the LCCA alternatives from initial widening to the last M&R activity. In summary, life-cycle costs for SR-91 CIP consists of (1) agency costs (i.e., pavement costs and support costs for initial (widening and rehabilitation) construction, future rehabilitation and annual maintenance cost), (2) work-zone RUC and (3) toll loss (as part of agency revenue reduction) on the express lanes during rehabilitation, as summarized below. CA4PRS Agency Cost module is primarily used for validation in conjunction with Caltrans bid database for the agency costs estimate (i.e., initial cost and M&R costs in the future). This is summarized below.

4.6.1. Step 6A.1 Initial Improvement Construction Costs

The unit cost of major pavement items is obtained from the Caltrans Contract Cost database [44]. The unit cost for the construction cost estimate cover the recent four years prior to estimate development (2005 to 2009) and Southern California areas. Pavement included in the database are PCCP, HMA-Type A, AC base, lean concrete base, AB (Class 2), AS (Class 2), etc.
To ensure clear and consistent estimates, unit cost per unit area for the pavement cross-sections of each LCCA design alternative is calculated. The total pavement cost for each design alternative is then calculated by multiplying the unit price per unit area by the whole area of the roadway pavement. Although the procedure of using the pavement unit rates per unit area as used in the project cost estimates in the Project Report is slightly more complicated than typical cost estimate procedures of using pavement unit rates per volume, it provides more flexibility to cover various types of pavement cross-sections for the LCCA alternatives of the SR-91 CIP as the result of the cost estimate for the both methods is the same.
The pavement areas used in the LCCA are based on the cost estimate data contained in the SR-91 Project Report [42]. The total area of the pavement widening for the SR-91 GP lanes is 6,533,260 sf, which is equivalent to approximately 103 lane-miles assuming 12’ wide lanes. The Alternative 2-unit cost of CRCP ($12.20 per sf) is about 20 percent more than the Alternative 1, PCCP ($10.66 per sf) equating to approximately $10 million more. The total area of the pavement widening for the I-15 lanes is 2,010,747 sf, approximately 32 lane-miles. The I-15 Alternative 2-unit cost of ACP ($12.05 per sf) is also about 20 percent more than the Alternative 1, PCCP ($9.79 per sf) equating to approximately $4.5 million more. Finally, the SR-91 project ramps include seven heavy trafficked ramps for widening, designed for a TI of 14 and 20 medium traffic ramps, designed for a TI of 11, with each ramp having an estimated 43,200 sf. The ramp Alternative 2-unit cost of ACP ($10.35 per sf) is about 25 percent more than the Alternative 1, PCCP ($8.35 per sf) equating to approximately $2.5 million more. The cost estimate breakdown with pavement section profile for the SR-91 lane, I-15 lane and SR-91 ramps are shown in Table 4, Table 5 and Table 6 respectively [28]. These estimations are shown in Table 4, Table 5 and Table 6.

4.6.2. Step 6A.2 Maintenance Costs

Caltrans has annual maintenance costs based on pavement cross-section classifications. Table 7 depicts the annual maintenance costs per lane-mile. The total annual maintenance costs per alternative are calculated by taking the design life multiplied by the annual maintenance cost multiplied by the lane-miles (≈2/3 mile per ramp) and summing up all maintenance activities.

4.6.3. Step 6A.3 Pavement Rehabilitation Costs

The pavement cost per unit area used for initial costing was also used for the cost estimate of the future rehabilitation costs. This procedure is slightly different from the cost estimate recommendation in the LCCA user manual providing a typical lane-mile cost ($/lane-mile) for future rehabilitations but it gives a more accurate estimate for various pavement cross-section types. Table 8, Table 9 and Table 10 depict the Rehabilitation costs for the SR-91 lanes, I-15 lanes and SR-91 ramps respectively.

4.6.4. Step 6A.4 Agency Support Costs for Future Rehabilitation

The CA4PRS program (Agency Cost module) supplies Caltrans with “support cost multipliers” based on historical trends to cover non-pavement items during construction such as design engineering, traffic handling and control and project management cost. All factors used in the cost estimate adjustment to cover the non-pavement items and indirect items result in an overall multiplier of 2.09. The LCCA states that initial costs should not include supporting costs but the rehabilitation activities’ agency supporting costs will differ significantly and should be included in the LCCA. The multiplier’s use is shown in Table 8, Table 9 and Table 10 to cover full rehabilitation costs.

4.6.5. Step 6A.5 Remaining Service Life Costs

As stated in Step 2: Analysis Period, the project team decided to use an analysis period that minimized the remaining service life value of the last M&R activity. Therefore, remaining service life costs were minimal to none and not included in the analysis.

4.6.6. Step 6B RUCs and Toll Fee Revenue Loss during M&R

The RUC in the work-zone with lane closures during the future M&R construction on the SR-91 and I-15 GP lanes are considered (calculated and included). The RUC evaluation is based on the estimate of construction schedule (duration of the lane closures) and future forecast traffic volumes for each construction activity using CA4PRS. It is assumed that the lane closures in the work-zone take place at night, a minimum of two lanes closed for approximately seven hours, as typical Caltrans practice in urban corridor, to balance construction productivity and delay impact. A summary of 7-h night closure numbers for the future M&R construction activities for SR-91 and I-15 lanes is listed in Table 11, estimated by the Schedule module in CA4PRS. The Input and Output screens for the CA4PRS are also shown in Figure 5 and Figure 6.
Traffic hourly volumes for lane closures in the work-zone during the future M&R construction are generated for RUC calculations in the work-zone using the hourly traffic volume percentage of the existing condition (2008) from PeMS (Caltrans traffic database system) data and forecast AADT from the SR-91 CIP Traffic Report [28]. For simplicity, typical locations for each route is selected for the RUC analysis, using Caltrans PeMS hourly traffic data which is embedded in CA4PRS Work-zone module. It is further assumed that the traffic in the GP lanes and Express lanes increases annually about one percent after year 2035, end of forecast traffic. Hourly time values announced by Caltrans (i.e., $11.51 for a passenger car ($10.46 per car × 1.1 persons on average) and $27.83 for a commercial truck) were used for the RUC calculation in the study [30].
RUC calculations were not performed for the initial widening construction because the roadway widening does not involve major lane closures on the mainline. Furthermore, if there are minor lane closures needed during the widening construction, the lane closure schemes are the same (or similar) between the widening design alternatives. In other words, lane closure tactics for the PCCP widening or ACP widening construction for SR-91 GP lanes and I-15 Express lanes and associated ramps are assumed to be the same between the LCCA comparison alternatives (PCCP versus ACP). Therefore, the RUC during the initial widening construction between the LCCA alternatives (PCCP versus ACP) even out and are not included in the delay cost.
As a conclusion of the work-zone RUC calculation on the rehabilitation activities, 7-hour lane closures of the SR-91 GP and I-15 lanes, except SR-91 ramps widening as described below, do not create any major queue delay if each direction of roadway in the work-zone has a minimum of three lanes open. This assumption is feasible in most locations along the corridors with the provided lane configurations after the SR-91 and I-15 CIP widening. This is expected even in the years 2035 and 2065 if three GP lanes are open in each direction. Even though I-15 road users will not be substantially impacted, there is an expected toll fee revenue loss, as kind of an agency cost, on the I-15 Express lanes during M&R construction due to express lanes closure. Be noted that SR-91 and I-15 GP lanes are toll fee free public freeways, as the typical in the US.
Traffic handling for M&R construction is assumed to require the two I-15 Express lanes in the future condition to be closed (one lane for construction access and one lane for the other lane’s rehabilitation) during a typical 7-hour window during the night with a detour of the toll traffic to GP lanes. This is depicted in Table 13 with Alternative 2 having a toll loss $217,000 greater than Alternative 1. Finally, the analysis performed by the CA4PRS software depicted costs borne by the road users (RUC) in the rehabilitation (widening) of the SR-91 ramps, shown in Table 14, amounting to one million dollars for Alternative 1 and 2.5 million dollars for Alternative 2. Alternative 2’s higher RUC and toll loss is due to the ACP service life being 10 years, requiring 5 rehabilitation activities.

4.6.7. Step 6C: Calculating Life-Cycle Costs

Calculating life-cycle costs involves direct comparison of the total life-cycle costs of each design alternative. However, dollars spent at different times have different present values, the anticipated costs of future rehabilitation activities for each alternative need to be converted to their value at a common point in time. This process is performed using Equation (1) and depicted in Table 12, Table 13 and Table 14.

4.7. STEP 7: LCCA Comparison and Alternative Selection

The final step is to bring all total costs to present value, analyze the options and decide on the alternative to be used for the project. As a means of further validating the above process, the calculations of the LCCA in this report are done manually and validated on Excel spreadsheets in conjunction with the analysis tools: CA4PRS and RealCost. Overall, the output of the LCCA from the RealCost software is similar with the manual calculation outputs.
Table 12, Table 13 and Table 14 summarize the major components of the LCCA calculation for the SR-91 GP lanes pavement alternatives, comparing the LCCA baseline of long-life PCCP and its alternative of long-life CRCP with a summation of the costs for the initial roadway widening, the future M&R construction and annual maintenance. The life-cycle costs are shown in two formats: discounted cost (present value) versus un-discounted cost. From a NPV or discounted analysis, Alternative 1 is the more cost-effective option in all categories and for all segments.

4.8. LCCA Conclusions and Recommendation for SR-91 CIP

The conclusion of the LCCA study are as follows: using the long-life PCCP on the SR-91 GP and I-15 Express lanes and on the SR-91 ramps is about $32 million (or 30%) more cost effective from the perspective of LCCA (NPV), compared to the alternative, which includes CRCP for the SR-91 GP lanes and ACP for the I-15 Express Lanes and SR-91 Ramps. More specifically, the total life-cycle cost of PCC pavement for the SR-91 GP and I-15 Express lanes and the SR-91 ramps is about $110 million, as a sum of $77 million for SR-91, $22 million for I-15 and $11 million for the SR-91 ramps. Whereas, the total life-cycle cost of CRCP on SR-91 and ACP on I-15 and the SR-91 ramps is about $141 million, as a sum of $83 million for SR-91, $38 million for I-15 and $20 million for the SR-91 ramps. These differences in the results originate from Alternative 2’s higher initial costs and ACP’s shorter life-span, requiring three more rehabilitation activities. The ultimate recommendation was Alternative 1. The cost breakdown is in Table 15.
Post-LCCA study status of the SR-91 CIP: the SR-91 CIP Project construction started in 2014 and is successfully completed in late 2017 at about $1.4 B investment. The pavement design strategies recommended in the PA/ED study based on the LCCA summarized in this paper were primarily adopted into the final design stage with some adjustments during the design-build phase [45].

5. Conclusions

Life-Cycle Cost Analysis (LCCA) is strongly recommended by FHWA on all projects over $25 M and a requirement within many states. From the researcher’s literature review, one of the most significant issues with agencies performing the LCCA is incorporating RUCs into their analysis, with nearly 70% of agencies not including RUCs at all. Per the NCHRP 494 Synthesis on LCCA for highway pavement management, the RUCs are significant and required input for proper decision analysis. The paper even goes on to say RUCs are “one of the great advances in public-sector infrastructure management and decision making” [3].
There is a gap between literature’s best practices and industry’s practice concerning the LCCA process, the inclusion of RUCs and integration analysis with pavement design tools. Agencies often do not include RUCs because they are inaccurate and unreliable and/or they do not have any RUC processes to support their decision makers [2,3]. This paper presents a LCCA process that incorporates an accurate RUC analysis program based on its schedule estimation for work-zone lane closures, Construction Analysis for Pavement Rehabilitation Strategies (CA4PRS), into the existing LCCA process. In using it for a California project, the SR-91 Corridor Improvement Project, the process chose an apt alternative resulting in an estimated life-cycle-cost savings of $32 M for Caltrans.
Through the effort to incorporate the CA4PRS and RealCost software into the existing LCCA process, it is our contention that this process can be replicated with similar cost savings on projects across the US and metropolitan areas in other countries. However, some previous literature has been wary of using RUCs without weighting modifiers due to their high impact on project LCCAs, especially mega-projects with major traffic concerns. This could potentially be a limitation of the model presented above but could also be a potential advocate of using this model as it increases the accuracy of RUCs. Agency decision-makers can use this tool but ultimately must make judgements based on all the data and previous experience on hand.

Author Contributions

Eul-Bum Lee developed the concept based on the analysis and drafted the manuscript. David Thomas provided project data with validation and supervised the overall work. Doug Alleman provided constructability feedback and reviewed the manuscript. All of the authors read and approved the final manuscript.

Conflicts of Interest

The authors declare no conflict of interest.

Abbreviations

LCCALife-Cycle Cost Analysis
SR-91 CIPSR-91 Corridor Improvement Project
CA4PRSConstruction Analysis for Pavement Rehabilitation Strategies
TEA-21Transportation Equity Act for the 21st Century
FHWAFederal Highway Administration
AADTAnnual Average Daily Traffic
GPGeneral Purpose
HOVHigh Occupancy Vehicle
HDMHighway Design Manual
PA/EDProject Approval/ Environmental Document
CAPMCapital Preventive Maintenance
TITraffic Index
M&RMaintenance and Rehabilitation
NPVNet Present Value
HMAHot Mix Asphalt
PCCPPortland Cement Concrete Pavement
ACPAsphalt Concrete Pavement
CRCPContinuously Reinforced Concrete Pavement
RUCRoad User Costs

References

  1. American Society of Civil Engineers (ASCE). 2017 Infrastructure Score Card; ASCE: Reston, VA, USA, 2017. [Google Scholar]
  2. Ozbay, K.; Jawad, D.; Parker, N.; Hussain, S. Life Cycle Cost Analysis: State-Of The-Practice vs. State-Of-The-Art; Transportation Research Record: Washington, DC, USA, 2004. [Google Scholar]
  3. Flannery, A.; Manns, J.; Venner, M. NCHRP Synthesis of Highway Practice 494: Life-Cycle Cost Analysis for Management of Highway Assets; Transportation Research Board of the National Academies: Washington, DC, USA, 2016. [Google Scholar]
  4. Papagiannakis, T.; Delwar, M. Computer model for life-cycle cost analysis of roadway pavements. J. Comput. Civ. Eng. 2001, 15, 152–156. [Google Scholar] [CrossRef]
  5. Zheng, N.; Liu, A.G.X.; Jin, Y. Evaluation of tools for incorporating road user costs in pavement rehabilitation decision making on rural highways in Saskatchewan. In Proceedings of the Seventh International Conference on Traffic and Transportation Studies, Kunming, China, 3–5 August 2010; pp. 522–534. [Google Scholar]
  6. Yu, J.; Huang, X.; Liao, G. Expressway work zone life cycle user costs model. In Proceedings of the ICCTP 2010 10th International Conference of Chinese Transportation Professionals, Beijing, China, 4–8 August 2010; pp. 1415–1420. [Google Scholar]
  7. Lee, E.B.; Kim, C.; Harvey, J.T. Pavement Type Selection for Highway Rehabilitation Based on a Life-Cycle Cost Analysis: Validation of California Interstate 710 Project (Phase 1); Transportation Research Record: Washington, DC, USA, 2011; pp. 23–32. [Google Scholar]
  8. US Department of Transportation (USDOT). Life-Cycle Cost Analysis Primer; FHWA Report No. FHWA-IF-02-047; FHWA: Washington, DC, USA, 2002.
  9. Wilde, W.; Walkes, S.; Harrison, R. Life Cycle Cost Analysis of Portland Cement Concrete Pavements; FHWA: Washington, DC, USA, 1999.
  10. Winfrey, R. Economics Analysis for Highways; International Textbook Company: Scranton, PA, USA, 1969. [Google Scholar]
  11. American Association of State Highway and Transportation Officials (AASHTO). Guide for Design of Pavement Structures; AASHTO: Washington, DC, USA, 1983. [Google Scholar]
  12. Peterson. NCHRP Synthesis of Highway Practice 122: Life-Cycle Cost Analysis of Pavements; Transportation Research Board of the National Academies: Washington, DC, USA, 1985. [Google Scholar]
  13. US Department of Transportation. Life Cycle Cost Analysis in Pavement Design, Demonstr; Project No. 115; Office of Asset Management, FHWA: Washington, DC, USA, 1998.
  14. FHWA. Life-Cycle Cost Analysis in Pavement Design—Interim Technical Bulletin; FHWA-SA-98-079; U.S. DOT, Federal Highway Administration: Washington, DC, USA, 1998.
  15. Hallin, J. NCHRP Report 703: Guide to Pavement-Type Selection; Transportation Research Board of the National Academies: Washington, DC, USA, 2011. [Google Scholar]
  16. Hawk, H. NCHRP Report 483: Bridge Life-Cycle Cost Analysis; Transportation Research Board of the National Academies: Washington, DC, USA, 2003. [Google Scholar]
  17. Zimmerman, K.; Smith, K.; Grogg, M. Applying Economic Concepts from Life-Cycle Cost Analysis to Pavement Management Analysis; Transportation Research Record: Washington, DC, USA, 2000. [Google Scholar]
  18. Rangaraju, P.R.; Amirkhanian, S.; Guven, Z. Life Cycle Cost Analysis for Pavement Type Selection; FHWA, South Carolina Department of Transportation: Clemson, SC, USA, 2008.
  19. Babashamsi, P.; Yusoff, N.I.M.; Ceylan, H.; Nor, N.G.H.; Jenatabadi, H.S. Evaluation of pavement life cycle cost analysis: Review and analysis. Int. J. Pavement Res. Technol. 2016, 9, 241–254. [Google Scholar] [CrossRef]
  20. Abaza, K.A. Optimum flexible pavement life-cycle analysis model. J. Transp. Eng. 2002, 128, 542–549. [Google Scholar] [CrossRef]
  21. Tighe, S. Guidelines for Probabilistic Pavement Life Cycle Cost Analysis; Transportation Research Record: Washington, DC, USA, 2001. [Google Scholar]
  22. Reigle, J.A.; Zaniewski, J.P. Risk-Based Life-Cycle Cost Analysis for Project-Level Pavement Management; Transportation Research Record: Washington, DC, USA, 2002. [Google Scholar]
  23. Salem, O.; AbouRizk, S.; Ariaratnam, S. Risk-based life-cycle costing of infrastructure rehabilitation and construction alternatives. J. Infrastruct. Syst. 2003, 9, 6–15. [Google Scholar] [CrossRef]
  24. Zhang, H.; Keoleian, G.A.; Lepech, M.D.; Kendall, A. Life-cycle optimization of pavement overlay systems. J. Infrastruct. Syst. 2010, 16, 310–322. [Google Scholar] [CrossRef]
  25. Morgado, J.; Neves, J. Work zone planning in pavement rehabilitation: Integrating cost, duration and user effects. J. Constr. Eng. Manag. 2014, 140, 04014050. [Google Scholar] [CrossRef]
  26. Heravi, G.; Esmaeeli, A.N. Fuzzy multicriteria decision-making approach for pavement project evaluation using life-cycle cost/performance analysis. J. Infrastruct. Syst. 2014, 20, 04014002. [Google Scholar] [CrossRef]
  27. California Department of Transportation (Caltrans). Draft Project Report—91 Project. Available online: http://sr91project.info/environmental/_pdf/SR-91_CIP_DPR_EA_0F540_(th-Attachments-1-18).pdf (accessed on 20 June 2017).
  28. Caltrans. SR-91 Corridor Improvement Project: Final Draft Traffic Study Report. Available online: http://sr91project.info/environmental/_pdf/Tech_Studies/Traffic%20Study%20Report/SR%2091%20Traffic%20Study%20July%202010.pdf (accessed on 8 December 2017).
  29. Caltrans. Caltrans Highway Design Manual. Available online: http://www.dot.ca.gov/hq/oppd/hdm/hdmtoc.htm (accessed on 20 June 2017).
  30. Caltrans. Caltrans Life-Cycle Cost Analysis Procedures Manual. Available online: http://www.dot.ca.gov/hq/maint/Pavement/Offices/Pavement_Engineering/LCCA_Docs/LCCA_25CA_Manual_Final_Aug_1_2013_v2.pdf (accessed on 18 June 2017).
  31. Caltrans. Traffic Census. Available online: http://www.dot.ca.gov/trafficops/census/ (accessed on 18 June 2017).
  32. Caltrans. Pavement Software. Available online: http://www.dot.ca.gov/hq/maint/Pavement/Offices/Pavement_Engineering/Software.html (accessed on 18 June 2017).
  33. USDOT. Life-Cycle Cost Analysis RealCost User Manual. Office of Asset Management. Available online: https://www.fhwa.dot.gov/infrastructure asstmgmt/rc210704.pdf (accessed on 20 June 2017).
  34. Kim, C.; Lee, E.-B.; Harvey, J.T.; Fong, A.; Lott, R. Automated sequence selection and cost calculation for maintenance and rehabilitation in highway Life-Cycle Cost Analysis (LCCA). Int. J. Transp. Sci. Technol. 2015, 4, 61–75. [Google Scholar] [CrossRef]
  35. Flintsch, G.W.; Kuttesch, J. Application of engineering economic analysis tools for pavement management. In Proceedings of the 83rd Annual TRB Meeting, Washington, DC, USA, 11–15 January 2004. [Google Scholar]
  36. Lee, E.B.; Ibbs, C.W. A computer simulation model: Construction analysis for highway rehabilitation strategies CA4PRS. J. Constr. Eng. Manag. 2005, 131, 449–458. [Google Scholar] [CrossRef]
  37. Collura, Work Zone Safety Data Collection and Analysis Guide, USDOT/FHWA. Available online: https://www.workzonesafety.org/files/documents/training/fhwa_wz_grant/atssa_wz_safety_data_collection.pdf (accessed on 8 March 2017).
  38. Federal Highway Administration (FHWA). Construction Analysis for Pavement Rehabilitation Strategies. Available online: https://www.fhwa.dot.gov/research/deployment/ca4prs.cfm (accessed on 8 March 2017).
  39. Lee, E.B.; Thomas, D.K. State-of-practice technologies on accelerated urban highway rehabilitation: I-15 California experience. J. Constr. Eng. Manag. 2007, 133, 105–113. [Google Scholar] [CrossRef]
  40. Transportation Research Board, National Research Counsel. Highway Capacity Manual (HCM) 2000; Transportation Research Board, National Research Counsel: Washington, DC, USA, 2000.
  41. Lee, E.-B.; Thomas, D.K.; Bloomberg, L. Planning urban-highway reconstruction with traffic demand affected by construction schedule. J. Transp. Eng. 2005, 11, 752–761. [Google Scholar] [CrossRef]
  42. Caltrans. SR-91 Corridor Improvement Project Draft EIR/EIS. Available online: http://sr91project.info/_pdf/Chapter%202%20Project%20Alternatives.pdf (accessed on 20 June 2017).
  43. USDOT. Continuously Reinforced Concrete Pavement Design & Construction Guidelines. FHWA. Available online: http://crcpavement.org/wp-content/uploads/2014/12/CRCP-Design-and-Construction-Guidelines.pdf (accessed on 20 June 2017).
  44. Caltrans. Contract Cost Database. Available online: http://sv08data.dot.ca.gov/contractcost/ (accessed on 18 June 2017).
  45. Riverside County Transportation Commission (RCTC). SR-91 Project. Available online: http://rctcdev.info/projects/state-route-91/sr-91-corridor-improvement-project (accessed on 5 July 2017).
Figure 1. Graphical layout view of the SR-91 CIP (including I-15) (source: SR-91 PA/ED study).
Sustainability 10 00179 g001
Figure 2. Riverside City area section of roadway plan view for the SR-91 CIP (source: SR-91 PA/ED).
Sustainability 10 00179 g002
Figure 3. CA4PRS Work-zone module—Input screenshot.
Sustainability 10 00179 g003
Figure 4. CA4PRS Work-zone output screenshot.
Sustainability 10 00179 g004
Figure 5. CA4PRS Schedule Analysis - Input Screen.
Sustainability 10 00179 g005
Figure 6. CA4PRS Schedule Analysis - Output Screen.
Sustainability 10 00179 g006
Table 1. SR-91 CIP (including I-15) alternatives comparison (Modified from Caltrans [42]).
SegmentsNo-Build AlternativeAlternative 1Alternative 2
SR-91 DesignPCCPPCCPCRCP
I-15 DesignPCCPPCCPACP
SR-91: SR-241 to the Orange/Riverside County line2 tolled express lanes2 tolled express lanes2 tolled express lanes
5 general-purpose lanes6 general-purpose lanes6 general-purpose lanes
1 express auxiliary lane
SR-91: Orange/Riverside County line to SR-712 HOV lanes2 HOV lane2 tolled express lanes
5 general-purpose lanes6 general-purpose lanes6 general-purpose lanes
1 express auxiliary lane
SR-91: SR-71 to I-151 HOV lane1 HOV lane2 tolled express lanes
4 general-purpose lanes5 general-purpose lanes5 general-purpose lanes
1 auxiliary lane1 auxiliary lane
SR-91: I-15 to Pierce Street1 HOV lane1 HOV lane1 tolled express lanes
3 general-purpose lanes4 general-purpose lanes4 general-purpose lanes
I-15: Cajalco Road to Ontario Avenue3 general-purpose lanes3 general-purpose lanes1 tolled express lane
3 general-purpose lanes
I-15: Ontario Avenue to SR-914 general-purpose lanes1 HOV lane1 tolled express lane
4 general-purpose lanes4 general-purpose lanes
I-15: SR-91 Interchange to Hidden Valley Parkway4 general-purpose lanes4 general-purpose lanes1 tolled express lane
4 general-purpose lanes
Table 2. Existing conditions—2007 daily and truck traffic volumes (Modified from Caltrans [28]).
LocationAADTTruck AADTTruck %
SR-91 at County Line280,00015,1005.5
SR-91 west of I-15271,50014,5005.3
SR-91 east of I-15223,50016,3007.3
I-15 north of SR-91170,80017,90010.5
I-15 south of SR-91200,80010,3005.1
SR-91 Ramps (56 EA) Average11,381N/AN/A
I-15 Ramps (24 EA) Average8856N/AN/A
Table 3. Future traffic and TI calculations.
Location2035 AADT (a)40-Year ESAL (b)40-Year TI (a)
SR-91 at County Line409,100169,000,00016.1
SR-91 west of I-15390,700155,000,00016.0
SR-91 east of I-15273,200149,000,00015.9
I-15 north of SR-91323,80064,000,00012.2
I-15 south of SR-91336,90032,000,00011.2
SR-91 Ramps (60 EA) Average15,5059,000,00011.6
I-15 Ramps (27 EA) Average13,26710,000,00011.8
(a) Equivalent Single Axel Load data obtained from Caltrans [28]. (b) ESAL and TI use one-way AADT (1/2 AADT).
Table 4. SR-91 GP widening plan costs for alternative 1 and 2 (Modified from Caltrans [42]).
AlternativePavement ItemThickness (ft.)Unit-Price (sf)Unit-Price ($/sf)
Alt. 1 (Long-life PCCP)PCCP1.1$6.37$7.02
HMA BB0.1$6.85$0.69
LCB0.5$4.37$2.19
AS (Class 2)0.7$1.11$0.78
Average Unit-Price $/sf =$10.66
SR-91 Pavement Cost (Alternative 1) =$69,616,918
Alt. 2 (CRCP Long-life)CRCP0.95$6.37$6.05
Rebar3.44 lb./sf$0.65/lb.$2.24
ACP (HMA)0.5$6.26$3.10
AS (Class 2)0.7$1.11$0.80
Average Unit-Price $/sf =$12.20
SR-91 Total Pavement Cost (Alternative 2) =$79,696,819
Table 5. I-15 Lane widening plan costs for alternative 1 and 2 (Modified from Caltrans [42]).
AlternativePavement ItemThickness (ft.)Unit-Price (sf)Unit-Price ($/sf)
Alt. 1 (Long-life PCCP)PCCP0.96$6.37$6.14
HMA BB0.1$6.85$0.69
LCB0.5$4.37$2.19
AS (Class 2)0.7$1.11$0.78
Average Unit-Price $/sf =$9.79
I-15 Pavement Cost (Alternative 1) =$19,691,841
Alternative 2 (Long-life ACP)RHMA-G0.10$7.23$0.72
HMA-C PG-PM (long-life)0.20$6.48$1.30
HMA-C PG-PM (a)1.46$6.48$9.45
AB (Class 2)0.5$1.15$0.60
Average Unit-Price $/sf =$12.05
I-15 Total Pavement Cost (Alternative 2) =$24,221,347
(a) Thickness and Unit-Price are average of North and South of SR-91 segments.
Table 6. SR-91 ramp plan costs for alternative 1 and 2 (Modified from Caltrans [42]).
AlternativePavement ItemThickness (ft.)Unit-Price (sf)Unit-Price ($/sf)
Alt. 1 (Long-life PCCP)PCCP (a)0.80$6.37$5.11
HMA BB0.1$6.85$0.69
LCB (a)0.43$4.37$1.86
AS (Class 2) (a)0.63$1.11$0.69
Average Unit-Price $/sf =$8.35
SR-91 Ramp Cost (Alternative 1) =$9,739,931
Alternative 2 (Long-life ACP)RHMA-G0.10$7.23$0.72
HMA-C PG-PM (long-life)0.20$8.80$1.76
HMA-C PG-PM (a)1.15$6.48$7.48
AB (Class 2)0.5$1.15$0.58
Average Unit-Price $/sf =$10.53
SR-91 Ramp Cost (Alternative 2) =$12,287,219
(a) Thickness and Unit-Price are average of Heavy (7 EA) and Medium (20 EA) Traffic SR-91 ramps.
Table 7. Summary of annual maintenance cost for SR-91 GP Lanes and SR-91 Ramps and I-15 Lanes.
LCCA AlternativeConstruction ActivityService Life (Years)Construction (Year)Annual Maint. ($/Lane-Mile)
SR-91 GP LanesAlt. 1 (Long-life PCCP)PCCP GP Widening45 (a)2015$800
1st PCCP CAPM52060$1500
2nd PCCP CAPM102065$1500
Alt. 2 (Long-life CRCP)CRCP GP Widening50 (b)2015$200
1st CRCP CAPM52065$1400
2nd CRCP CAPM52070$1400
SR-91 Ramps and I-15 LanesAlt. 1 (Long-life PCCP)PCCP Widening45 (c)2015$800
1st PCCP CAPM52060$1500
2nd PCCP CAPM102065$1500
Alt. 2 (Long-life ACP)ACP Widening402015$7200
RHMA-G10 (d)2025
2035
2045
$3700
1st ACP CAPM102055$3700
2nd ACP CAPM102065$3700
(a) Service life is 5 years greater than design life; (b) Service life is 10 years greater than design life. (c) Service life is 5 years greater than design life; (d) RHMA-G for the 10-year service life does not provide pavement durability performance.
Table 8. SR-91 Lane Rehab Plan Costs for Alternative 1 and 2 (Modified from Caltrans [42]).
AlternativeActivityPavement ItemUnit-Price (/sf)Area (sf)Price ($)
Alt. 1 (Long-life PCCP)1st PCCP CAPMCPR “C” (2% Slab-replace)$16.6130,665$2,171,946
Grinding (100% of surface)$0.46,533,260$2,874,634
Seal Joint (100% of joints)$3.01,633,315$4,899,945
1st CAPM Total Pavement Cost (yr. 2060) =$9,946,525
1st CAPM Total Pavement and Agency Cost (yr. 2060) =$20,821,097
2nd PCCP CAPMCPR “B” (5% Slab-replace)$16.6326,663$5,429,865
Grinding (25% of surface)$0.41,633,315$718,659
Seal Joint (15% of joints)$3.0244,997$734,992
2nd CAPM Total Pavement Cost (yr. 2065) =$6,883,515
2nd CAPM Total Pavement and Agency Cost (yr. 2065) =$14,409,287
Alt. 2 (CRCP Long-life)1st CRCP CAPMCPR “C” (2% CRCP Slab-replace)$14.4130,665$1,875,772
Grinding (100% of surface)$0.46,533,260$2,874,634
Rebar (Random-slab rebar)$4.51,633,315$2,874,634
1st CAPM Total Pavement Cost (yr. 2065) =$5,335,786
1st CAPM Total Pavement and Agency Cost (yr. 2065) =$11,169,420
2nd CRCP CAPMCPR “B” (2% CRCP Slab-replace)$14.4326,663$4,689,429
Grinding (25% of surface)$0.41,633,315$718,659
Rebar (Random-slab rebar)$4.5244,997$1,463,450
2nd CAPM Total Pavement Cost (yr. 2070) =$6,152,879
2nd CAPM Total Pavement and Agency Cost (yr. 2070) =$12,879,843
Table 9. I-15 Lane rehab plan costs for alternative 1 and 2 (Modified from Caltrans [42]).
AlternativeActivityPavement ItemUnit-Price (/sf)Area (sf)Price ($)
Alt. 1 (Long-life PCCP)1st PCCP CAPMCPR “C” (2% Slab-replace)$14.640,215$586,423
Grinding (100% of surface)$0.42,010,747$884,729
Seal Joint (100% of joints)$3.0502,687$1,508,060
1st CAPM Total Pavement Cost (yr. 2060) =$2,979,212
1st CAPM Total Pavement and Agency Cost (yr. 2060) =$6,236,395
2nd PCCP CAPMCPR “B” (5% Slab-replace)$14.6100,537$1,466,058
Grinding (25% of surface)$0.4502,687$221,182
Seal Joint (15% of joints)$3.075,403$226,209
2nd CAPM Total Pavement Cost (yr. 2065) =$1,913,449
2nd CAPM Total Pavement and Agency Cost (yr. 2065) =$4,005,430
Alt. 2 (Long-life ACP)1st, 2nd and 3rd RHMA-GRHMA-G & Cold-plane$0.912,010,747$1,835,108
1st CAPM Pavement/Agency Cost (yr. 2025, 2035, 2045) =$3,841,439
1st and 2nd ACP CAPMRHMA-G & Milling$1.12,010,747$2,211,822
HMA-C PG-PM$1.32,010,747$2,613,971
1st CAPM Total Pavement Cost (yr. 2055 and 2065) =$4,823,682
1st CAPM Pavement/Agency Cost (yr. 2055 and 2065) =$10,097,429
Table 10. SR-91 Ramp rehab plan for alternative 1 and 2 (Modified from Caltrans [42]).
AlternativeActivityPavement ItemUnit-Price (/sf)Area (sf)Price ($)
Alt. 1 (Long-life PCCP)1st PCCP CAPMCPR “C” (2% Slab-replace)$12.1223,328$282,661
Grinding (100% of surface)$0.41,166,400$513,216
Seal Joint (100% of joints)$3.0291,600$874,800
1st CAPM Total Pavement Cost (yr. 2060) =$1,670,677
Agency Support Cost Multiplier ≈2.09
1st CAPM Total Pavement and Agency Cost (yr. 2060) =$3,491,718
2nd PCCP CAPMCPR “B” (5% Slab-replace)$12.1258,320$706,656
Grinding (25% of surface)$0.41,166,400$513,216
Seal Joint (15% of joints)$3.043,740$131,220
2nd CAPM Total Pavement Cost (yr. 2065) =$1,351,092
Agency Support Cost Multiplier ≈2.09
2nd CAPM Total Pavement and Agency Cost (yr. 2065) =$2,823,782
Alt. 2 (Long-life ACP)1st, 2nd and 3rd RHMA-GRHMA-G & Cold-plane$0.911,166,400$1,061,424
Agency Support Cost Multiplier ≈2.09
1st CAPM Pavement/Agency Cost (yr. 2025, 2035, 2045) =$2,224,836
1st and 2nd ACP CAPMRHMA-G & Milling$1.01,166,400$1,166,400
HMA-C PG-PM$1.31,166,400$1,516,320
1st CAPM Total Pavement Cost (yr. 2055 and 2065) =$2,682,720
Agency Support Cost Multiplier ≈2.09
1st CAPM Pavement/Agency Cost (yr. 2055 and 2065) =$5,616,514
Table 11. Number of 7-h Night Closures for Future M&R Activities Construction (Modified from Caltrans [42]).
RouteLCCA AlternativeM&R ActivityYearPavement Cross-SectionClosure Number
SR-91 GP LanesAlt. 1 (PCCP Long-life)1st PCCP CAPM2060CPR “C” (2% Slab-replace)131
2nd PCCP CAPM2065CPR “B” (5% Slab-replace)336
Alt. 2 (CRCP Long-life)1st CRCP CAPM2065CPR “C” (2% Slab-replace)170 (a)
2nd CRCP CAPM2070CPR “B” (5% Slab-replace)437 (a)
I-15 Express LanesAlt. 1 (PCCP Long-life)1st PCCP CAPM2060CPR “C” (2% Slab-replace)41
2nd PCCP CAPM2065CPR “B” (5% Slab-replace)105
Alt. 2 (ACP Long-life)1st RHMA-G20250.1′ Milling and AC Overlay42
2nd RHMA-G20350.1′ Milling and AC Overlay42
3rd RHMA-G20450.1′ Milling and AC Overlay42
1st ACP CAPM20550.3′ Milling and AC Overlay143
2nd ACP CAPM20650.3′ Milling and AC Overlay143
Notes: (a) It was assumed that the CRCP CAPMs were 30% higher than the JPCP CAPMs based on results from the CA4PRS.
Table 12. Summary of the LCCA Comparison for the SR-91 GP Lanes (Modified from Caltrans [42]).
LCCA AlternativeConstructionLifeYearAgency Cost (Discounted Value) ($k)Agency Cost (Undiscounted Value) ($k)
Alternative1 (Long-life PCCP)PCCP GP Widening45201569,61769,617
1st PCCP CAPM52060356520,821
2nd PCCP CAPM102065202814,410
Annual Maintenance 20046033
Total60 77,213110,881
Alternative2 (Long-life CRCP)CRCP GP Widening50201579,69779,697
1st ACP CAPM52065157211,169
2nd ACP CAPM52070149012,880
Annual Maintenance 6082475
Total60 83,366106,221
Cost Difference (Alt 1–Alt 2)(6153)(4659)
Table 13. Summary of the LCCA Comparison for the I-15 Lanes (Modified from Caltrans [42]).
LCCA AlternativeConstructionLifeYearDiscounted ValueUndiscounted Value
Agency ($k)Toll Loss ($k)Agency ($k)Toll Loss ($k)
Alternative 1 (Long-life PCCP)PCCP Lane Widening45201519,692 19,692
1st PCCP CAPM52060106836623636
2nd PCCP CAPM10206556498400598
Annual Maintenance 617 1857
Total60 22,07513531,925135
Alternative 2 (Long-life ACP)ACP Lane Widening40201524,221 24,221
1st RHMA-G102025259532384132
2nd RHMA-G102035175335384135
3rd RHMA-G102045118432384132
1st ACP CAPM102055210312110,097121
2nd ACP CAPM102065142113310,097133
Annual Maintenance 4856 11,491
Total60 38,48635267,783352
Cost Difference (Alt 1–Alt 2)(16,412)(217)(35,858)(217)
Table 14. Summary of the LCCA Comparison for the SR-91 Ramps (Modified from Caltrans [42]).
LCCA AlternativeConstructionLifeYearDiscounted ValueUndiscounted Value
Agency ($k)RUC ($k)Agency ($k)RUC ($k)
Alternative 1 (Long-life PCCP)PCCP Ramps Widening4520159740 9740
1st PCCP CAPM52060598753492438
2nd PCCP CAPM102065397832824593
Annual MaintenanceN/AN/A357 1075
Total60 11,09215817,1311031
Alternative 2 (Long-life ACP)ACP Ramps Widening40201512,287 12,287
1st RHMA-G10202515031742225258
2nd RHMA-G10203510151222225268
3rd RHMA-G102045686862225278
1st ACP CAPM10205511701825617876
2nd ACP CAPM1020657901285617908
Annual MaintenanceN/AN/A2812 6654
Total60 20,26469236,8492587
Cost Difference (Alt 1–Alt 2)(9172)(534)(19,718)(1556)
Table 15. Summary of NPV LCCA comparison for all segments.
LCCA AlternativeConstructionNet Present Value
Agency ($k)Toll Loss ($k) (a)RUC ($k)Total
Alternative 1 (Long-life PCCP)SR-91 Lanes Total77,213 77,213
I-15 Lanes Total22,075135 22,210
SR-91 Ramps Total11,092 15811,250
Total110,380135158110,673
Alternative 2 (Long-life CRCP/ACP)SR-91 Lanes Total83,366 83,366
I-15 Lanes Total38,486352 38,838
SR-91 Ramps Total20,264 69220,956
Total142,116352692143,160
(a) Toll loss is treated as an agency cost.

