Impact of Land-Use and Land-Cover Change on Meteorology in the Beijing–Tianjin–Hebei Region from 1990 to 2010


Abstract
:1. Introduction
2. Study Area and Materials
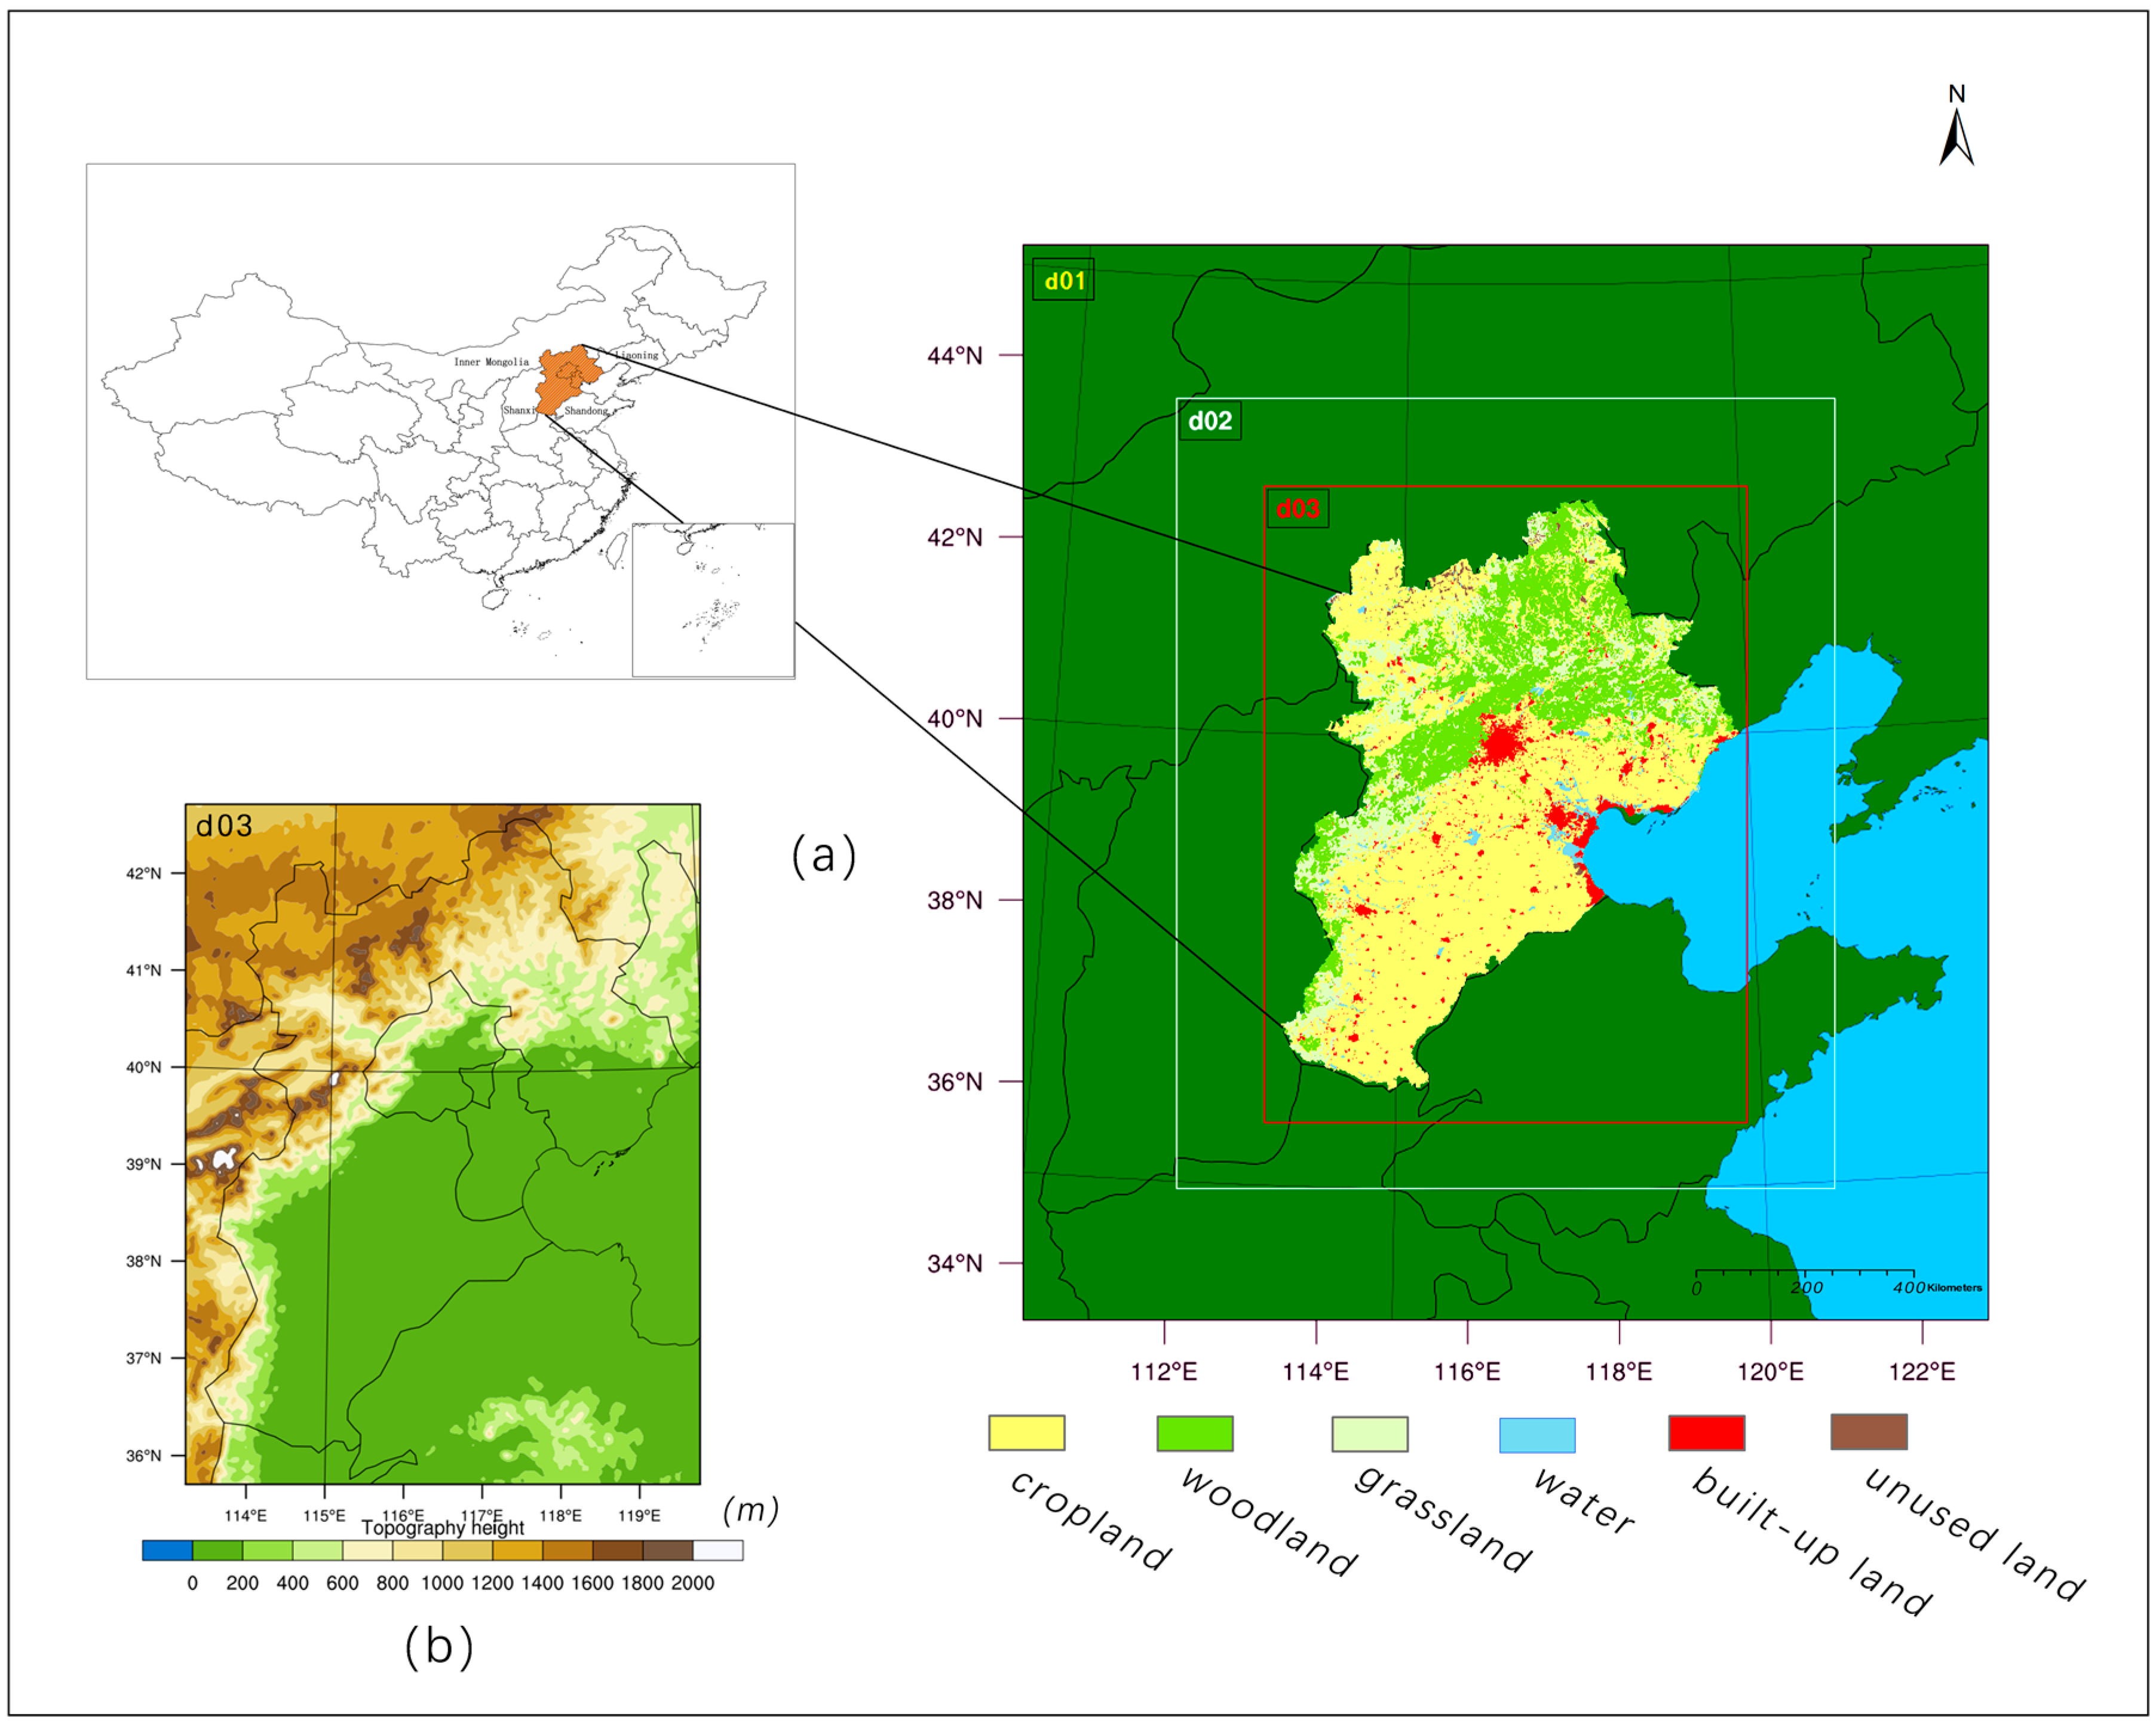
2.1. Study Area
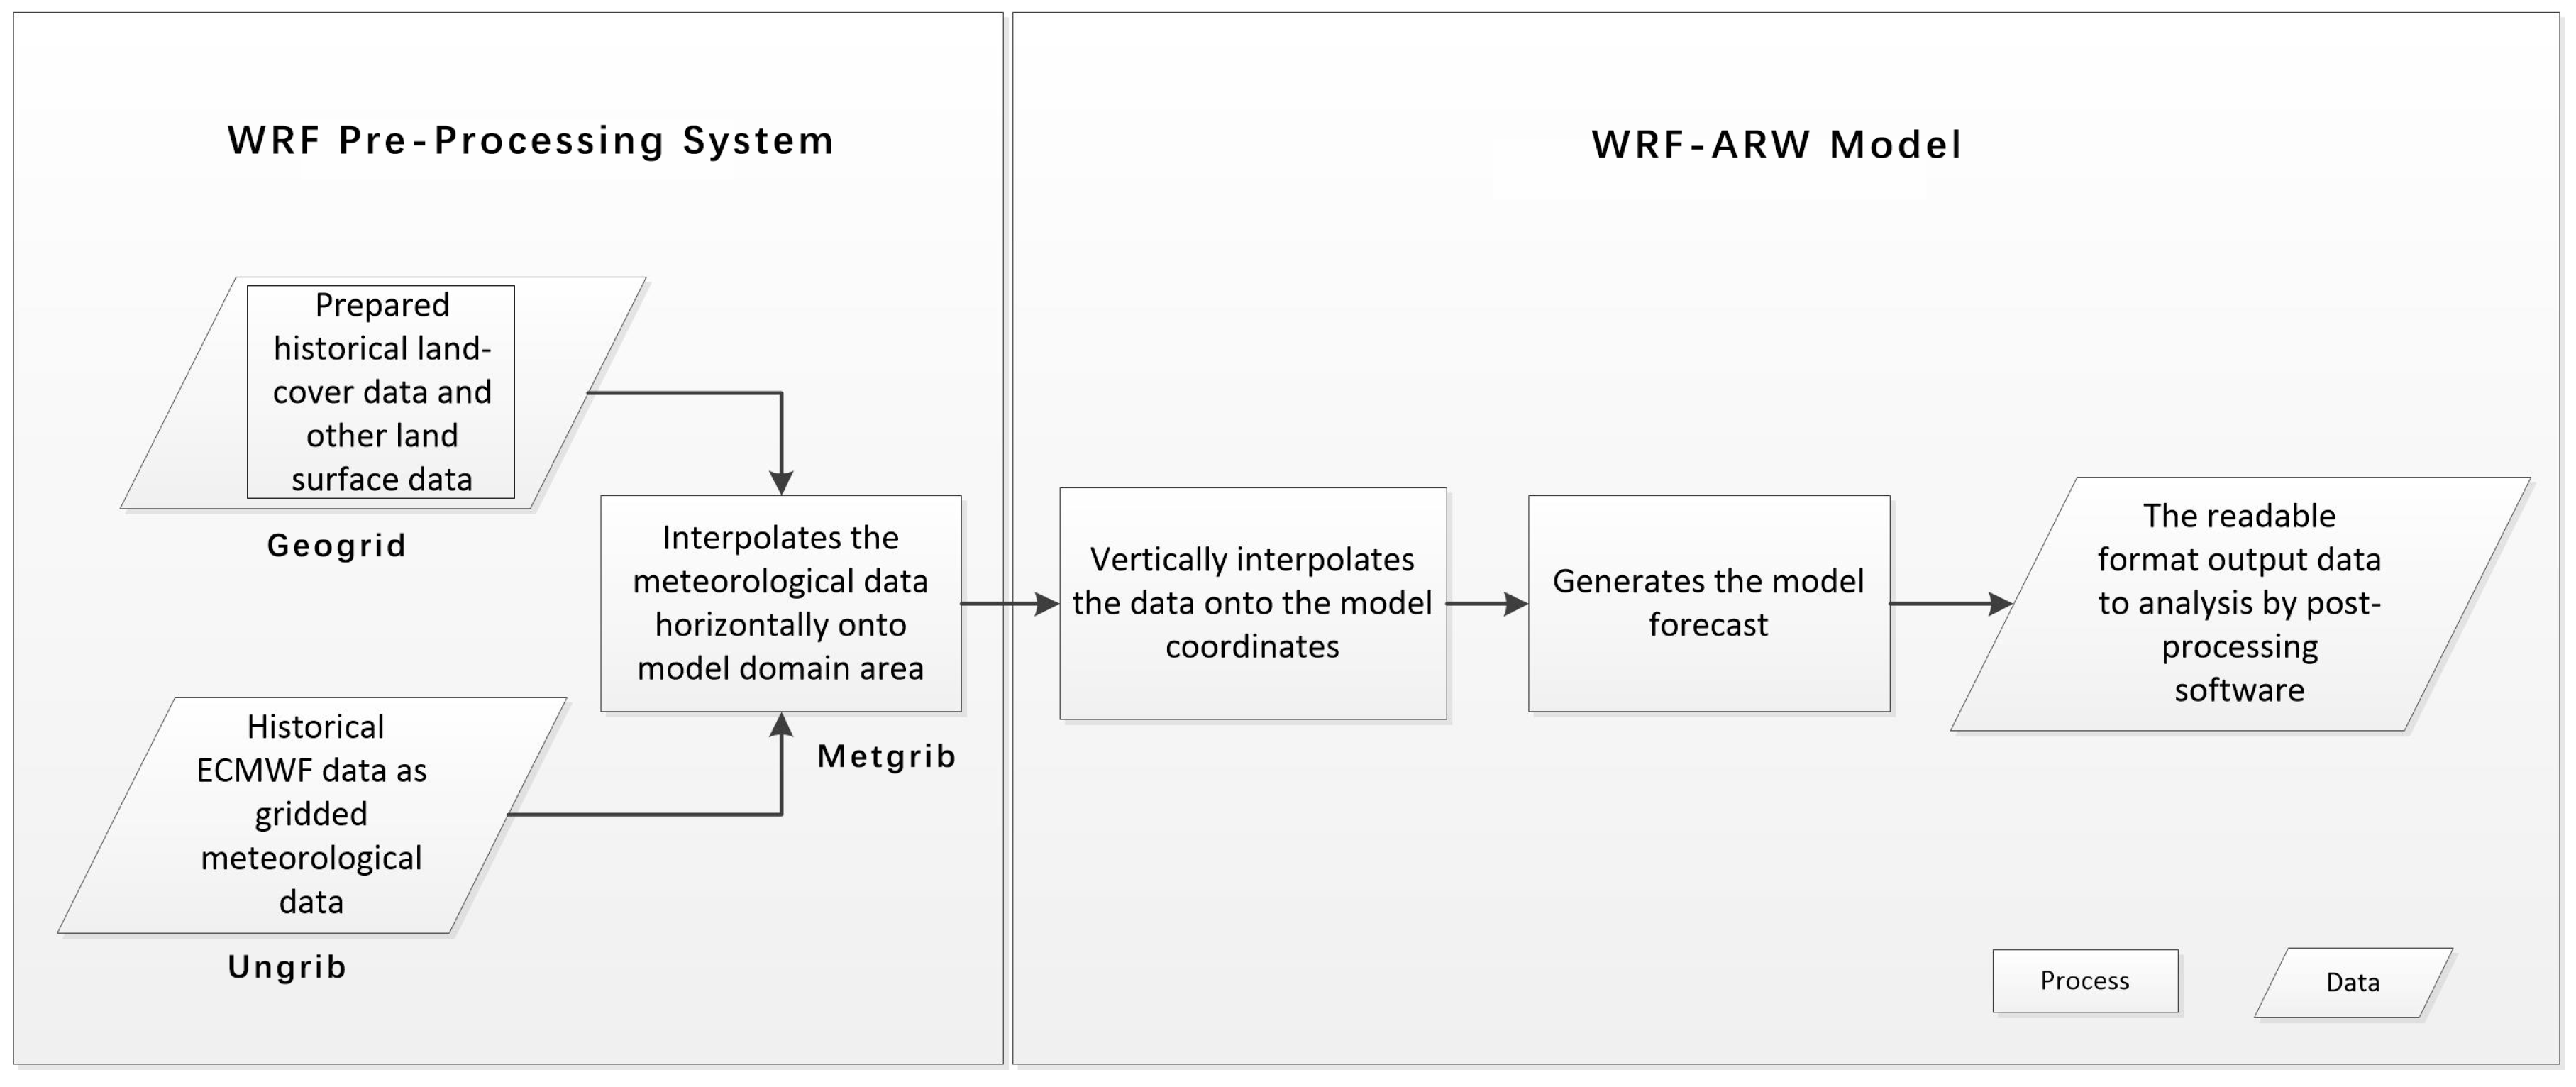
2.2. Model Description
2.3. Data
2.3.1. Land Use and Land Cover Data
2.3.2. Reanalysis Data
2.3.3. Observational Data
3. Methods
3.1. LULC Transfer Matrix Analysis
3.2. WRF Simulation Scheme
4. Results
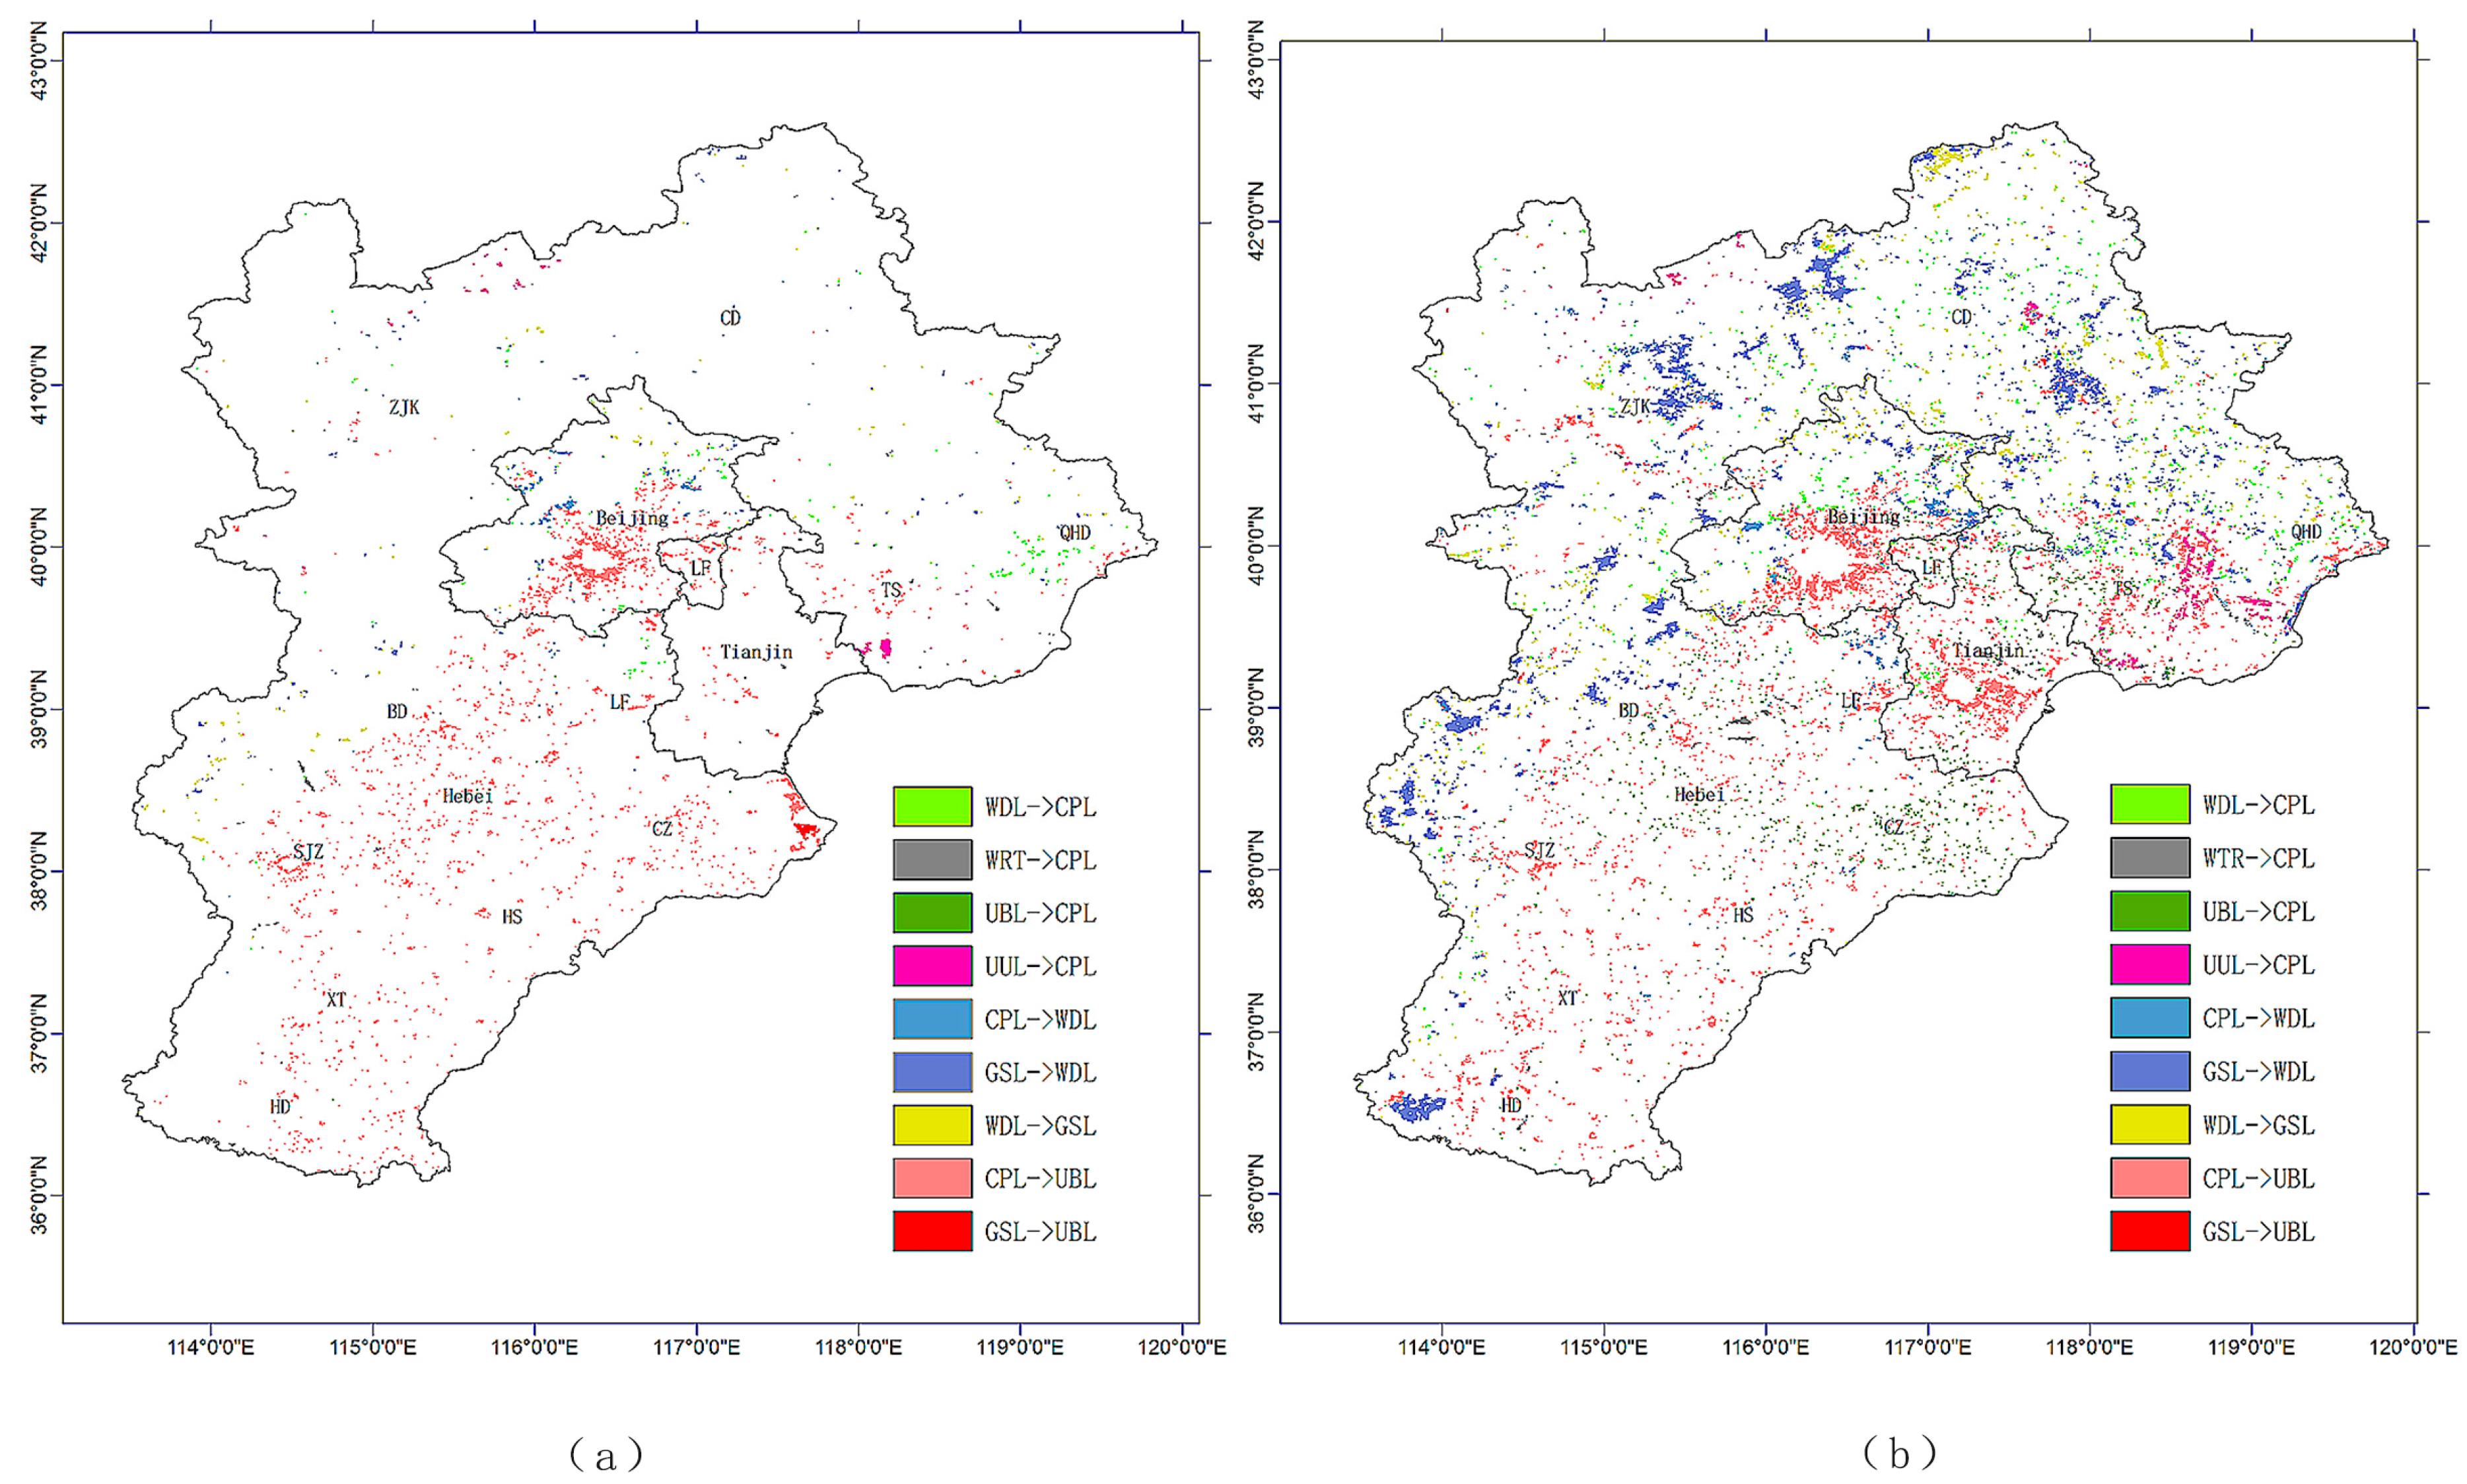
4.1. LULC Change from 1990 to 2010
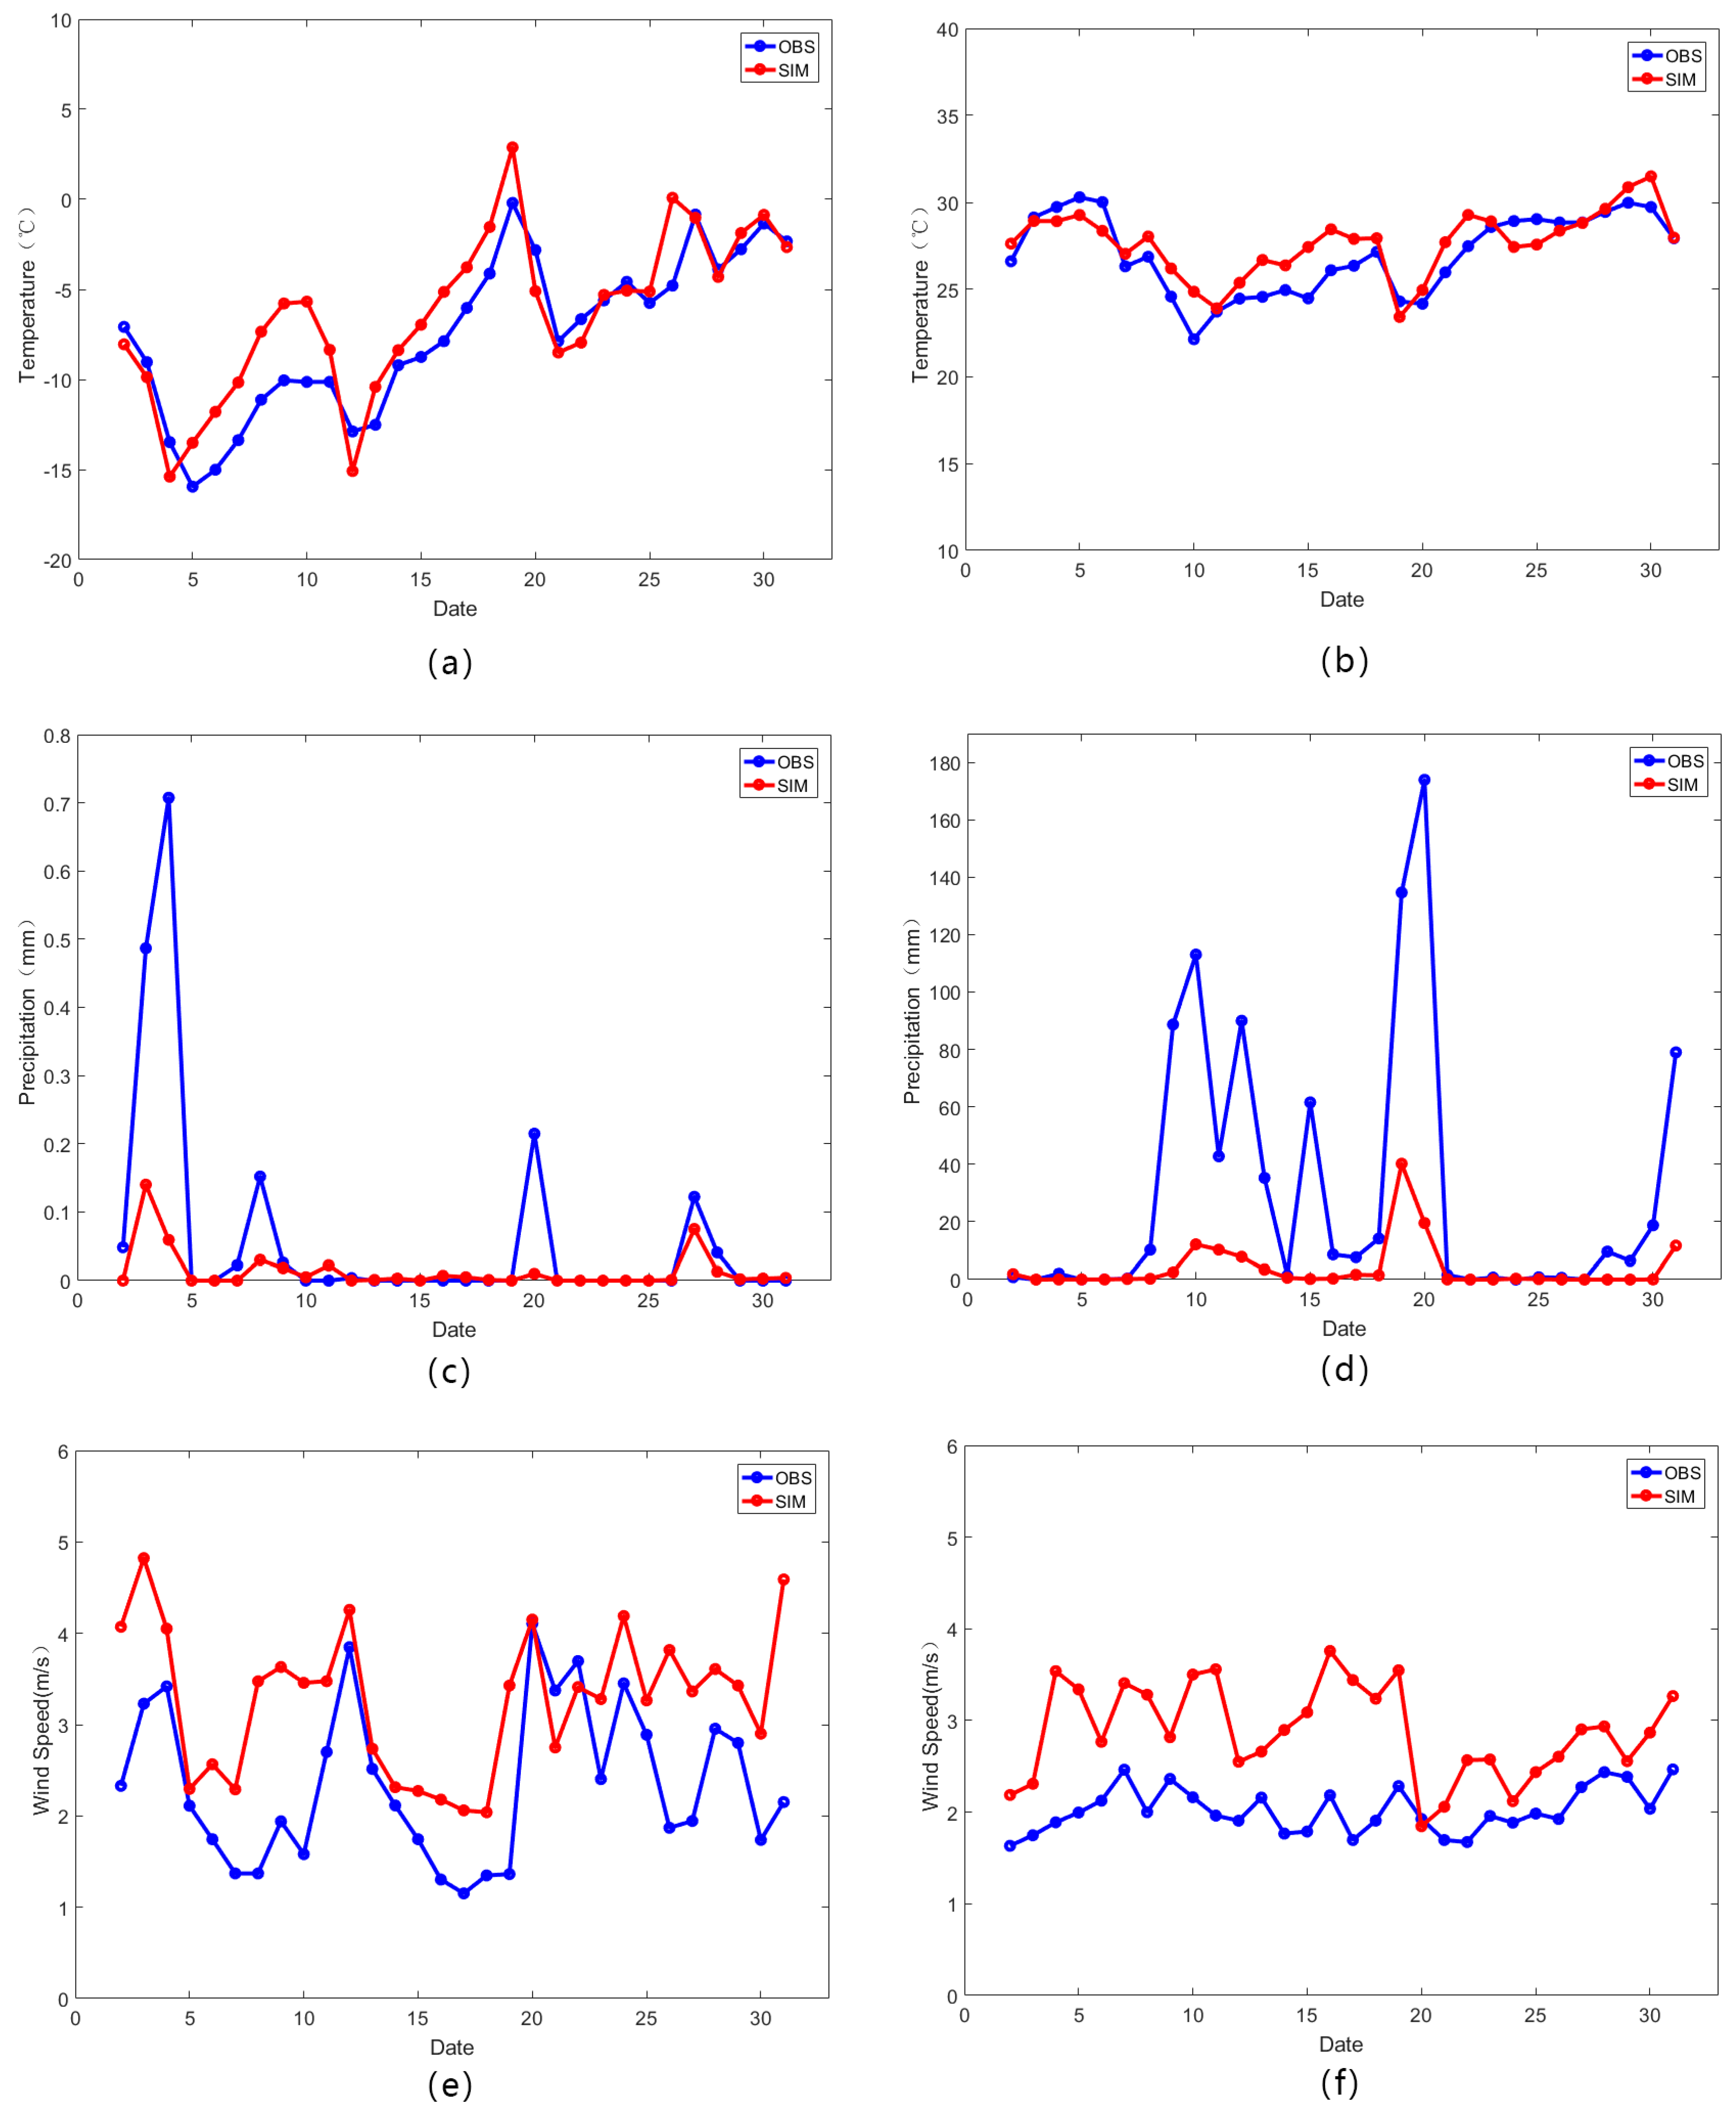
4.2. Validation of the WRF Simulation
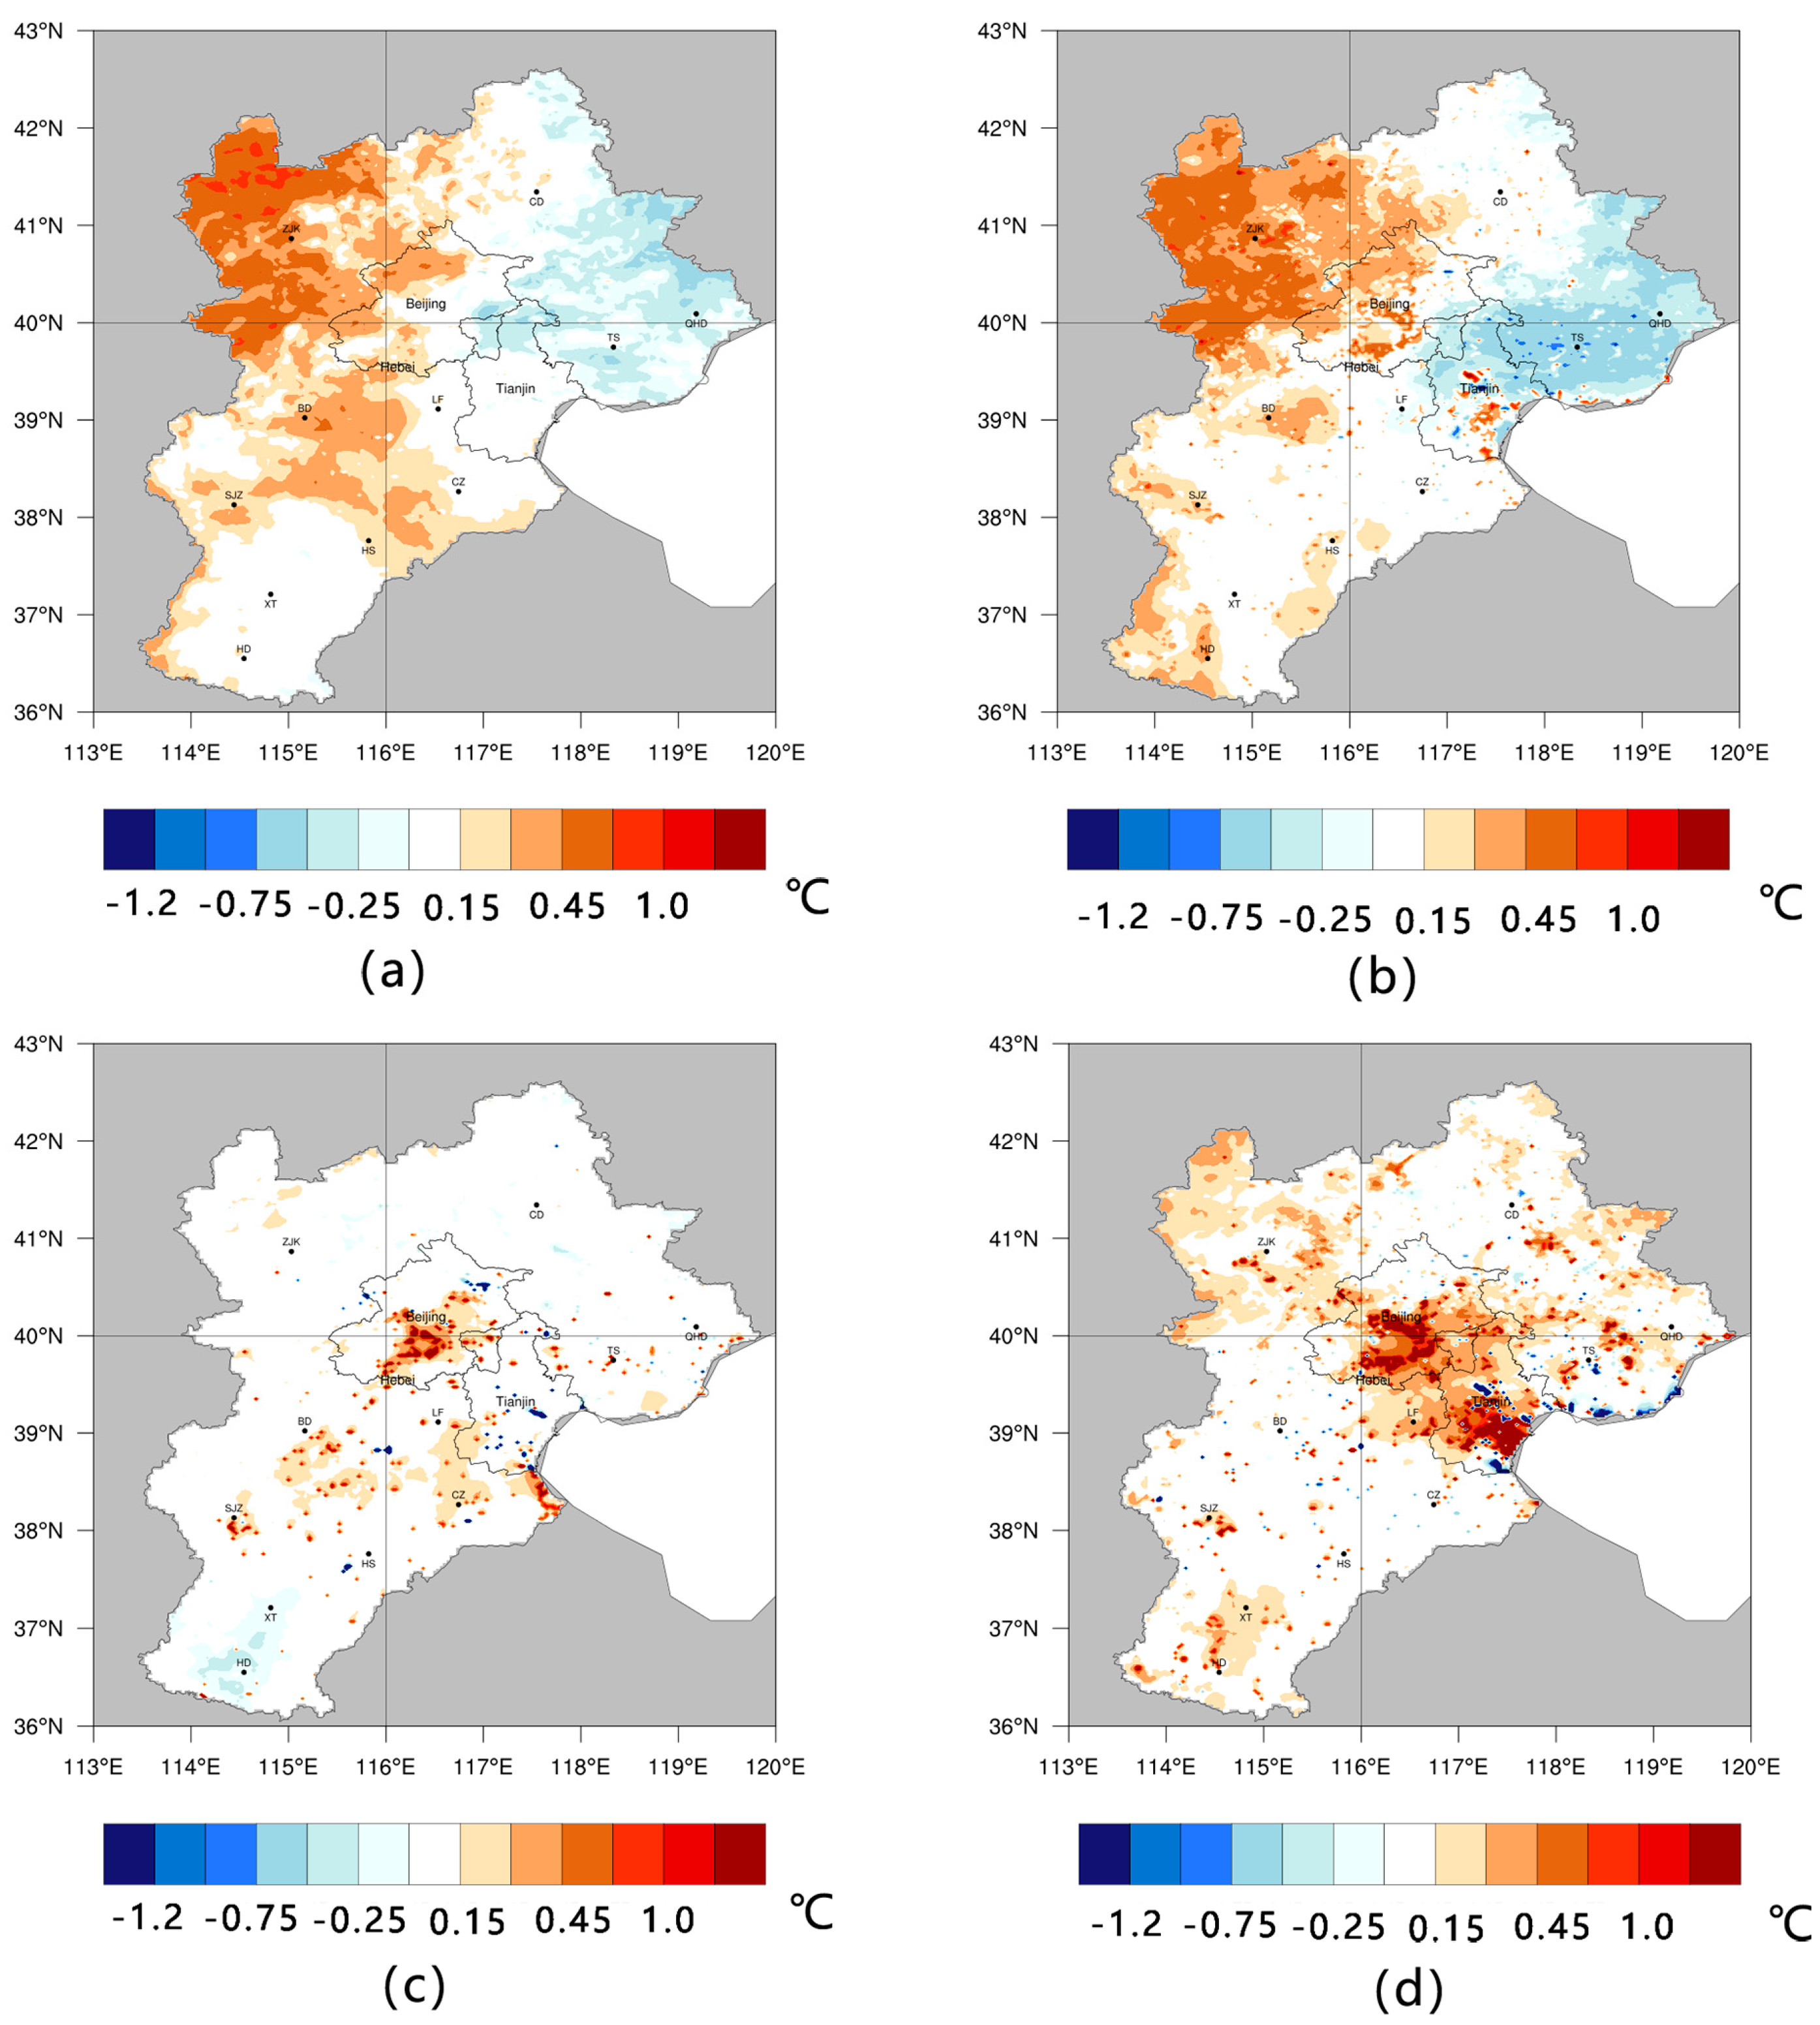
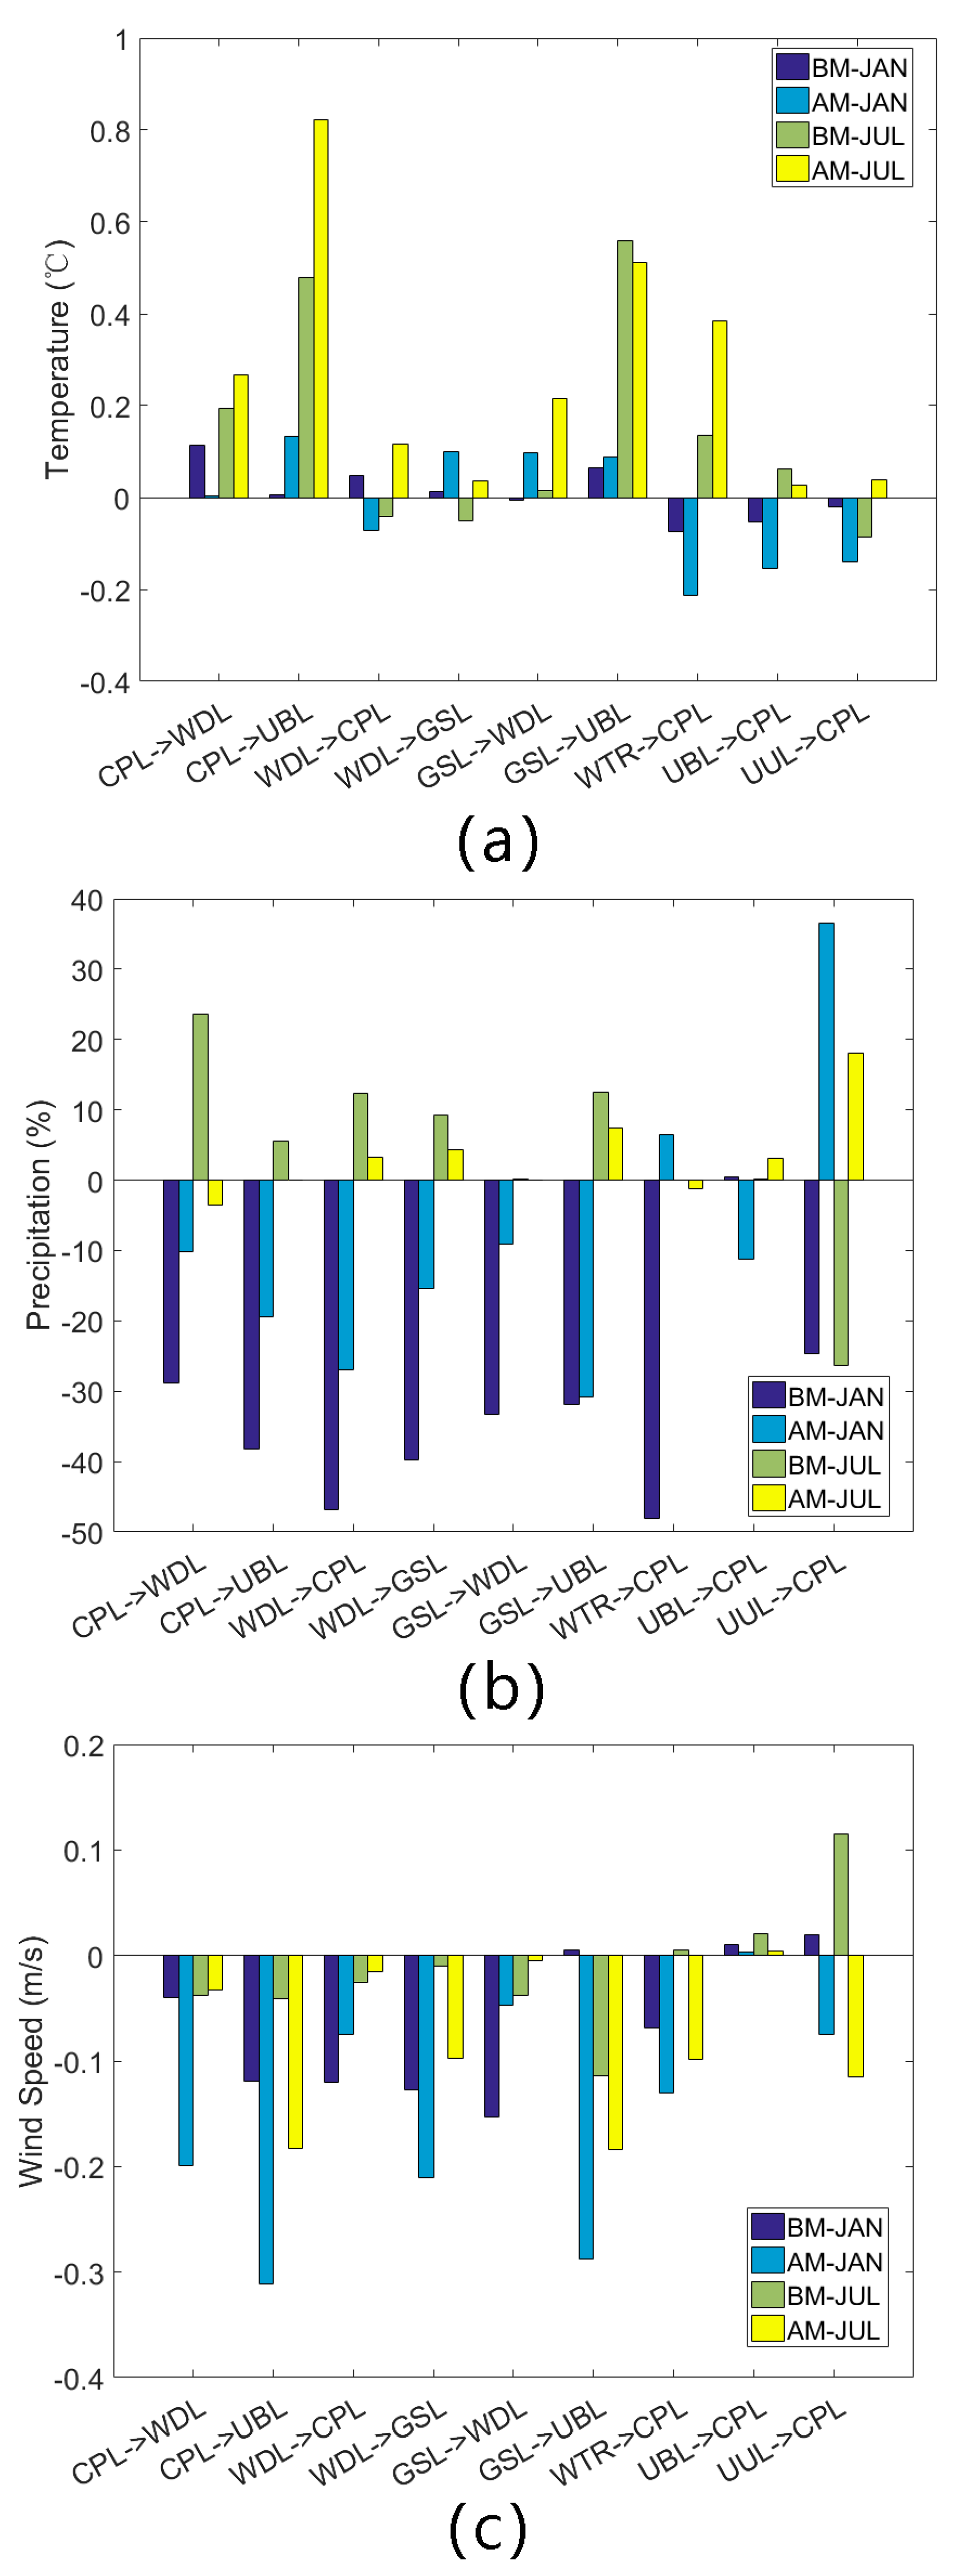
4.3. Impacts of LULC on Air Temperature
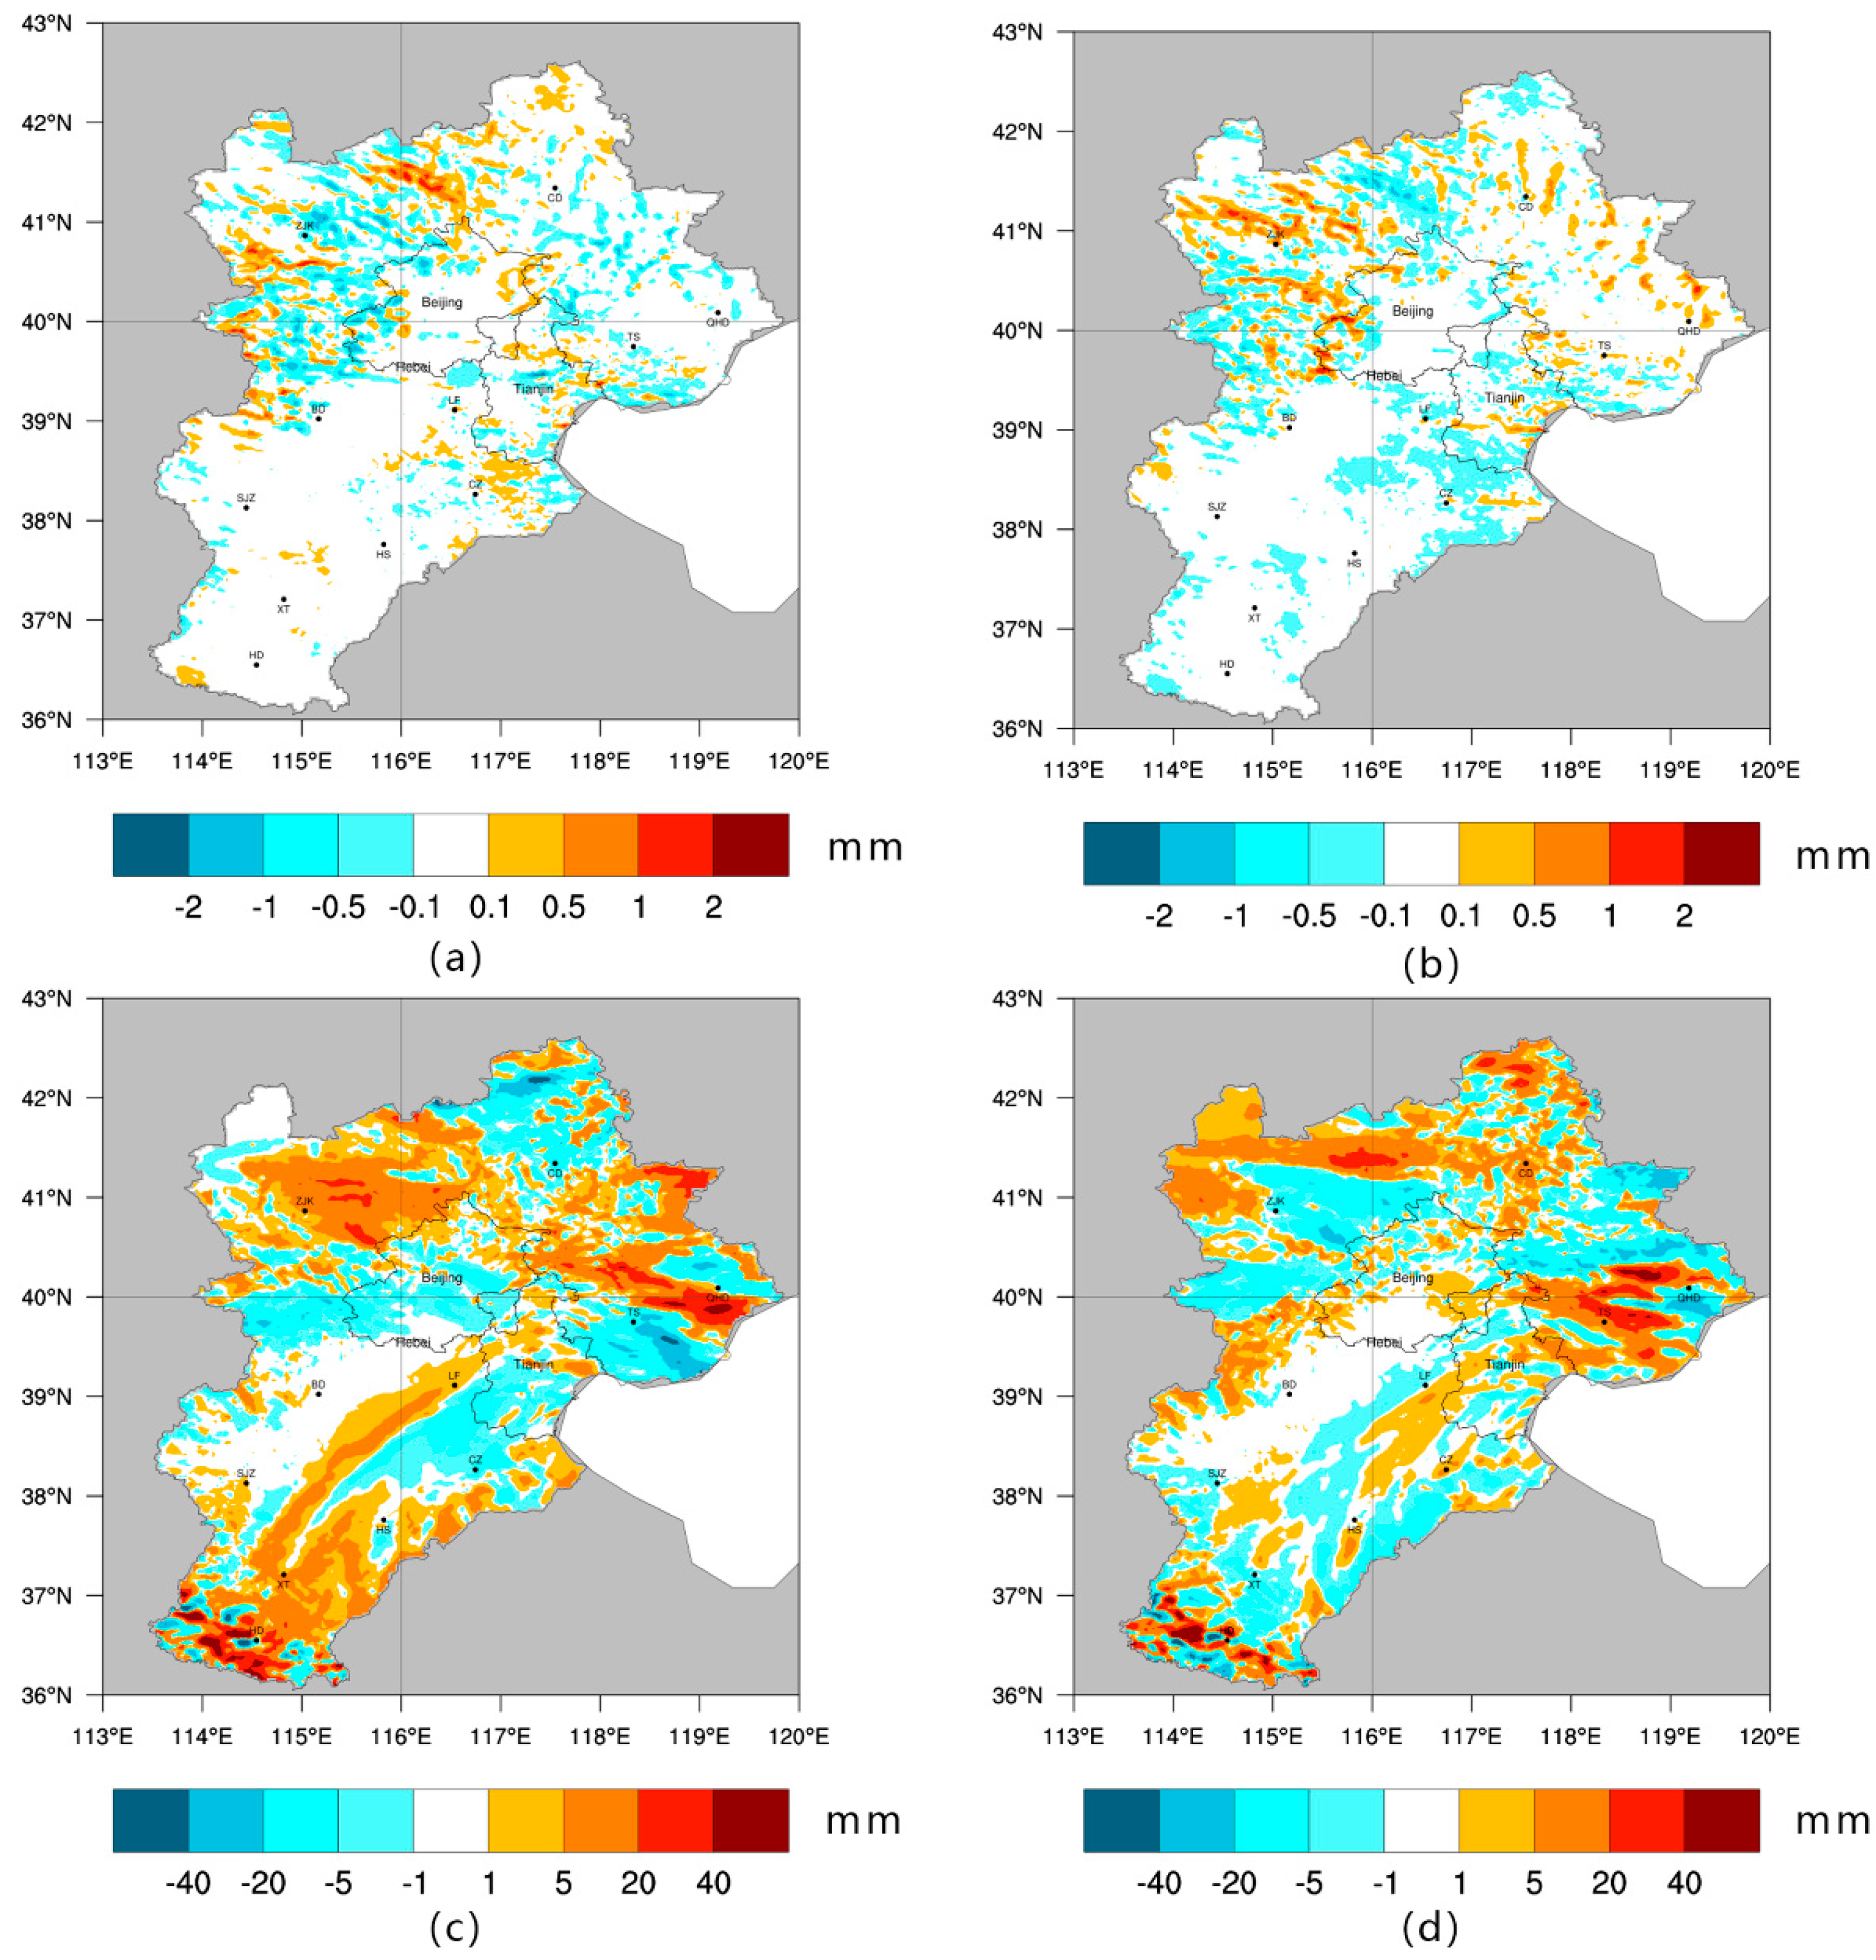
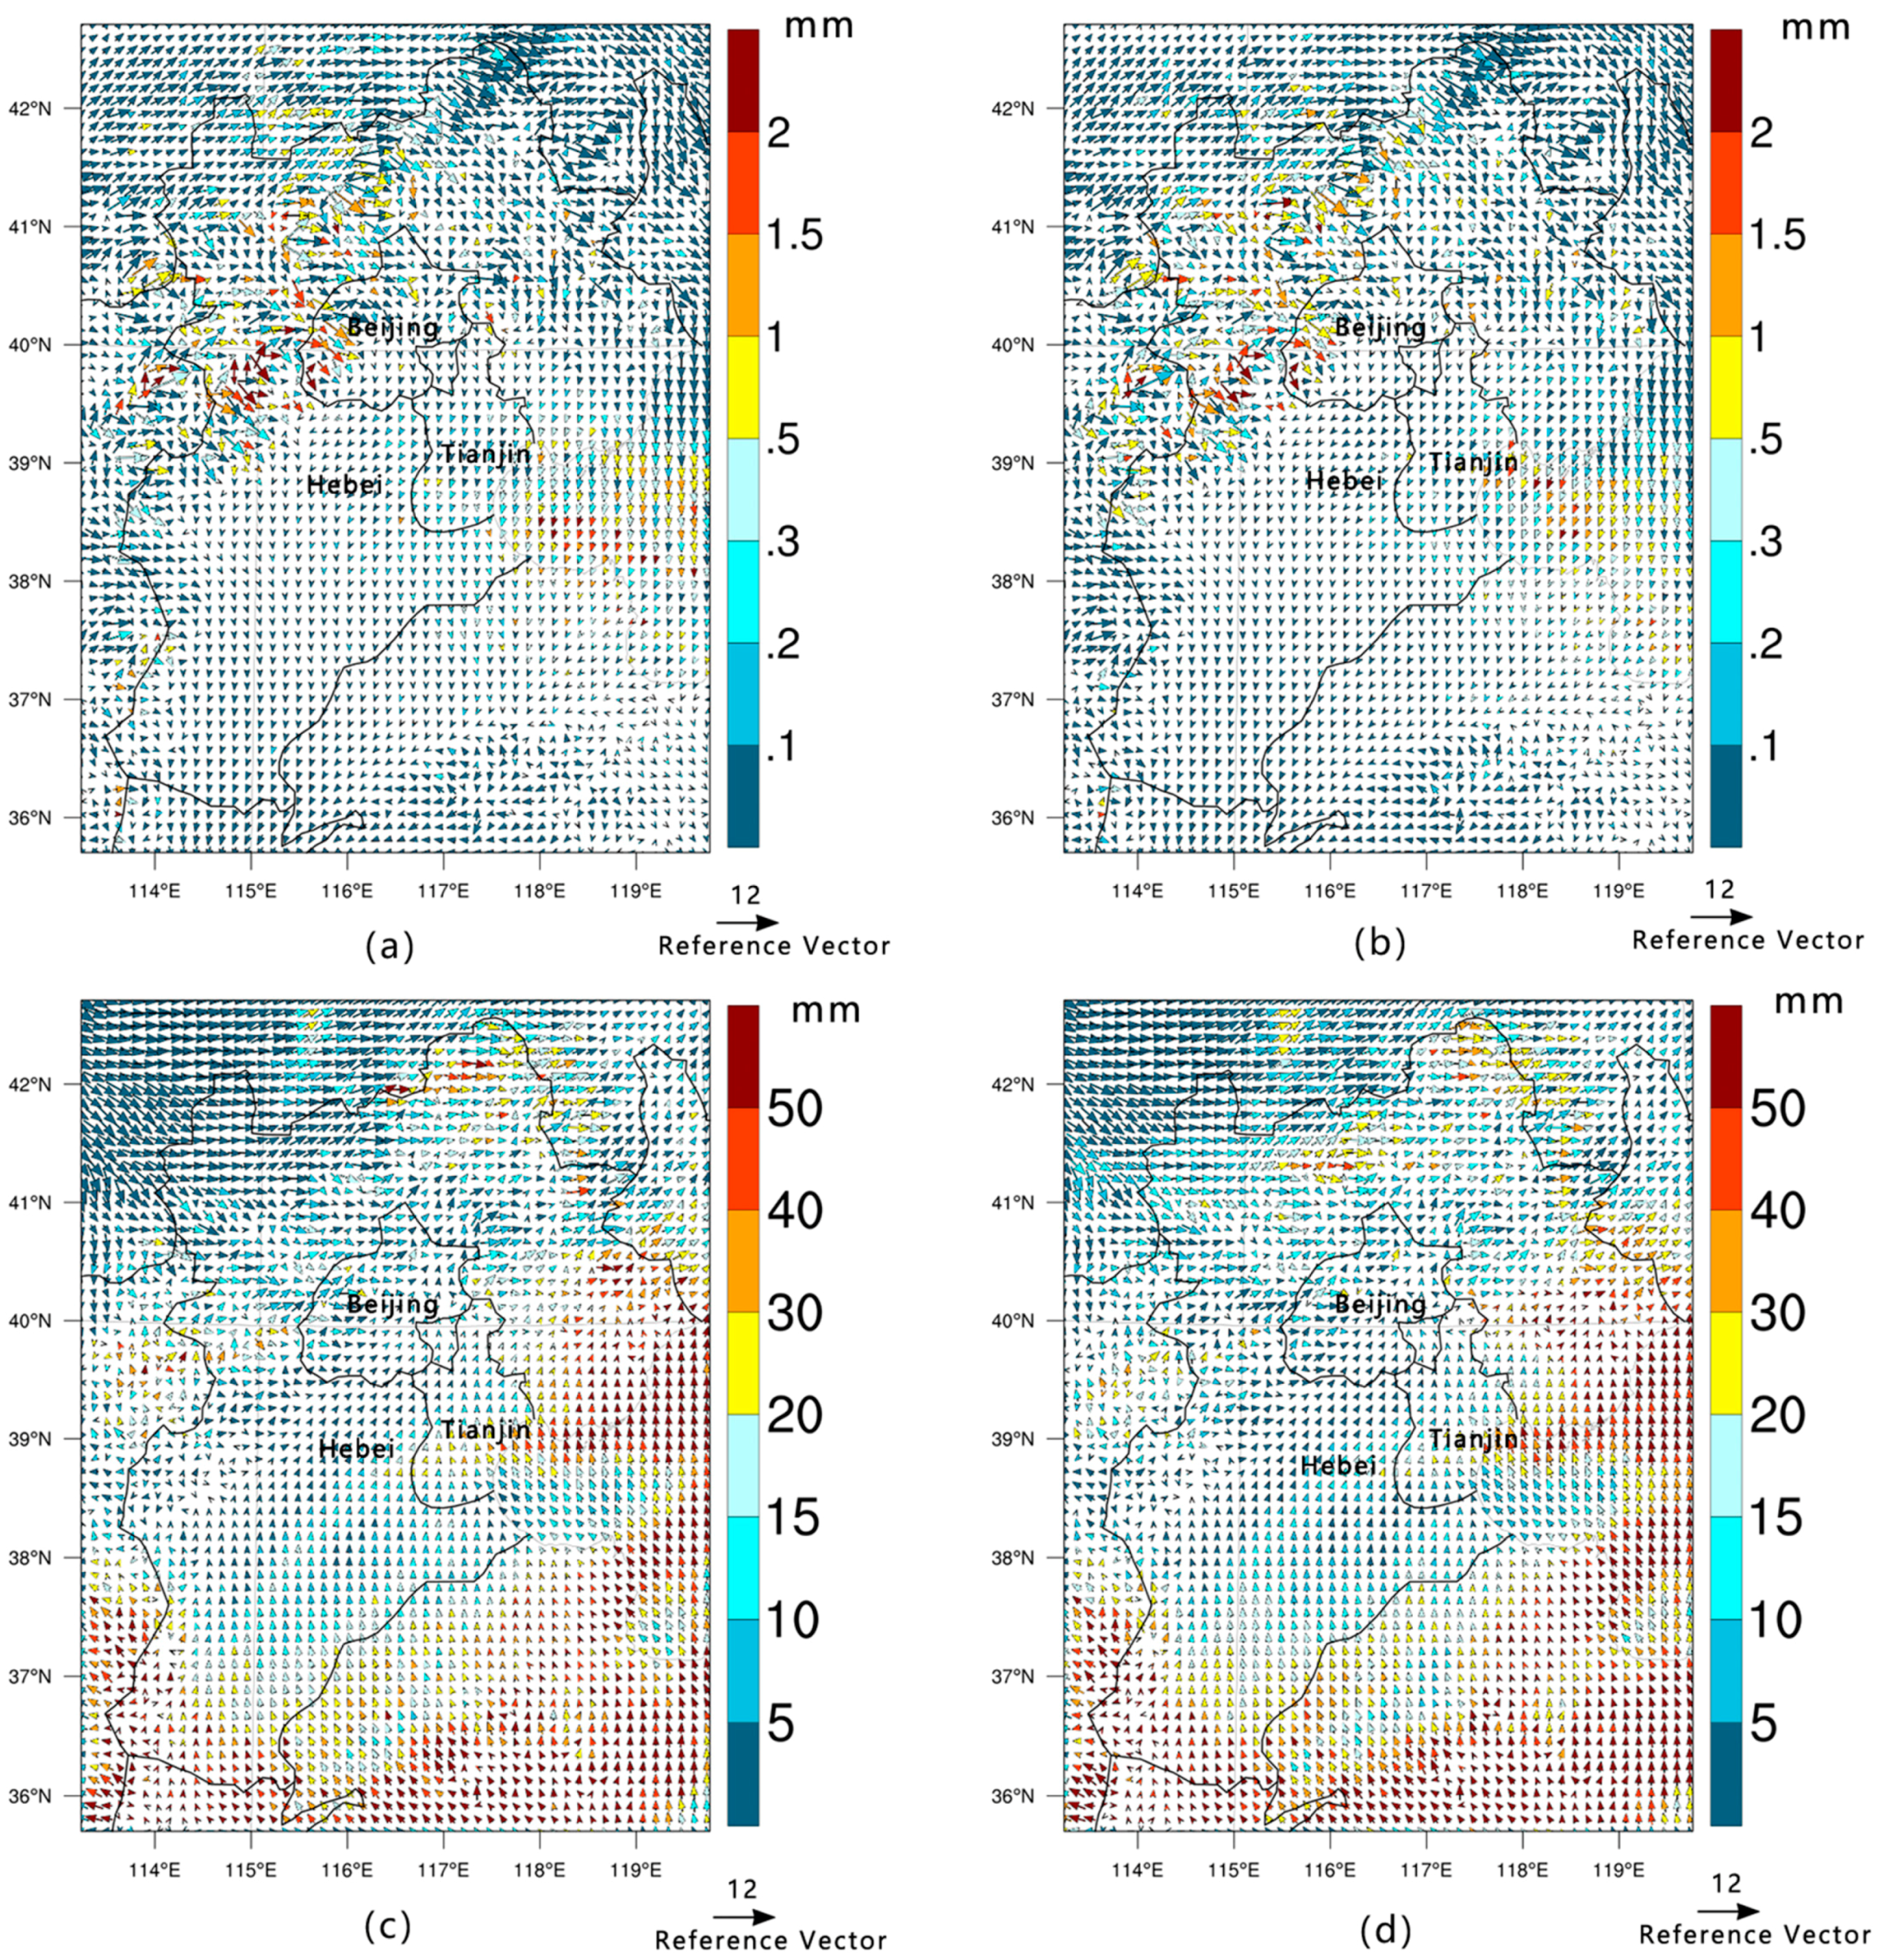
4.4. Changes in Precipitation
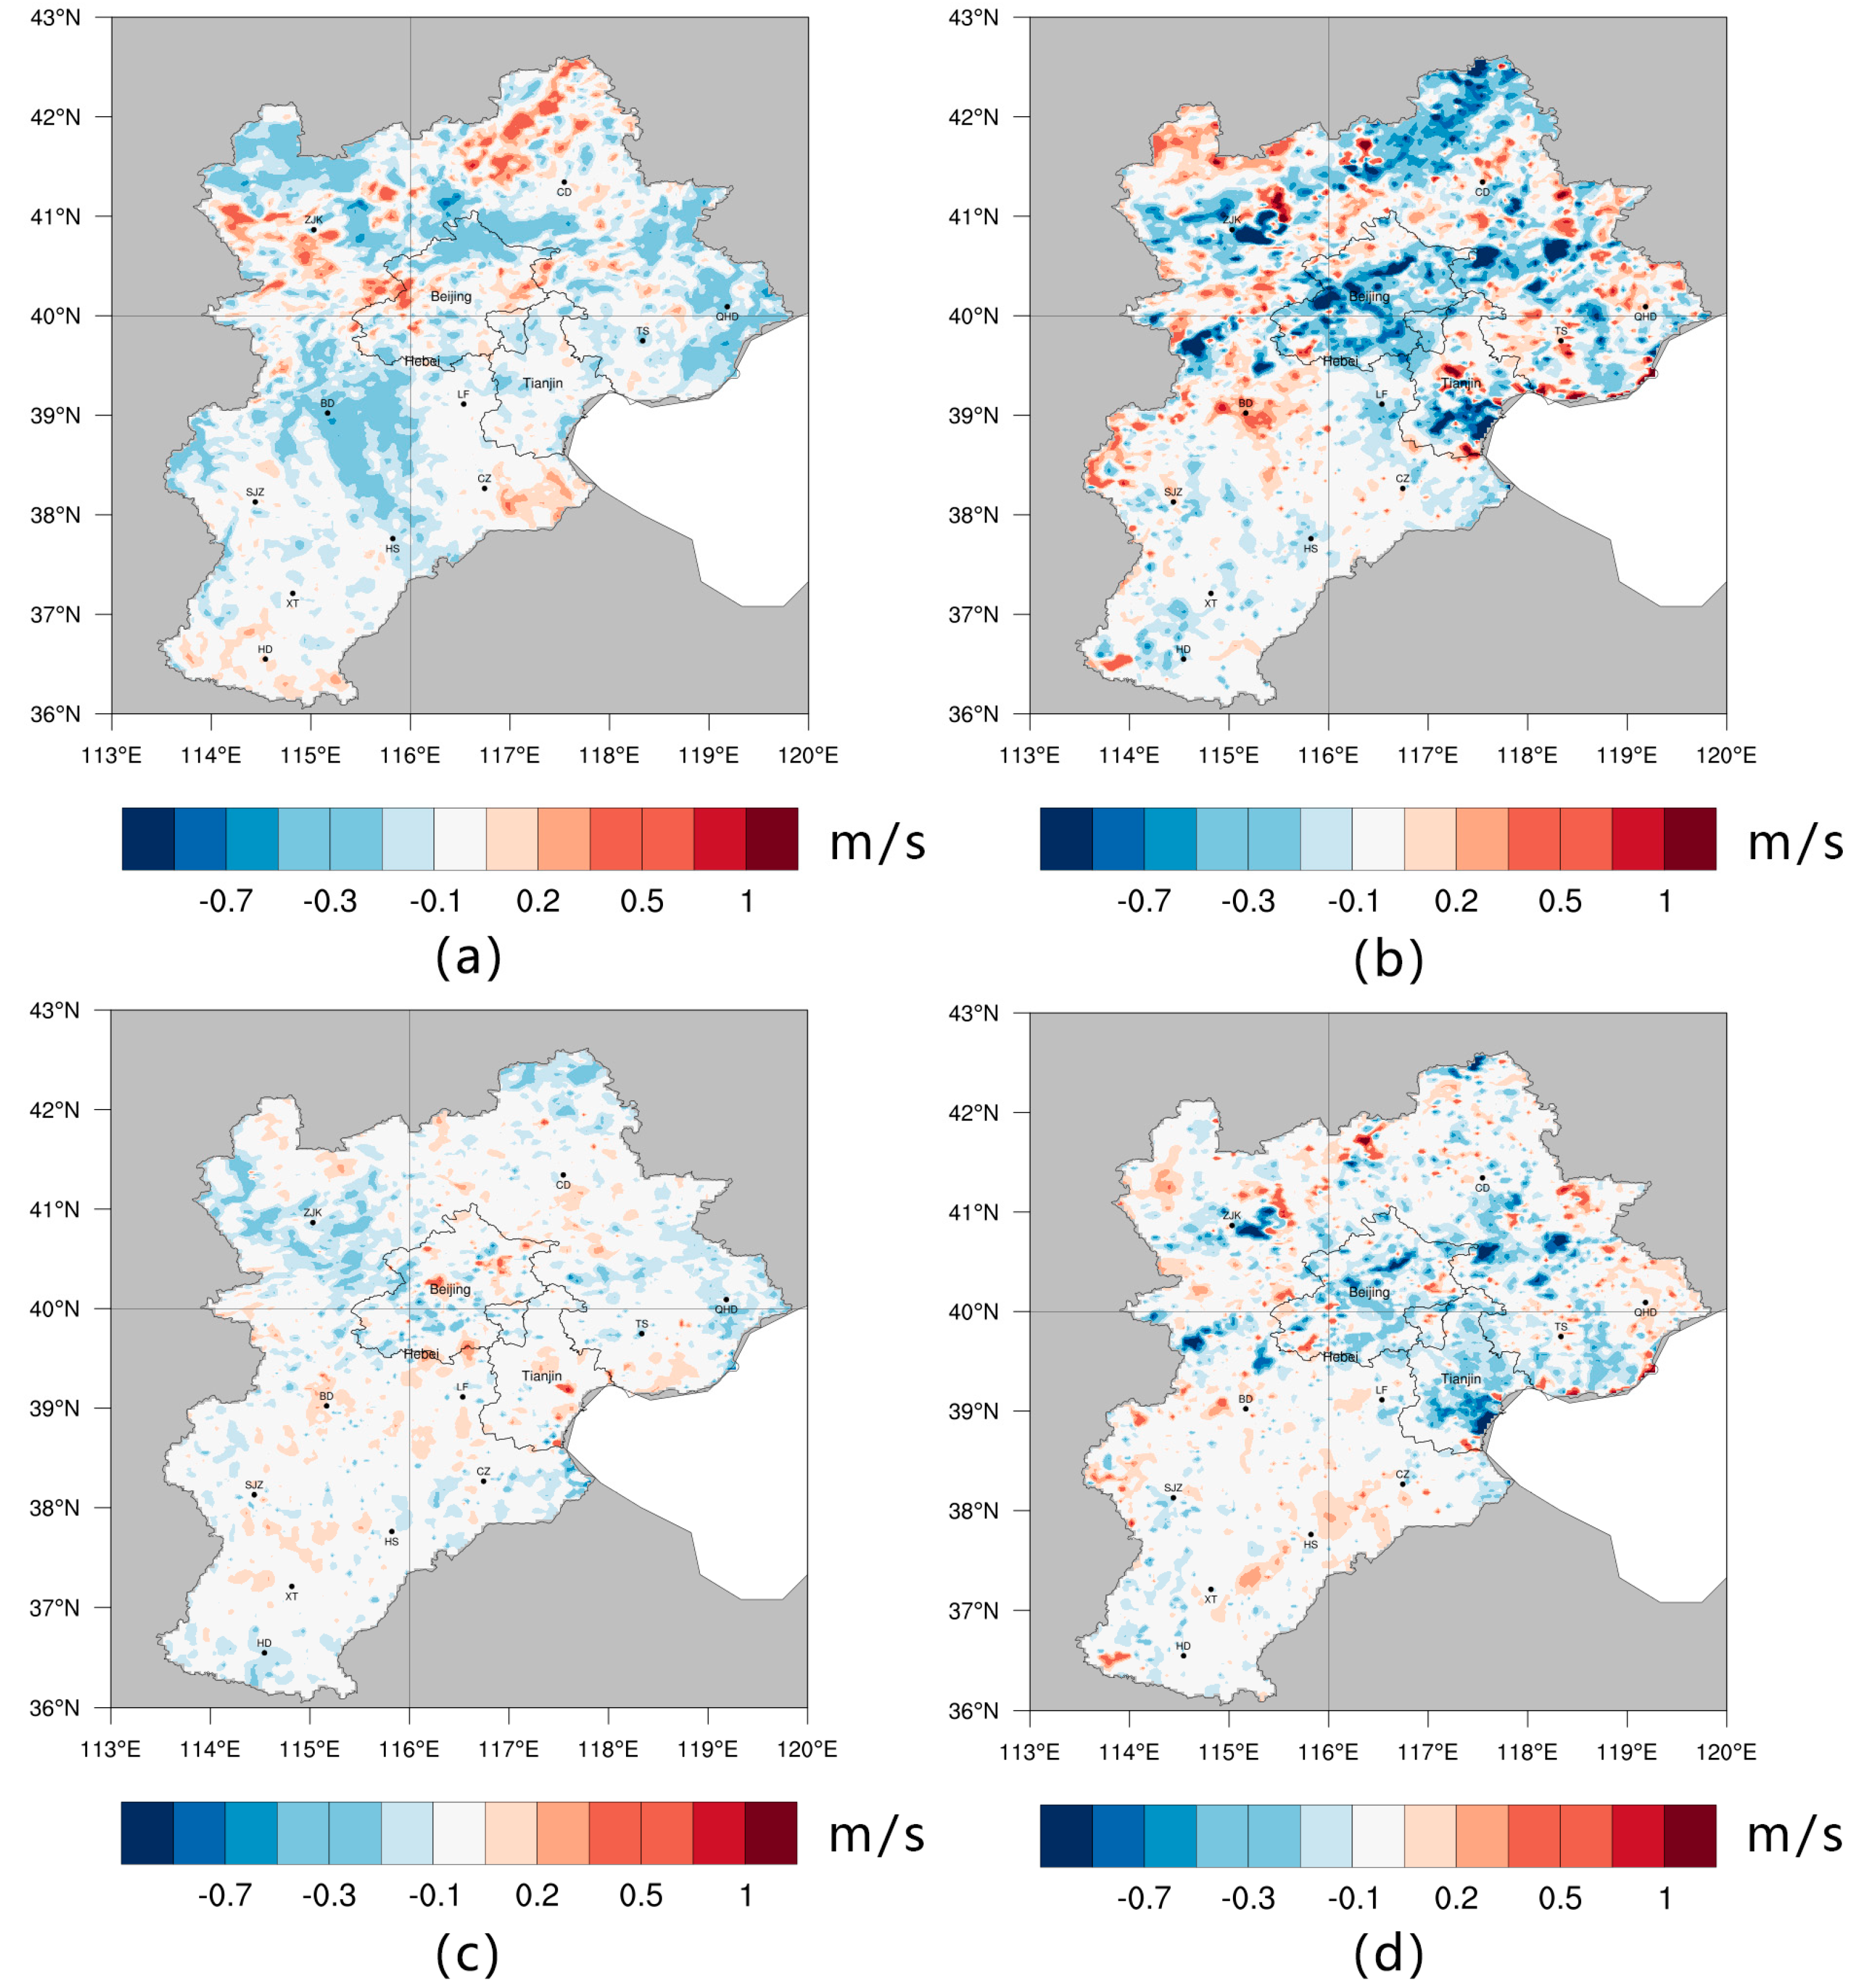
4.5. LULC Influence on Wind
5. Discussion
6. Conclusions
Acknowledgments
Author Contributions
Conflicts of Interest
References
- Henderson-Sellers, A.; Dickinson, R.E.; Durbidge, T.B.; Kennedy, P.J.; Mcguffie, K.; Pitman, A.J. Tropical deforestation: Modeling local- to regional-scale climate change. J. Geophys. Res. Atmos. 1993, 98, 7289–7315. [Google Scholar] [CrossRef]
- Bonan, G.B. Forests and climate change: Forcings, feedbacks, and the climate benefits of forests. Science 2008, 320, 1444–1449. [Google Scholar] [CrossRef] [PubMed]
- Ryoji, Y.; Kumiko, T.; Jun, M.; Tetsuzo, Y. Numerical study of the impacts of land use/cover changes between 1700 and 1850 on the seasonal hydroclimate in monsoon Asia. J. Meteorol. Soc. Jpn. 2011, 89A, 291–298. [Google Scholar]
- Pathirana, A.; Denekew, H.B.; Veerbeek, W.; Zevenbergen, C.; Banda, A.T. Impact of urban growth-driven landuse change on microclimate and extreme precipitation & mdash; a sensitivity study. Atmos. Res. 2014, 138, 59–72. [Google Scholar]
- Vitousek, P.M.; Mooney, H.A.; Lubchenco, J.; Melillo, J.M. Human domination of earth’s ecosystems. Science 1997, 277, 494–499. [Google Scholar] [CrossRef]
- Stocker, T.F.; Qin, D.; Plattner, G.K.; Alexander, L.V.; Allen, S.K.; Bindoff, N.L.; Bréon, F.M.; Church, J.A.; Cubasch, U.; Emori, S. IPCC, 2013: Technical summary. In Climate Change 2013: The Physical Science Basis. Contribution of Working Group I to the Fifth Assessment Report of the Intergovernmental Panel on Climate Change; Stocker, T.F., Qin, D., Plattner, G.-K., Tignor, M., Allen, S.K., Boschung, J., Nauels, A., Xia, Y., Bex, V., Midgley, P.M., Eds.; IPCC: Geneva, Switzerland, 2007. [Google Scholar]
- Vasseur, L.; Thornbush, M.; Plante, S. Climatic and environmental changes affecting communities in Atlantic Canada. Sustainability 2017, 9, 1293. [Google Scholar] [CrossRef]
- Deng, J.S.; Ke, W.; Hong, Y.; Qi, J.G. Spatio-temporal dynamics and evolution of land use change and landscape pattern in response to rapid urbanization. Landsc. Urban Plan. 2009, 92, 187–198. [Google Scholar] [CrossRef]
- Liu, J.; Kuang, W.; Zhang, Z.; Xu, X.; Qin, Y.; Jia, N.; Zhou, W.; Zhang, S.; Li, R.; Yan, C. Spatiotemporal characteristics, patterns, and causes of land-use changes in China since the late 1980s. J. Geogr. Sci. 2014, 24, 195–210. [Google Scholar] [CrossRef]
- Xie, H.; Kung, C.C.; Zhao, Y. Spatial disparities of regional forest land change based on ESDA and GIS at the county level in Beijing-Tianjin-Hebei area. Front. Earth Sci. 2012, 6, 445–452. [Google Scholar] [CrossRef]
- Kuang, W. Simulating dynamic urban expansion at regional scale in Beijing-Tianjin-Tangshan metropolitan area. J. Geogr. Sci. 2011, 21, 317–330. [Google Scholar] [CrossRef]
- Wang, J.; Huang, B.; Fu, D.; Atkinson, P.M.; Zhang, X. Response of urban heat island to future urban expansion over the Beijing–Tianjin–Hebei metropolitan area. Appl. Geogr. 2016, 70, 26–36. [Google Scholar] [CrossRef]
- Li, M.; Wang, T.; Xie, M.; Zhuang, B.; Li, S.; Han, Y.; Cheng, N. Modeling of urban heat island and its impacts on thermal circulations in the Beijing–Tianjin–Hebei region, China. Theor. Appl. Climatol. 2017, 128, 999–1013. [Google Scholar] [CrossRef]
- Kawamoto, Y.; Kawamoto, Y.; Kawamoto, Y. Effect of land-use change on the urban heat island in the Fukuoka–Kitakyushu metropolitan area, Japan. Sustainability 2017, 9, 1521. [Google Scholar] [CrossRef]
- Wang, M.; Yan, X. A comparison of two methods on the climatic effects of urbanization in the Beijing-Tianjin-Hebei metropolitan area. Adv. Meteorol. 2015, 2015, 352360. [Google Scholar] [CrossRef]
- Wang, J.; Feng, J.; Yan, Z. Potential sensitivity of warm season precipitation to urbanization extents: Modeling study in Beijing-Tianjin-Hebei urban agglomeration in China. J. Geophys. Res. Atmos. 2015, 120, 9408–9425. [Google Scholar] [CrossRef]
- He, Y.; Jia, G.; Hu, Y.; Zhou, Z. Detecting urban warming signals in climate records. Adv. Atmos. Sci. 2013, 30, 1143–1153. [Google Scholar] [CrossRef]
- Shen, X.; Liu, B.; Li, G.; Yu, P.; Zhou, D. Impacts of grassland types and vegetation cover changes on surface air temperature in the regions of temperate grassland of China. Theor. Appl. Climatol. 2016, 126, 141–150. [Google Scholar] [CrossRef]
- Hu, Y.; Jia, G.; Hou, M.; Zhang, X.; Zheng, F.; Liu, Y. The cumulative effects of urban expansion on land surface temperatures in metropolitan Jingjintang, China. J. Geophys. Res. Atmos. 2015, 120, 9932–9943. [Google Scholar] [CrossRef]
- Halder, S.; Saha, S.K.; Dirmeyer, P.A.; Chase, T.N.; Goswami, B.N. Investigating the impact of land-use land-cover change on indian summer monsoon daily rainfall and temperature during 1951–2005 using a regional climate model. Hydrol. Earth Syst. Sci. Discuss. 2015, 12, 6575–6633. [Google Scholar] [CrossRef]
- Chase, T.N.; Pielke, R.A., Sr.; Kittel, T.G.F.; Nemani, R.R.; Running, S.W. Simulated impacts of historical land cover changes on global climate in northern winter. Clim. Dyn. 2000, 16, 93–105. [Google Scholar] [CrossRef]
- Wang, T.; Chang, L. Quantitative structural analysis on land use change in Beijing-Tianjin-Hebei region. J. Shanxi Univ. 2010, 33, 473–478. [Google Scholar]
- Zhao, X.L.; Zhang, Z.X.; Zou, Y.R.; Zhou, Q.B. An analysis of characteristics of land use dynamic change in North China. Remote Sens. Land Resour. 2002, 14, 23–28. [Google Scholar]
- Yao, X.; Yin, H. Basic data of Chinas population. China Popul. Today 1994, 4, 25. [Google Scholar]
- Sumita, M. Communiqué of the national bureau of statistics of people’s republic of china on major figures of the 2010 population census (No. 1). China Popul. Today 2011, 6, 19–23. [Google Scholar]
- Sun, F.; Sun, D.; Hu, Y.; Li, S.; Xu, J. Changing patterns of Chinese population pressure on the ecological environment: 1990–2010. Popul. Res. 2013, 37, 103–113. [Google Scholar]
- Wu, W.; Zhao, S.; Zhu, C.; Jiang, J. A comparative study of urban expansion in Beijing, Tianjin and Shijiazhuang over the past three decades. Landsc. Urban Plan. 2015, 134, 93–106. [Google Scholar] [CrossRef]
- Chen, G.; Zhao, L.; Mochida, A. Urban heat island simulations in Guangzhou, China, using the coupled wrf/ucm model with a land use map extracted from remote sensing data. Sustainability 2016, 8, 628. [Google Scholar] [CrossRef]
- Wang, J.; Feng, J.; Yan, Z.; Hu, Y.; Jia, G. Nested high-resolution modeling of the impact of urbanization on regional climate in three vast urban agglomerations in China. J. Geophys. Res. Atmos. 2012, 117, 21103. [Google Scholar] [CrossRef]
- Wang, M.; Yan, X.; Liu, J.; Zhang, X. The contribution of urbanization to recent extreme heat events and a potential mitigation strategy in the Beijing–Tianjin–Hebei metropolitan area. Theor. Appl. Climatol. 2013, 114, 407–416. [Google Scholar] [CrossRef]
- Skamarock, W.C.; Klemp, J.B.; Dudhia, J.; Gill, D.O.; Barker, D.M.; Duda, M.G.; Huang, X.-Y.; Wang, W.; Powers, J.G. A Description of the Advanced Research WRF Version 3; NCAR Technical Note NCAR/TN-475+STR; National Center for Atmospheric Research: Boulder, CO, USA, 2008. [Google Scholar]
- The Data Center for Resources and Environmental Sciences, the Chinese Academy of Sciences. Available online: http://www.resdc.cn (accessed on 12 December 2017).
- Liu, J.; Liu, M.; Tian, H.; Zhuang, D.; Zhang, Z.; Zhang, W.; Tang, X.; Deng, X. Spatial and temporal patterns of China’s cropland during 1990–2000: An analysis based on landsat TM data. Remote Sens. Environ. 2005, 98, 442–456. [Google Scholar] [CrossRef]
- Liu, J. Study on national resources & environment survey and dynamic monitoring using remote sensing. J. Remote Sens. 2005, 98, 442–456. [Google Scholar]
- Liu, J.; Liu, M.; Zhuang, D.; Zhang, Z.; Deng, X. Study on spatial pattern of land-use change in China during 1995–2000. Sci. China Ser. D 2003, 46, 373–384. [Google Scholar]
- Dee, D.P.; Uppala, S.M.; Simmons, A.J.; Berrisford, P.; Poli, P.; Kobayashi, S.; Andrae, U.; Balmaseda, M.A.; Balsamo, G.; Bauer, P. The ERA-interim reanalysis: Configuration and performance of the data assimilation system. Q. J. R. Meteorol. Soc. 2011, 137, 553–597. [Google Scholar] [CrossRef]
- The European Centre for Medium-Range Weather Forecasts. Available online: http://apps.ecmwf.int/datasets/data/interim-full-daily/levtype=sfc/ (accessed on 11 December 2017).
- The China Meteorological Administration. Available online: http://data.cma.cn/data/cdcdetail/dataCode/SURF_CLI_CHN_MUL_DAY.html (accessed on 1 December 2017).
- Jin, J.; Miller, N.L.; Schlegel, N. Sensitivity study of four land surface schemes in the WRF model. Adv. Meteorol. 2010, 2010, 185–194. [Google Scholar] [CrossRef]
- Jianjun, H.E.; Ye, Y.U.; Na, L.; Zhao, S.; Chen, J. Impact of land surface information on WRF’S performance in complex terrain area. Chin. J. Atmos. Sci. 2014, 38, 484–498. [Google Scholar]
- Zhang, B.H.; Liu, S.H.; Liu, H.P.; Ma, Y.J. The effect of MYJ and YSU schemes on the simulation of boundary layer meteorological factors of WRF. Chin. J. Geophys. Chin. Ed. 2012, 55, 2239–2248. [Google Scholar]
- Ge, Q.; Zheng, J.; Zhang, X.; He, F. Simulated effects of cropland expansion on summer climate in eastern china in the last three centuries. Adv. Meteorol. 2013, 65, 93–100. [Google Scholar] [CrossRef]
- Hong, S.Y.; Lim, J.O.J. The WRF single-moment 6-class microphysics scheme (WSM6). Asia-Pac. J. Atmos. Sci. 2006, 42, 129–151. [Google Scholar]
- Mlawer, E.J.; Taubman, S.J.; Brown, P.D.; Iacono, M.J.; Clough, S.A. Radiative transfer for inhomogeneous atmospheres: RRTM, a validated correlated-k model for the longwave. J. Geophys. Res. Atmos. 1997, 102, 16663–16682. [Google Scholar] [CrossRef]
- Dudhia, J. Numerical study of convection observed during the winter monsoon experiment using a mesoscale two-dimensional model. J. Atmos. Sci. 1989, 46, 3077–3107. [Google Scholar] [CrossRef]
- Fairall, C.W.; Bradley, E.F.; Hare, J.E.; Grachev, A.A.; Edson, J.B. Bulk parameterization of air sea fluxes: Updates and verification for the coare algorithm. J. Clim. 2003, 16, 571–591. [Google Scholar] [CrossRef]
- Chen, F.; Dudhia, J. Coupling an advanced land surface hydrology model with the penn state NCAR MM5 modeling system. Part I: Model implementation and sensitivity. Mon. Weather Rev. 2001, 129, 587–604. [Google Scholar] [CrossRef]
- Hong, S.Y.; Noh, Y.; Dudhia, J. A new vertical diffusion package with an explicit treatment of entrainment processes. Mon. Weather Rev. 2006, 134, 2318. [Google Scholar] [CrossRef]
- Kain, J.S. The kain fritsch convective parameterization: An update. J. Appl. Meteorol. 2004, 43, 170–181. [Google Scholar] [CrossRef]
- Cui, Y.P.; Liu, J.Y.; Zhang, X.Z.; Qin, Y.C.; Dong, J.W. Modeling urban sprawl effects on regional warming in Beijing-Tianjing-Tangshan urban agglomeration. Acta Ecol. Sin. 2015, 35, 993–1003. [Google Scholar]
- Fei, H.U.; Peng, Z. A study of the influence of urbanization of Beijing on the boundary wind structure. Chin. J. Geophys. 2006, 49, 1467–1474. [Google Scholar]
- Bornstein, R.D. Observations of the urban heat island effect in New York city. J. Appl. Meteorol. 1968, 7, 575–582. [Google Scholar] [CrossRef]
- Bian, T.; Ren, G.; Zhang, B.; Zhang, L.; Yue, Y. Urbanization effect on long-term trends of extreme temperature indices at Shijiazhuang station, North China. Theor. Appl. Climatol. 2015, 119, 407–418. [Google Scholar] [CrossRef]
- Guo, X.; Fu, D.; Wang, J. Mesoscale convective precipitation system modified by urbanization in Beijing city. Atmos. Res. 2006, 82, 112–126. [Google Scholar] [CrossRef]
- Li, J.; Chen, J.; Li, H.; Qu, S.; Liao, H.U.; Troops, C. The sensitivity test on potential impacts of the land use variation in Northern China on summer climate of China. Meteorol. Disaster Reduct. Res. 2013, 1, 10–17. [Google Scholar]
- Yang, L.; Tian, F.; Smith, J.A.; Hu, H. Urban signatures in the spatial clustering of summer heavy rainfall events over the Beijing metropolitan region. J. Geophys. Res. Atmos. 2014, 119, 1203–1217. [Google Scholar] [CrossRef]
- Niyogi, D.; Pyle, P.; Lei, M.; Arya, S.P.; Kishtawal, C.M.; Shepherd, M.; Chen, F.; Wolfe, B. Urban modification of thunderstorms: An observational storm climatology and model case study for the indianapolis urban region. J. Appl. Meteorol. Climatol. 2011, 50, 285–286. [Google Scholar] [CrossRef]
- Kaufmann, R.K.; Seto, K.C.; Schneider, A.; Liu, Z.; Zhou, L.; Wang, W. Climate response to rapid urban growth: Evidence of a human-induced precipitation deficit. J. Clim. 2007, 20, 2299–2306. [Google Scholar] [CrossRef]
- Li, Z.; Yan, Z.; Tu, K.; Liu, W.; Wang, Y. Changes in Wind Speed and Wind Speed Extremes in Beijing during 1960–2008 Based on Homogenized Observations. Abstracts of International Workshop on Urban Weather and Climate: Observation and Modeling. Adv. Atmos. Sci. 2011, 28, 408–420. [Google Scholar] [CrossRef]
- Che, H.Z.; Zhang, X.Y.; Yang, Y.; Zhou, Z.J.; Qu, J.J.; Hao, X.J. Haze trends over the capital cities of 31 provinces in China, 1981–2005. Theor. Appl. Climatol. 2009, 97, 235–242. [Google Scholar] [CrossRef]


| USGS | USGS CODE | RESDC | RESDC CODE |
|---|---|---|---|
| Urban and built-up land | 1 | Urban built-up (UBL) | 51 |
| Rural residential land (UBL) | 52 | ||
| Other construction land (UBL) | 53 | ||
| Dry cropland and pasture | 2 | Dryland (CPL) | 12 |
| Irrigated cropland and pasture | 3 | Paddy land (CPL) | 11 |
| Grassland | 7 | Dense grass (GSL) | 31 |
| Moderate grass (GSL) | 32 | ||
| Sparse grass (GSL) | 33 | ||
| Shrubland | 8 | Shrub (WDL) | 22 |
| Mixed grassland/shrubland | 9 | Other woodland (WDL) | 24 |
| Deciduous broadleaf forest | 11 | Forest (WDL) | 21 |
| Deciduous needleleaf forest | 12 | ||
| Evergreen broadleaf forest | 13 | ||
| Evergreen needleleaf forest | 14 | ||
| Mixed forest | 15 | ||
| Water bodies | 16 | Streams and rivers (WRT) | 41 |
| Lakes (WRT) | 42 | ||
| Reservoirs and ponds (WRT) | 43 | ||
| Oceans (WRT) | 99 | ||
| Herbaceous wetland | 17 | Swampland (UUL) | 64 |
| Barren or sparsely vegetated | 19 | Sandy land (UUL) | 61 |
| Gobi (UUL) | 62 | ||
| Salina (UUL) | 63 | ||
| Woods (WDL) | 23 | ||
| Bare soil (UUL) | 65 | ||
| Bare rock (UUL) | 66 | ||
| Bare ground tundra | 23 | Beaches and shores (WRT) | 45 |
| Bottomland (WRT) | 46 | ||
| Other unused land (UUL) | 67 | ||
| Snow or ice | 24 | Permanent ice and snow (WRT) | 44 |
| Options | Schemes | Parameter Value |
|---|---|---|
| Microphysics | WSM6 (WRF Single-Moment 6-class) [43] | 6 |
| Longwave radiation | RRTM scheme [44] | 1 |
| Shortwave radiation | Dudhia scheme [45] | 1 |
| Surface-layer option | Revised MM5 Monin-Obukhov scheme [46] | 1 |
| Land-surface option | Noah land surface model [47] | 2 |
| Boundary-layer option | YSU scheme [48] | 1 |
| Cumulus option | Kain-Fritsch scheme [49] | 1 |
| 2000 | ||||||||
|---|---|---|---|---|---|---|---|---|
| CPL | WDL | GSL | WTR | UBL | UUL | Total | ||
| 1990 | CPL | 121,173 | 281 | 202 | 319 | 2501 | 92 | 124,567 |
| WDL | 157 | 45,524 | 159 | 16 | 34 | 2 | 45,893 | |
| GSL | 368 | 221 | 33,726 | 49 | 121 | 7 | 34,491 | |
| WRT | 153 | 17 | 17 | 3354 | 54 | 6 | 3601 | |
| UBL | 123 | 6 | 2 | 17 | 4659 | 2 | 4809 | |
| UUL | 171 | 1 | 9 | 6 | 79 | 1622 | 1888 | |
| Total | 122,144 | 46,049 | 34,115 | 3762 | 7448 | 1731 | 215,249 | |
| 2010 | ||||||||
|---|---|---|---|---|---|---|---|---|
| CPL | WDL | GSL | WTR | UBL | UUL | Total | ||
| 2000 | CPL | 114,269 | 1489 | 1200 | 639 | 4442 | 105 | 122,144 |
| WDL | 854 | 43,690 | 1249 | 31 | 187 | 39 | 46,049 | |
| GSL | 2532 | 4913 | 26,166 | 160 | 222 | 122 | 34,115 | |
| WRT | 622 | 87 | 52 | 2490 | 475 | 35 | 3762 | |
| UBL | 1067 | 41 | 12 | 208 | 6113 | 8 | 7448 | |
| UUL | 604 | 17 | 70 | 54 | 63 | 922 | 1731 | |
| Total | 119,948 | 50,237 | 28,749 | 3582 | 11,501 | 1231 | 215,249 | |
© 2018 by the authors. Licensee MDPI, Basel, Switzerland. This article is an open access article distributed under the terms and conditions of the Creative Commons Attribution (CC BY) license (http://creativecommons.org/licenses/by/4.0/).
Share and Cite
Li, J.; Zheng, X.; Zhang, C.; Chen, Y. Impact of Land-Use and Land-Cover Change on Meteorology in the Beijing–Tianjin–Hebei Region from 1990 to 2010. Sustainability 2018, 10, 176. https://doi.org/10.3390/su10010176
Li J, Zheng X, Zhang C, Chen Y. Impact of Land-Use and Land-Cover Change on Meteorology in the Beijing–Tianjin–Hebei Region from 1990 to 2010. Sustainability. 2018; 10(1):176. https://doi.org/10.3390/su10010176
Chicago/Turabian StyleLi, Jiayang, Xinqi Zheng, Chunxiao Zhang, and Youmin Chen. 2018. "Impact of Land-Use and Land-Cover Change on Meteorology in the Beijing–Tianjin–Hebei Region from 1990 to 2010" Sustainability 10, no. 1: 176. https://doi.org/10.3390/su10010176
APA StyleLi, J., Zheng, X., Zhang, C., & Chen, Y. (2018). Impact of Land-Use and Land-Cover Change on Meteorology in the Beijing–Tianjin–Hebei Region from 1990 to 2010. Sustainability, 10(1), 176. https://doi.org/10.3390/su10010176