Article

Catalyst-Free Biodiesel Production Methods: A Comparative Technical and Environmental Evaluation

1
Department of Physics, University of Otago, P.O. Box 56, Dunedin 9054, New Zealand
2
Department of Food Science, University of Otago, P.O. Box 56, Dunedin 9054, New Zealand
*
Author to whom correspondence should be addressed.
Sustainability 2018, 10(1), 127; https://doi.org/10.3390/su10010127
Submission received: 25 October 2017 / Revised: 7 December 2017 / Accepted: 3 January 2018 / Published: 8 January 2018

Abstract

:
In response to existing global focus on improved biodiesel production methods via highly efficient catalyst-free high temperature and high pressure technologies, this study considered the comparative study of catalyst-free technologies for biodiesel production as an important research area. In this study, therefore, catalyst-free integrated subcritical lipid hydrolysis and supercritical esterification and catalyst-free one step supercritical transesterification processes for biodiesel production have been evaluated via undertaking straight forward comparative energetic and environmental assessments. Energetic comparisons were undertaken after heat integration was performed since energy reduction has favourable effects on the environmental performance of chemical processes. The study confirmed that both processes are capable of producing biodiesel of high purity with catalyst-free integrated subcritical lipid hydrolysis and supercritical esterification characterised by a greater energy cost than catalyst-free one step supercritical transesterification processes for an equivalent biodiesel productivity potential. It was demonstrated that a one-step supercritical transesterification for biodiesel production presents an energetically more favourable catalyst-free biodiesel production pathway compared to the integrated subcritical lipid hydrolysis and supercritical esterification biodiesel production process. The one-step supercritical transesterification for biodiesel production was also shown to present an improved environmental performance compared to the integrated subcritical lipid hydrolysis and supercritical esterification biodiesel production process. This is because of the higher potential environment impact calculated for the integrated subcritical lipid hydrolysis and supercritical esterification compared to the potential environment impact calculated for the supercritical transesterification process, when all material and energy flows are considered. Finally the major contributors to the environmental outcomes of both processes were also clearly elucidated.

1. Introduction

In line with the global efforts to encourage a shift from fossil fuels to renewable and cleaner biofuels, many studies have been undertaken to develop sustainable liquid fuel alternatives. These studies have resulted in the identification of biodiesel as a sustainable and environmentally benign fuel alternative that will aid in reducing peak global temperatures via the reduction in the volumes of greenhouse gas emissions such as CO2, NOx and SO2 [1]. This recognised importance of biodiesel as a renewable fuel has resulted in extensive work in the area of biodiesel research. Some of these studies include the exploration of alternative biodiesel production pathways such as catalyst-free subcritical and supercritical biodiesel production processes [2,3] for enhanced biodiesel yields in short reaction times, the use of unconventional biodiesel feedstocks such as meat processing DAF sludge [1] and sewage sludge [4] as alternative lipid sources to improve economic performances and the modification of existing biodiesel production processes such as application of in-situ approaches to enhance biodiesel productivity [5]. Current investigations however highlight scientific interest in catalyst-free biodiesel production processes due to reduced reaction times (<10 min) and high percentage conversions (>95%) typically recorded in experimental work [2,6,7]. Conventional catalyst-free biodiesel production processes are essentially transesterification reactions occurring under supercritical conditions of the reacting alcohols. Under such supercritical conditions the reacting alcohols usually exist in their supercritical state since the reacting conditions are at temperatures higher than the critical temperatures, 238.85 °C and 241 °C, of methanol and ethanol respectively and pressures higher than the critical pressures, 8.1 MPa and 6.41 MPa, of methanol and ethanol respectively [8,9].
The significantly improved reaction rate reported in such supercritical transesterification reactions is due to the reduction in the strength of the intermolecular hydrogen bonds that exist between the alcohol molecules, leading to a significant reduction in the alcohol dielectric constant [10]. Polarity reductions due to the weakening of the hydrogen bonds will enhance nucleophilic attack on the carbonyl carbon by the alcohol, thus rendering the use of a catalyst unnecessary [10]. Furthermore, the reduced dielectric constant of the alcohol will make the originally polar alcohol a more suitable solvent for the solvation of the non-polar lipids, thereby enabling the generation of a single phase lipid-alcohol mixture under supercritical conditions [10]. The existence of the reactants in a single phase also substantially enhances the alcoholysis reaction rate since possible mass transfer inhibitions between the reacting species are reduced [11]. Crucially, although high biodiesel yields were reported when direct supercritical transesterification (DST) processes are undertaken, these processes are characterised by very large energy consumption and high chemical cost [2,12,13]. The large energy consumption is due to the imposition of conditions of high temperature (350 °C), high pressures (>20 MPa) and the high chemical cost is due to the requirement of large masses of the alcohol reactant, for instance DST biodiesel production processes utilising methanol as the alcohol reactant will require a methanol to oil mole feed ratio greater than 40:1 [2,14].
Furthermore, recent studies have also established that the imposition of such high temperature conditions on supercritical transesterification reaction systems will lead to the degradation of the biodiesel product thus reducing biodiesel yield [15]. The degradation of the fatty acid methyl ester (FAME) product typically occurs via radical chain scission with previous studies demonstrating that the degradation of methyl stearate and methyl oleate to shorter chain 1-alkenes and alkanes respectively will occur at reaction temperatures greater than 260 °C [6,15,16]. To circumvent the need for high energy input and the need for large masses of methanol chemical inputs, some studies have suggested the viability of the alternative utilisation of an integrated subcritical lipid hydrolysis and supercritical esterification (ISHSE) process. This is because the ISHSE process, which integrates an initial subcritical lipid hydrolysis with a supercritical esterification reaction requires a lower molar methanol to oil ratio of 20:1, lower reaction temperatures ranging from 250 °C to 270 °C and lower pressures ranging from 7 MPa to 8.1 MPa, compared to the reaction conditions of alternative catalyst-free DST biodiesel production processes [6,17]. Remarkably however the previous studies undertaken by Kusdiana and Saka, [17] and Jin et al. [6] did not consider the potential effects of integrating an initial subcritical lipid hydrolysis process with the supercritical esterification of the generated fatty acids on the efficiency of energy utilization, environmental impacts and the effects of the associated waste streams of the production process.
It is important at this juncture to state that the simulation studies of the high temperature and pressure biodiesel production processes does not constitute an entirely new research area with previous studies considering the technical feasibility of high pressure biodiesel production processes [18] and the energetic cost of the high pressure biodiesel production processes [19]. However at present there is no investigation focusing on the comparative assessment of these highlighted high temperature and pressure biodiesel production processes. Clearly a comparative assessment of overall energetic performance, and environmental impacts related to emissions to air, land and water is overdue. This study is therefore interested in the undertaking a comparative assessment of the alternative catalyst-free biodiesel production pathways with particular emphasis on the energetics and the environmental impacts of the alternative biodiesel production processes.

2. Materials and Methods

2.1. Analysis Tools

In this paper, an ASPEN plus version 10.0 (Aspen Technology Inc., Cambridge, MA, USA) process simulator is utilised to simulate the ISHSE process and DST process. This simulator is selected since it enables the generation of accurate mass and energy balance data in a timely fashion. This simulation software also facilitates the computation of the flow rates, compositions, and physical characteristics of the input and output streams which will constitute the basis for subsequent energetic and environmental performance assessments. The processes of DST and ISHSE for biodiesel production to be investigated are illustrated in Figure 1 and Figure 2 respectively. In the alternative pathways investigated, the biodiesel production capacity is fixed to a production capacity of approximately 6120 t per y with the plants operating for 7200 h per y. In Figure 1 and Figure 2, the ‘dashed’ blocks represent the overall processes and the solid blocks denote the individual processes. Figure 1 shows that the overall DST biodiesel production process involves a supercritical transesterification reaction of triglycerides in the presence of methanol at a temperature of 280 °C and a pressure 28 MPa. At the conclusion of the transesterification reaction the excess and unreacted methanol is recovered via vaporisation from the FAME and glycerol products. Further purification of the FAME product to remove the glycerol and any remaining methanol impurity is subsequently achieved via the distillation process shown in Figure 1 using a distillation column. Figure 2 shows that the overall ISHSE biodiesel production process involves an initial water-subcritical hydrolysis of triglycerides at a temperature of 270 °C and a pressure 7 MPa and then the generated fatty acids are separated via decantation, with residual polar aqueous phase containing glycerol and water hydrolysis being left. The separated fatty acids are esterified in the presence of methanol under supercritical conditions of 250 °C and 8 MPa of methanol. At the conclusion of the supercritical esterification reaction, the FAME product is purified by separating the FAMEs from the unreacted methanol and water via vaporisation of methanol and water impurities. Recovery of methanol from the residual methanol-water mixture is undertaken using the distillation columns as shown in Figure 2. The following mass and energy balance equations at steady state were used and solved using ASPEN plus for each of the individual processes of the DST and ISHSE biodiesel production processes shown in Figure 1 and Figure 2,
i = 1 n m ˙ i n = i = 1 n m ˙ o u t
Q ˙ = [ i = 1 n m ˙ i h i ] o u t [ i = 1 n m ˙ i h i ] i n + W ˙
where, Q ˙ is the net heat transfer flow rate in kJ/s into the system in the control volume of the individual process, per s; hi is the specific enthalpy of the ith stream, in kJ/kg; W ˙ is the rate of net work done by the system in the control volume of the individual process in kJ/s; and m ˙ is the mass flow rate of the ith stream, in kg/s.
To minimise the cooling and heating duties of both high temperature and high pressure biodiesel production processes, Aspen Energy Analyser® (Aspen Technology Inc., Cambridge, MA, USA) is used to perform heat integration and to design a possible heat exchanger network based on classic pinch analysis methods. These pinch analysis methods incorporate the assessment of heat flow rate inequalities and stream splitting rules via tick-off heuristics [20]. In utilising Aspen Energy Analyser ® for the reduction of heating and the cooling duties, the procedure proposed by Sadhukha et al. [21] is utilised. Necessary thermodynamic data highlighting the supply temperature and target temperature of relevant streams are extracted from simulation output sheet generated by ASPEN plus. Using these data the composite curve is constructed to aid in the determination of the minimum energy consumption target since the overlap of heat availability (hot composite curve) and the heat requirement (cold composite curve) provides an indication of the maximum possible process heat recovery [22]. The determination of the possible heat recovery enables the estimation of the remaining heating requirement (called the minimum hot Q(H)min) and cooling requirements (called the minimum cold Q(C)min). Further optimisation of heat exchanger design to minimise economic cost are outside the scope of this research as process optimisation approaches are not considered in this study. For simplicity we have adopted the minimum allowable temperature difference (ΔTmin) at ‘pinch point’, in a heat exchanger to be 10 K [23]. All calculations are performed using the Aspen Energy Analyser and results reported directly. Finally, the heat exchanger network is fully solved using the Aspen Energy Analyser® with all the process streams satisfied based on the adopted minimum allowable temperature difference.

2.1.1. Calculation of Physical and Thermodynamic Properties

The NRTL-Redlich-Kwong property method in ASPEN plus was utilised in predicting the properties of the chemical species in the liquid and vapour phases. This is because the NRTL activity coefficient model was shown to be sufficient in predicting the vapour-liquid equilibria of chemical species under moderate conditions while the Redlich-Kwong model adequately predicts the vapour-liquid equilibria of the chemical species under supercritical and subcritical conditions [24]. The triglyceride molecule in the reaction was modelled as triolein in this paper, in accordance with the experimental data of subcritical lipid hydrolysis of triolein and the kinetic models of the supercritical esterification of oleic acid and supercritical transesterification of triolein for producing methyl oleate [6,25,26]. This methyl oleate product sufficiently models biodiesel since its major fuel properties satisfy existing European biodiesel standard (EN 14214) and American biodiesel standard (ASTM D 6751) as presented in Table 1.
In this work, the values of the critical temperature, critical pressure and acentric factor for triolein calculated by Tang et al. [33] were used to define triolein in the component database of the ASPEN plus. The boiling temperature of triolein was specified to be 548.3 °C [34] rather than 846 °C available in ASPEN plus since previous studies have established that the boiling point temperature for triolein present in the ASPEN plus database is overestimated [34].
The vapour pressure was calculated as follows [35],
ln p v p = 6.596 5407.3 T
The thermodynamic properties of other chemicals such as glycerol, methanol, oleic acids, methyl oleate and water were obtained from the component database of the ASPEN plus. For simplicity perfect mixing of the reacting species has also been assumed.

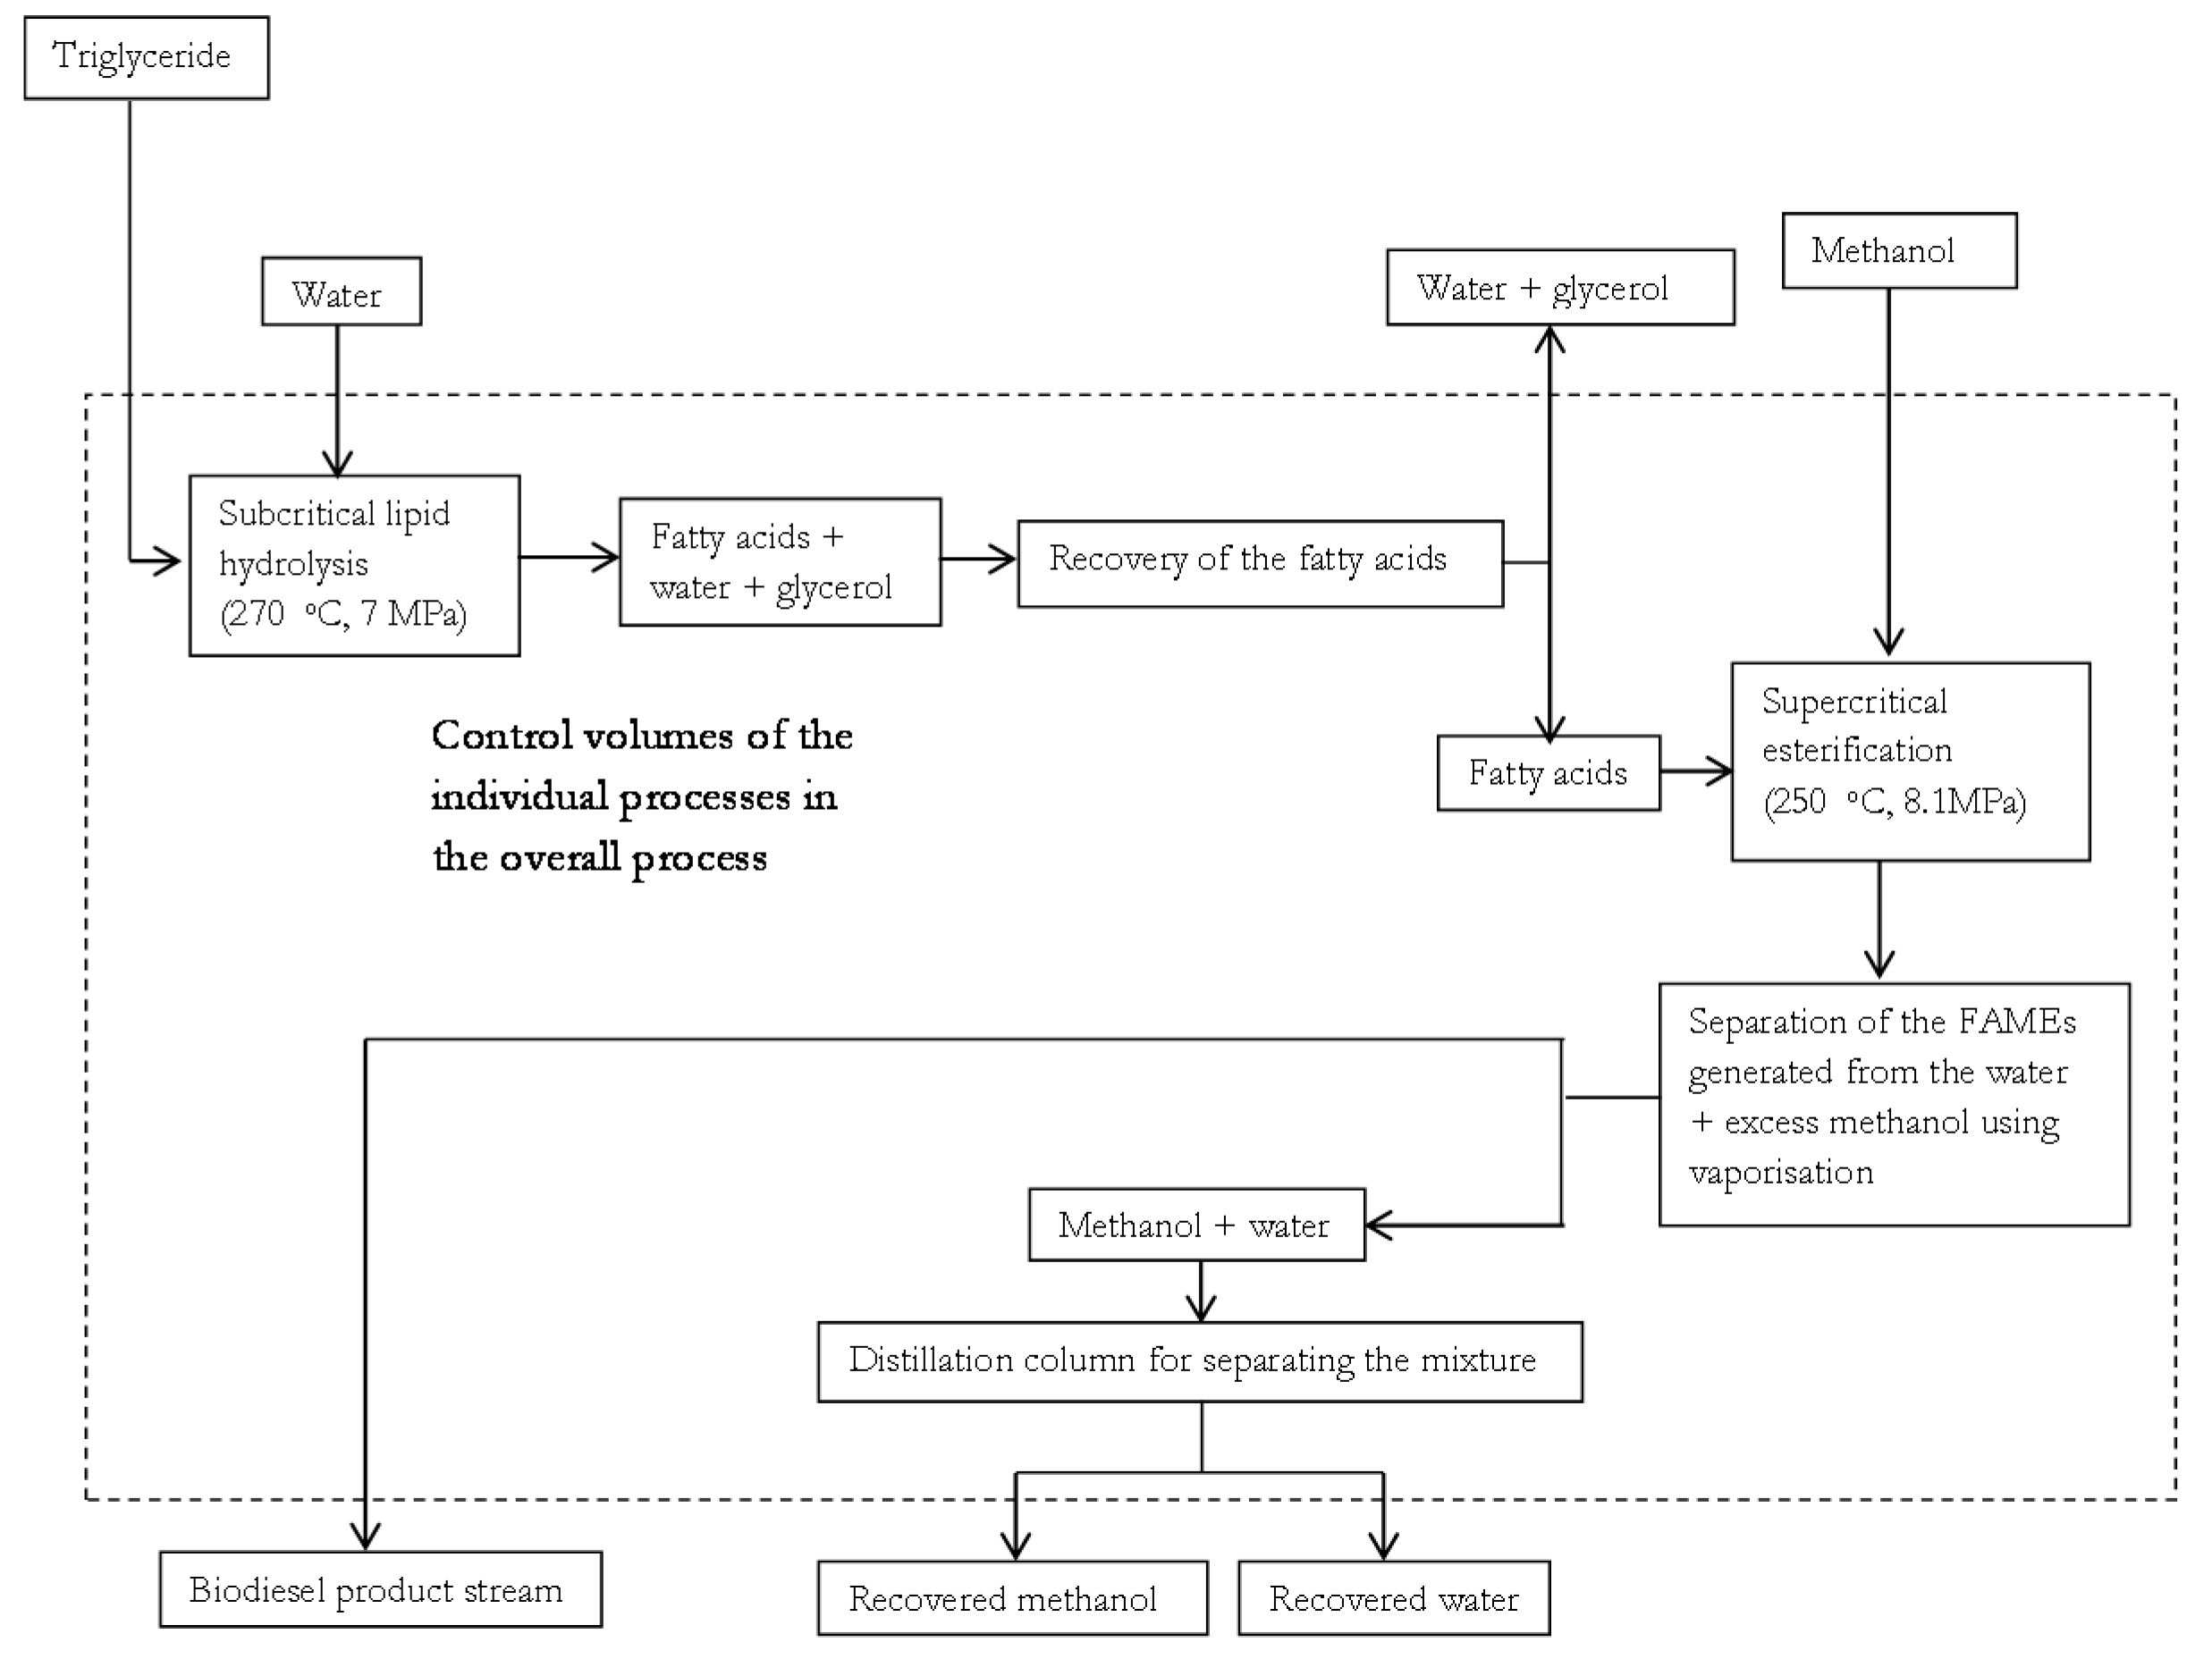
2.1.2. Kinetic Modelling of Subcritical Lipid Hydrolysis and Supercritical Fatty Acid Esterification

In modelling the subcritical lipid hydrolysis reaction the FA yield data reported by Minami and Saka [25] for subcritical triglyceride (TAG) hydrolysis of lipids undertaken at temperatures ranging from 250 °C to 320 °C and pressures ranging from 7 MPa to 20 MPa in a batch-wise reactor were analysed. In the experiments by Minami and Saka, excess water was utilised such that the molar ratio of water to TAG was 53.8:1 and the initial concentrations of the TAG and water were 0.56 mole/L and 27.75 mole/L, respectively. The experimental data obtained by Minami and Saka have been presented in Figure 3.
The subcritical TAG hydrolysis was modelled as occurring according to the following reaction equation,
TAG + 3 H 2 O Gly + 3 FA
where, Gly represents the glycerol and FA represents the fatty acid.
This study recognises that TAG hydrolysis reaction have also been reported as occuring via a stage wise pathway under moderate reaction conditions with the intermediate molecules of diglyceride and mono glyceride shown to be formed during different stages of the process. Crucially however, under subcritical conditions such intermediate steps can be ignored with authors such as Kocsisová et al. [36] and Sturzenegge and Stum [37] demonstrating experimentally the validity of an alternative pseudo-homogenous First order irreversible kinetic relation provided the conditions of excess water and subcritical reaction conditions are maintained. According to these authors under conditions of excess moisture the rate of the TAG hydrolysis under subcritical conditions can be presented as follows,
r h y = d C TAG d t k h y C TAG
Such that the integration of Equation (5) provides a relationship between the fractional conversion, X, of the TAG, as follows,
Ln [ C TAG , f C TAG , o ] = [ C TAG , o ( 1 X ) C TAG , o ] = k h y t
or,
Ln [ 1 X ] = k h y t
with the reaction rate constant (khy) expressed by the following relation,
k h y = A h y e [ E h y R T ]
In Equation (8), khy, Ahy, Ehy, R and T represent the approximate overall rate constant, in s−1; pre-exponential constant, in s−1; activation energy, in kJ/kmol, universal gas constant, in 8.314 kJ/kmol·K and temperature in K, respectively.
Thus, a plot of Ln [1 − X] against time is a straight line and the slope of the line equal to value of −khy for a set of experimental data.
Using the data shown in Figure 3, we have evaluated the conversion factor at different temperatures and the results are in Figure 4. Applying Equation (7), fitted straight lines representing the relations between the conversion factor and reacting time at different temperatures are also presented in Figure 4. From Figure 4, it can be seen that all the straight lines have a correlation coefficient (R2) value greater than 0.9. Since the R2 values determined are all greater than the accepted minimum R2 value of 0.7 specified in modelling work [38], it can be suggested that the kinetic relationship represented by the linear plot is sufficient to predict the yield of FAs generated during subcritical hydrolysis and can be employed to achieve the aims of this paper. This implies therefore that the kinetic parameters (Ahy and Ehy), can be easily estimated by plotting Ln khy, which is obtained from the graph slopes in Figure 4 against 1/T such that the slope and the intercept will give the Ehy/R and the Ahy respectively. The plot of Ln khy against 1/T for temperatures ranging from 250 °C to 320 °C has therefore been presented in Figure 5.
Figure 5 shows that the relationship between khy and T is as follows,
Ln k h y = 10,599 T + 12.039
or
k h y = 169,227.6 e [ 88,120.1 R T ]
The kinetic relation presented in Equation (10) was therefore utilised in modelling the subcritical hydrolysis of TAGs in the present study.
The supercritical esterification of the FAs generated from the subcritical hydrolysis of the TAG in the ISHSE process is expressed by the following chemical reaction,
FA + MeOH FAME + H 2 O
In this paper, the supercritical esterification of FAs was modelled as occurring via irreversible First order kinetics, following the experimental analysis by Jin et al. [6] as follows,
r s c = d C FA d t k s c C FA
Possible side reactions which are associated with the thermal cracking, isomerisation and decarboxylation of FAMEs will not be considered in this study since the mechanisms and reaction equations of these side reactions are presently unknown [39].
The rate constant of the supercritical esterification reaction ( k s c ) at the operating temperature, molar ratio of methanol to FA and pressure of 260 °C, 20:1 and 8.1 MPa was reported, and is given by [6],
k s c = 0.136 e [ 21,980 R T ]
where khy is the rate constant of supercritical esterification in s−1, the constant number 0.136 is the pre-exponential constant in s−1, the constant value 21,980 is the activation energy in kJ/kmol, R is the universal gas constant, 8.314 kJ/kmol·K and T is the temperature in K.
The supercritical transesterification of TAGs using methanol in the DST process has also been modelled in this paper as an irreversible a first order reaction, following the experimental analysis undertaken by He et al. [26] as follows,
TAG + 3 MeOH 3 FAME + Glycerol
such that,
r s p = d C TAG d t k s p C TAG
The rate constant of the supercritical transesterification reaction at the operating temperature, molar ratio of methanol to TAG and pressure of 280 °C, 42:1 and 28 MPa was reported as follows [26],
k s p = 141.796 e [ 56,000 R T ]
where ksp is the rate constant of supercritical transesterification, in s−1, the constant value 141.796 is the pre-exponential constant, in s−1, the constant value 56,000 is the activation energy, in kJ/kmole, R is the universal gas constant, 8.314 kJ/kmole. K and T is the temperature, in K.

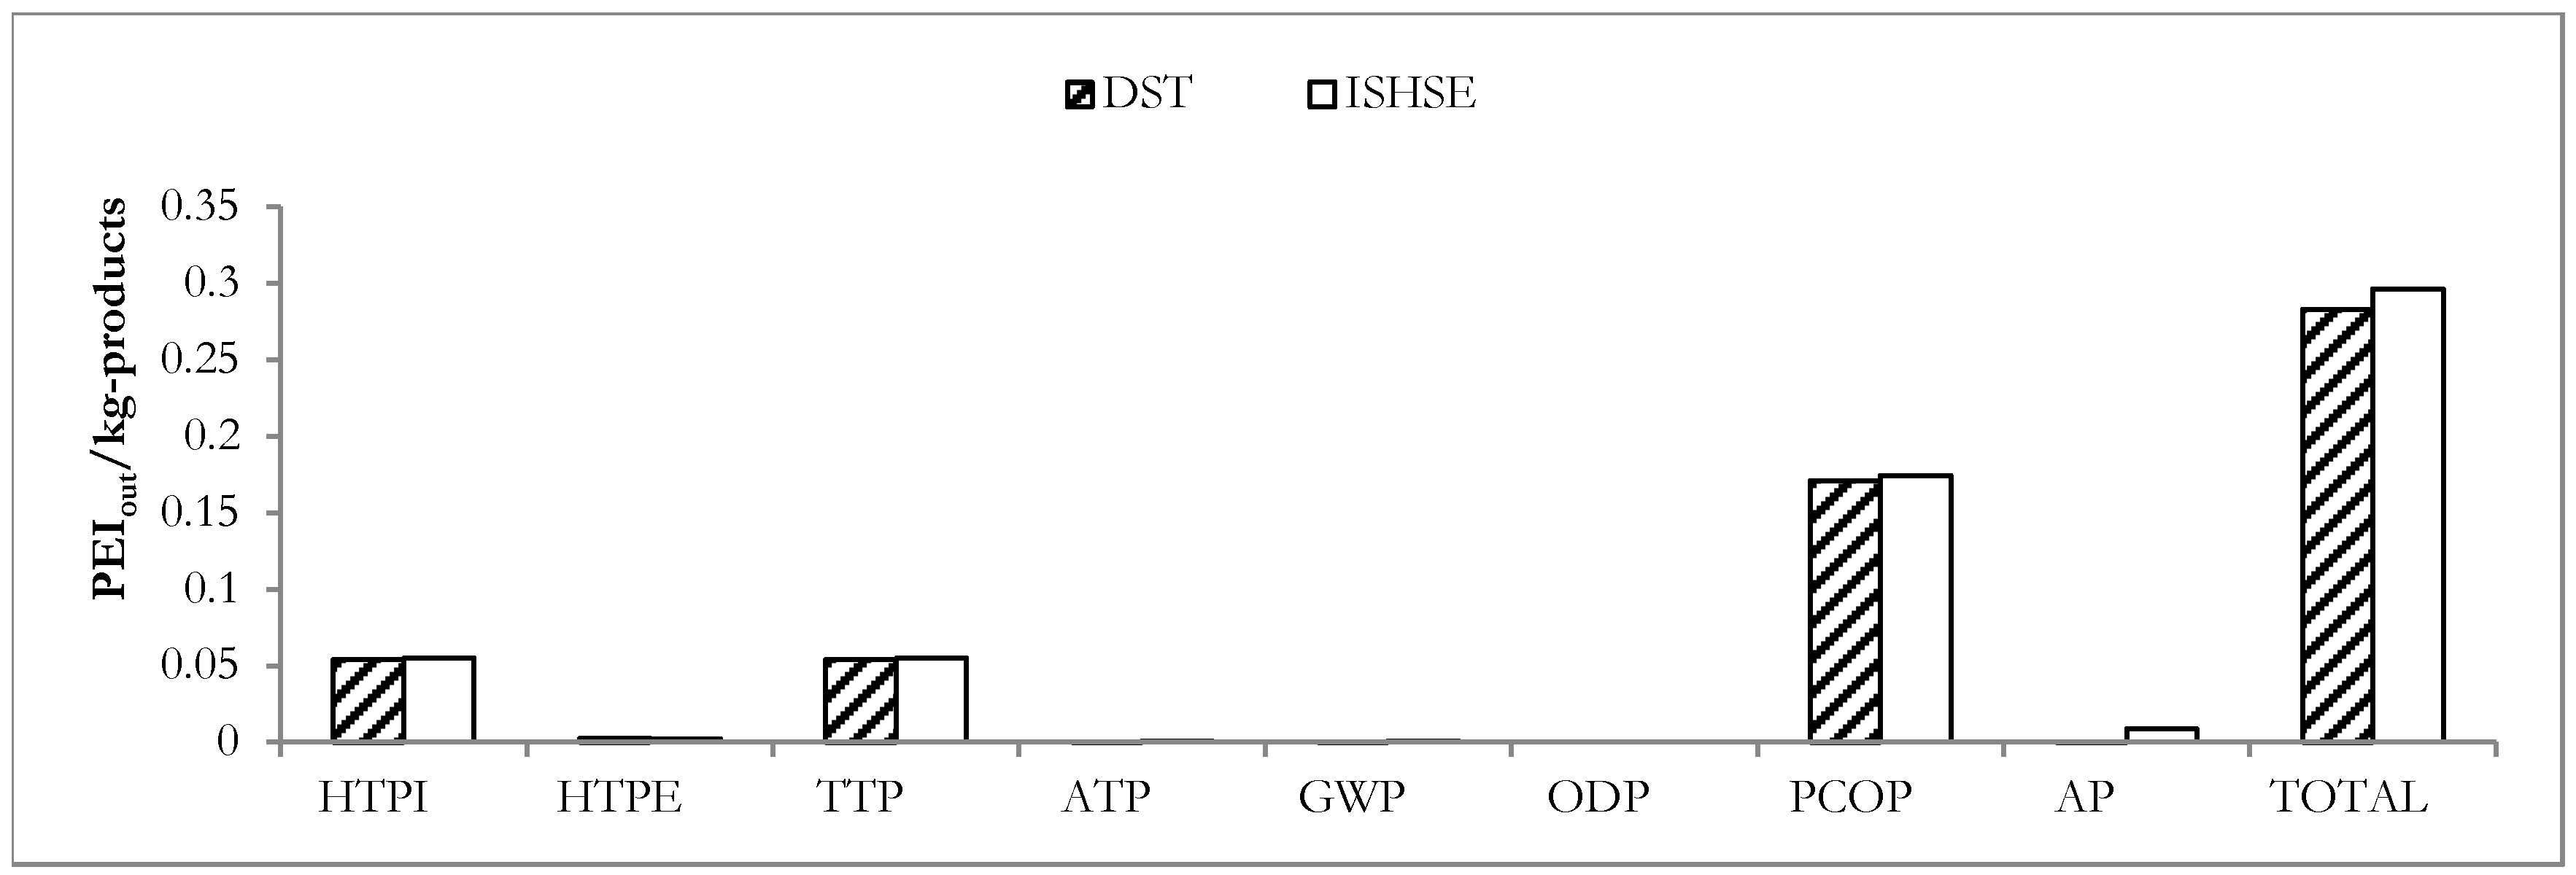
2.1.3. Potential Environmental Impact Assessment

The potential environmental impacts (PEIs) of the alternative catalyst-free biodiesel production processes were investigated using a comprehensive environmental impact assessment (EIA) tool, the waste reduction (WAR) algorithm (WAR version 1.0.17, United States Environmental Protection Agency, Washington, DC, USA). The WAR impact assessment tool has been identified as the preferred impact assessment tool when it is necessary to compare anticipated environmental impacts associated with only the chemical production processing facility [40] and has been used extensively in previous work [41,42]. Considering that the objectives of this study does not encompass the determination of suitable waste minimisation opportunities [43], assessment of environmental risk (environmental impact minimization and the environmental fate and risk assessment tool) [44] or the assessment of impacts associated with raw material acquisition, product distribution or product recycle (Ecoindicator-99 for life cycle analysis tool) [45], the utilisation of these aforementioned alternative environmental assessment tools is pointless. The sufficiency of the utilisation of the WAR algorithm in achieving the research objectives is therefore justified.
WAR algorithm is a powerful environmental impact assessment tool that utilises the mass balance data describing the flow rate and composition of the streams entering into and exiting a chemical process and energy balance data describing the rate of energy consumption from fossil-based sources to calculate the potential impact of the a process if the chemicals utilised in the process are directly emitted to the environment [45]. This environmental impact assessment tool was developed in response to the need for rapid assessments of environmental impacts during the conceptual and design stages of manufacturing processes [46]. The WAR algorithm enables the determination of the conceptual PEI of a process via an approach analogous to the classic mass or energy balances, since the theoretical PEI of an a chemical process is assumed to be conserved. Therefore for steady state processes the PEI balance of a chemical process is as follows [45],
I ˙ i n c p + I ˙ i n e p I ˙ o u t c p I ˙ o u t e p I ˙ w e c p I ˙ w e e p + I ˙ g e n = 0
Implying that the rate of PEI generation ( I ˙ gen) is as follows,
I ˙ g e n = [ I ˙ i n c p + I ˙ i n e p I ˙ o u t c p I ˙ o u t e p I ˙ w e c p I ˙ w e e p ]
where according to Young and Cabezas [45],
I ˙ o u t c p = i c p I ˙ i o u t = i c p M ˙ i o u t k x i ϕ k
I ˙ i n c p = i c p I ˙ i i n = i c p M ˙ i i n k x i ϕ k
I ˙ o u t e p = i e p g M ˙ i o u t k x k i ϕ k
I ˙ i n e p = i e p g M ˙ i i n k x k i ϕ k
I ˙ w e e p = i e p E ˙ i e p x w e ϕ k
I ˙ w e c p = i c p E ˙ i c p x w e ϕ k
In these Eqns., I ˙ i n c p and I ˙ o u t c p are the rate of PEIs into and out of a system due to chemical interactions within the system respectively; I ˙ o u t e p and I ˙ i n e p are the rate of PEI out and into a system due to energy generation processes within the system respectively; I ˙ w e e p and I ˙ w e c p are the PEI out of a system as a result of the release of waste energy due to energy generation and chemical processes within a system respectively; E ˙ i c p and E ˙ i e p are the rate of waste energy emission from the chemical process and energy generation process. Typically, in the context of the WAR algorithm, the I ˙ w e e p and I ˙ w e c p terms are considered as negligible since chemical process plants do not produce significant ‘unwanted’ energy into the environment [45]. Furthermore, for chemical plants the potential environmental impact associated with the emission of mass such as the spills of large mass of toxic chemicals or large masses of gaseous pollutants is usually much greater than that associated with the emission of energy such as rise in the temperature of the surrounding environment, Young and Cabezas [45] also emphasize that the rate of PEI out of a system as a result of energy generation processes ( I ˙ o u t e p ) are largely due to the generation of masses of gaseous pollutants such as SO2, NOx, CO and CO2 which are a consequence of the combustion of solid, liquid and gaseous fuels. is the mass flow rate of stream i output stream, M ˙ i i n is the mass flow rate of stream i input stream, xki is the mass fraction of component k in stream i and øk is the potential environmental impact due to component k. The parameter, øk, was determined by summing the specific potential environmental impact of component k over all of the possible impact categories l as follows [45],
ψ k = l α i ϕ k l s
In Equation (25), αi represents the relative weighting factor of impact categories, l and is indicative of the importance of each impact category to the analysis. In this study, however all impact categories were considered equally significant. The approach of considering the impact categories equally significant constitutes the accepted approach when the case studies being assessed have no specific site in mind [41,42,45]. The impact categories were classified largely based on extensive studies undertaken by Heijungs et al. [47]. The potential environmental impacts of each chemical utilised in the chemical process were obtained from a chemical database similar to the database present in the ChemCad 4.0 software (ChemCad, Houston, TX, USA). The impact categories l embeded in the WAR algorithm and the measure of impact category are presented in Table 2. Normalisation of the impact scores of the potential environmental impact due to component k, within each impact category were undertaken by the WAR algorithm to ensure that values of different pollution categories contain the same units to allow for their combination [40]. The normalisation of the impact scores also ensures that values from different categories will have on the average equivalent scores thus eliminating unintentional bias in the calculation of the PEI indexes [40]. The normalisation of the impact scores of the potential impact, due to component k is achieved by the WAR algorithm using the following normalisation scheme [40],
ϕ k l s = ( S c o r e ) k l [ ( S c o r e ) k ] l
where (Score)kl represents the impact score or value of chemical k on some arbitrary scale for impact category l and [(Score)k]l represents the average impact score or value of all chemicals in category l.
In the present study only the energy inputs (heating utilities) required for the ISHSE and the DST biodiesel production processes were assumed to be provided by natural gas as a fossil-based, non-renewable energy source. The WAR software is freely available on the EPA website. Using information on participating chemical components, inlet, product and waste streams, and total energy consumption, the PEI per kg of products of both processes have been determined.

3. Results

The ASPEN plus models for the DST and the alternative ISHSE catalyst-free biodiesel production pathways were designed and shown in Figure 6 and Figure 7, respectively. In Figure 6, the inlet feed streams of TAG and METHANOL, are initially mixed (MIXER-1) such that the required methanol to oil feed ratio of 42:1 is maintained and the mixture is subsequently pressurised to 28 MPa (pump P-1). The pressurised mixed stream (1-P) is subsequently fed to the continuously stirred tank (CSTR) reactors (ST-1, ST-2, ST-3 and ST-4), arranged in series to improve the conversion of TAG to FAME. Each CSTR reactor utilised in the supercritical TAG transesterification reaction is maintained at a temperature and a pressure of 280 °C and 28 MPa respectively. Stream (5) produced after the supercritical transesterification is then cooled using the heat exchanger (H-1) to 25 °C and depressurised to 1 atm using a valve (V-1). The recovery of excess methanol from the FAMEs, unreacted TAGs and glycerol present in stream (6) is initially undertaken via vaporisation of the excess methanol in a vaporiser (VAP) at a temperature of 90 °C and pressure of 1 atm. The recovered hot methanol represented by stream (7) is then cooled to a temperature of 25 °C using a heat exchanger (H-2) and with the recovered methanol at a temperature of 25 °C and under atmospheric pressure, represented by the METH-RCV stream. After the vaporisation of excess methanol, the residual mixture, represented by stream (8), is subjected to the distillation process using a distillation column (DISTL-1, 10 stages and reflux ratio 1.5) to facilitate the recovery of the FAME (BIODIESL) produced at the reboiler. The FAME containing stream (12) is cooled to 25 °C using a heat exchanger (H-5). In the simulated DST process, the biodiesel (BIODIESL) stream is characterised by a FAME content (99 wt. %), that satisfies the European EN 14214 standard for the minimum required methyl ester content for biodiesel and is specified by a mass fraction of FAME of ≥96.5% per unit mass of the biodiesel product [49]. Additional processing steps are introduced to enable the recovery of any remaining methanol present in the exit streams from the condenser of the distillation column (DISTL-1) to further avoid wastage of useful masses of methanol. Recovery of additional masses of methanol is achieved via a second distillation process, using another distillation column (DISTL-2, 6 stages and reflux ratio 1). Finally, the recovered methanol (ME-RCV-2) and glycerol (GLYCEROL) containing streams are cooled to 25 °C using heat exchangers H-3 and H-4 respectively. Glycerol containing stream is considered as a waste stream due to the low price of purified glycerol as discussed in later sections.
In Figure 7, the inlet feed streams of TAG and water, are initially mixed (MIXER-1) and then pressurised to 7 MPa using a pump (P-1). The pressurised mixed stream (1-P) is subsequently fed to continuously stirred tank (CSTR) reactors (HDR-1, HDR-2, HDR-3 and HDR-4), arranged in series to improve the conversion of the TAG to FAs. Each CSTR reactor utilised in modelling the subcritical TAG hydrolysis reaction is maintained at a temperature and pressure of 270 °C and 7 MPa respectively. Stream (5) produced after subcritical lipid hydrolysis is then cooled using a heat exchanger (H-1) to 25 °C and is depressurised to 1 atm using a valve (V-1). Separation of the FAs was achieved via simple decantation since the phases present (non-polar fatty acid and polar water) are essentially immiscible at mild temperatures [50]. The separated FAs in the OIL-PHSE stream are subsequently mixed with methanol such that the desired methanol to FA molar feed ratio of 20:1 is maintained. The properly mixed inlet feed stream (7), composed of FA and methanol is then pressurised to 8.1 MPa using a pump (P-2) and is subsequently fed to multiple CSTR reactors (EST-1, EST-2 and EST-3), arranged in series to improve the percentage conversion of the FAs to FAMEs. Each CSTR reactor utilised in modelling the supercritical FA esterification reaction is maintained at a temperature and a pressure of 250 °C and 8.1 MPa respectively. The product stream (11) mainly composed of unreacted methanol, water and FAMEs is cooled to 25 °C using a heat exchanger (H-2) and is depressurised to 1 atm using a valve (V-2). The cooled and depressurised product stream (13) is then subjected to vapourisation (VAP) at a temperature of 140 °C and a pressure of 1 atm respectively to vaporise any methanol and water impurities that may be present in the biodiesel (BIODIESL) product. This biodiesel product is cooled to 25 °C using heat exchanger (H-3). The vapour (stream 14) composed mainly of methanol and water is processed for methanol recovery via the distillation process using the distillation column (DISTL, 10 stages and reflux ratio 10). This stage is considered necessary to enable methanol recovery for reuse. The higher boiling temperature stream 17 (WATER-RC) and the lower boiling temperature methanol (stream 16) are also cooled to 25 °C using heat exchangers H-4 and H-5 respectively. Stream 17 and methanol stream are cooled to facilitate easy handling for secondary uses and future esterification reactions respectively. The water containing streams represented by AQ-PHSE and WATER-RC in Figure 7 are considered as waste streams. In the simulated ISHSE process the biodiesel (BIODIESL) stream is characterised by a FAME content (97 wt. %), that satisfies the European EN 14214 standard for the minimum required methyl ester content for biodiesel and is specified as ≥96.5% per unit mass of the biodiesel product [49].
Table 3 and Table 4 present the mass balance results of major streams in the DST and the ISHSE biodiesel production processes respectively. For both processes, 849.9 kg of biodiesel/h is produced with methyl ester contents greater than 96.5 wt. % in the respective biodiesel products.
The thermal data is provided in Table 5 and Table 6 were utilised in formulating the composite curves (CC) and grand composite curve (GCC) for both ISHSE and DST biodiesel production processes.
After undertaking heat integration via the pinch methodology as stated earlier in Section 2, the CC and GCC for the DST process and the CC and GCC for the ISHSE process have been presented in Figure 8, Figure 9, Figure 10 and Figure 11 respectively. The generated HEN for the DST and ISHSE process and a chart showing the comparative view of the utility requirement before and after heat integration for both processes have also been presented in Figure 12, Figure 13 and Figure 14 respectively.
To assess the performance of the alternative high pressure biodiesel production processes and also identify the major contributors to the environmental outcomes, a comparative assessment of the output potential environmental impacts (PEI) per kg of products for both processes were investigated. The potential environmental impact (PEI) per kg of products due to the DST and the ISHSE biodiesel production processes is presented in Figure 15. Figure 15 shows that the ISHSE biodiesel production process has a PEI of about 1.05 times greater than the PEI of the DST process.

4. Discussion

From the mass balance results for the DST and the ISHSE processes presented in Table 3 and Table 4 respectively, it is seen that methanol recovery is highly efficient with a methanol percentage recovery of 90% and 97% calculated for the DST process and ISHSE process respectively. This observation implies that methanol consumption in the ISHSE and DST processes are 54.8 kg/h and 132.62 respectively. This observation is expected due to the reduced methanol to FA mole ratio required during esterification reaction relative to the high methanol to TAG mole ratio required during transesterification reactions as discussed in the introductory section of this paper. The DST biodiesel production process is characterised by one major ‘waste’ (GLYCEROL) stream which is generated at a mass flow rate of 149.9 kg/h. This observation contrasts with the ISHSE biodiesel production process which is characterised by two major ‘waste’ streams namely, the WATER-RC and AQ-PHSE streams with a combined flow rate 980.8 kg/h. This initial observation suggests that the ISHSE biodiesel production process may present a greater waste management challenge than the DST process. Furthermore, the recovery of pure glycerol from the GLYCEROL stream and the AQ-PHSE stream of the DST and the ISHSE biodiesel processes respectively is not considered in this study since the purification of the glycerol makes no economic sense. This is because the cost of pure glycerol is very low due to current glut of glycerol supply arising from increased global biodiesel production capacities [51]. It therefore implies that there is a clear economic disadvantage of introducing additional glycerol purification steps in both processes.
A consideration of the energy balance data presented in Table 5 and Table 6 shows that prior to heat integration energy duties of 14,940 kW and the 2661 kW are required by the ISHSE and the DST processes respectively. In both processes the distillation columns and the reactors constitute major contributors to the calculated energy duties. Clearly exploration of opportunities for heat recovery will serve to improve the energetics of both processes. Heat recovery was therefore undertaken via pinch analysis as discussed in Section 2 above. Comparing Figure 8 and Figure 10, it can the observed that the ISHSE provides reduced opportunities for heat recovery relative to the heat recovery opportunities available for in the DST process implying the significant duty required during the ISHSE process relative to the DST process will be retained. The Aspen Energy Analyser® determined that the minimum heating utility (Q(H)min) and the minimum cooling utility (Q(C)min) for the DST process are 317.5 kW and 438.8 kW respectively while the Q(H)min and Q(C)min for the ISHSE process are 6269 kW and 6012 kW respectively. Figure 9 and Figure 11, highlight the plot of the heat load difference between hot and cold composite curves, for the DST and ISHSE process respectively, as a function of temperature such that the pinch point, which is the point where there is no heat flow, is identified by the point the curve touches the Temperature (y) axis. The Aspen Energy analyser has also determined that the pinch temperature is 66 °C for the ISHSE biodiesel production process and 344 °C for the DST biodiesel production process. Figure 12 and Figure 13 depict the stream information and the Aspen Energy analyser generated HEN grid diagram for the DST and the ISHSE process flowsheets respectively. These HEN grid diagrams highlight the energy duties satisfied using necessary external cooling utilities and heating utilities and the required number of heat exchangers. For the DST process shown in Figure 12, 14 heat exchangers and 5 utilities were utilised. Figure 12 also shows that the heating requirements were satisfied using low pressure steam (LP stream) and fired heat (1000) while the cooling requirements were satisfied using a refrigerant (refrigerant 1), air and via high pressure steam generation (HP steam generation). It can also be seen that most of the cooling requirements of the DST process can be satisfied with the use of a refrigerant with a bulk of the heating requirements satisfied using the fired heater. Similarly in the ISHSE process 14 heat exchangers were utilised. More utilities (7) compared to the DST process were however required to satisfy the energy requirements, as expected, due to the calculated higher heating and cooling requirements. Figure 13 shows that the cooling requirements were provided using a refrigerant (refrigerant 1), air and a high pressure steam generation (HP steam generation) plant. The heating requirements were satisfied using low pressure steam (LP steam), fired heat (Fired heat (1000)), moderate pressure steam (MP steam) and hot oil (Hot oil). Most of the cooling requirements were satisfied using air via heat transfer from the condenser of the distillation column with most of the heating requirements satisfied using LP steam to providing the heat required by the reboiler of the distillation column. It is crucial to note at this juncture that the HEN diagrams (as shown in Figure 12 and Figure 13) constitute only one of the possible designs that can be utilised in reducing the heating and the cooling duties, given that, multiple designs are also possible for the given process for different ΔTmin values. Further studies with respect to cost minimisation for optimal heat integration may also be undertaken in the future. Figure 14 therefore illustrates the difference in the energy duties of both processes before heat integration and after heat integration. It can be seen clearly that while an energy saving of 71.6% are possible using the DST biodiesel production process, energy savings of only 17.8% is possible in the ISHSE biodiesel production process.
Figure 15 shows that the indexes photochemical oxidation potential (PCOP) index and acidification potential (AP) index constitute the major impact categories of the PEI for the ISHSE and the DST biodiesel production processes. Figure 15 also shows that the highest contributor to the PEI for the ISHSE and the DST processes is the PCOP index impact category. This may be explained by acknowledging that masses of volatile methanol were utilised in both biodiesel production processes. This is because volatiles are capable of producing photochemical smog via photochemical reactions with precursor pollutants, such as nitrous oxides (NOx) generated during fossil fuel utilisation [52]. The higher the mass of methanol utilized, the higher the risk of smog formation, thus explaining the observed higher contribution of the PCOP index impact category in the ISHSE (methanol used, 1826.9 kg/h) process relative to the DST (methanol used, 1326.2 kg/h) process. Furthermore, both processes will present almost similar pollution risks to humans and land as illustrated by the human toxicity potential by ingestion (HTPI) and terrestrial toxicity potential (TTP) indexes. The almost similar indexes (HTPI, TTP) for ISHSE (0.0549, 0.0549) and DST(0.0542, 0.0542) suggests that although a reduced mass of methanol solvent was utilised during the ISHSE process, higher masses of the combined waste streams will result in an almost similar impact to the impact of the higher methanol demanding DST process, on humans (HTPI) and land (TTP). The utilization of fossil fuels will result in the release of CO2, NOx and SO2 which when combined with atmospheric moisture, will lead to the formation of weak acids such as carbonic acid (H2CO3) and sulfurous acid (H2SO3) which constitute the major causes of acid rain [53]. Thus higher fossil energy consumption as in the case of the ISHSE process relative to the DST process will result in a higher acidification potential as illustrated by the higher AP index of the ISHSE process relative to the AP index of the DST process. The present study therefore suggests that the DST biodiesel process may therefore be conclusively considered as a (slightly) more environmentally favourable catalyst-free biodiesel production process. To improve the PEI of the ISHSE biodiesel production process relative to the DST biodiesel production, some consideration must be given to reducing the large quantities of primary fuel via the use of cheap energy sources. This is because the utilisation of alternative energy sources such as solar power for lower energy process, e.g., vapourisation of the methanol, will reduce the volumes of gases such as SO2, CO2 and NOx that characterise fossil fuel use, thus reducing the output rate of PEI due to fuel utilisation. The utilisation of the large mass of the waste streams from both the ISHSE and DST processes as a useful feedstock for secondary value addition via anaerobic digestion for cheap bioenergy generation may also be explored. Furthermore, the utilisation of ‘filters’ to clean gaseous emissions during the utilisation of fossil-based fuels could also be considered.

5. Conclusions

This analysis established that the integrated subcritical lipid hydrolysis and supercritical esterification (ISHSE) and direct supercritical transesterification (DST) biodiesel production processes are characterised by very different rates of energy consumption after heat integration. The minimum cooling (317.5 kW) and heating utility (438.8 kW) of the DST process was shown to be about 95% and about 93% less than the minimum heating (6012 kW) and cooling utility (6269 kW) of the ISHSE process respectively. Further investigations to ascertain the actual environmental performances of both processes were also undertaken using the waste reduction algorithm.
Combining the waste reduction algorithm and energetic assessments, this paper therefore demonstrated that the DST biodiesel production process constituted a more favourable catalyst-free biodiesel production process, overall. The importance of heat integration via the utilisation of hot stream as a heat source for cold streams was also emphasised as a pathway for improving the environmental performances of both process. This is because such heat integration will facilitate reduction in energy demand and reduction in the fossil fuel demand in the ISHSE and DST biodiesel production processes and thus reduces the volumes of SO2, CO2 and NOx that characterise fossil fuel use, thus reducing the contribution of the index of the acidification potential and the index of global warming potential impact categories to the potential environmental impacts. Although possible improvements in the catalyst-free biodiesel production designs are recognised, the feasibility of introducing the suggested design modifications will be dependent on the engineering economics and process efficiency concerns thus indicating the need for further investigations with respect to the economic performances and optimisation of the both processes.

Supplementary Files

Supplementary File 1

Acknowledgments

Oseweuba Valentine Okoro gratefully acknowledges the financial support of the University of Otago via the Otago Doctoral scholarship.

Author Contributions

All authors contributed extensively to the work presented in this paper. Oseweuba Valentine Okoro conceived the simulation study and drafted the manuscript; Zhifa Sun and John Birch revised the paper.

Conflicts of Interest

The authors declare no conflict of interest.

References

  1. Okoro, O.; Sun, Z.; Birch, J. Meat processing dissolved air flotation sludge as a potential biodiesel feedstock in New Zealand: A predictive analysis of the biodiesel product properties. J. Clean. Prod. 2017, 168, 1436–1447. [Google Scholar] [CrossRef]
  2. Saka, S.; Kusduiana, D.; Minami, E. Non-catalytic biodiesel fuel production with supercritical methanol technologies. J. Sci. Ind. Res. 2006, 65, 420–425. [Google Scholar]
  3. Glisic, S.; Skala, D. The problems in design and detailed analyses of energy consumption for biodiesel synthesis at supercritical conditions. J. Supercrit. Fluids 2009, 49, 293–301. [Google Scholar] [CrossRef]
  4. Mondala, A.; Liang, K.; Toghiani, H.; Hernandez, R.; French, T. Biodiesel production by in situ transesterification of municipal primary and secondary sludges. Bioresour. Technol. 2009, 100, 1203–1210. [Google Scholar] [CrossRef] [PubMed]
  5. Okoro, O.; Sun, Z.; Birch, J. Enhanced fatty acid generation from meat processing dissolved air flotation sludge. In Proceedings of the 25th European Biomass Conference and Exhibition, Stockholm, Sweden, 12–15 June 2017. [Google Scholar]
  6. Jin, T.; Wang, B.; Zeng, J.; Yang, C.; Wang, Y.; Fang, T. Esterification of free fatty acids with supercritical methanol for biodiesel production and related kinetic study. RSC Adv. 2015, 5, 52072–52078. [Google Scholar] [CrossRef]
  7. Sawangkeaw, R.; Bunyakiat, K.; Ngamprasertsith, S. Effect of co-solvents on production of biodiesel via transesterification in supercritical methanol. Green Chem. 2007, 9, 679–685. [Google Scholar] [CrossRef]
  8. Abdulagatov, I.; Polikhronidi, N.; Abdurashidova, A.; Kiselev, S.B.; Ely, J.F. Thermodynamic Properties of Methanol in the Critical and Supercritical Regions. Int. J. Thermophys. 2005, 26, 1327–1368. [Google Scholar] [CrossRef]
  9. Lu, J.; Boughner, E.; Liotta, C.; Eckert, C. Nearcritical and supercritical ethanol as a benign solvent: Polarity and hydrogen-bonding. Fluid Phase Equilib. 2002, 198, 37–49. [Google Scholar] [CrossRef]
  10. Hoffmann, M.; Conradi, M. Are There Hydrogen Bonds in Supercritical Methanol and Ethanol? J. Phys. Chem. B 1998, 102, 263–271. [Google Scholar] [CrossRef]
  11. Patil, P.; Gude, V.; Mannarswamy, A.; Deng, S.; Cooke, P.; Munson-McGee, S.; Rhodes, I.; Lammers, P.; Nirmalakhandan, N. Optimization of direct conversion of wet algae to biodiesel under supercritical methanol conditions. Bioresour. Technol. 2011, 102, 118–122. [Google Scholar] [CrossRef] [PubMed]
  12. Demirbas, A. Studies on cottonseed oil biodiesel prepared in non-catalytic SCF conditions. Bioresour. Technol. 2008, 99, 1125–1130. [Google Scholar] [CrossRef] [PubMed]
  13. He, H.; Wang, T.; Zhu, S. Continuous production of biodiesel fuel from vegetable oil using supercritical methanol process. Fuel 2007, 86, 442–447. [Google Scholar] [CrossRef]
  14. Tan, K.; Lee, K.; Mohamed, A. Optimization of supercritical dimethyl carbonate (SCDMC) technology for the production of biodiesel and value-added glycerol carbonate. Fuel 2010, 89, 3833–3839. [Google Scholar] [CrossRef]
  15. Shin, H.; Lim, S.; Bae, S.; Oh, C. Thermal decomposition and stability of fatty acid methyl esters in supercritical methanol. J. Anal. Appl. Pyrolysis 2011, 92, 332–338. [Google Scholar] [CrossRef]
  16. Silva, C.D.; Vladimir, O. Biodiesel production through non-catalytic supercritical transesterification: Current state and perspectives. Braz. J. Chem. Eng. 2014, 31, 271–285. [Google Scholar] [CrossRef]
  17. Kusdiana, D.; Saka, S. Two-Step Preparation for Catalyst-Free Biodiesel Fuel Production Hydrolysis and Methyl Esterification. Appl. Biochem. Biotechnol. 2004, 115, 781–790. [Google Scholar] [CrossRef]
  18. Gutierrez Ortiz, F.J.; de Santa-Ana, P.; Segovia-Hernande, J.G.; Hernandez, S. Techno-economic assessment of an energy self-sufficient process to produce biodiesel under supercritical conditions. J. Supercrit. Fluids 2017, 129, 349–358. [Google Scholar] [CrossRef]
  19. Gomez-Castro, F.I.; Rico-Ramirez, V.; Segovia-Hernandez, J.G.; Hernandez-Castro, S.; El-Halwagi, M.M. Simulation study on biodiesel production by reactive distillation with methanol at high pressure and temperature: Impact on costs and pollutant emissions. Comput. Chem. Eng. 2013, 52, 204–215. [Google Scholar] [CrossRef]
  20. Martín, A.; Mato, F. Hint: An educational software for heat exchanger network design with the pinch method. Educ. Chem. Eng. 2008, 3, 6–14. [Google Scholar] [CrossRef]
  21. Sadhukhan, J.; Ng, K.; Martinez-Hernandez, E. Heat integration and utility system design. In Biorefineries and Chemical Processes: Design, Integration and Sustainability Analysis, 1st ed.; Wiley: Chichester, UK, 2014; pp. 63–91. [Google Scholar]
  22. Linnhoff, B.; Flower, J. Synthesis of heat exchanger networks: I. Systematic generation of energy optimal networks. AIChe J. 1978, 24, 633–642. [Google Scholar] [CrossRef]
  23. Sinnot, R.; Towler, G. Chemical Engineering Design, 5th ed.; Elsevier: Burlington, VT, USA, 2009. [Google Scholar]
  24. Gomez-Castro, F.I.; Rico-Ramirez, V.; Segovia-Hernandez, J.G.; Hernandez, S. Feasibility study of a thermally coupled reactive distillation process for biodiesel production. Chem. Eng. Process. Process Intensif. 2010, 49, 262–269. [Google Scholar] [CrossRef]
  25. Minami, E.; Saka, S. Kinetics of hydrolysis and methyl esterification for biodiesel production in two-step supercritical methanol process. Fuel 2006, 85, 2479–2483. [Google Scholar] [CrossRef]
  26. He, H.; Sun, S.; Wang, T.; Zhu, S. Transesterification kinetics of soybean oil for production of biodiesel in supercritical methanol. J. Am. Oil Chem. Soc. 2007, 84, 399–404. [Google Scholar] [CrossRef]
  27. Freedman, B.; Bagby, M. Heats of combustion of fatty esters and triglycerides. J. Am. Oil Chem. Soc. 1989, 66, 1601–1605. [Google Scholar] [CrossRef]
  28. Lapuerta, M.; Rodríguez-Fernández, J.; Armas, O. Correlation for the estimation of the density of fatty acid esters fuels and its implications. A proposed Biodiesel Cetane Index. Chem. Phys. Lipids 2010, 163, 720–727. [Google Scholar] [CrossRef] [PubMed]
  29. Knothe, G. “Designer” Biodiesel: Optimizing Fatty Ester Composition to Improve Fuel Properties. Energy Fuels 2008, 22, 1358–1364. [Google Scholar] [CrossRef]
  30. Teeter, H.; List, G. Methods of Preparation of Fatty Acids and Their Derivatives: Laboratory Exercises: AOCS Lipdi Library. Available online: http://lipidlibrary.aocs.org/OilsFats/content.cfm?ItemNumber=41539 (accessed on 17 October 2017).
  31. European Standard (EN). EN 14214: Automotive Fuels-Fatty Acid Methyl Esters (FAME) for Diesel Engines—Requirement Methods; European Committee for Standardization (CEN): Brussels, Belgium, 2009. [Google Scholar]
  32. American Society for Testing and Materials (ASTM). D6751-08a Standard Specification for Biodiesel (B100) Fuel Blend Stock (B100) for Middle Distillate Fuels. ASTM Annual Book of Standards; American Society for Testing and Materials International: West Conshohocken, PA, USA, 2008. [Google Scholar]
  33. Tang, Z.; Du, Z.; Min, E.; Gao, L.; Jiang, T.; Han, B. Phase equilibria of methanol-triolein system at elevated temperature and pressure. Fluid Phase Equilib. 2006, 239, 8–11. [Google Scholar] [CrossRef]
  34. Apostolakou, A.; Kookos, I.; Marazioti, C.; Angelopoulos, K. Techno-economic analysis of a biodiesel production process from vegetable oils. Fuel Process. Technol. 2009, 90, 1023–1031. [Google Scholar] [CrossRef]
  35. Perry, E.S.; Weber, W.H.; Daubert, B.F. Vapor Pressure of Phlegmatic Liquids I. Simple and Mixed Triglycerides. J. Am. Chem. Soc. 1949, 71, 3720–3726. [Google Scholar] [CrossRef]
  36. Kocsisová, T.; Juhasz, J.; Cvengros, J. Hydrolysis of fatty acid esters in subcritical water. Eur. J. Lipid Sci. Technol. 2006, 108, 652–658. [Google Scholar] [CrossRef]
  37. Sturzenegger, A.; Sturm, H. Hydrolysis of fats at high temperatures. Ind. Eng. Chem. 1951, 43, 510–515. [Google Scholar] [CrossRef]
  38. Braun, M.; Altan, H.; Beck, S. Using regression analysis to predict the future energy consumption of a supermarket in the UK. Appl. Energy 2014, 130, 305–313. [Google Scholar] [CrossRef]
  39. Quesada-Medina, J.; Olivares-Carrillo, P. Evidence of thermal decomposition of fatty acid methyl esters during the synthesis of biodiesel with supercritical methanol. J. Supercrit. Fluids 2011, 56, 56–63. [Google Scholar] [CrossRef]
  40. Young, D.; Scharp, R.; Cabezas, H. The waste reduction (WAR) algorithm: Environmental impacts, energy consumption, and engineering economics. Waste Manag. 2000, 20, 605–615. [Google Scholar] [CrossRef]
  41. Rincón, L.; Jaramillo, J.; Cardona, C. Comparison of feedstocks and technologies for biodiesel production: An environmental and techno-economic evaluation. Renew. Energy 2014, 69, 479–487. [Google Scholar] [CrossRef]
  42. Moncada, J.; Tamayo, J.; Cardona, C. Integrating first, second, and third generation biorefineries: Incorporating microalgae into the sugarcane biorefinery. Chem. Eng. Sci. 2014, 118, 126–140. [Google Scholar] [CrossRef]
  43. Pistikopoulos, E.N.; Stefanis, S.K.; Livingston, A.G.A. Methodology for Minimum Environmental Impact Analysis. AICHe Symp. Ser. 1995, 35, 4128. [Google Scholar]
  44. Shonnard, D.R.; Hiew, D.S. Comparative Environmental assessments of VOC Recovery and recycle design alaternatives for gaseous waste streams. Environ. Sci. Technol. 2000, 34, 5222–5228. [Google Scholar] [CrossRef]
  45. Young, D.; Cabezas, H. Designing sustainable processes with simulation: The waste reduction (WAR) algorithm. Comput. Chem. Eng. 1999, 23, 1477–1491. [Google Scholar] [CrossRef]
  46. Cabezas, H.; Bare, J.; Mallick, S. Pollution prevention with chemical process simulators: The generalized waste reduction (WAR) algorithm—Full version. Comput. Chem. Eng. 1999, 23, 623–634. [Google Scholar] [CrossRef]
  47. Heijungs, R.H.G.; Lankreijer, R.; de Hayes, H.U.; Wegenersleeswijk, A. Environmental Life Cycle Assessment of Products Guide. Leiden: Centre of Environmental Science; CML: Leiden, The Netherlands, 1992. [Google Scholar]
  48. Gangadharan, P.; Kanchi, K.; Lou, H. Evaluation of the economic and environmental impact of combining dry reforming. Chem. Eng. Res. Des. 2012. [Google Scholar] [CrossRef]
  49. Kay, K.; Yasir, S. Biodiesel Production from Low Quality Crude Jatropha Oil Using Heterogeneous Catalyst. APCBEE Procedia 2012, 3, 23–27. [Google Scholar] [CrossRef]
  50. Machado, G.; de Souza, T.; Aranda, D.; Pessoa, F.; Castier, M.; Cabral, V.; Cardozo-Filho, L. Computer simulation of biodiesel production by hydro-esterification. Chem. Eng. Process. Process Intensif. 2016, 103, 37–45. [Google Scholar] [CrossRef]
  51. Yang, F.; Hanna, M.; Sun, R. Value-added uses for crude glycerol—A byproduct of biodiesel production. Biotechnol. Biofuels 2012. [Google Scholar] [CrossRef] [PubMed]
  52. Environmental Protection Agency. Photochemical Smog—What It Means for Us; EPA Information; Environmental Protection Agency: South Austrialia, Australia, 2004.
  53. Vallero, D. Fundamentals of Air Pollution, 5th ed.; Elsevier: Boston, MA, USA, 2014. [Google Scholar]
Figure 1. Block flow diagram for the DST biodiesel production process.
Sustainability 10 00127 g001
Figure 2. Block flow diagram for the ISHSE biodiesel production process.
Sustainability 10 00127 g002
Figure 3. Lipid hydrolysis in supercritical water (adapted from Minami and Saka [25]).
Sustainability 10 00127 g003
Figure 4. Relations between the conversion factor and time at different operating temperatures. Points: data based on the experimental data obtained by Minami and Saka [25]. Lines: fitted lines using Equation (7).
Sustainability 10 00127 g004
Figure 5. The relation between k h y and T for subcritical hydrolysis of TAG at temperatures ranging from 250 °C to 320 °C.
Sustainability 10 00127 g005
Figure 6. The process flow sheet for the simulated direct supercritical transesterification (DST) process.
Sustainability 10 00127 g006
Figure 7. The process flow sheet for the simulated integrated subcritical lipid hydrolysis and supercritical esterification (ISHSE) process.
Sustainability 10 00127 g007
Figure 8. Composite curves (CC) for minimum driving temperature of 10 K for DST.
Sustainability 10 00127 g008
Figure 9. Grand composite curve (GCC) for minimum driving temperature of 10 K for DST.
Sustainability 10 00127 g009
Figure 10. Composite curves (CC) for minimum driving temperature of 10 K for ISHSE.
Sustainability 10 00127 g010
Figure 11. Grand composite curve (GCC) for minimum driving temperature of 10 K for ISHSE.
Sustainability 10 00127 g011
Figure 12. Aspen Energy analyser HEN output for the DST process (blue and red colours representing the cold streams and hot streams respectively).
Sustainability 10 00127 g012
Figure 13. Aspen Energy analyser HEN output for the ISHSE process (blue and red colours representing the cold streams and hot streams respectively).
Sustainability 10 00127 g013
Figure 14. Utility requirement of DST and ISHSE processes.
Sustainability 10 00127 g014
Figure 15. The comparative assessment of the potential environmental impacts of the ISHSE and the DST biodiesel production processes.
Sustainability 10 00127 g015
Table 1. Major fuel properties of the methyl oleate model biodiesel product compared to existing standards.
Fuel Property of Methyl OleateValueEN 14214 eASTM D6751 f
Higher heating value (kJ/kg)39.91 a>35NS
Density (kg/m3 at 15 °C)877.46 b860 ≤ ρ ≤ 900NS
Kinematic viscosity (mm2/s at 40 °C)4.51 c3.5 ≤ υ ≤ 5.01.9 ≤ υ ≤ 6.0
Cetane number59.3 c≥51≥47
Iodine index84.4 d≤120NS
a [27], b [28] c [29] d [30] e [31] f [32].
Table 2. Impact categories in the WAR algorithm (adapted from Gangadharan et al. [48]).
General Impact CategoryImpact CategoryMeasure of Impact Category
Human toxicityIngestion (HTPI)LD50
Inhalation/dermal (HTPE)OSHA PEL
Ecological toxicityAquatic toxicity (ATP)Fathead Minnow LC50
Terrestrial toxicity (TTP)LD50
Global atmospheric impactsGlobal warming potential (GWP)GWP
Ozone depletion potential (ODP)ODP
Regional atmospheric impactsAcidification Potential (AP)AP
Photochemical oxidation potential (PCOP)PCOP
Table 3. The simulation results of the major streams in the process flow sheet for the DST process.
Stream Name1259BIODIESLGLYCEROLME-RCV-2METH-RCVMETHANOLTAG
Temperature (°C)2528028072252525252525
Pressure (MPa)0.101328280.10130.10130.10130.10130.10130.10130.1013
Mass fraction
Methanol0.6030.5720.5600.401Trace0.2211110
Triglyceride0.3970.1090.002Trace0.006TraceTraceTrace01
FAME00.2890.3960.1390.9940.181TraceTrace00
Glycerol00.030.0410.460Trace0.598TraceTrace00
Mass Flows (kg/h)2198.92198.92198.9194.8849.9149.944.91154.21326.2872.7
Table 4. The simulation results of the major streams in the process flow sheet for the ISHSE process.
Stream Name12579AQ-PHSEBIODIESLFAMETH-FMETH-RCVTAGWATERWATER-RC
Temperature (°C)25270270252502725272525252525
Pressure (MPa)0.1013770.10138.10.10130.10130.10130.10130.10130.10130.10130.1013
Mass Fractions
Oleic acid00.3360.4550.3050.074Trace0.0130.9950Trace000.002
Methanol0000.6930.66700.012010.97900Trace
Triglyceride0.4770.1260.0020.0020.002Trace0.0040.0050Trace100.026
Water0.5230.5010.49400.0150.9090.001000.021000.595
FAME00000.24300.9700Trace010.378
Glycerol000000.0910000000
Mass Flows1768.71768.71768.72634.92634.9960.7849.9808.11826.91764.9844.2924.520.1
Table 5. Hot and cold streams extracted from Simulation flowsheet for the ISHSE biodiesel production process.
Stream DescriptionTemperature (°C)Duty (kW)
InletOutlet-
Hot streams
5_To_5-127025430.42
11_To_1225025710.50
15_To_BIODIESL1402555.75
16_To_METH-RCV65.12567.00
HDR-2_heat270269.513.97
HDR-3_heat270269.53.70
HDR-4_heat270269.50.98
To Condenser at DISTL_To_166665.16058.96
17_To_WATER-RC101.1251.37
Cold streams
EST-1_heat35.1250718.5
EST-2_heat250250.55.62
EST-3_heat250250.51.36
VAP_heat27.3140736.00
HDR-1_heat35.3270366.40
To Reboiler at DISTL_To_17100101.15771.50
Table 6. Hot and cold streams extracted from Simulation flowsheet for the DST biodiesel production process.
Stream DescriptionTemperature (°C)Duty (kW)
InletOutlet-
Hot streams
5_To_5-128025588.57
7_To_METH-RCV9025406.0
10_To_ME-RCV-264.5251.63
11_To_GLYCEROL79255.46
12_To_BIODIESL344.125184.90
ST-2_heat280279.59.25
ST-3_heat280279.52.55
ST-4_heat280279.50.70
To Condenser at DISTL-1_To_9254.371.8164.60
To Condenser at DISTL-2_To_1069.664.527.50
Cold streams
ST-1_heat69.4280483.50
VAP_heat27.290441.03
To Reboiler at DISTL-1_To_12343.5344.1317.54
To Reboiler at DISTL-2_To_1169.779.027.90

