1. Introduction
The current set of building rating tools (LEED [
1], CASBEE [
2], BREEAM [
3], GBTool [
4], Green Star Australia [
5],
etc.) tend to focus on technical aspects such as energy consumption, water use or materials. This is a concern to some commentators (the author included) because actual performance in operation ‘can be severely compromised because the specification and technical performance fail adequately to account for the inhabitants’ needs, expectations and behaviour [
6] and unexpected behaviour by occupants can degrade whole system performance and potentially overturn the savings expected by designers or policy-makers [
7].
As noted by Yudelsen [
8] ‘It costs $300 (or more) per square foot for the average [North American] employee’s salary and benefits; $30 per square foot (or less) for rent; and $3 per square foot for energy. To maximize corporate gain, we should focus on improving the output from the $300 person, not hampering that output to save a fraction of $30 on space or a much smaller fraction of $3 on energy’. This “100:10:1 rule”, as it is popularly known, applies in most of the developed world. Despite this, only the most tentative steps have been taken to refocus attention on building users and their ability to be productive within the physical environment of a building. According to Meir
et al. [
9], ‘The issue of sustainability, holistic by definition, may be too complex to determine by measurements alone. Obviously user sensibility and satisfaction must play a pre-eminent role in evaluating all types of facilities and therefore they must play an active part in building performance evaluations of all types’.
In this paper, the author argues for the inclusion of user performance criteria in building sustainability rating tools (BSRTs), and their application to buildings in operation (as opposed to new buildings for which the existing tools are mainly designed).
Following a brief outline of how the more developed building sustainability rating tools incorporate human (internal environmental) factors in their protocols for new buildings, the paper looks specifically at the NZ Green Star BSRT from that point of view. Pioneering developments in the Australian NABERS protocol for existing office buildings in operation, in which an occupant satisfaction survey is specified, are briefly described.
Given the author’s overall aim of effecting an improvement in the performance of existing commercial and institutional buildings from the point of view of the building users, two key issues arise in with respect to such an approach. The first relates to the establishment of an independent and unbiased set of performance benchmarks for users’ perceptions of the buildings in which they work; the second relates to the development of a methodology for incorporating these benchmarks into relevant building sustainability rating tools—these issues are explored. Finally the paper advocates the development of a set of user benchmarks for existing buildings, as a key ingredient in making progress towards a truly sustainable building stock and notes developments in this direction currently under way in New Zealand. Buildings that perform poorly from the users’ point of view are unlikely ever to be sustainable.
2. Incorporation of Consideration of Human Factors into BSRTs for New Buildings
While occupant satisfaction surveys are clearly not directly relevant for BSRTs intended for use at the design stage of a new building, it would be inconceivable for consideration not to be given to human factors–in particular the comfort and health of the occupants. This is indeed the case with all of the well known tools, though there is some variability in the type and number of factors included, the weighting attributed to them, and in the methods of calculating and reporting the resulting ratings.
These aspects have been well reviewed elsewhere, for example by Cole [
10], and will not be detailed here. However, it is worth noting that while several of the more established tools (e.g., BREEAM, LEED, and Green Star Australia) typically sum the weighted scores of individual factors to arrive at an overall rating for a building (the individual factor scores are still reported), tools such CASBEE take a different approach, reporting the ratio of the ‘environmental quality and performance’ to the ‘environmental loadings’ of the building as a rating of its ‘environmental efficiency’, while GBTool displays the ratings for each factor in a set of histograms, but does not attempt an overall building rating.
However, in all cases, human factors of one kind or another make up one of the several (typically six to nine) major sets of factors to be considered. BREEAM, for example has ‘health and wellbeing’, LEED, GBTool, and Green Star Australia all have ‘indoor environmental quality’, though their detailed content differs somewhat, while CASBEE has ‘indoor environment’ as one of its ‘environmental quality and performance’ factors.
In a more recent development, Green Star New Zealand—Office Design Tool [
11] was first released in April 2007 and is to a great extent modeled on its Australian counterpart. It ‘evaluates building projects against eight environmental impact categories [management (10%), indoor environment quality (20%), energy (25%), transport (10%), water (10%), materials (10%), land use and ecology (10%), and emissions (5%)] plus innovation. Within each category points are awarded for initiatives that demonstrate that a project has met the objectives of Green Star NZ and the specific criteria of the relevant rating tool credits. Points are then weighted [in accordance with the above percentages] and an overall score is calculated, determining the project’s Green Star NZ rating’.
As can be seen, the weighting given to Indoor Environment Quality is second only to Energy and double that of any other category. This particular category is broken down into some thirteen ‘credits’ for twelve of which points may be awarded (the remaining credit, which is for meeting the NZ Building Code ventilation criteria, is a mandatory conditional requirement). Some 27 points are on offer in this category: 12 related to ventilation rates and pollutants; five related to thermal comfort and control; eight related to aspects of lighting; and two related to internal noise levels. Also related to the building users, the Management category has two of its 16 points related to the provision of user guides for both building managers and tenant occupants. Clearly, the developers of this tool (remembering that it is for the design stage of new, in this case office, buildings) had the eventual building user very much in mind.
4. The NABERS Indoor Environment Rating Protocol
In a nutshell, this groundbreaking protocol is based on the outcome of two related sets of measurements. One set consists of physical measurements of a range of aspects of the indoor environment. These are thermal comfort (involving temperature, relative humidity, and air movement), air quality (involving CO
2, particulates, formaldehyde, VOCs, and airborne microbial levels), acoustic comfort (ambient sound levels), and lighting (involving task illuminance and lighting uniformity). The NABERS Indoor Environment Validation Protocol [
18] details how these measurements are to be taken.
The other set involves conducting a questionnaire survey of the building occupants in which they are asked to rate a wide range of environmental and related aspects of the building on a 7-point scale. Two survey methods, both well established and reliable, have been approved for use in this protocol. One developed by Building Use Studies (BUS) [
19] of York in the UK, the other by the Center for the Built Environment (CBE) [
20] at the University of California, Berkeley, USA (see later).
The rating may be applied to what are defined as the ‘base-building’, a ‘tenancy’, or the ‘whole-building’, the choice depending on whom has direct control of the indoor environment—a building manager, a tenant, or an owner-occupier.
Up to five indoor environmental parameters are considered—thermal comfort, air quality, acoustic comfort, lighting, and office layout. While all five are included in a whole-building rating, only the first three are involved in a base-building rating, and the last four in a tenant rating, as indicated in
Table 1.
Table 1.
The NABERS protocol.
Table 1.
The NABERS protocol.
| Parameters and Relative Weightings (Whole Building only) | Whole Building | Tenancy only | Base Building |
|---|
| Thermal Comfort (30%) | P (15pts) + S (15pts) | | P (15pts) |
| Air Quality (20%) | P (15pts) + S (15pts) | P (15pts) + S (15pts) | P (15pts) |
| Acoustic Comfort (20%) | P (15pts) + S (15pts) | P (15pts) + S (15pts) | P (15pts) |
| Lighting (10%) | P (15pts) + S (15pts) | P (15pts) + S (15pts) | |
| Office Layout (20%) | S (30pts) | S (30pts) | |
In the case of the base-building, the three parameters (thermal comfort, air quality, and acoustic comfort) are scored out of 15, based solely on physical measurements. In the case of the whole-building and tenant ratings on the other hand, the physical measurements and the questionnaire survey results for thermal comfort, air quality, acoustic comfort, and lighting (as appropriate) are each scored out of 15 and then summed out of 30–the office layout parameter is also scored out of 30, but based solely on the questionnaire. The score awarded for each of the surveyed parameters relates directly to the percentage of respondents satisfied/dissatisfied. For example, if a tenancy reported 50% dissatisfied with acoustic quality or noise overall in the office, they would score 7 out of 15 for acoustic comfort on the NABERS assessment.
Weightings are then applied to each of the relevant parameter scores. In the case of the whole-building rating, for example, the weightings are as follows, as shown in
Table 1: thermal comfort 30%; air quality 20%; acoustic comfort 20%; lighting 10%; and office layout 20%. For tenancy only the weightings are as follows: air quality 25%; acoustic comfort 25%; lighting 15%; and office layout 35%—while for the base building the following are applicable: thermal comfort 40%; air quality 40%; acoustic comfort 20%. The weightings are “based on the environmental significance of each indoor environmental parameter and the power to control it” [
21].
5. The Questionnaire Surveys
Of particular interest here is the nature and reliability of the BUS and CBE questionnaire surveys that have been specified as meeting the requirements of the NABERS protocol. According to Palmer [
22] ‘For the more subjective parameters, such as occupant satisfaction and amenity, it is more difficult to benchmark unless a consistent methodology and technique have been used’. ‘The study [of human factors] should be rigorous and evidence based’. It will be self-evident that ‘simple anecdotal information can be misleading and even dangerous if due regard is not given to subjectivity or bias’.
5.1. The Building Use Studies Questionnaire
This questionnaire has evolved over several decades, from a 16-page format used for the investigation of sick building syndrome in the UK in the 1980s, to a more succinct 2-page hard copy version that can fit readily onto both sides of an A4 sheet or be administered via the web. Developed by Building Use Studies for use in the Probe investigations [
23], it is available under license to other investigators. The sixty or so questions cover a range of issues. Fifteen of these elicit background information on matters such as the age and sex of the respondent, how long they normally spend in the building, and whether or not they see personal control of their environmental conditions as important. However, the vast majority ask the respondent to score some aspect of the building on a 7-point scale; typically from ‘unsatisfactory’ to ‘satisfactory’ or ‘uncomfortable’ to ‘comfortable’, where a ‘7’ would be the best score.
The following aspects are covered: Operational–space needs, furniture, cleaning, meeting room availability, storage arrangements, facilities, and image; Environmental—temperature and air quality in different climatic seasons, lighting, noise, and comfort overall; Personal Control—of heating, cooling, ventilation, lighting, and noise; and Satisfaction–design, needs, productivity, and health.
Analysis of the responses yields the mean value (on a 7-point scale) and the distribution for each variable. In addition to calculating these mean values, the analysis also enables the computation of a number of ratings and indices in an attempt to provide indicators of particular aspects of the performance of the building or of its ‘overall’ performance. The method of calculating these overall indices and ratings is made completely transparent in the BUS analysis output documents.
Figure 1.
BUS Methodology–Screenshot of the overall variables summary for a case study building (courtesy of BUS).
Figure 1.
BUS Methodology–Screenshot of the overall variables summary for a case study building (courtesy of BUS).
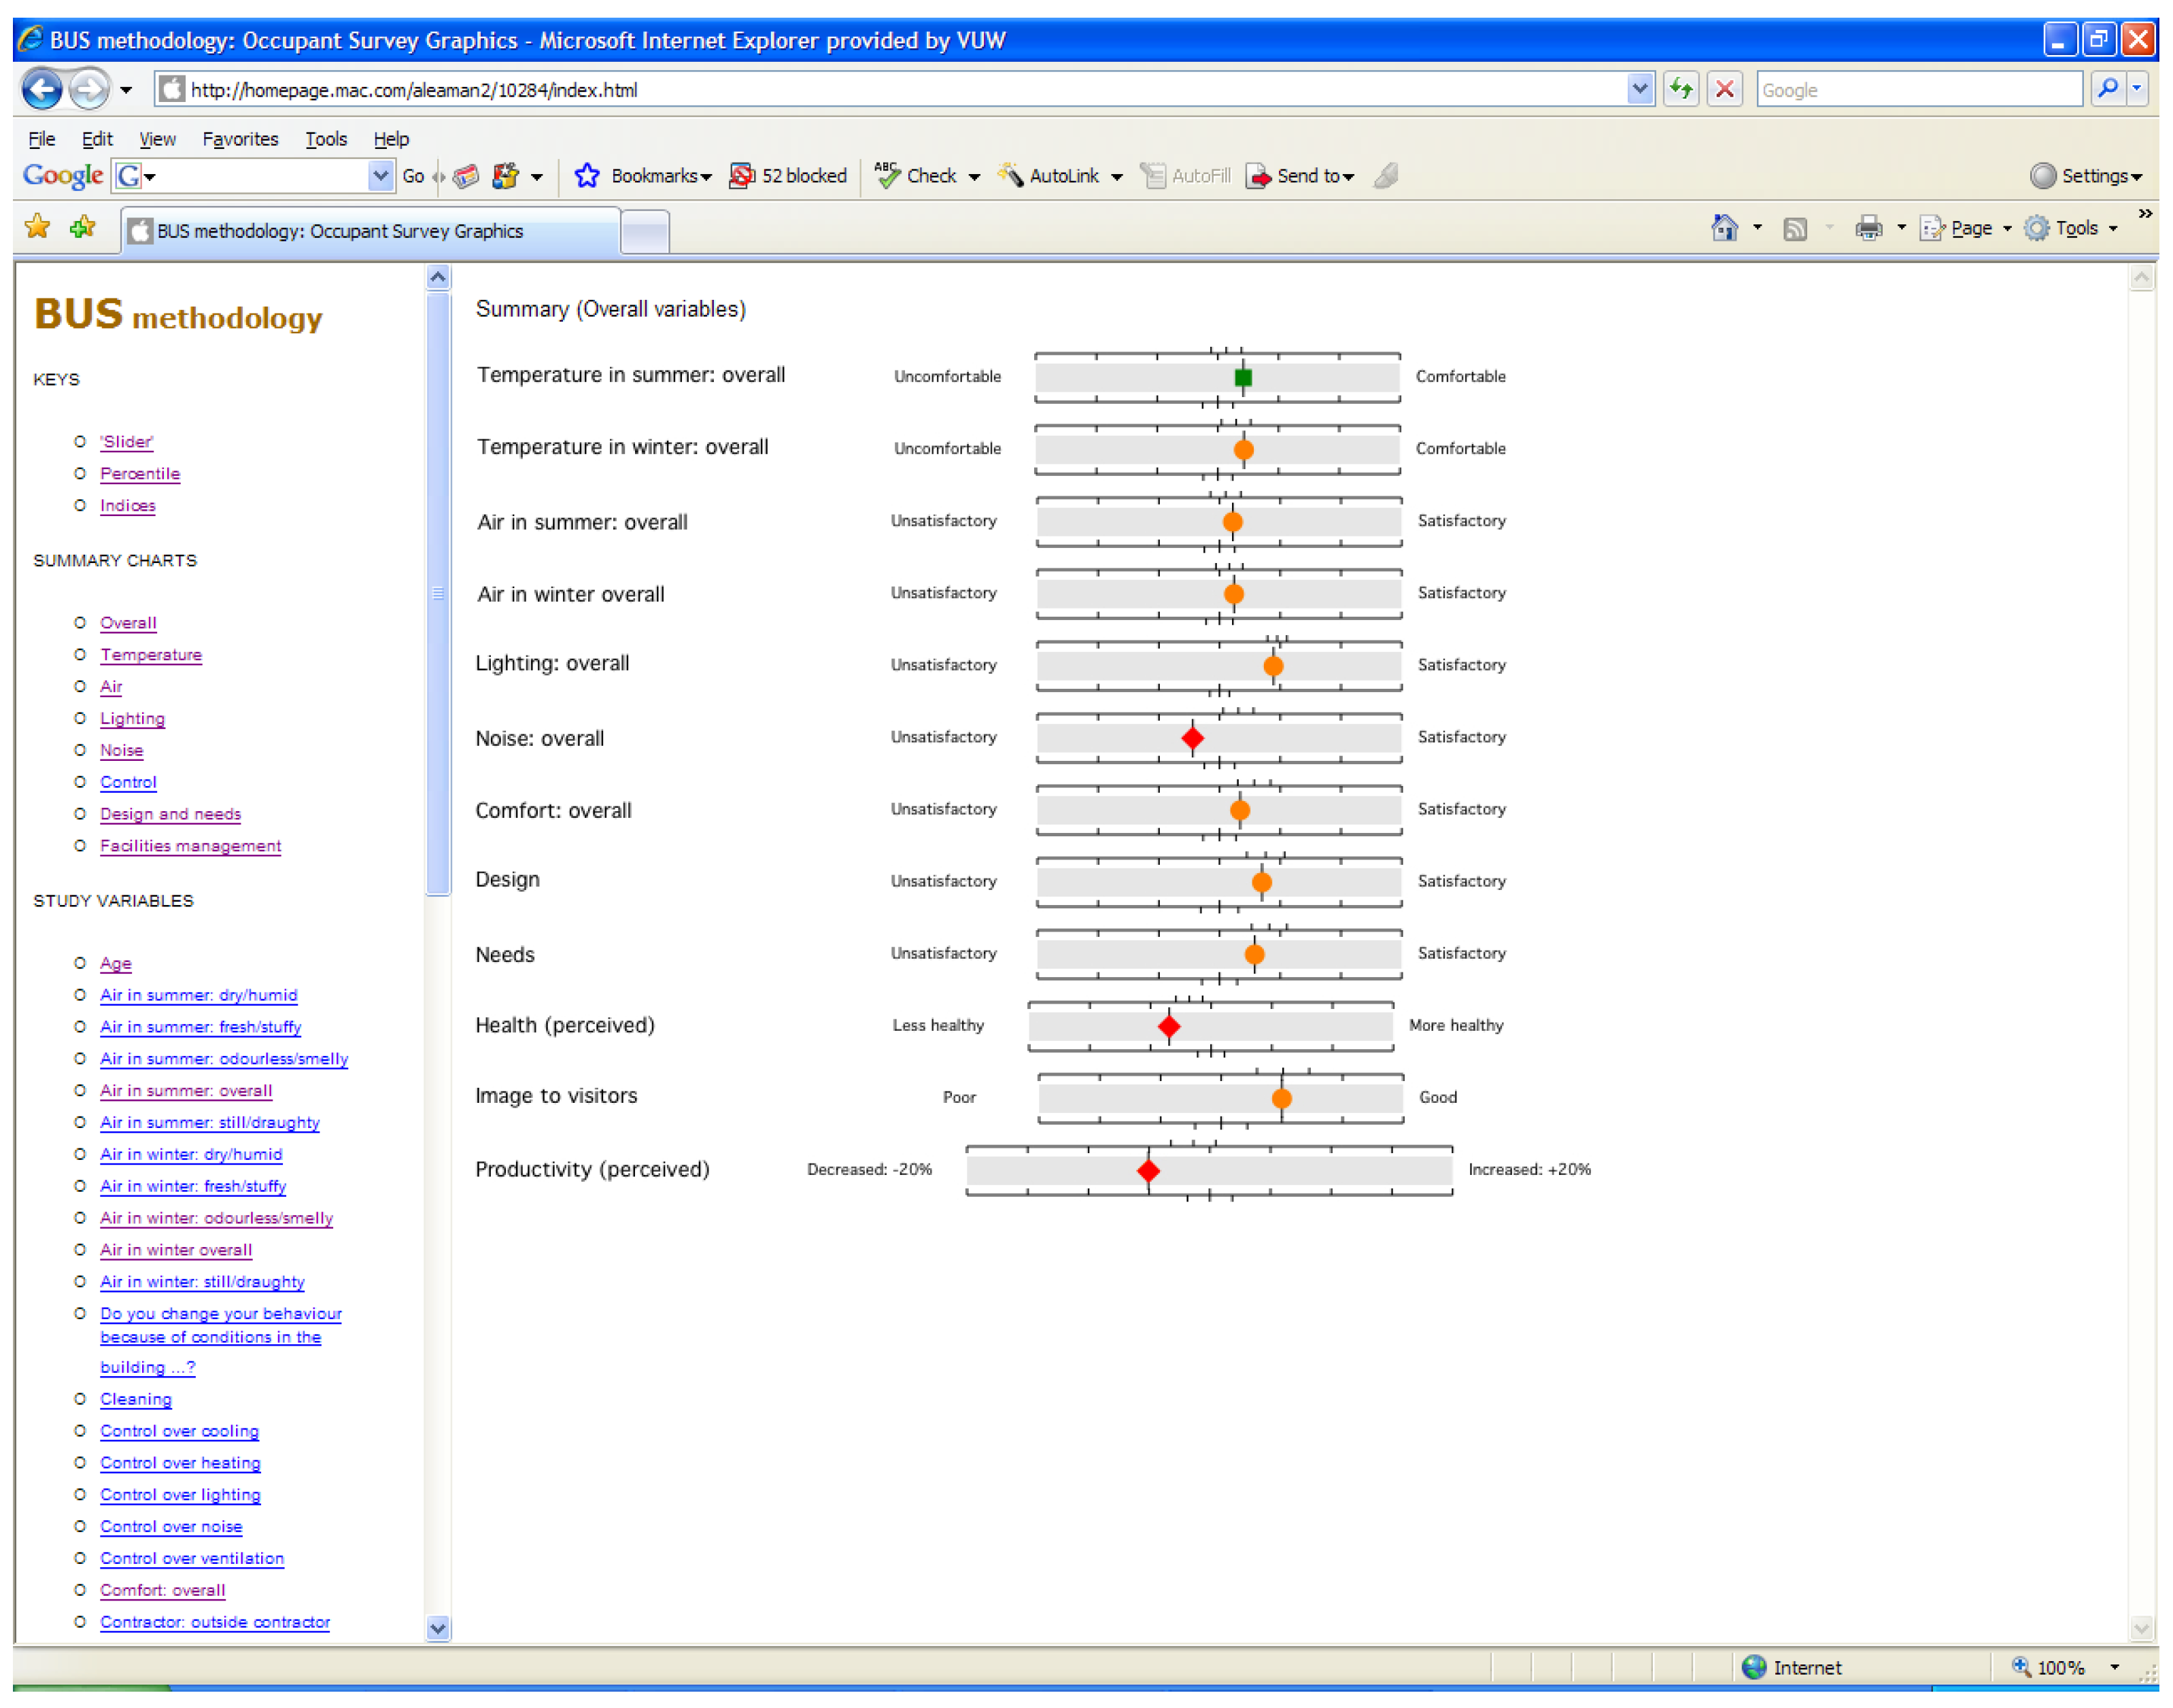
Figure 1 is a screen-shot of the overall summary results for a case study office building for twelve key variables. A green square indicates a variable with an average score better than both the scale mid-point and the corresponding benchmark–in this instance only
temperature-in-summer-overall makes it into that category. An amber circle denotes an average score which is typically better than the mid-point of the scale, but not significantly different from the benchmark for that variable–eight of the variables are in that category in this instance. A red diamond indicates an average score that is lower than both the mid-point of the scale and the corresponding benchmark–
noise overall, health and
productivity for this particular case.
Figure 2.
BUS Methodology–example of a ‘green’ variable–temperature-in-summer-overall (courtesy of BUS).
Figure 2.
BUS Methodology–example of a ‘green’ variable–temperature-in-summer-overall (courtesy of BUS).
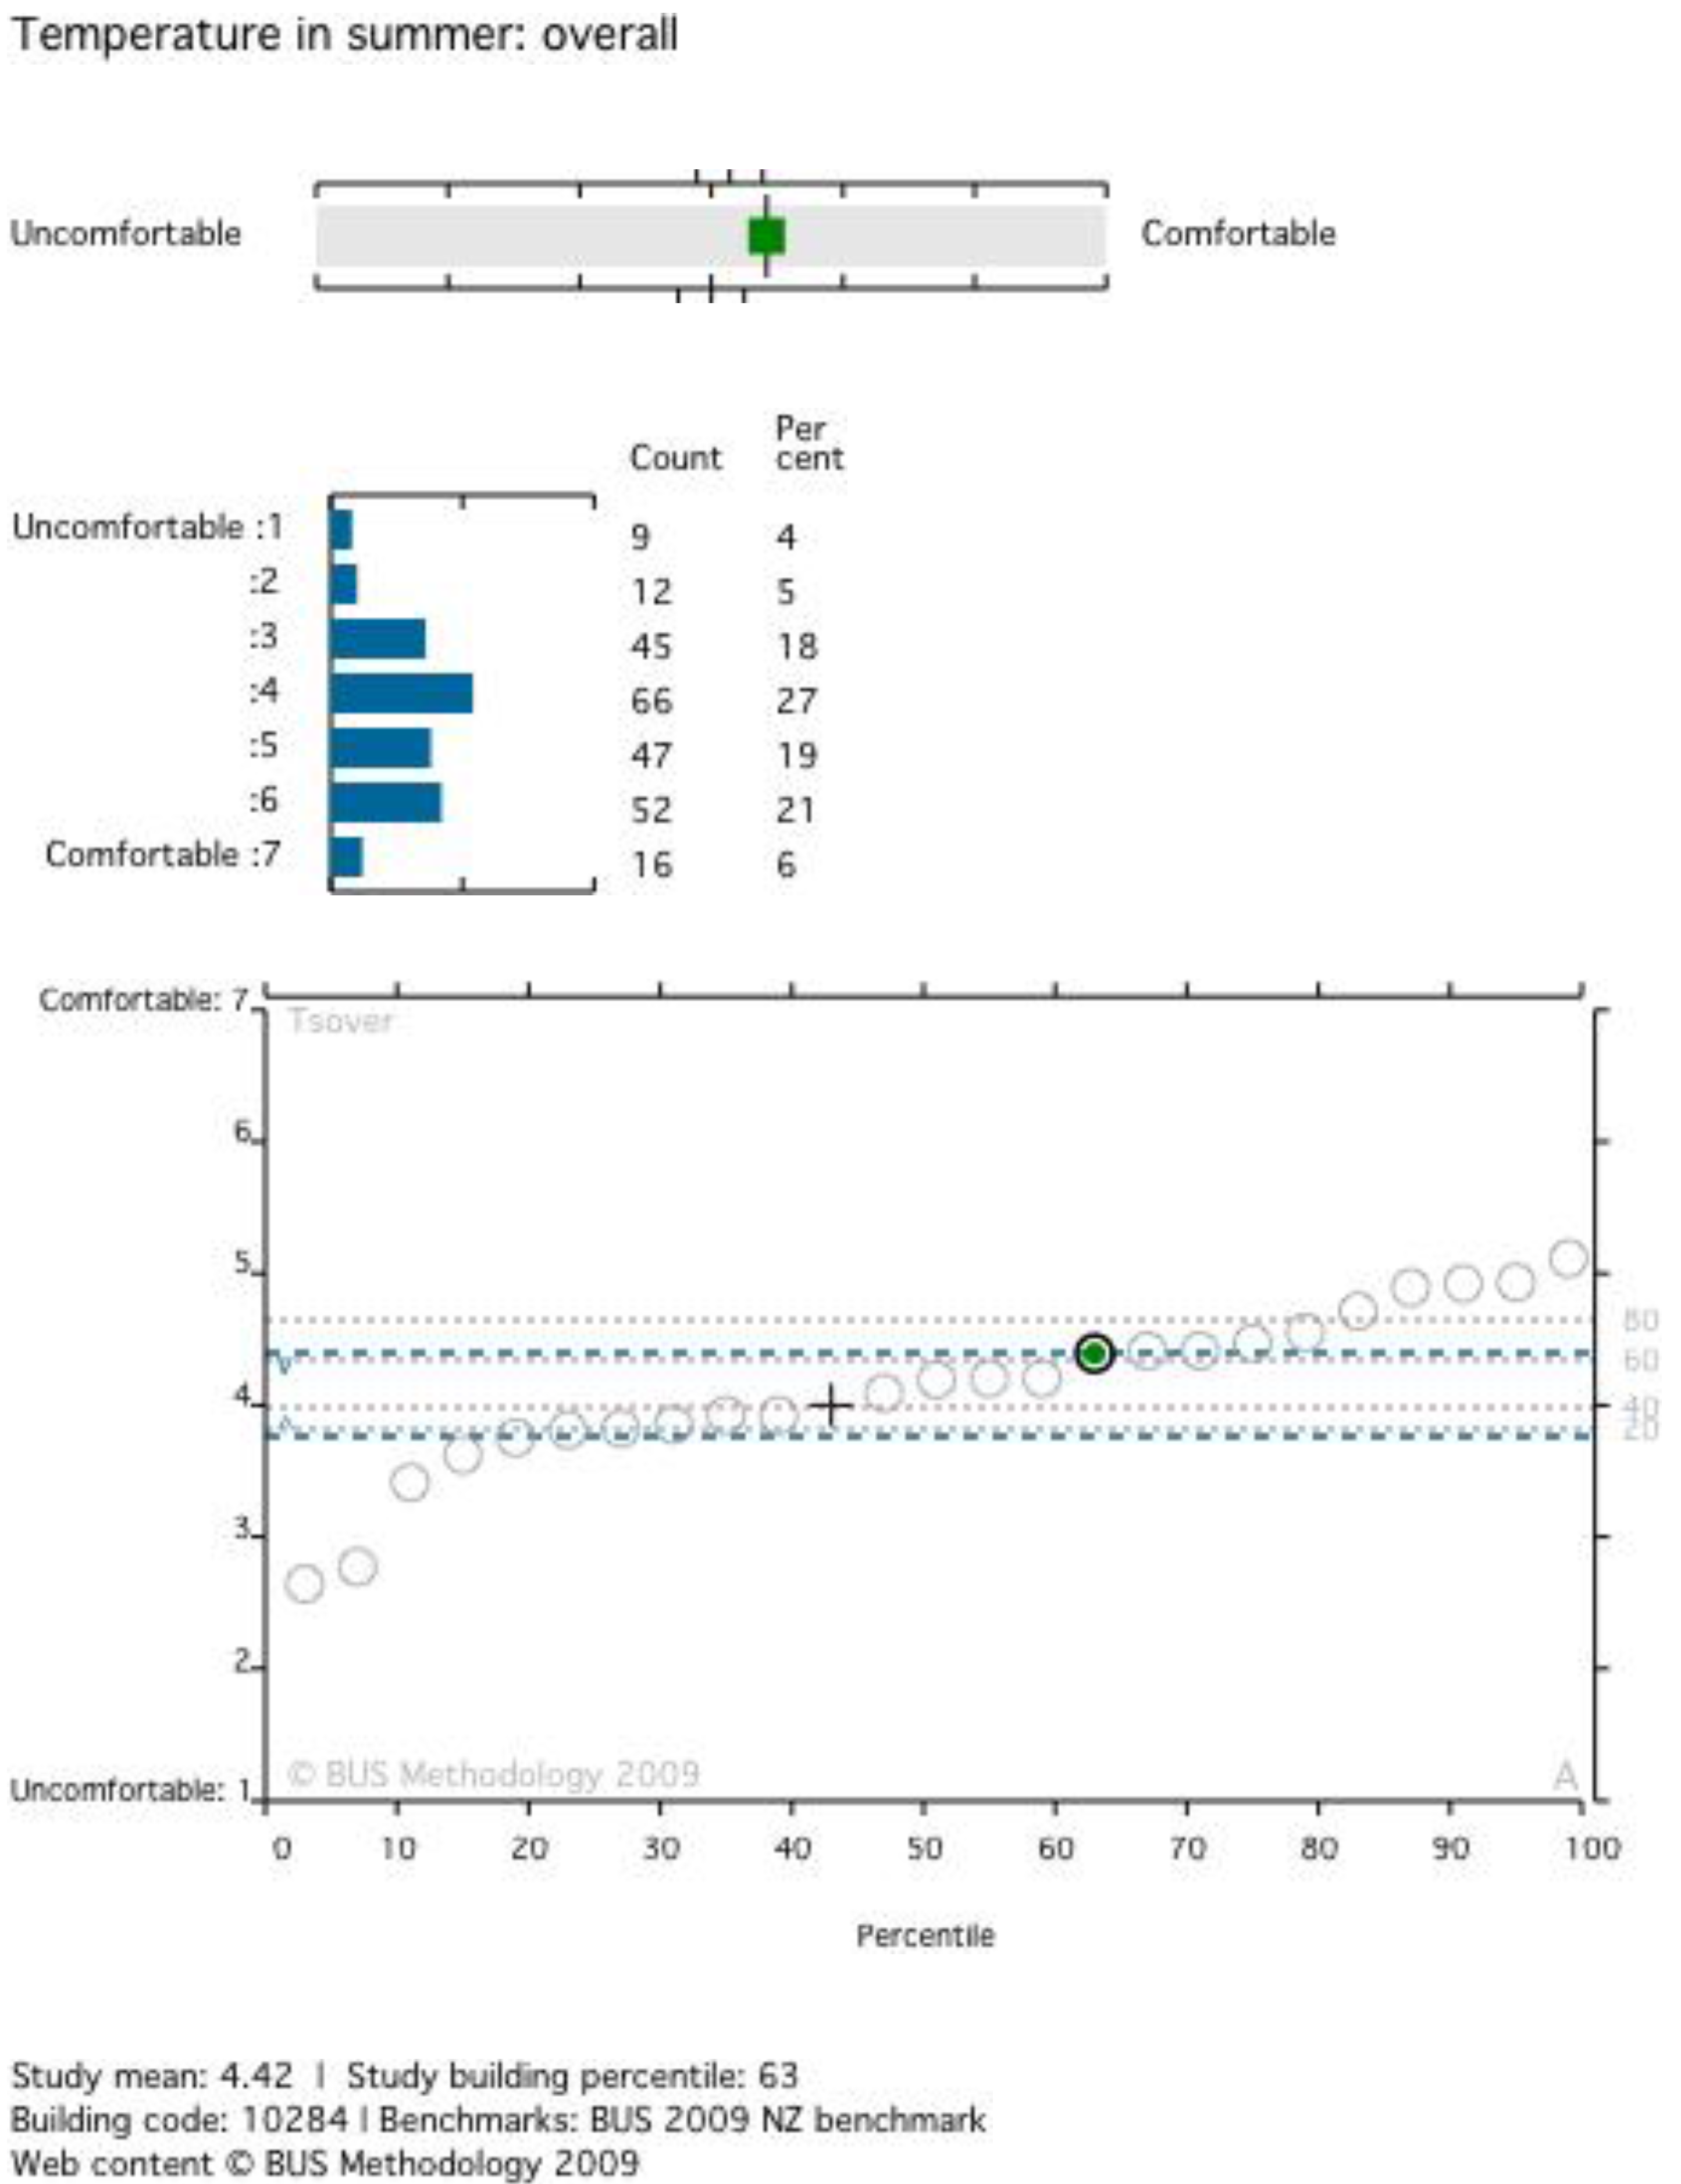
Figure 2,
Figure 3 and
Figure 4 present typical sets of results for the same case study building. These illustrate the analyses that result in a particular variable being designated green, amber, or red. In the case of
temperature-in-summer-overall (see
Figure 2), as noted earlier, the green square indicates that it scored better than the benchmark and significantly higher than the scale mid-point of 4.00 (the actual score was 4.42). The numbers and percentages of respondents selecting a particular point on the 7-point scale are noted, and a histogram corresponding to these is also presented. The lower graph plots the ‘position’ of the building (the circle highlit in green), with respect to this variable, in relation to the other 23 buildings in this particular database. The cross is the mid-point of the scale (4.00 in this instance), while the dotted blue lines represent the upper and lower bounds of the benchmark. The building is on the 63rd percentile and just above the upper bound of the benchmark for this variable.
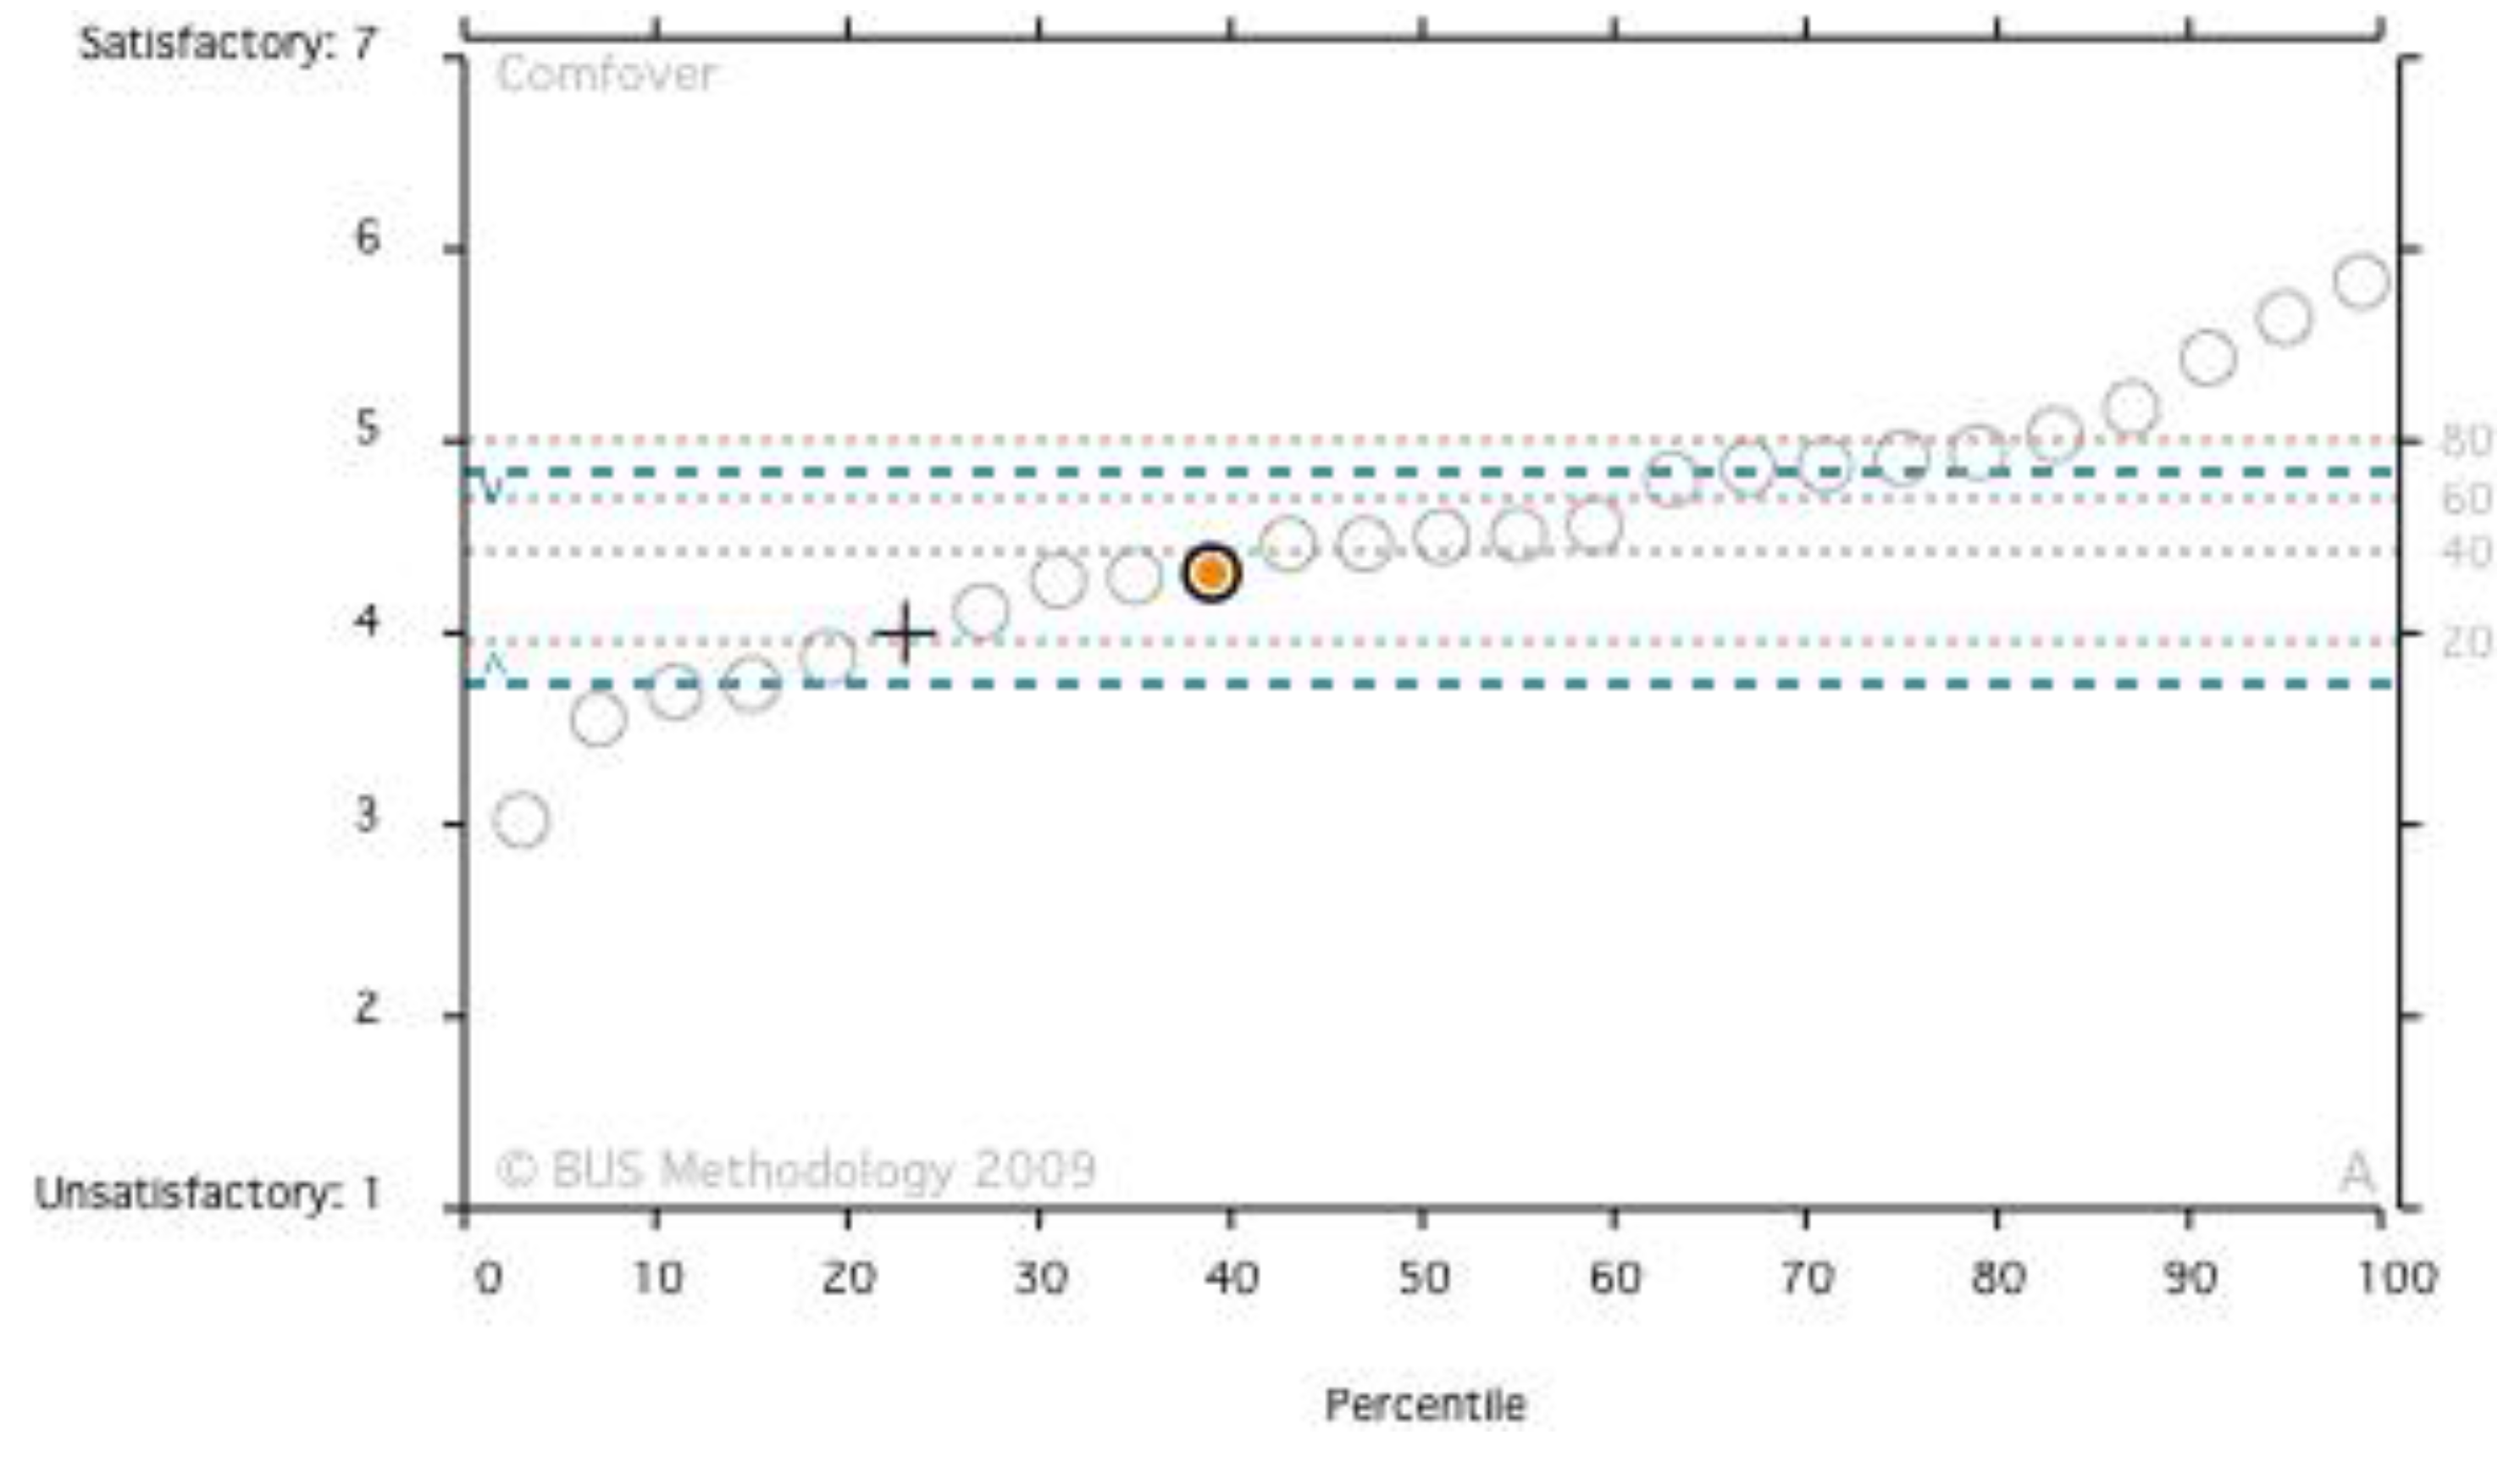
In the case of the variable
comfort overall (see
Figure 3) the average score was 4.34, well above the scale mid-point value of 4.00. Nevertheless, it is within the bounds of the benchmark band, but only reaches the 39th percentile of this set of buildings.
Figure 3.
BUS Methodology example of an ‘amber’ variable–comfort overall (courtesy of BUS).
Figure 3.
BUS Methodology example of an ‘amber’ variable–comfort overall (courtesy of BUS).
Figure 4.
BUS Methodology–example of a ‘red’ variable–noise overall (courtesy of BUS).
Figure 4.
BUS Methodology–example of a ‘red’ variable–noise overall (courtesy of BUS).
In the case of the variable
noise overall (see
Figure 4) the average score was 3.56, well under the scale mid-point value of 4.00 and well below the lower limit of the benchmark band, in this instance only reaching the 19th percentile of this set of buildings and earning a ‘red’.
5.2. The Center for the Built Environment Questionnaire
In use since 1996, this questionnaire was designed from the start as a web-based instrument. Like the BUS questionnaire, it utilizes 7-point scales mainly, though in this case a –3 to +3 range is used where +3 would be the best score. Nevertheless, this does open up the possibility of comparison between buildings evaluated by the two methods where the questions are of a similar nature, and has enabled the developers of NABERS to give users a choice.
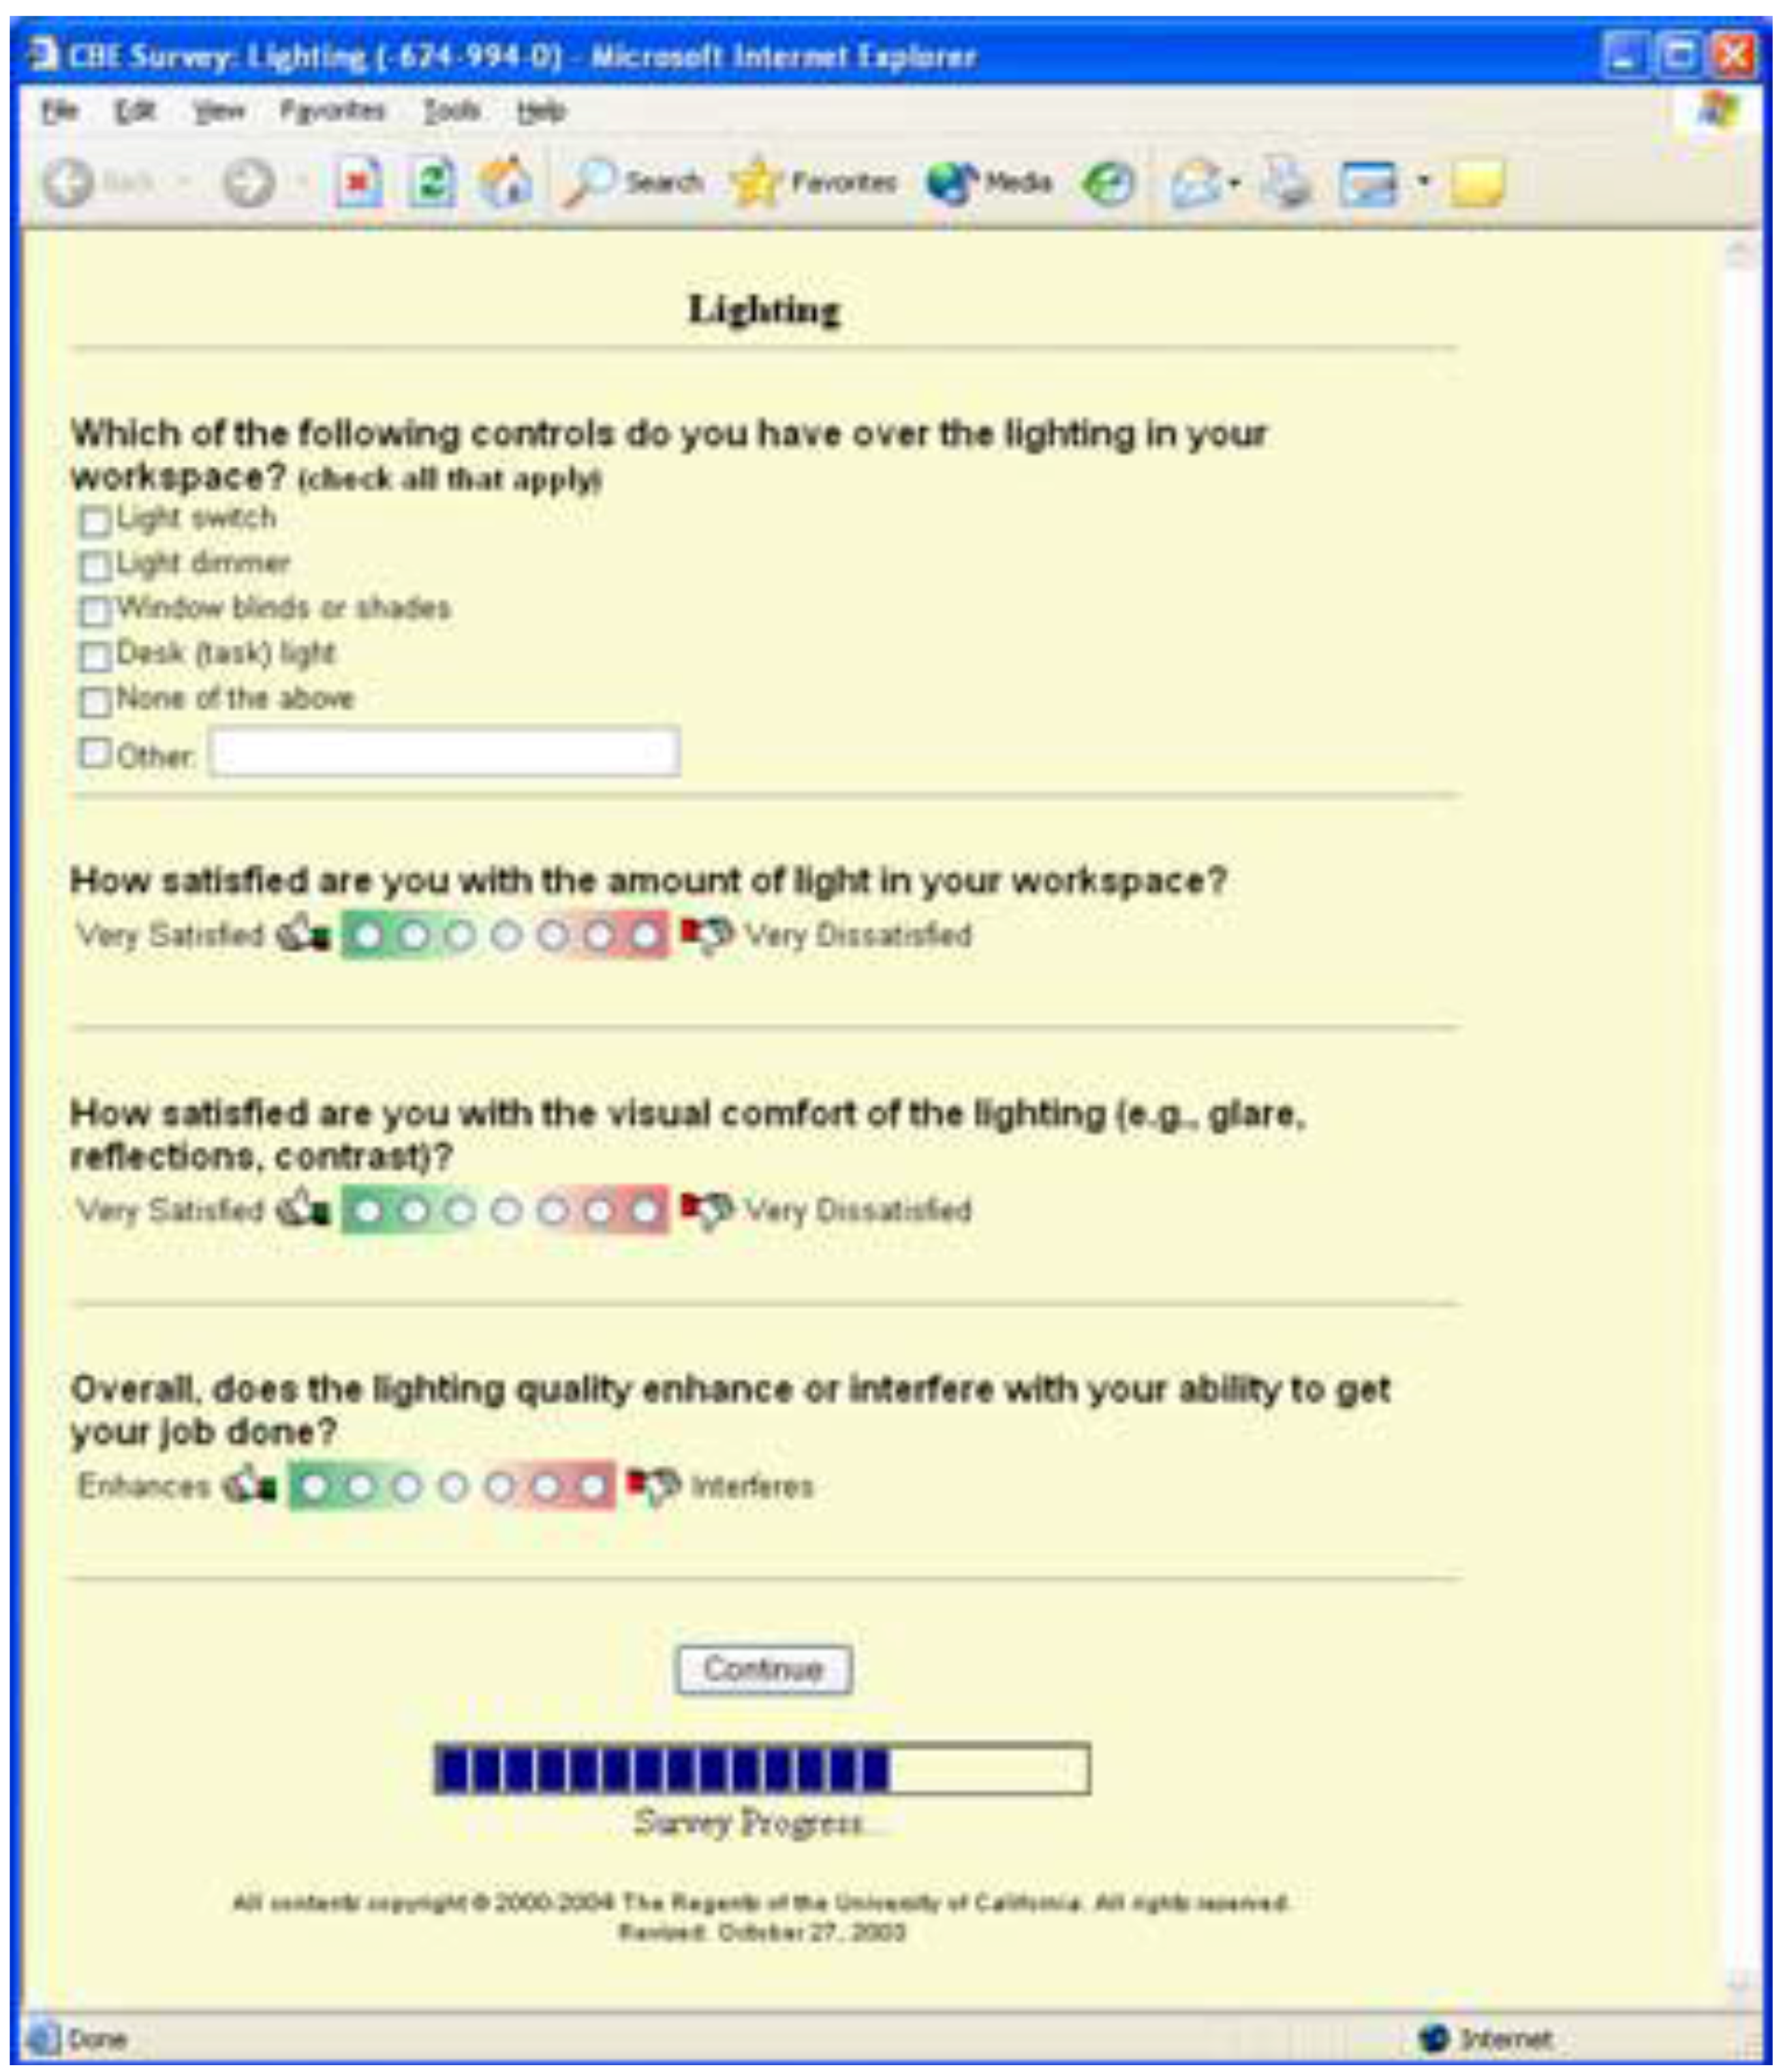
In this case, as well as the usual demographic information, the standard questionnaire covers the following seven general areas–thermal comfort, air quality, acoustics, lighting, cleanliness, spatial layout, and office furnishings. As indicated in
Figure 5 for the case of
lighting, each of these areas includes several questions, but two are common to all seven.
Figure 5.
CBE Methodology–Screenshot showing the layout of a typical set of questions–in this case the basic lighting questions (courtesy of CBE).
Figure 5.
CBE Methodology–Screenshot showing the layout of a typical set of questions–in this case the basic lighting questions (courtesy of CBE).
One of these asks ‘How satisfied are you with …… [whatever factor is under scrutiny]…...?’ on a 7-point scale ranging from ‘very satisfied’ to ‘very dissatisfied’ [
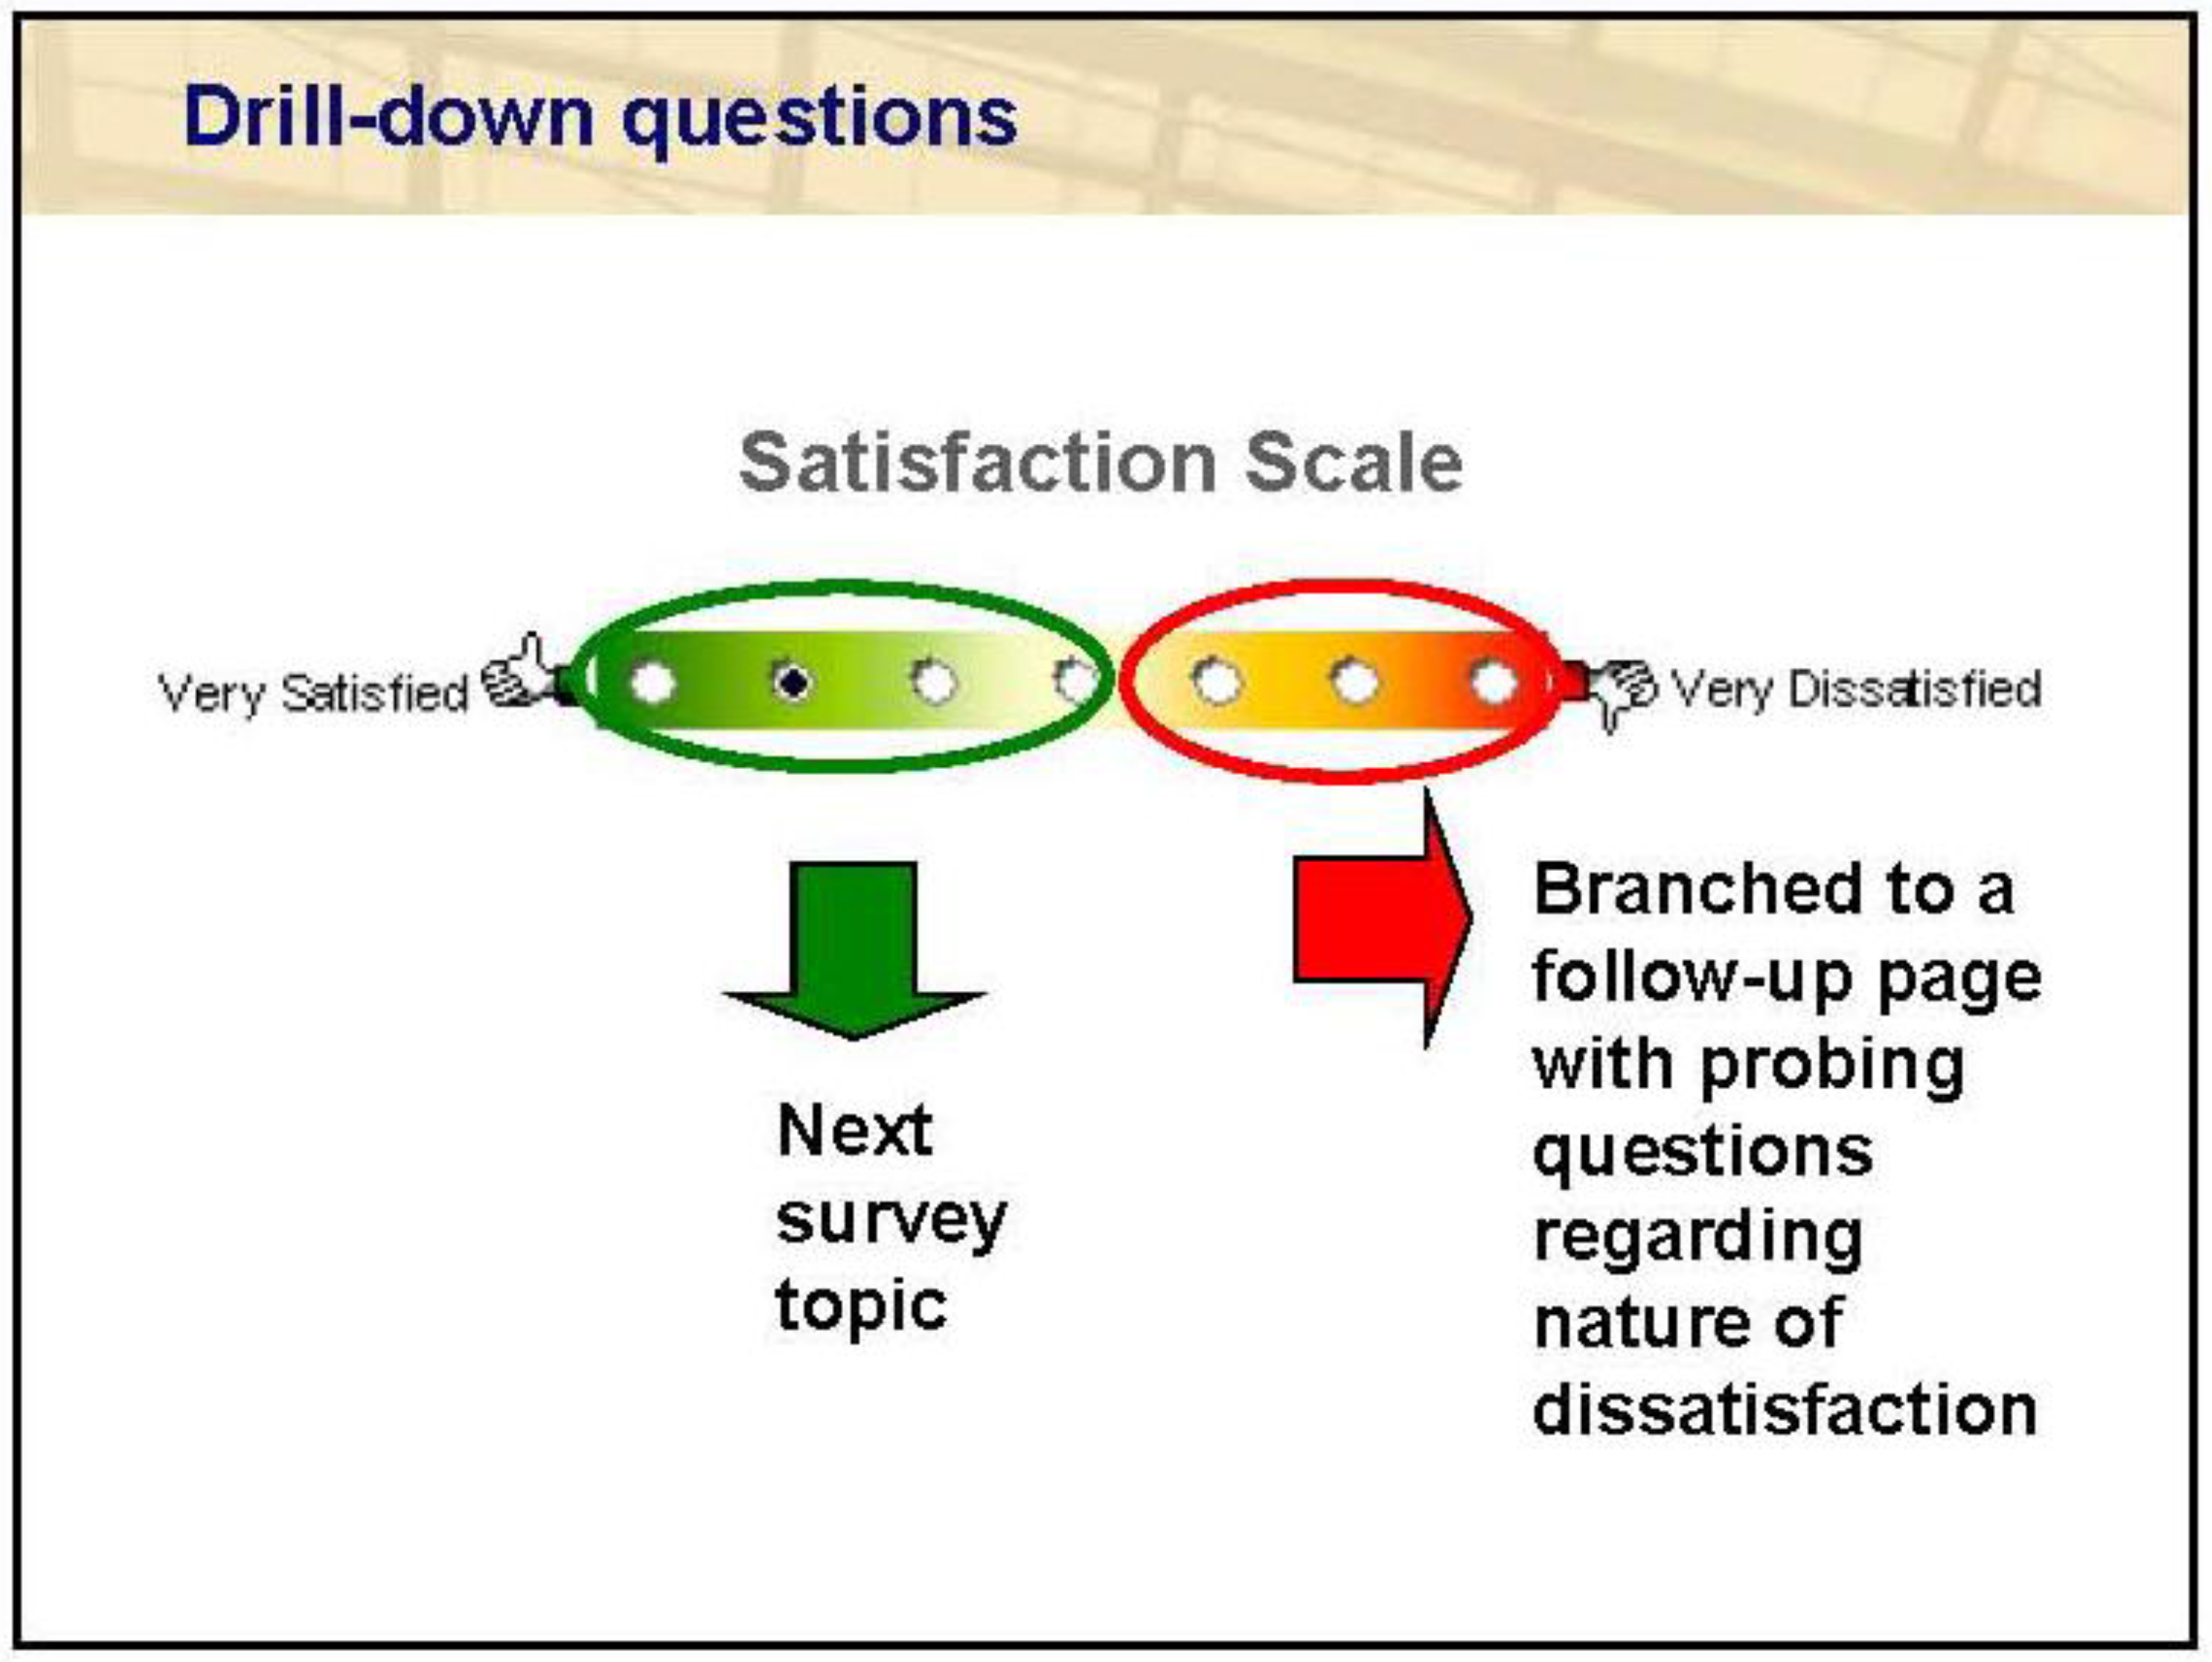
24]. The other asks ‘Overall, does the [factor under scrutiny] …. enhance or interfere with your ability to get your job done?’ on a 7-point scale, this time ranging from ‘enhances’ to ‘interferes’. Where dissatisfaction is indicated, the questionnaire branches to a further set of questions aimed at diagnosing the reasons for the dissatisfaction, as indicated in
Figure 6.
Figure 6.
CBE Methodology—Showing the principle underlying the layout of the questionnaire (courtesy of CBE).
Figure 6.
CBE Methodology—Showing the principle underlying the layout of the questionnaire (courtesy of CBE).
Generally speaking, according to Jensen
et al. [
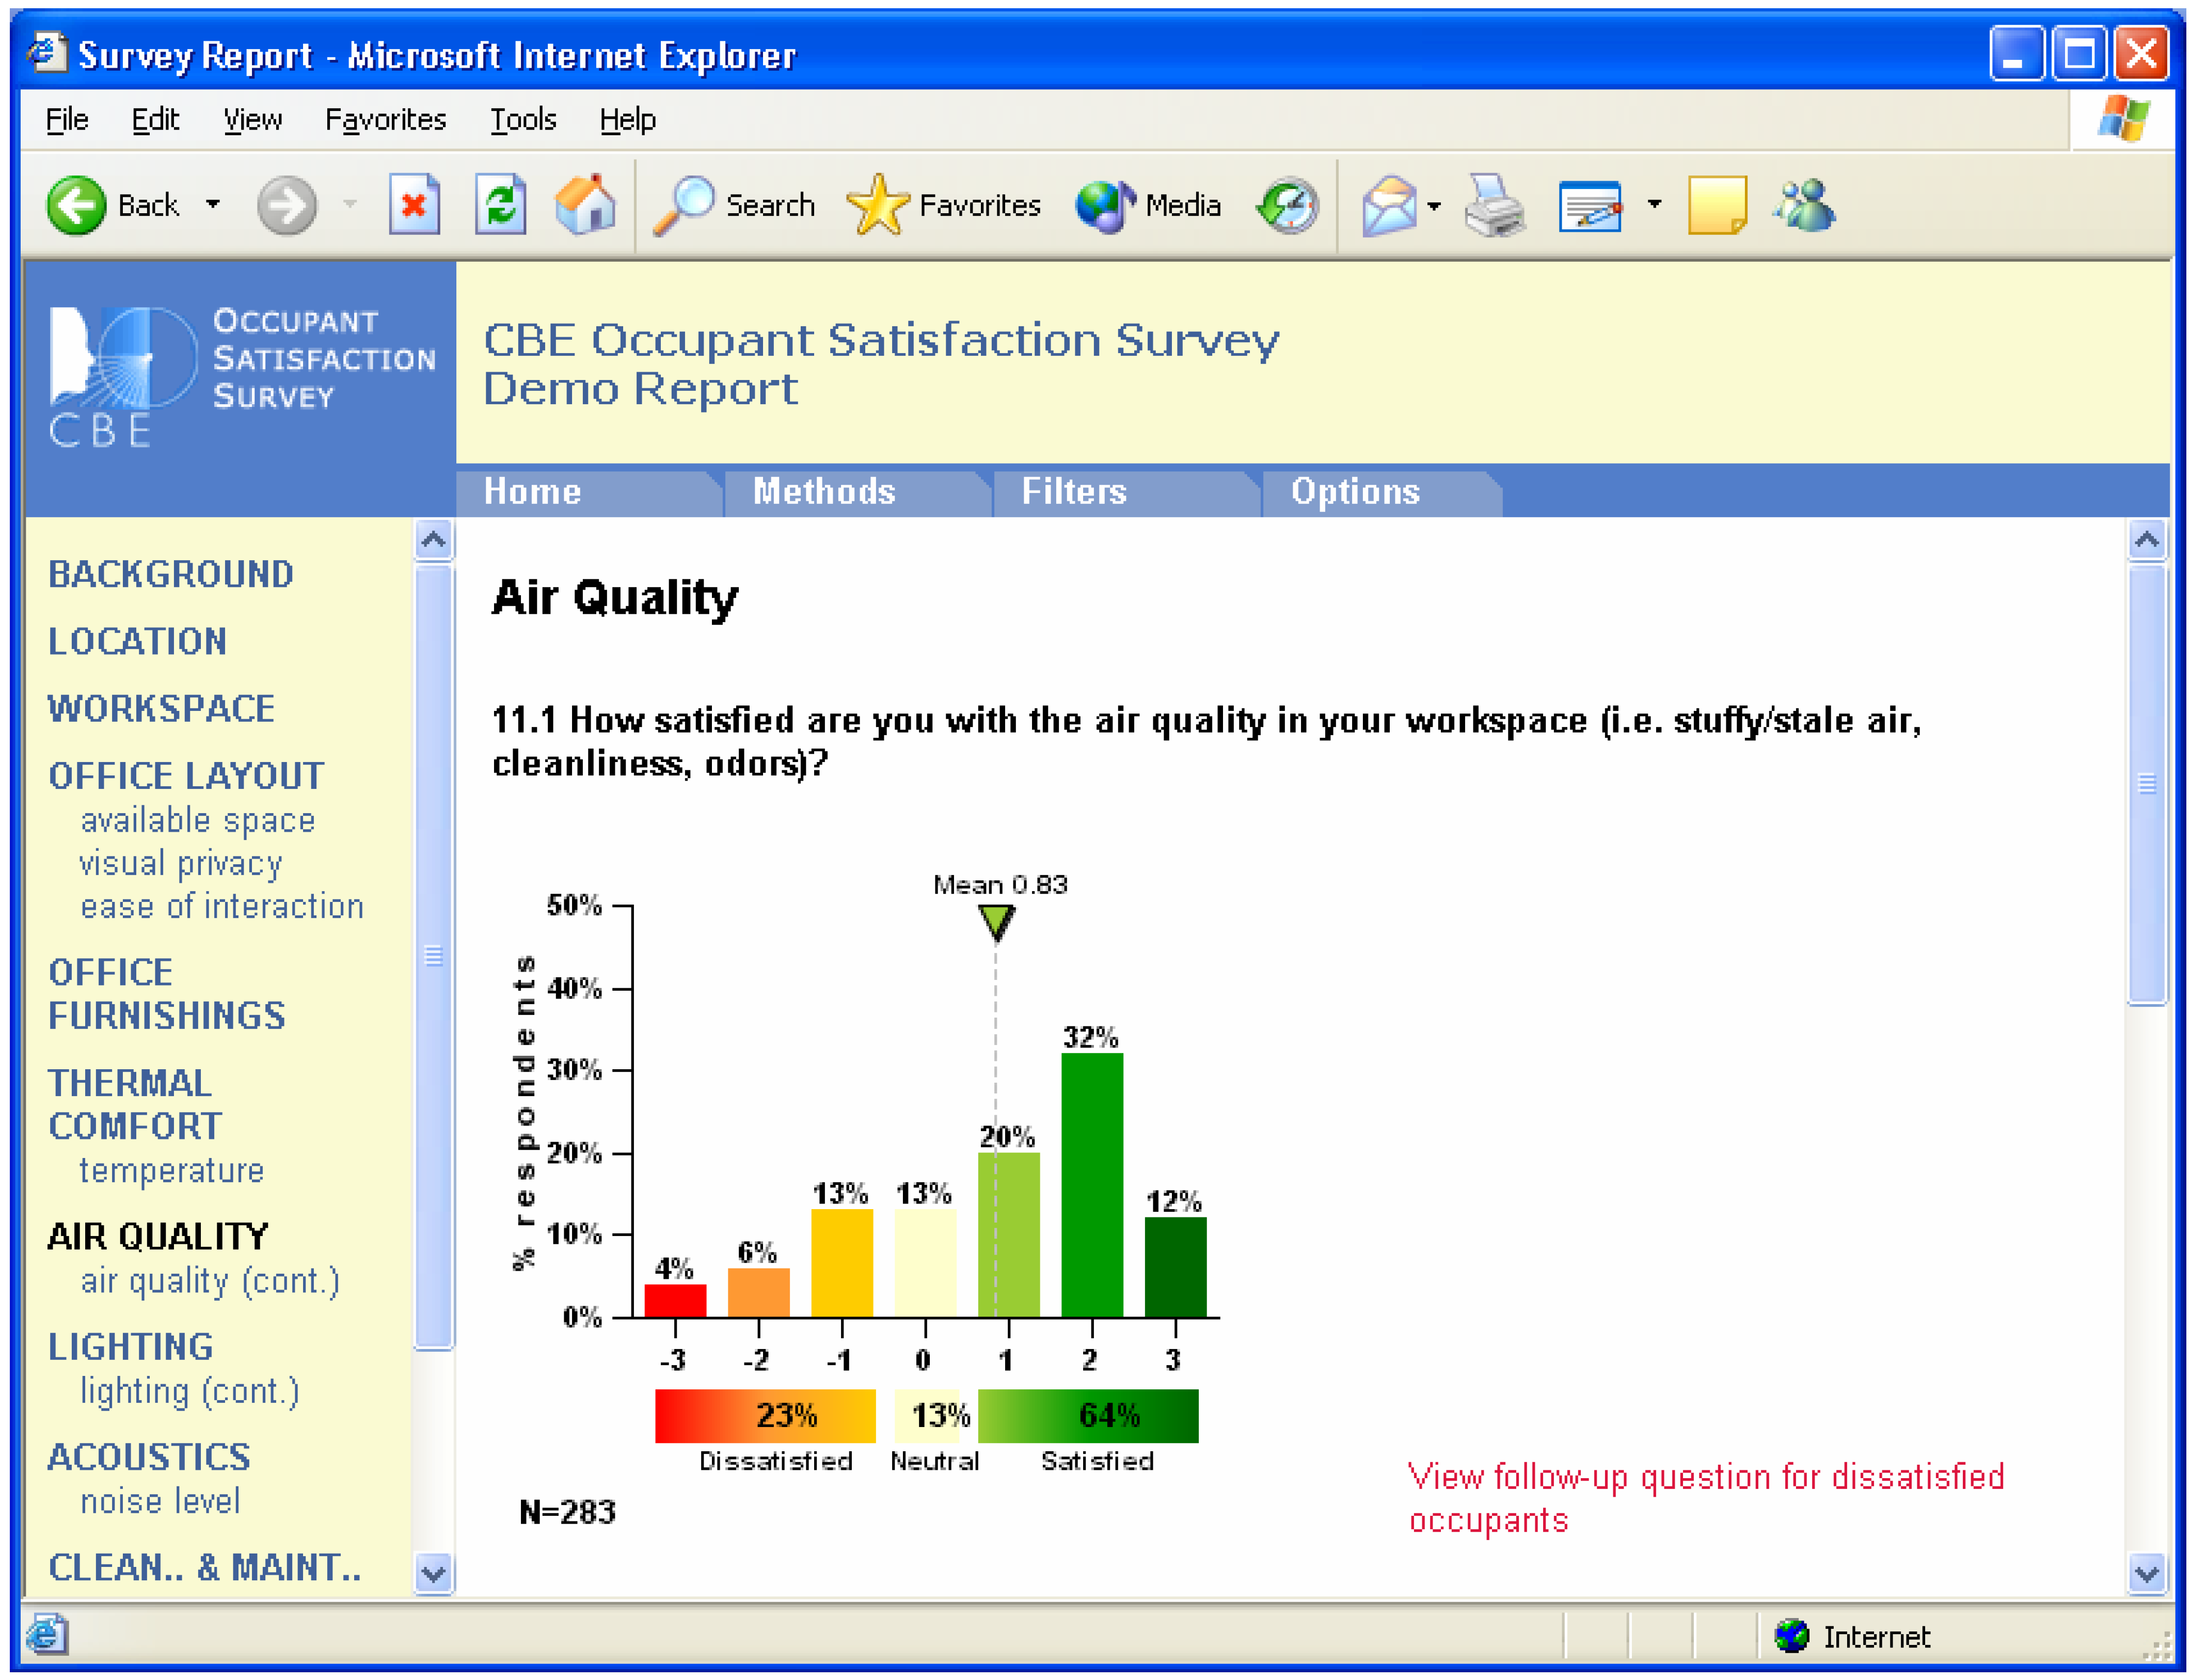
25] analysis of the resulting data produces information on the mean score and its distribution for each variable, together with a report on its effect on the occupants’ ability to ‘get the job done’. The screenshot reproduced as
Figure 7 is an example of such an analysis for, in this case,
air quality. In addition, as noted by Huizenga
et al. [
26], ‘a satisfaction score for the whole building is calculated as the mean satisfaction vote of the occupants of that building’. Comparison with the entire database is an integral part of the analysis and reporting procedure.
Figure 7.
CBE Methodology—Screenshot of a typical analysis output (courtesy of CBE).
Figure 7.
CBE Methodology—Screenshot of a typical analysis output (courtesy of CBE).
6. Establishing User Benchmarks
As we build up more and more comparative examples of the performance of different buildings against individual indicators, it is possible to say not only how well a building performs on a yardstick, but also how well it performs in detail in relation to other comparable buildings. It is by comparing buildings in this way that performance “benchmarks” evolve on which standards and targets can be set. In other words, a benchmark is nothing more than a point on a yardstick …. Roaf [
27].
Both the BUS and the CBE questionnaires have been kept consistent over many years, thus enabling reliable benchmarking and trend analysis. The BUS questionnaire has been used mainly in the UK, Australia, New Zealand and Canada, the CBE questionnaire in the USA and Canada predominantly.
6.1. Building Use Studies
In the case of the BUS questionnaire, a benchmark (copyright BUS) is assigned each of the 45 or so factors on its 7-point scale. At any given time, these benchmarks are simply the mean of the scores for each individual factor, averaged over the most recent set of buildings entered into the relevant BUS database (in the case of the UK, for example a set of the most recent 50 buildings is used). As such, each benchmark score may be expected to change over time as newly surveyed buildings are added and older ones withdrawn. Nevertheless none of them was observed to have changed dramatically over the seven years or so during which the author has used this survey instrument.
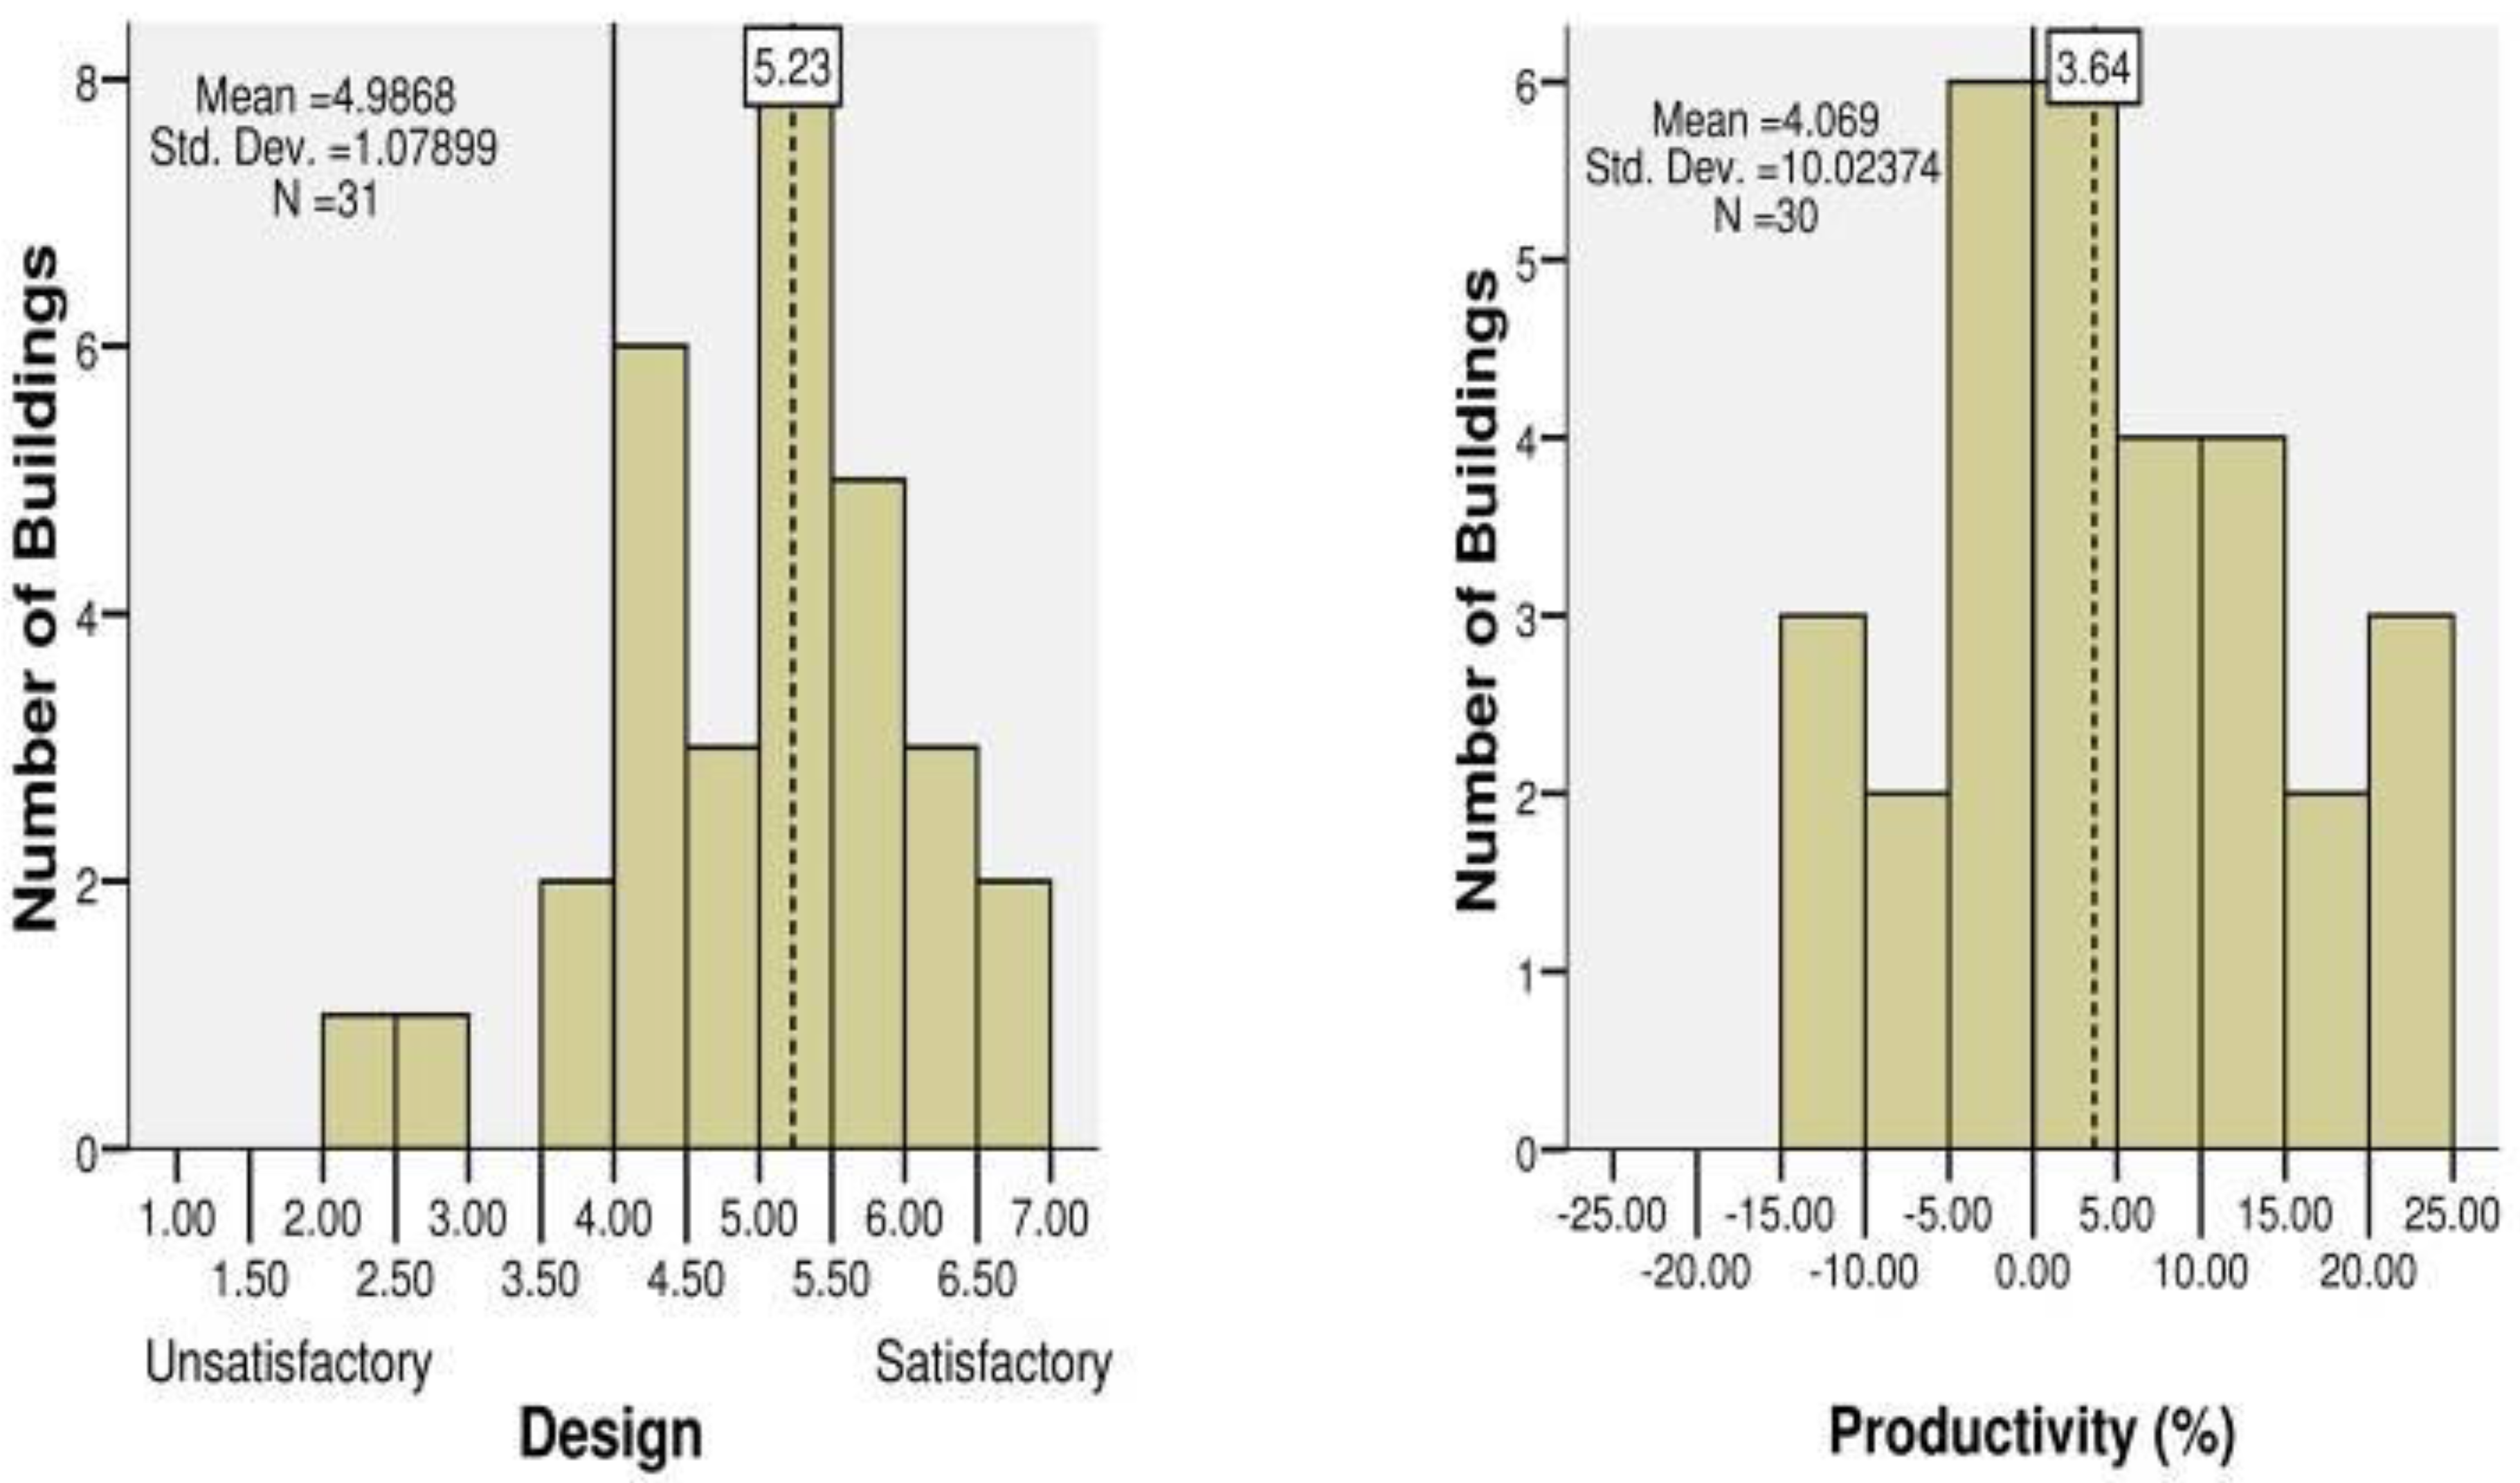
In terms of its sensitivity, despite the sometimes expressed fears that a scale of this type will tend to elicit responses around the ‘neutral’ point (4 in the BUS case) the distribution of average building scores was observed by Baird [
28] to be wide ranging, from as low as 1.5 to over 6.5. In the case of recently surveyed set of sustainable buildings, some 41.5 per cent of the nearly 1,400 scores (31 buildings by 45 factors) were ‘better’ than the corresponding benchmark at the time of analysis, 35.9 per cent were close to the benchmark figure, and some 22.6 per cent turned out ‘worse’.
Figure 8 indicates the wide range of average scores found for the
design and
productivity variables in that set of 30 buildings.
Figure 8.
Examples of the range of average scores obtained during the author’s worldwide survey of sustainable buildings using the BUS questionnaire.
Figure 8.
Examples of the range of average scores obtained during the author’s worldwide survey of sustainable buildings using the BUS questionnaire.
At the time of writing, the BUS database has separate benchmarks for the UK, Australia, and New Zealand buildings, plus one for International Sustainable buildings.
6.2. Center for the Built Environment
In a similar way to the BUS methodology, the CBE averages the individual building scores to develop benchmarks relevant to each of the factors surveyed. Zagreus
et al. [
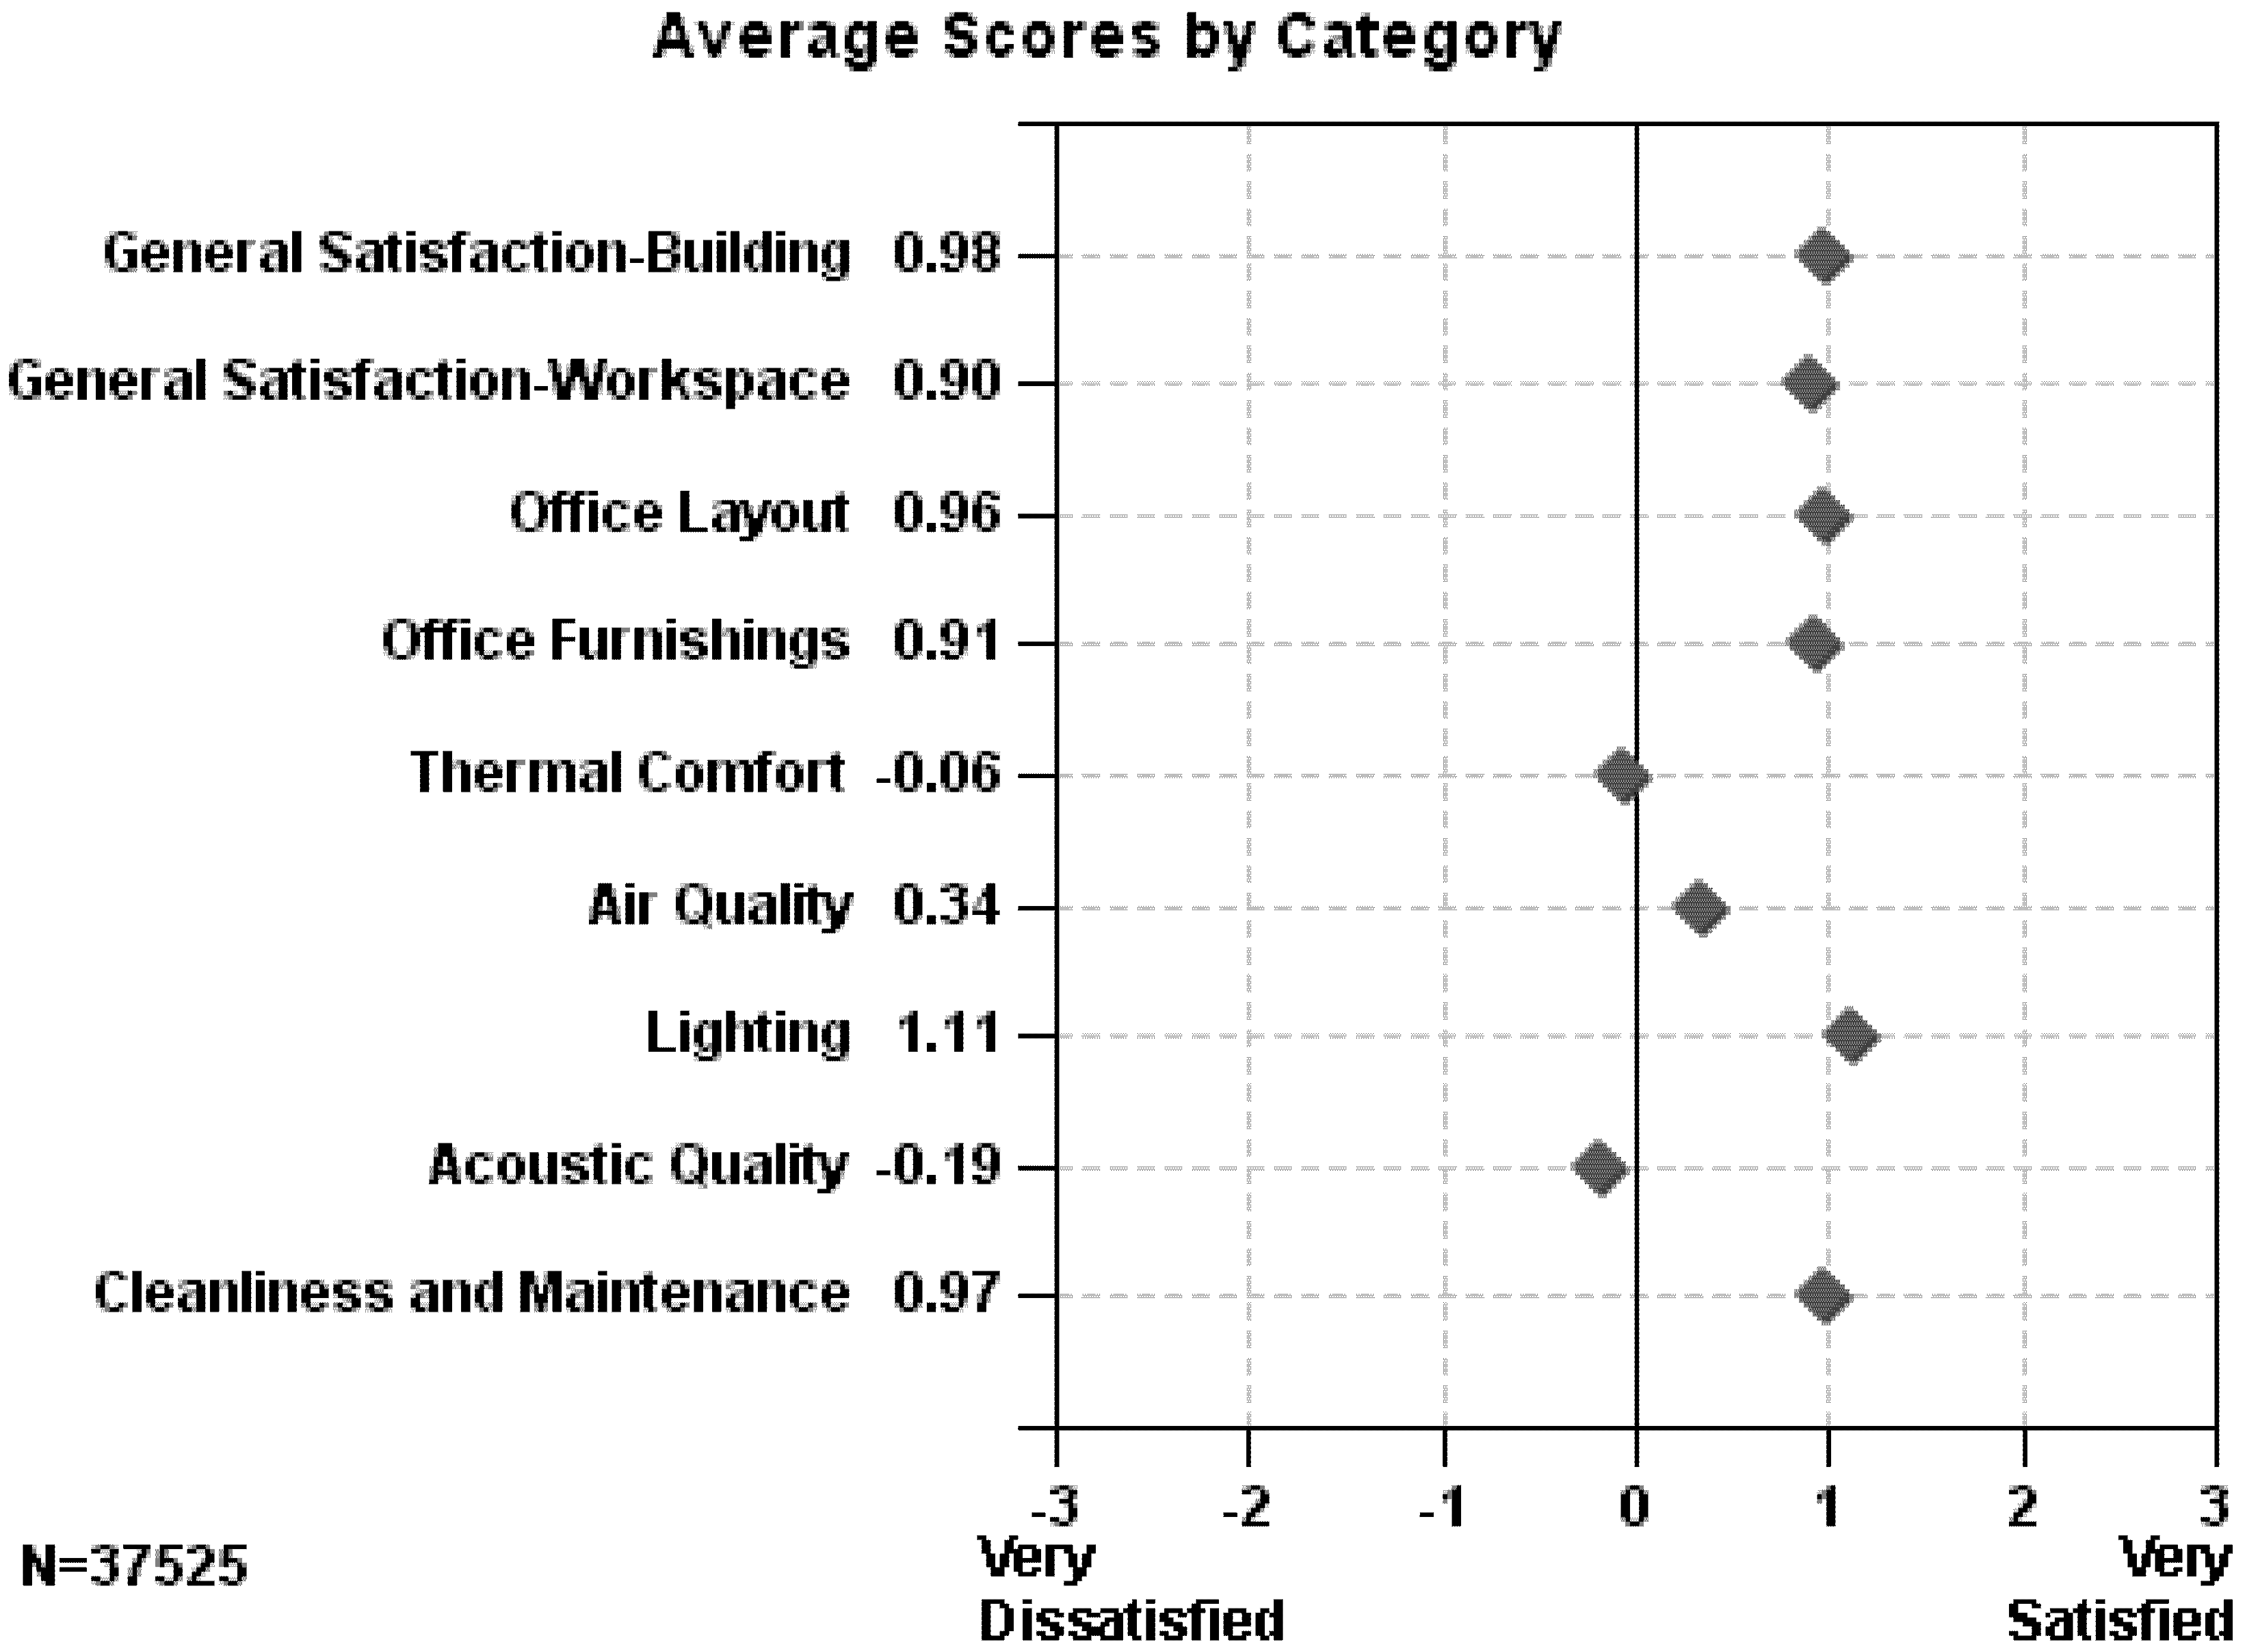
29] note that benchmarks may be based on the entire survey database or on the buildings belonging to a particular organisation for example, and no doubt other groupings are also possible. The benchmark values at any given time are noted in numerous CBE publications and presentations–see
Figure 9–these too will shift gradually in value as further buildings are added to the database.
Figure 9.
CBE survey average scores for a range of categories, based on a very large number of respondents (courtesy of CBE).
Figure 9.
CBE survey average scores for a range of categories, based on a very large number of respondents (courtesy of CBE).
In terms of what survey scores might be deemed acceptable in terms of user satisfaction with respect to thermal comfort and air quality the CBE quote an 80% satisfaction rate as the industry goal—see Weeks
et al. [
30]. This goal is based on ASHRAE Standard 55–2004 which allows for an additional 10% dissatisfaction on top of the tougher ISO Standard 7730:1994 recommendation of 90% satisfaction.
Writing in 2006, based on the 215 buildings in the database at that time, Huizenga
et al. [
26] noted that, in terms of temperature, ‘only 11% of buildings had 80% or more satisfied occupants’ and that ‘Air quality scores were somewhat higher, with 26% of buildings having 80% or more occupant satisfaction’. At the time of writing the corresponding figures (from a database of 438 buildings) were 3% and 11% respectively according to Goins [
31].
6.3. Benchmarking of Buildings—in New Zealand and Worldwide
At the time of writing the author is also aware that BUS has put forward a tentative New Zealand benchmark based on the 24 or so buildings that have been surveyed in this country using that method.
Figure 2,
Figure 3 and
Figure 4 give examples of their range for the three selected variables.
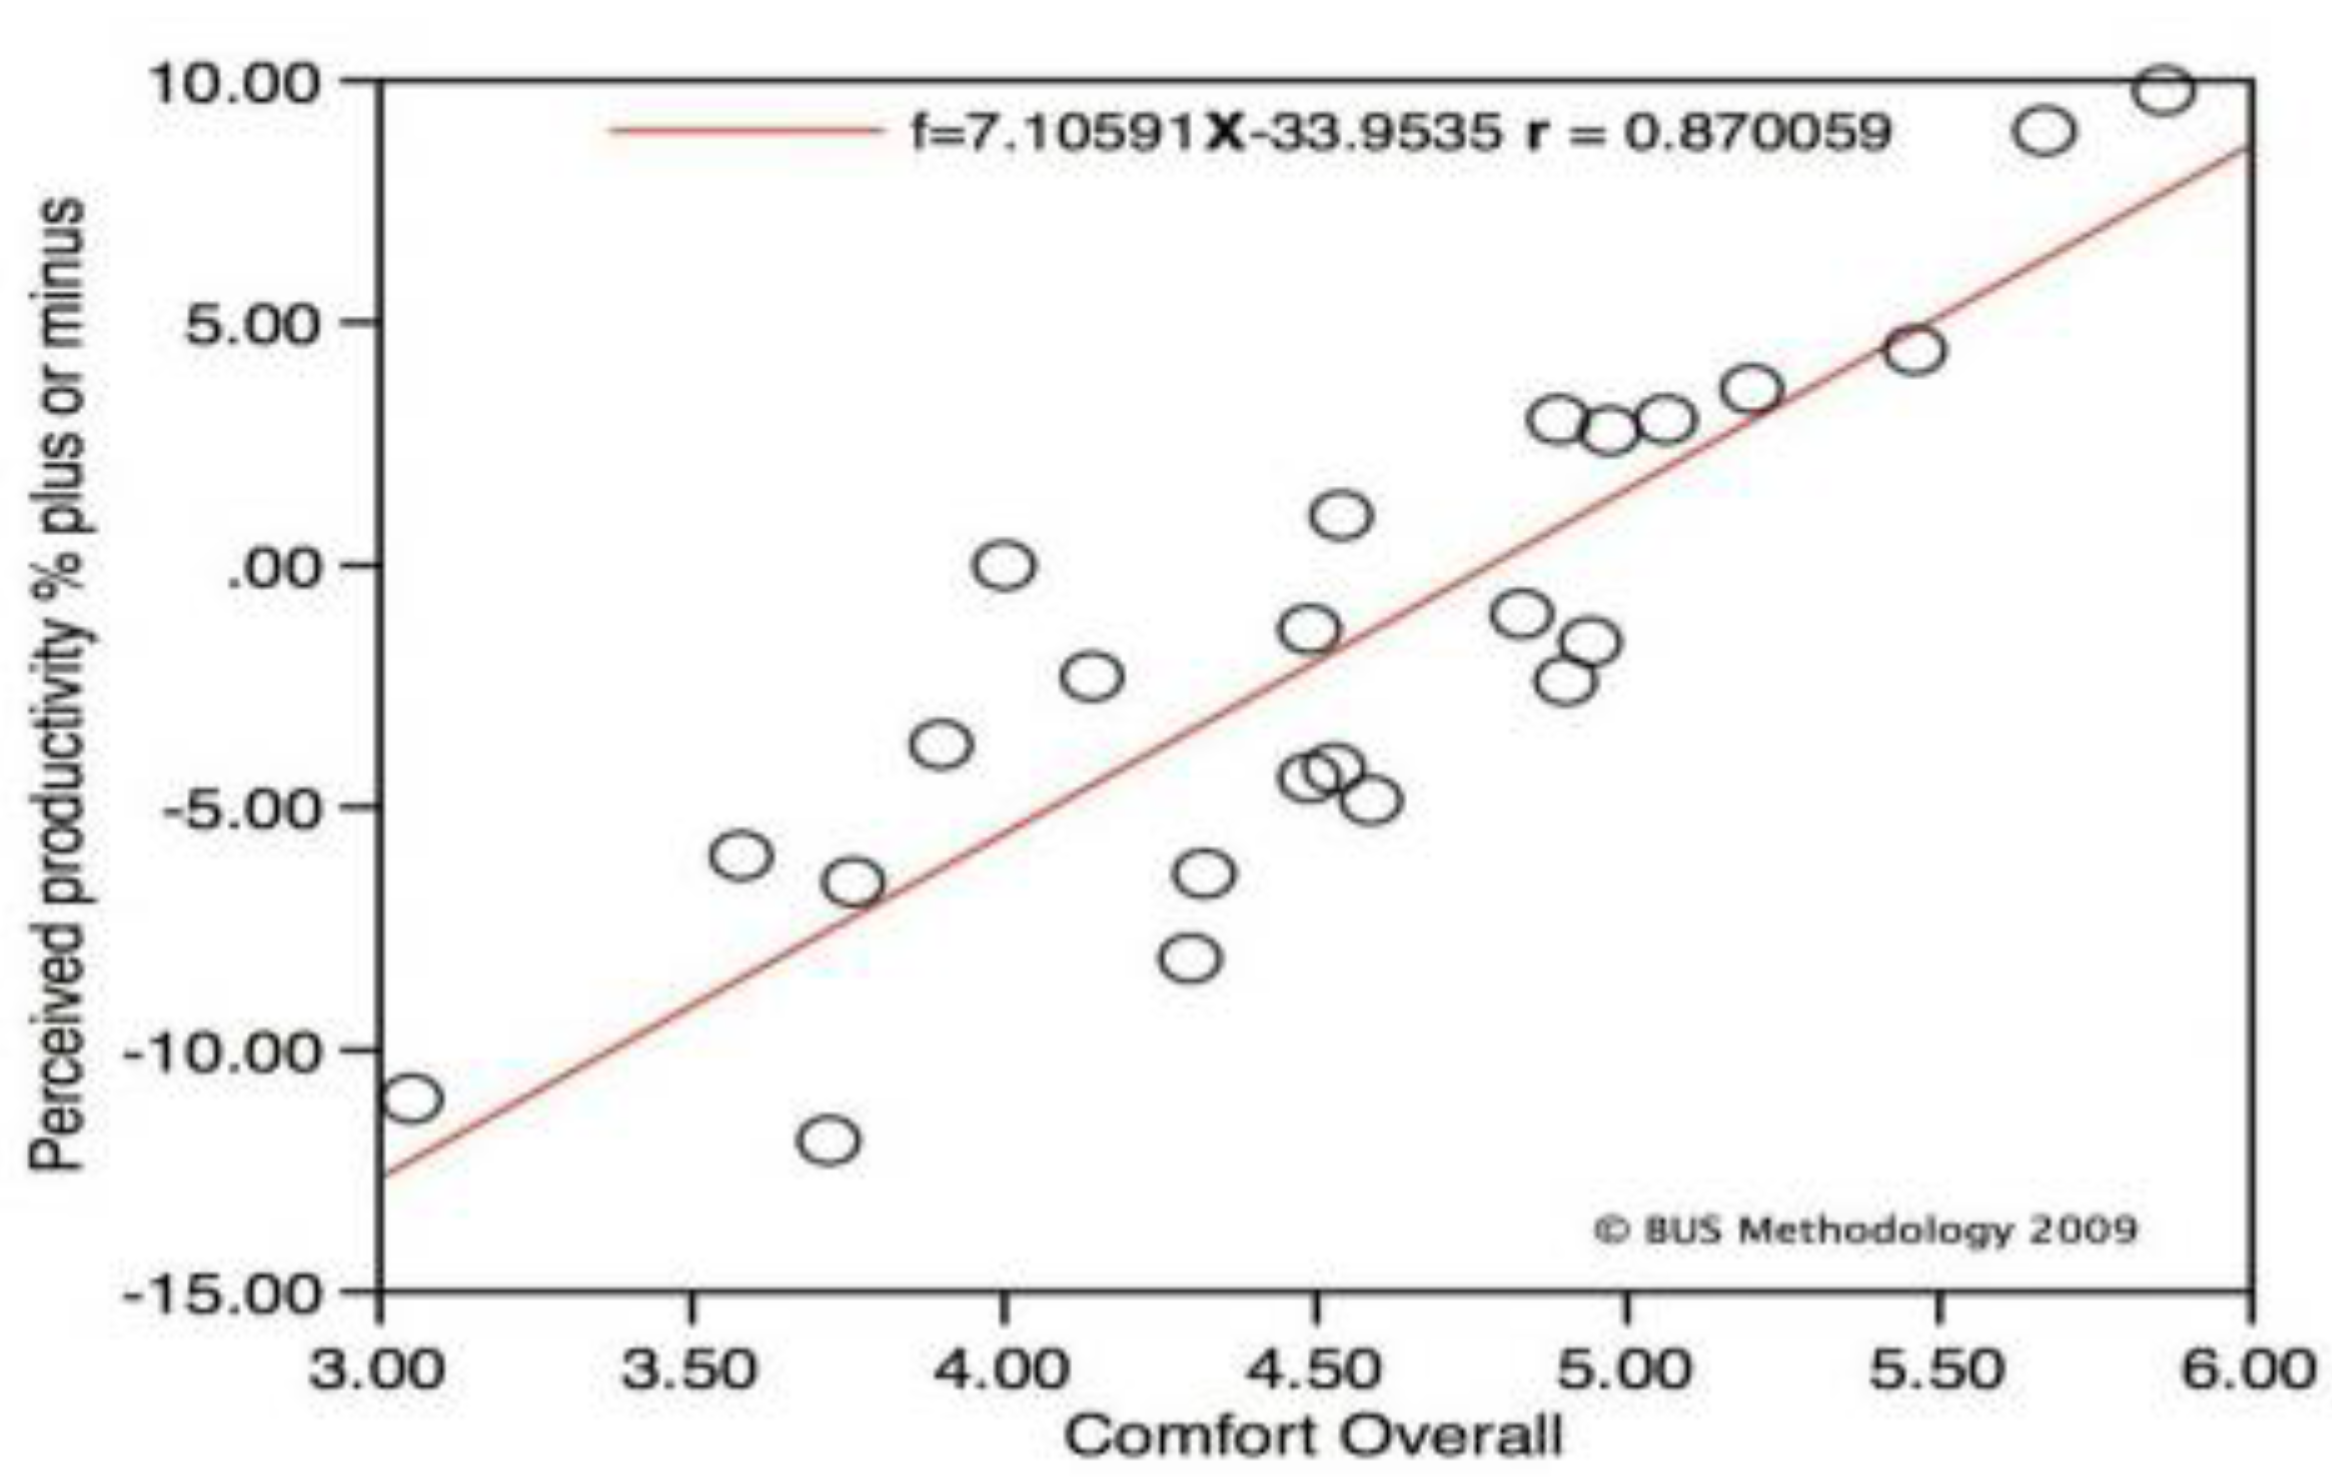
Figure 10 indicates the high correlation between
comfort overall and
productivity in these buildings.
Figure 10.
Plot of average comfort overall score versus perceived productivity percentage for the set of New Zealand buildings surveyed using the BUS Methodology (courtesy of BUS).
Figure 10.
Plot of average comfort overall score versus perceived productivity percentage for the set of New Zealand buildings surveyed using the BUS Methodology (courtesy of BUS).
The buildings surveyed so far (using the BUS method) are a mixture of offices, tertiary educational establishments, libraries, and laboratories, with occupancies ranging from as low as 15 to 200 or more.
The current Green Star NZ protocol covers Offices; with protocols for Education Buildings, Industrial Buildings and Office Interiors at the pilot stage. Clearly it would be ideal to have benchmarks for each of these building types, based on a random sample of existing buildings.
In practice, many of the buildings already surveyed were selected for particular reasons–they were of particular interest to researchers, they were of advanced design, they had sustainability or energy efficiency ‘credentials’, or they had recently undergone major renovations. It certainly could not be argued that they were necessarily representative of the overall NZ building stock.
It is contended that any truly valid benchmark must be based on a sampling of the performance of the current building stock. This might best be focused on office buildings in the first instance, in parallel with the development of BSRTs for existing buildings of this type, the sample ideally to include a range of office sizes, types and occupancies in a range of geographical locations.
Integral with this task will be the selection of relevant indicators and the determination of the most appropriate scale against which to measure a building’s performance.
While this may seem a daunting task at first sight, it is to be hoped that the building owning and building tenant membership of Green Building Councils throughout the world would throw their weight behind such an enterprise. Benchmarks, based on a sample of buildings exhibiting the wide range of performance that is found in practice, will provide a much more realistic set of figures than those from surveys of the buildings of the highly motivated group of owners who tend to commission such surveys of their own volition.
It may be important too, to avoid perceptions of bias and to maintain anonymity, that the survey procedures and database operation remain in independent hands, separate from the Green Building Council organisations.
6.4. Incorporating User Benchmarks into BSRTs
Having established a set of benchmarks, how then does one incorporate them into the relevant country BSRT, whether LEED, BREEAM, CASBEE, GBtool, or one of the several Green Star protocols?
The pioneering approach taken by NABERS offers one possibility, which potentially could be extended beyond matters of indoor environmental quality. Both of the survey methods discussed above already include several other factors of interest, such as health and productivity, and there seems every reason why they, and other variables in what is sometimes termed the satisfaction category, should also be incorporated. Questions remain of course concerning the most appropriate balance between physical measurements and survey questionnaire data, and even whether the former have any place in such a protocol.
7. Summing-Up and Proposal
‘If buildings work well they enhance our lives, our communities, and our culture’ according to Baird
et al. [
32] or, as Winston Churchill [
33] so eloquently put it ‘We shape our buildings and afterwards our buildings shape us’. Yet comparatively little is known about how people worldwide perceive the buildings they use.
Here in New Zealand moves are afoot which could lead to the establishment of a reliable and comprehensive set of user performance criteria for commercial and institutional buildings.
The overall aim of this proposal is to improve the performance of existing commercial and institutional buildings from the point of view of the building users. The proposal has two specific objectives: the first is to establish an independent and unbiased set of performance benchmarks for users’ perceptions of the buildings in which they work; the second is to develop a methodology for incorporating these benchmarks into relevant New Zealand building sustainability rating tools.
The first objective is to establish user performance benchmarks. As noted above, ideally this would involve surveying users’ perceptions of a representative cross-section of New Zealand commercial and institutional buildings, rather than awaiting the compilation of an ad-hoc and potentially biased sample based on buildings where surveys had been commissioned by the building owners. These surveys will be undertaken in conjunction with a major multi-year study of energy and water use in commercial buildings that is now well under way under the leadership of Nigel Isaacs [
34]. This project, known as the Building Energy End-use Study (or BEES Project), for the five floor-area groups that have been identified, has adopted a three-level approach to surveying this section of the New Zealand building stock—Aggregate (a large number of randomly selected buildings), Targeted (for around 300 buildings), and Case-studies (of a small number). The proposal is to survey users' perceptions of the Targeted and Case-study samples.
The second objective is to develop a methodology for incorporating these benchmarks into relevant New Zealand sustainability rating tools for buildings in operation. I believe it is essential for user perception benchmarks to be incorporated into these tools as they are developed and applied to the much larger stock of existing buildings—establishment of statistically valid benchmarks will be the first step.
Any rating tool for existing buildings must take account of users’ perceptions and have a set of benchmarks against which the building’s performance can be measured from the point of view of the users. Fulfillment of these objectives will ensure that the tools we use in New Zealand are on the leading edge of such endeavours, with the potential to set a trend internationally and to lead to improvements in the performance in our existing buildings.
