Life-Cycle Assessment and the Environmental Impact of Buildings: A Review

Abstract
:1. Introduction
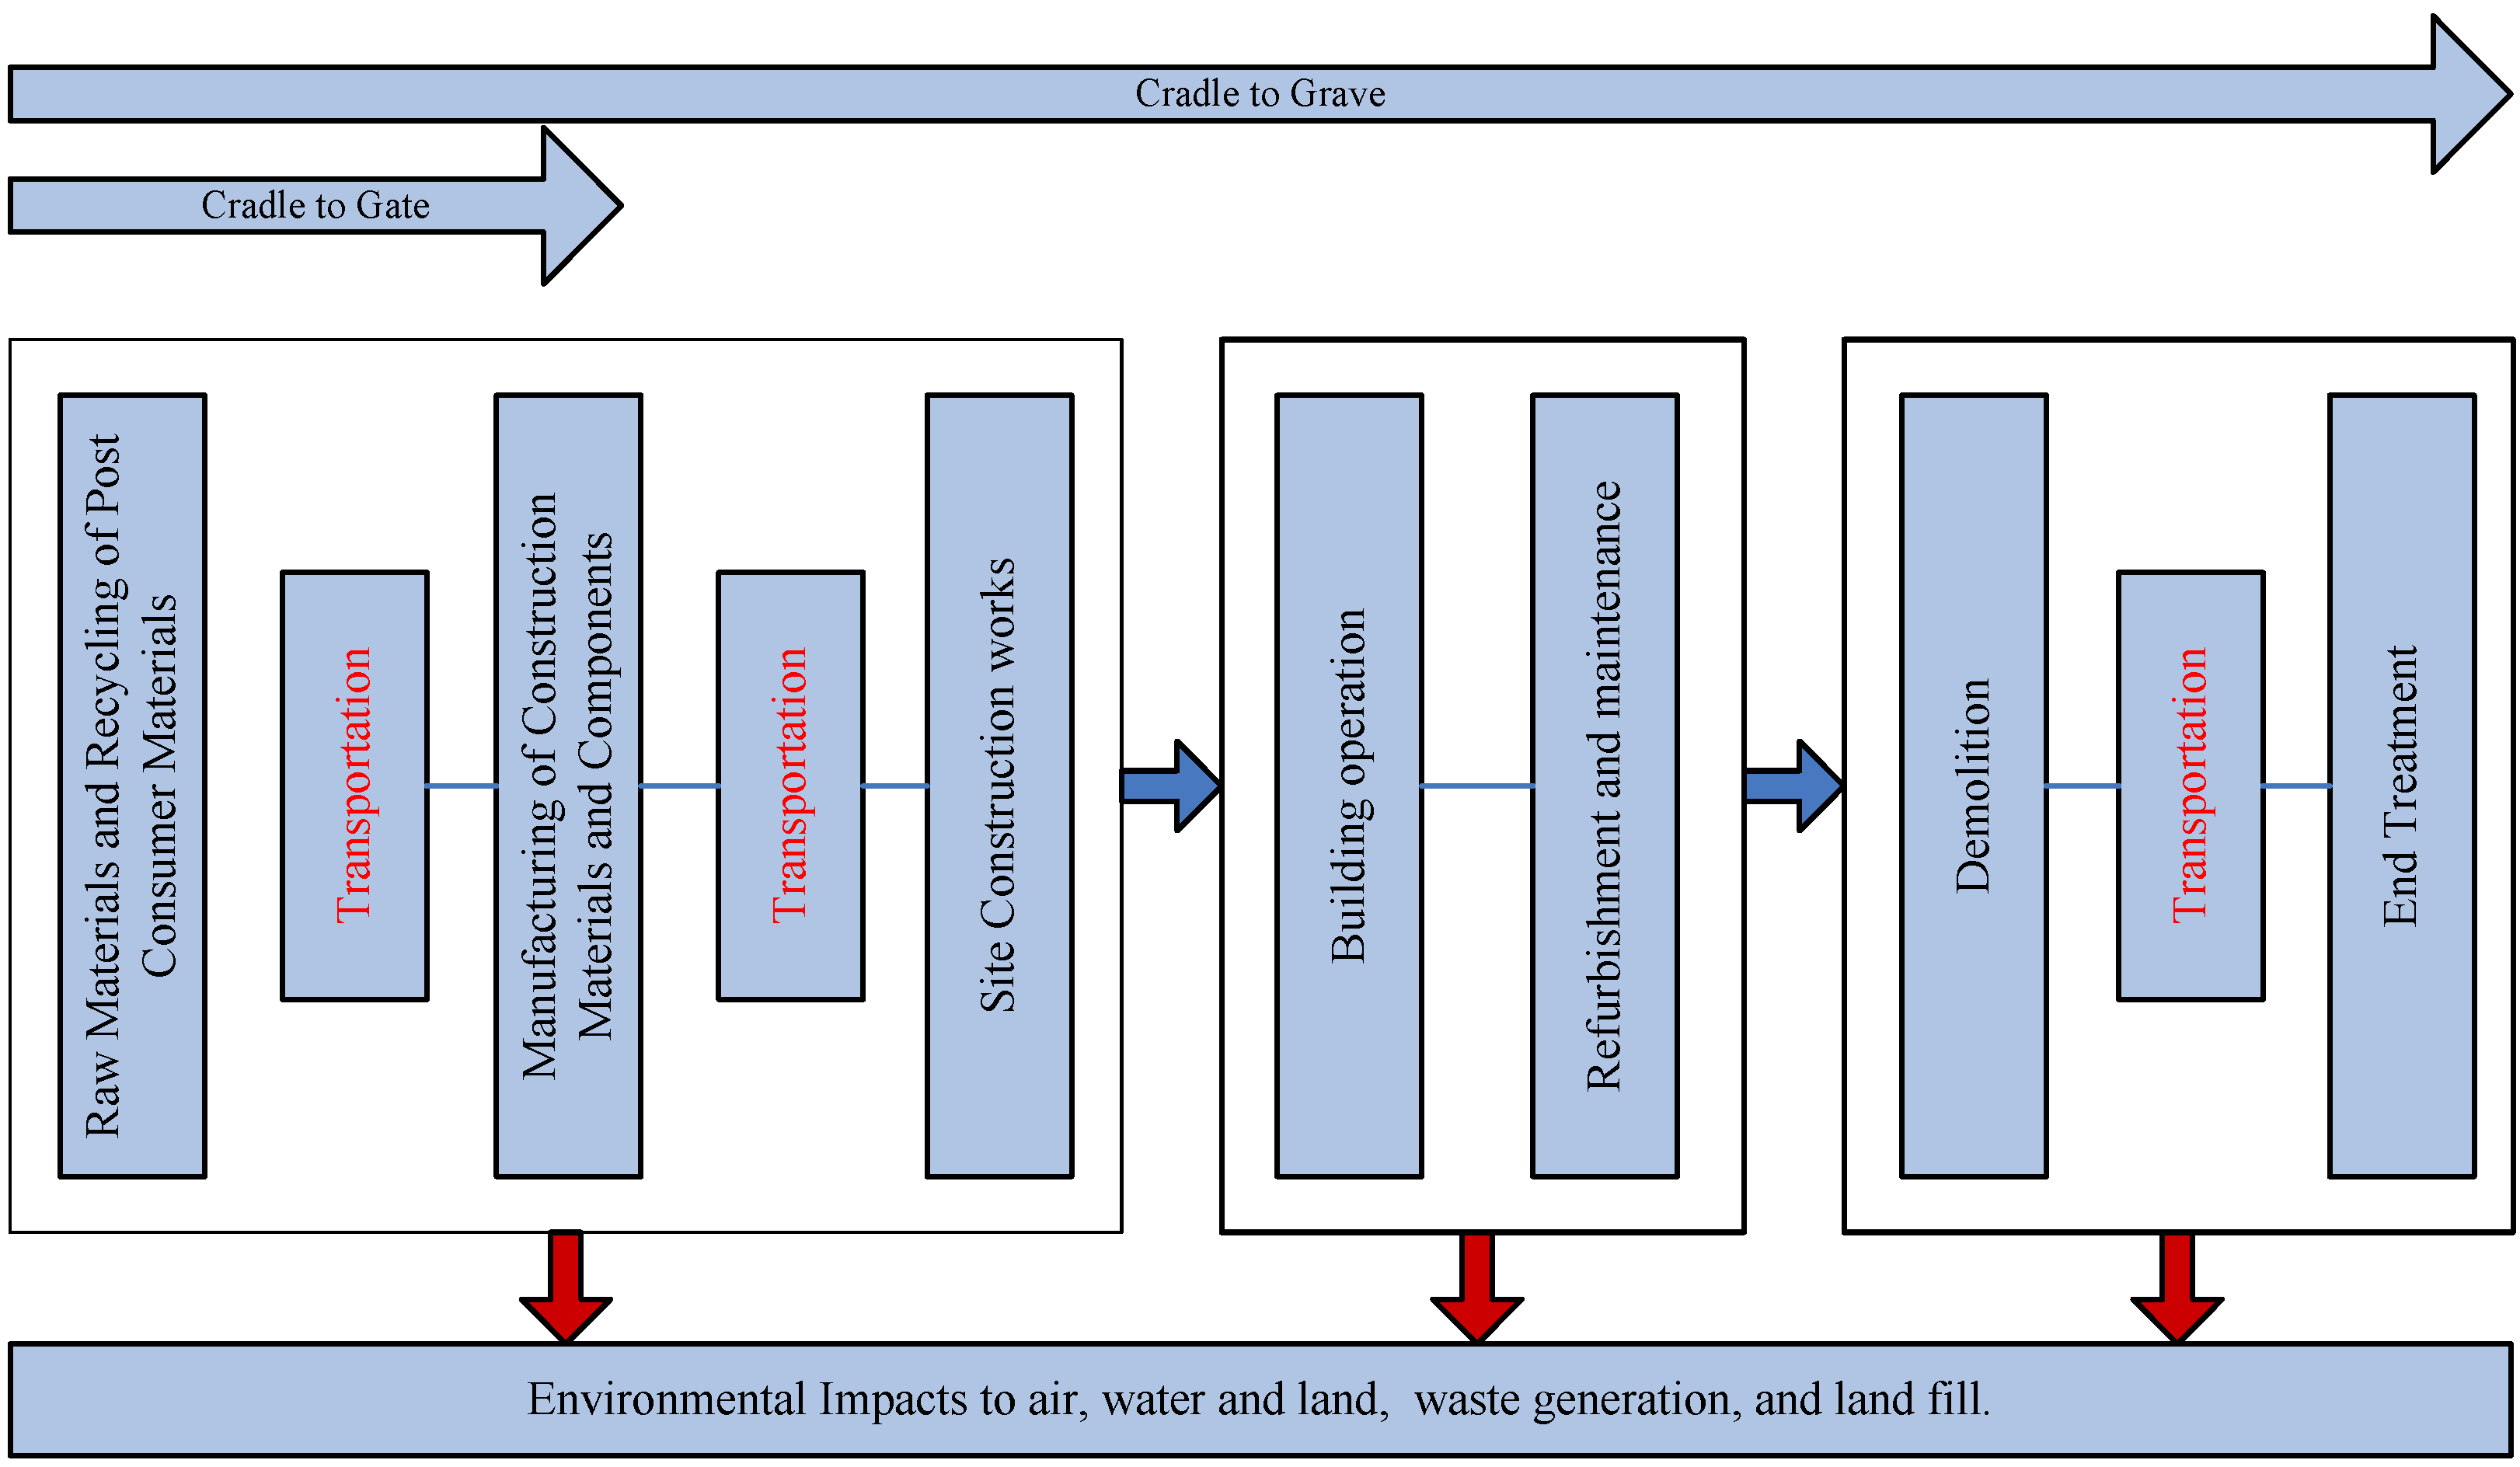
2. Role of the Built Environment
3. Life-Cycle Assessment
4. Brief History of Life-cycle Assessment
- ISO 14040 Environmental management, LCA, Principles and framework (1997).
- ISO 14041 Environmental management, LCA, Goal definition and inventory analysis (1998).
- ISO 14042 Environmental management, LCA, Life-cycle impact assessment (2000).
- ISO 14043 Environmental management, LCA, Life-cycle interpretation (2000).
5. The Need for Life-Cycle Assessment in Buildings
6. Life-Cycle Assessment Methods in Building
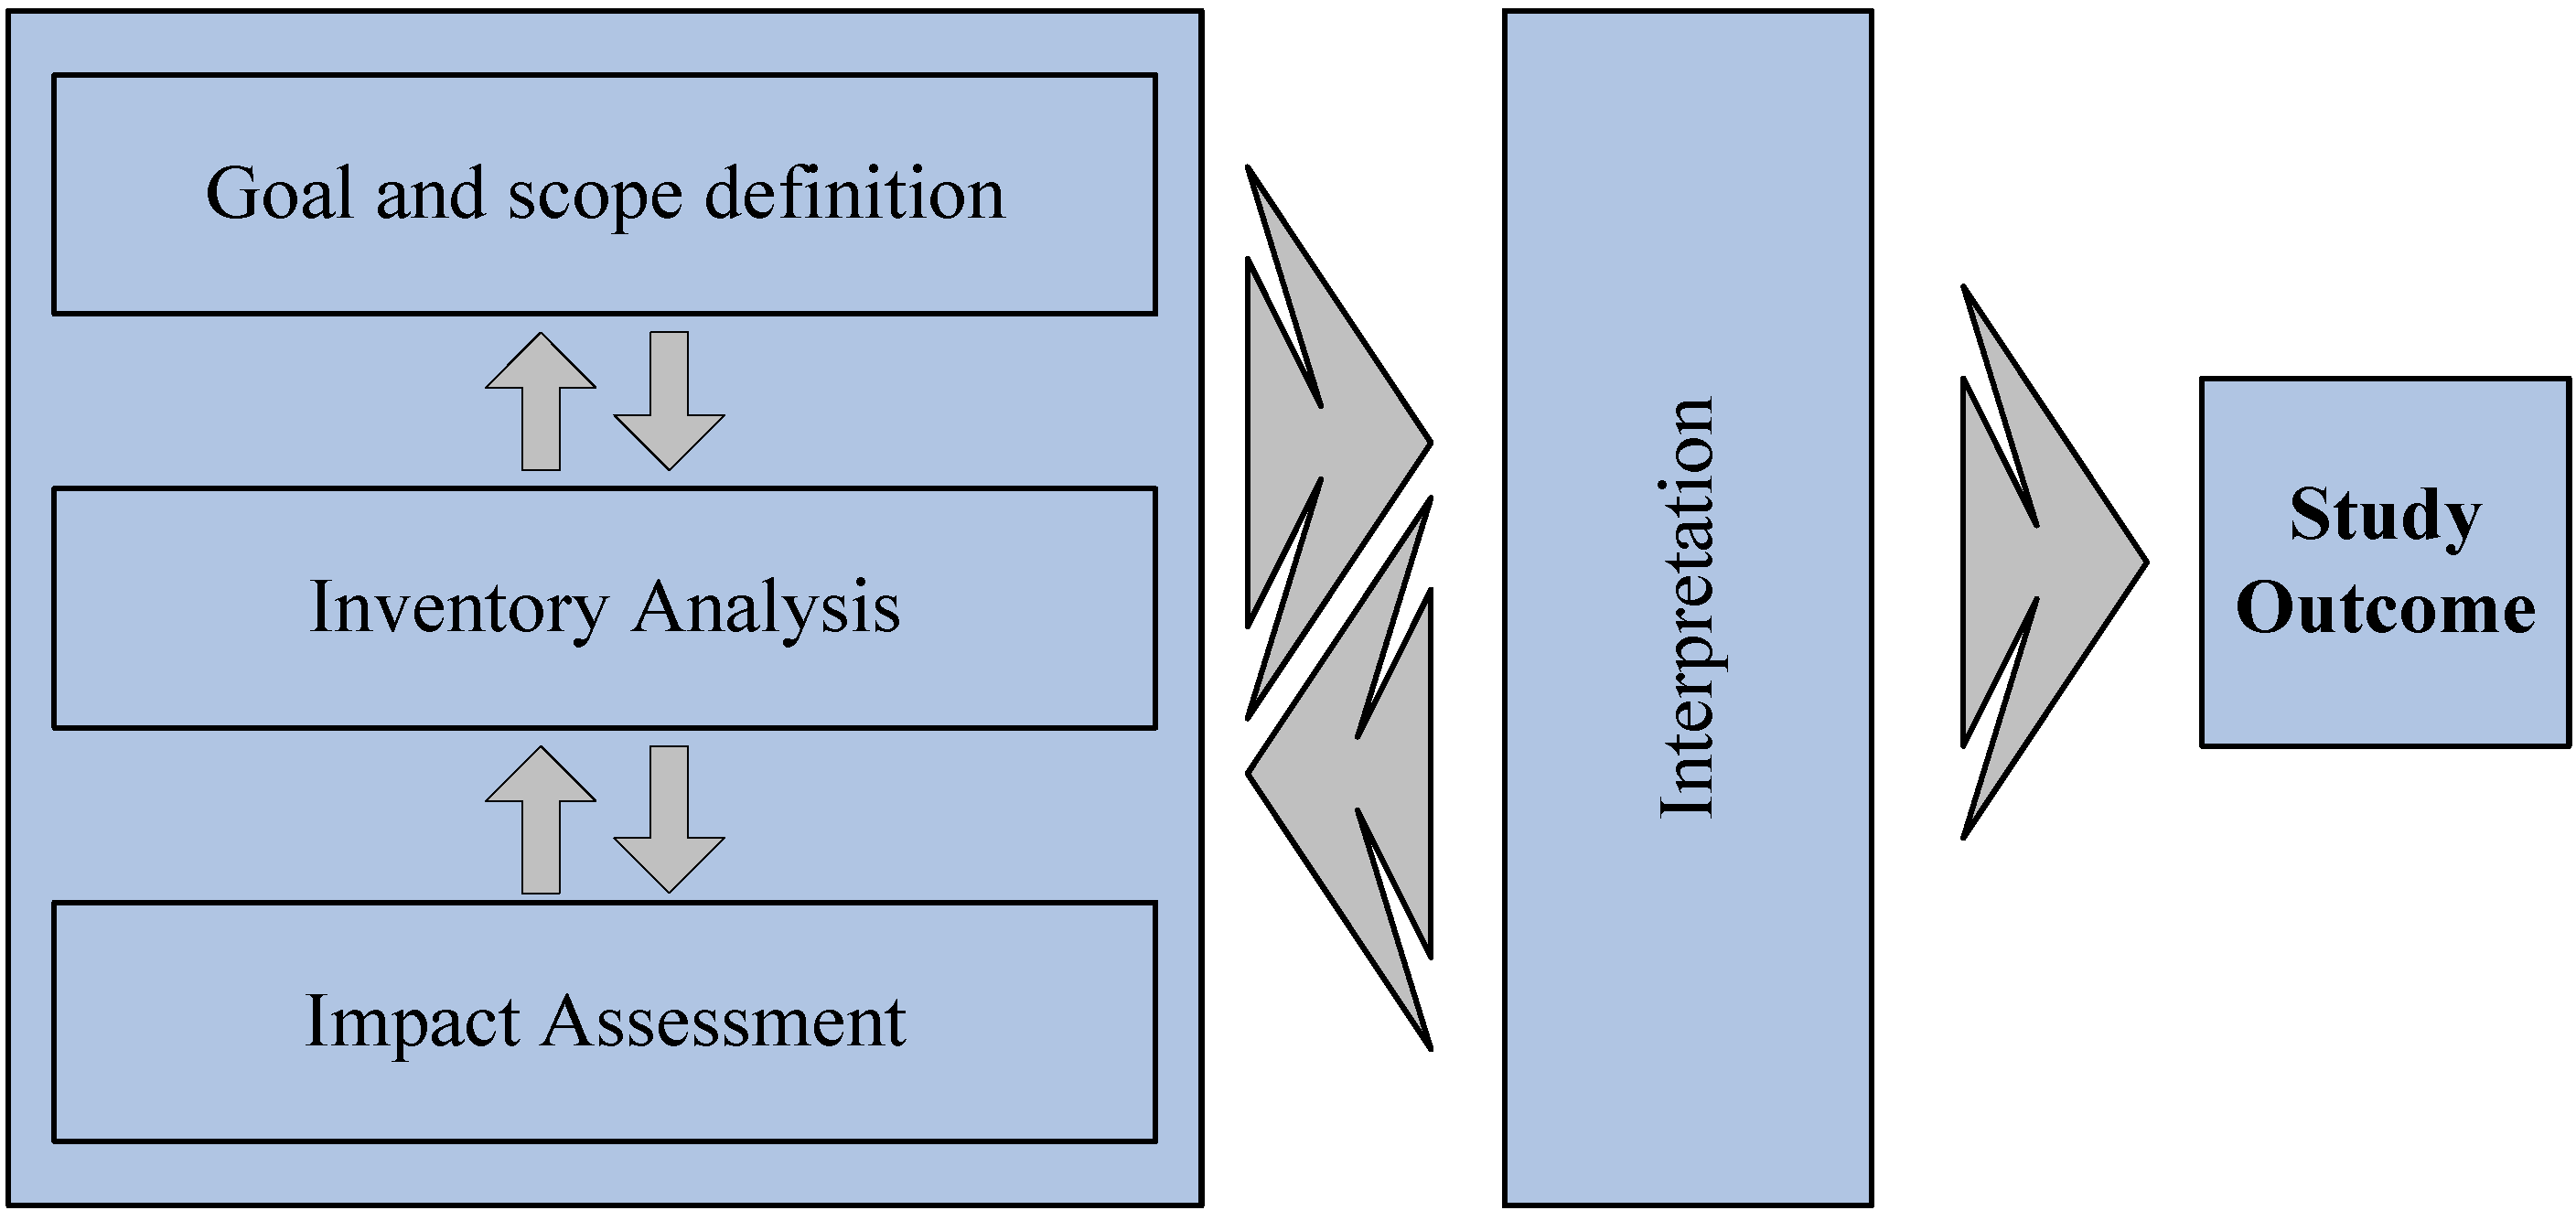
6.1. Goal and Scope Definition
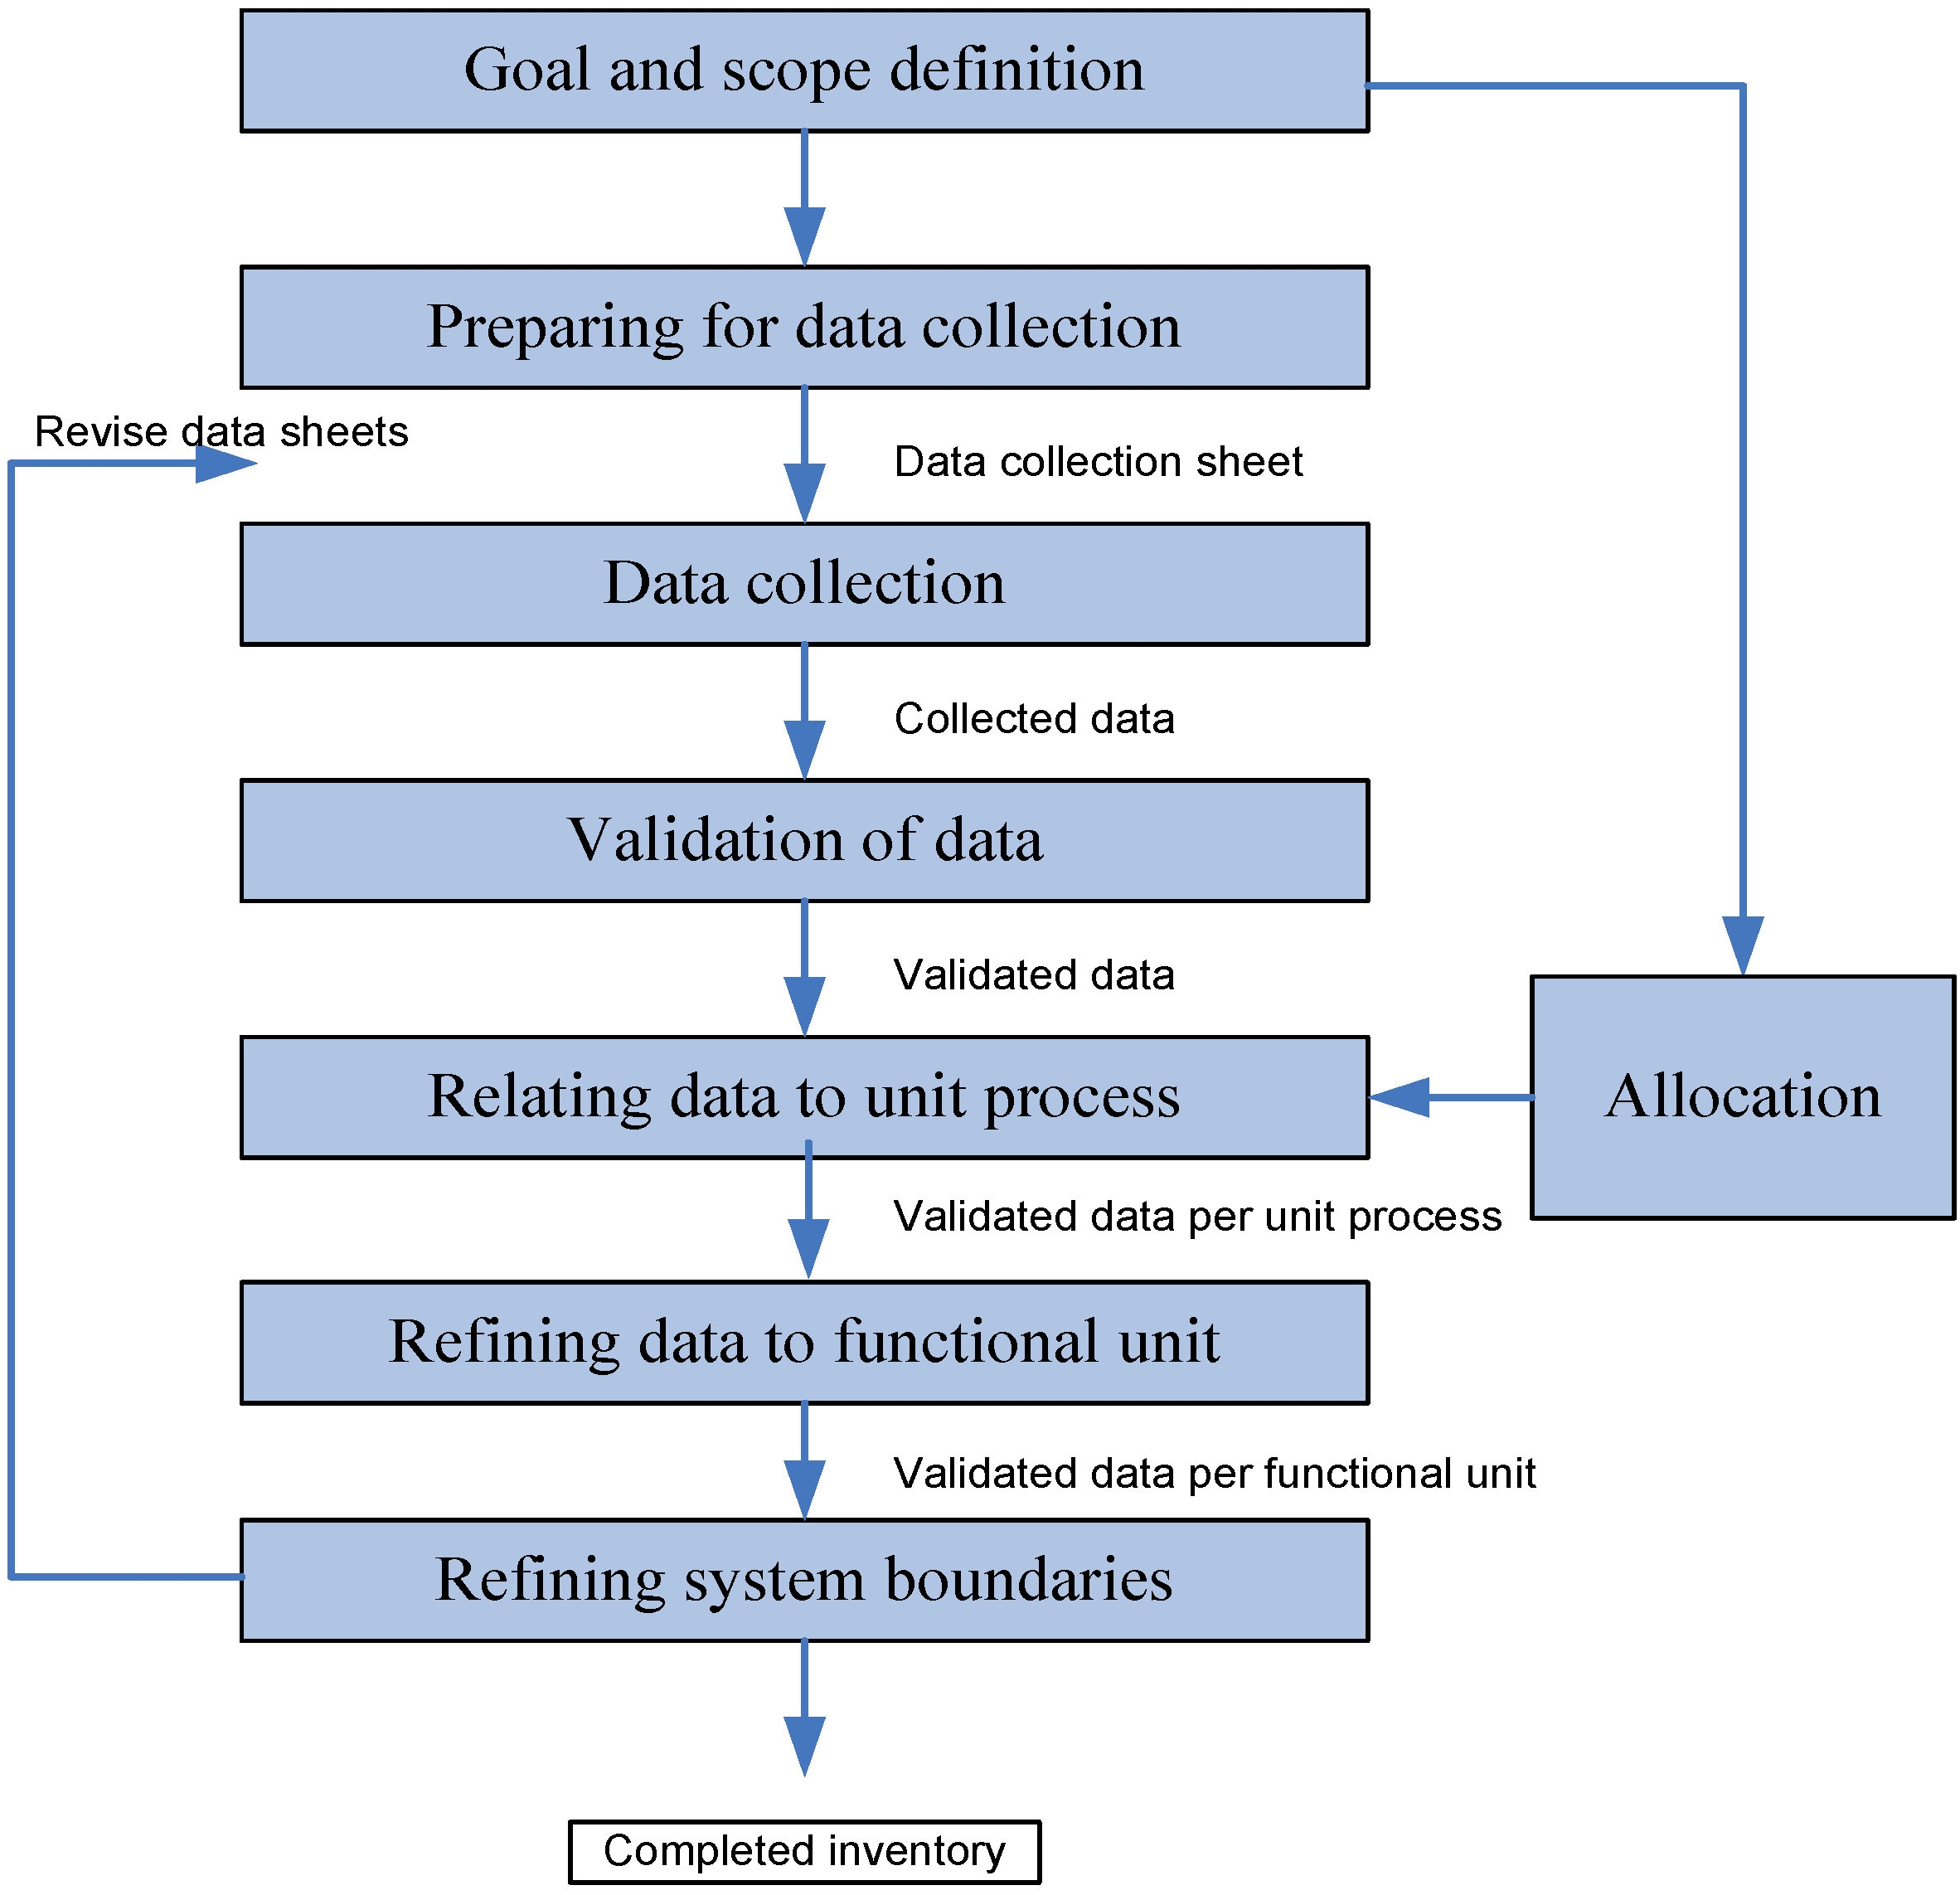
6.2. Inventory Analysis

| Indicator score | 1 Excellent | 2 | 3 | 4 | 5 Unreliable |
|---|---|---|---|---|---|
| Reliability | Verified data based on measurement | Verified data partly based on assumptions or non-verified data based on measurements | Non-verified data partly based on assumptions | Qualified estimate (e.g., by industrial expert) | Non-qualified estimate |
| Completeness | Representative data from a sufficient sample of sites over an adequate period to even out normal fluctuations | Representative data from a smaller number of sites but for adequate periods | Representative data from an adequate number of sites but from shorter periods | Representative data but from a smaller number of sites and shorter periods or incomplete data from an adequate number of sites and periods | Representativeness unknown or incomplete data from a smaller number of sites and/or from shorter periods |
| Temporal correlation | Less than three years different from year of study | Less than six years different | Less than 10 years different | Less than 15 years different | Age of data unknown or more than 15 years different from year of study |
| Geographical correlation | Data from area under study | Average data from larger area in which the area under study is included | Data from area with similar production conditions | Data from area with slightly similar production conditions | Data from unknown area or area with very different production conditions |
| Technological correlation | Data from enterprises, processes and materials under study | Data from processes and materials under study but from different enterprises | Data from processes and materials under study but from different technology | Data on related processes or materials but same technology | Data on related processes or materials but different technology |
| Database | Country | Function | Type | Level | Software | Website |
|---|---|---|---|---|---|---|
| Athena | Canada | Database + Tool | Academic | whole building design decision | Eco Calculator | www.athenaSMI.ca |
| Bath data | UK | Database | Academic | product comparison | No | people.bath.ac.uk/cj219/ |
| BEE | Finland | Tool | Academic | whole building design decision | BEE 1.0 | -------------------------- |
| BEES | USA | Tool | Commercial | whole building design decision | BEES | www.bfrl.nist.gov/oae/software/bees.html |
| BRE 3 | UK | Database + Tool | Public | whole building assessment | No | www.bre.co.uk |
| Boustead | UK | Database + Tool | Academic | product comparison | Yes | www.boustead-consulting.co.uk |
| DBRI 4 Database | Denmark | Database | Public | No | www.en.sbi.dk | |
| Ecoinvent | SL | Database | Commercial | product comparison | No | www.pre.nl/ecoinvent |
| ECO-it | NL | Tool | Commercial | whole building design decision | ECO-it | www.pre.nl |
| ECO methods | France | Tool | Commercial | whole building design decision | Under development | www.ecomethods.com |
| Eco-Quantum | NL | Tool | Academic | whole building design decision | Eco-Quantum | www.ecoquantum.nl |
| Envest | UK | Tool | Commercial | whole building design decision | Envest | envestv2.bre.co.uk |
| Gabi | Germany | Database + Tool | Commercial | product comparison | Gabi 4 | www.gabi-software.com |
| IO-database | Denmark | Database | Academic | product comparison | No | ---------------------- |
| IVAM | NL | Database | Commercial | product comparison | No | www.ivam.uva.nl |
| KCL-ECO | Finland | Tool | Commercial | product comparison | KCL-ECO 4.1 | www.kcl.fi/eco |
| LCAiT | Sweden | Tool | Commercial | product comparison | LCAiT | www.ekologik.cit.chalmers.se |
| LISA | Australia | Tool | Public | whole building design decision | LISA | www.lisa.au.com |
| Optimize | Canada | Database + tool | --------- | whole building design decision | Yes | ----------------------- |
| PEMS | UK | Tool | Public | product comparison | Web | ----------------------- |
| SEDA | Australia | Tool | Public | whole building assessment | SEDA | ----------------------- |
| Simapro | NL | Database + Tool | Commercial | product comparison | Simapro 7 | www.pre.nl |
| Spin | Sweden | Database | Public | product Comparison | No | http://195.215.251.229/Dotnetnuke/ |
| TEAM | France | Database + Tool | Commercial | product comparison | TEAM 3.0 | www.ecobilan.com |
| Umberto | Germany | Database + Tool | Commercial | product comparison | Umberto | www.umberto.de |
| US LCI data | USA | Database | Public | product comparison | No | www.nrel.gov/lci |


6.3. Impact Assessment
| Reference | BMCC | WPC | Content, country and year | Environmental impacts studied (see footnote) | |||||||||||||
|---|---|---|---|---|---|---|---|---|---|---|---|---|---|---|---|---|---|
| En | GW | A | E | OD | HT | EL | WC | DA | W | EC | RS | AR | O | ||||
| Adalberth et al. | x | Life-cycle of four dwellings located in Sweden (2001) | x | x | x | x | x | x | x | ||||||||
| Ardente et al. | x | LCA of a solar thermal collector, Italy (2005) | x | x | x | x | x | ||||||||||
| Asif et al. | x | LCA for eight different materials for a dwelling in Scotland (2005) | x | x | |||||||||||||
| Citherlet et al. | x | LCA of a window and advanced glazing systems in Europe (2000) | x | x | x | x | x | ||||||||||
| Cole and Kernan | x | LCA of a three-storey, office building for alternative structure materials in Canada. | x | ||||||||||||||
| Gustavsson and Sathre | x | LCA Sweden case study: wood and concrete in building materials (2006) | x | x | |||||||||||||
| Junnila | x | LCA for a construction of an office: a Finland case study (2004) | x | x | x | x | x | ||||||||||
| Junnila and Horvath | x | LCA of a high end office building in Finland (2003). | x | x | x | x | x | ||||||||||
| Junnila et al. | x | Comparative LCA of office buildings in Europe and the United States (2006) | x | x | x | x | |||||||||||
| Koroneos and Dompros | x | LCA of brick production in Greece (2006) | x | x | x | x | x | x | |||||||||
| Koroneos and Kottas | x | LCA for energy consumption in the use phase for a house in Greece (2007) | x | x | x | x | x | x | |||||||||
| Morel et al. | X | Comparison of energy embodied in local construction materials with imported ones, France (2000) | x | ||||||||||||||
| Nebel et al. | x | LCA for floor covering, Germany (2006) | x | x | x | x | x | x | |||||||||
| Nicoletti et al. | x | LCA of flooring materials (ceramic versus marble tiles), Italy (2002) | x | x | x | x | x | x | x | ||||||||
| Nyman andSimonson | x | LCA of residential ventilation units over a 50 year life-cycle in Finland (2005) | x | x | x | x | x | x | |||||||||
| Peuportier | x | Comparison of three types of houses with different specifications in France (2001) | x | x | x | x | x | x | x | x | x | x | x | x | x | ||
| Petersen and Solberg | x | LCA by comparing wood and alternative materials in Norway and Sweden (2005) | x | x | x | x | x | ||||||||||
| Prek | x | LCA of heating and air conditioning systems. Dwelling in Slovenia (2004) | x | x | x | ||||||||||||
| Saiz et al. | x | LCA for green roofs located in downtown Madrid, Spain (2006) | x | x | x | x | x | x | x | x | x | ||||||
| Scheuer et al. | x | LCA to a new University building in the USA (2003) | x | x | x | x | x | x | x | ||||||||
| Seppala et al. | x | LCA for Finnish metal products (2002) | x | x | x | x | x | x | x | ||||||||
| Thormark | x | LCA of residential houses in Sweden (2001) | x | ||||||||||||||
| Van der Lugt et al. | x | LCA for using bamboo as building material in Western Europe (2006) | x | x | |||||||||||||
| Wilson and Young | x | Embodied energy payback period of photovoltaic installations in the UK (1995) | x | ||||||||||||||
| Yohanis and Norton | x | LCA of open-plan office building in the UK (1999) | x | ||||||||||||||
| Impact category | Abbreviation | Scale | LCI data i.e., classification | Characterization factor |
|---|---|---|---|---|
| Global warming | GW | Global | Carbon Dioxide (CO2) | Global warming potential |
| Nitrogen Dioxide (NO2) | ||||
| Methane (CH4) | ||||
| Chlorofluorocarbons (CFCS) | ||||
| ‘Hydro chlorofluorocarbons’ (HCFCS) | ||||
| Methyl Bromide (CH3Br) | ||||
| Acidification | A | Regional Local | Sulphur Oxides (SOX) | Acidification potential |
| Nitrogen Oxides (NOX) | ||||
| Hydrochloric Acid (HCL) | ||||
| Hydrofluoric Acid (HF) | ||||
| Ammonia (NH4) | ||||
| Eutrophication | E | Local | Phosphate (PO4) | Eutrophication potential |
| Nitrogen Oxide (NO) | ||||
| Nitrogen Dioxide (NO2) | ||||
| Nitrates, and Ammonia (NH4) | ||||
| Ozone depletion | OD | Global | Chlorofluorocarbons (CFCS) | Ozone depletion potential |
| Hydro chlorofluorocarbons (HCFCS) | ||||
| Halons, and Methyl Bromide (CH3Br) |
6.4. Interpretation
7. LCA Studies for Buildings
7.1. Building Materials and Component Combinations (BMCC)
7.2. Whole Process of Construction (WPC)
LCA for Dwellings
LCA for Offices
8. Discussion and Conclusions
Acknowledgements
References
- World Commission on Economic Development. Sustainable Development; United Nations: New York, NY, USA, 1987; p. 363. [Google Scholar]
- Buchanan, A.H.; Honey, B.G. Energy and carbon dioxide implications of building construction. ENB 1994, 20, 205–217. [Google Scholar]
- Houghton, J.T.; Ding, Y.; Griggs, D.J.; Noguer, M.; Van Der Linden, P.J.; Dai, X.; Maskell, K.; Johnson, C.A. Climate Change 2001 Third Assessment Report (TAR) The Scientific Basis, The Summary for Policymakers; Cambridge University Press: Cambridge, UK, 2001. [Google Scholar]
- Bows, A.; Mander, S.; Starkey, R.; Bleda, M.; Anderson, K. Living within a Carbon Budget, Report for Friends of the Earth and The Co-operative Bank; The University of Manchester: Manchester, UK, 2006. [Google Scholar]
- The Stationary Office TSO. Climate Change: The UK Programme; The Stationery Office: London, UK, 2006. [Google Scholar]
- The Stationary Office TSO. Our Energy Futur—Creating a Low Carbon Economy; The Stationery Office: London, UK, 2003. [Google Scholar]
- Raynsford, N. The UK’s approach to sustainable development in construction. Build Res. Inf. 1999, 27, 419–423. [Google Scholar] [CrossRef]
- Citherlet, S. Towards the Holistic Assessment of Building Performance Based on an Integrated Simulation Approach; Swiss Federal Institute of Technology EPFL: Lausanne, Switzerland, 2001. [Google Scholar]
- California Integrated Waste Management Board. Designing With Vision: A Technical Manual for Material Choices in Sustainable Construction; California Environmental Protection Agency: California, CA, USA, 2000. [Google Scholar]
- United Nations Environment Programme UNEP. Sustainable Building and Construction; Division of Technology, Industry and Economics: Paris, France, 2003. [Google Scholar]
- Department for Environment Food and Rural Affairs Defra. In Notes on Scenarios of Environmental Impacts Associated with Construction and Occupation of Homes. Defra Economics and Statistics; Defra Economics and Statistics. Available online: http://www.statistics.defra.gov.uk/esg/reports/housing/appendh.pdf (accessed on 15 December, 2008).
- Petersdorff, Boermans. Mitigation of CO2-Emissions from the Building Stock; European alliance of companies for energy efficiency in buildings: Munich, Germany, 2004. [Google Scholar]
- Natural Building Technologies NBT. Building Environmental Impact. Natural Building Technologies. Available online: http://www.natural-building.co.uk/environmental_impact.html (accessed on 13 January, 2009).
- Bowie, R.; Jahn, A. The New Directive on the Energy Performance of Buildings; European Commission, Directorate General for Energy & Transport: Brussels, Belgium, 2002. [Google Scholar]
- Sonnemann, G.; Castells, F.; Schuhmacher, M. Integrated Life-Cycle and Risk Assessment for Industrial Processes; Lewis Publishers: Boca Raton, FL, USA, 2003. [Google Scholar]
- Consoli, F.; Allen, D.; Boustead, I.; Fava, J.; Franklin, W.; Jensen, A.; Oude, N.; Parrish, R.; Perriman, R.; Postlethwaite, D.; Quay, B.; Seguin, J.; Vigon, B. Guide Lines for Life-Cycle Assessment: A ‘Code of Practice’; Society of Environmental Toxicology and Chemistry SETAC: Pensacola, FL, USA, 1993. [Google Scholar]
- Klöpffer, W. The role of SETAC in the development of LCA. Int. J. Life Cycle Assess. 2006, 11(Supplement 1), 116–122. [Google Scholar] [CrossRef]
- ISO 14040 Environmental Management Life Cycle Assessment Principles and Framework; International Standards Organization: Brussels, Belgium, 2006.
- Fava, J.A.; Consoli, F.; Dension, R.; Dickson, K.; Mohin, T.; Vigon, B. A Conceptual Framework for Life-Cycle Impact Assessment; Society of Environmental Toxicology and Chemistry SETAC: Sandestin, FL, USA, 1993. [Google Scholar]
- Selmes, D.G. Towards Sustainability: Direction for Life Cycle Assessment. PhD thesis, Heriot Watt University, Edinburgh, UK, 2005. [Google Scholar]
- LaGrega, M.D.; Buckingham, P.L.; Evans, J.C.; Group, T.E.R.M. Hazardous Waste Management; McGraw-Hill: Bucknell, CA, USA, 1994. [Google Scholar]
- Hunt, R.G.; Franklin, W.E. Life Cycle Assessment—how it came about: personal reflections on the origin and the development of LCA in the USA. Int. J. Life. Cycle Assess. 1996, 1, 4–7. [Google Scholar] [CrossRef]
- Boustead, I.; Hancock, G.F. Handbook of Industrial Energy Analysis; E. Horwood: New York, NY, USA, 1979. [Google Scholar]
- Jensen, A.A. LCA on the right track! Int. J. Life Cycle. Assess. 1996, 1, 21. [Google Scholar] [CrossRef]
- Heijungs, R.; Guinée, J.; Huppes, G.; Lankreijer, R.; Udo de Haes, H.; Wegener Sleeswijk, A.; Ansems, A.; Eggels, P.; Duin, R.; Goede, H. Environmental Life Cycle Assessment of Products: Guide and Backgrounds; CML, Leiden: Utrecht, The Netherlands, 1992. [Google Scholar]
- Lindfors, L.G. Nordic Guidelines on Life-cycle Assessment; Nordic Council of Ministers: Stockholm, Sweden, 1995. [Google Scholar]
- Bardy, K.; Paynter, A. Evaluation of Life Cycle Assessment Tools; Environment Canada: Gatineau, QC, Canada, 1996. [Google Scholar]
- International Standards Organization. Published Standards List. Available online: http://www.iso.org/iso/publications_and_e-products/all_publications.htm (accessed 30 January, 2009).
- Fava, J.A. Will the next 10 years be as productive in advancing life cycle approaches as the last 15 years? Int. J. Life Cycle. Assess. 2006, 11(Supplement 1), 6–8. [Google Scholar] [CrossRef]
- Sartori, I.; Hestnes, A.G. Energy use in the life cycle of conventional and low energy buildings: A review article. ENB 2007, 39, 249–257. [Google Scholar]
- Scheuer, C.; Keoleian, G.A.; Reppe, P. Life cycle energy and environmental performance of a new university building: modelling challenges design implications. ENB 2003, 35, 1049–1064. [Google Scholar]
- Junnila, S.; Harvath, A. Life cycle Envirnmental Effects of an Office Building. J. Infrastruct. Syst. 2003, 9, 157–167. [Google Scholar] [CrossRef]
- Asif, M.; Muneer, T.; Kelley, R. Life cycle assessment: A case study of a dwelling home in Scotland. Build Environ. 2007, 42, 1391–1394. [Google Scholar] [CrossRef]
- Weidema, B.; Wenzel, H.; Petersen, C.; Hansen, K. The Product, Functional Unit, and Reference Flows in LCA; The Danish Environmental Protection Agency: Denmark, 2004. [Google Scholar]
- Ortiz, O.; Castells, F.; Sonnemann, G. Sustainability in the construction industry: A review of recent developments based on LCA. Constr. Build Mater. 2009, 23, 28–39. [Google Scholar] [CrossRef]
- Kotaji, S.; Schuurmans, A.; Edwards, S. Life-Cycle Assessment in Building and Construction; Society of Environmental Toxicology and Chemistry SETAC: Brussels, Belgium, 2003. [Google Scholar]
- Menzies, G.; Turan, S.; Banfill, P. LCA, methodologies, inventories and embodied energy: a review. Constr. Mater. 2007, 160, 135–143. [Google Scholar] [CrossRef]
- Sinclair, T. Energy Management in the Brick and Ceramics Industry; Commonwealth of Australia National Energy Research: Canberra, Australia, 1986. [Google Scholar]
- Trusty, W.B. Life Cycle Assessment: Databases and Sustainable Building, Latin-American Conference on Sustainable Building; The Athena Institute: San Paulo, Brazil, 2004. [Google Scholar]
- Lenzen, M.; Treloar, G. Embodied energy in buildings: wood versus concrete-reply to Borjesson and Gustavsson. Energ. Policy 2002, 30, 249–255. [Google Scholar] [CrossRef]
- Lave, L.B.; Cobas-Flores, E.; Hendrickson, C.T.; McMichael, F.C. Using input-output analysis to estimate economy-wide discharges. Env. Sci. Tec. 1995, 29, 420A–426A. [Google Scholar] [CrossRef]
- Crawford, R.H. Validation of a hybrid life cycle inventory analysis method. Environ. Manage. 2008, 88, 496–506. [Google Scholar] [CrossRef]
- Scientific Applications International Corporation SAIC. Life Cycle Assessment: Principles and Practice; Environmental Protection Agency: Cincinnati, OH, USA, 2006. [Google Scholar]
- Weidema, B.P.; Wesnæs, M.S. Data quality management for life cycle inventories-an example of using data quality indicators. J. Clean Prod. 1997, 4, 167–174. [Google Scholar] [CrossRef]
- ISO 14044 Environmental Management Life Cycle Assessment Requirements and Guidelines; International Standards Organization: Brussels, Belgium, 2006.
- ISO 14042 Environmental Management—Life Cycle Assessment—Life Cycle Impact Assessment; International Standards Organization: Brussels, Belgium, 2006.
- Adalberth, K. Energy use during the life-cycle of single-unit dwellings: examples. Build Environ. 1997, 32, 321–329. [Google Scholar] [CrossRef]
- Peuportier, B. Life cycle assessment applied to the comparative evaluation of single family houses in the French context. ENB 2001, 33, 443–450. [Google Scholar]
- Venkatarama Reddy, B.V.; Jagadish, K.S. Embodied energy of common and alternative building materials and technologies. ENB 2001, 35, 129–137. [Google Scholar]
- Nicoletti, G.; Notarnicola, B.; Tassielli, G. Comparative life cycle assessment of flooring materials: ceramic versus marble tiles. J. Clean Prod. 2002, 10, 283–296. [Google Scholar] [CrossRef]
- Seppala, J.; Koskela, S.; Melanen, M.; Palperi, M. The Finnish metals industry and the environment. Resour. Conserv. Recy. 2002, 35, 61–76. [Google Scholar] [CrossRef]
- Borjesson, P.; Gustavsson, L. Greenhouse gas balances in building construction: wood versus concrete from life-cycle and forest land-use perspectives. Energ. Policy 2000, 28, 575–588. [Google Scholar] [CrossRef]
- Gustavsson, L.; Sathre, R. Variability in energy and carbon dioxide balances of wood and concrete building materials. Build Environ. 2006, 41, 940–951. [Google Scholar] [CrossRef]
- Xing, S.; Xu, Z.; Jun, G. Inventory analysis of LCA on steel and concrete-construction office buildings. ENB 2008, 40, 1188–1193. [Google Scholar]
- Nebel, B.; Zimmer, B.; Wegener, G. Life cycle assessment of wood floor coverings a representative study for the German Flooring Industry. Int. J. Life Cycle. Assess. 2006, 11, 172–182. [Google Scholar] [CrossRef]
- Wilson, R.; Young, A. The embodied energy payback period of photovoltaic installations applied to buildings in the U.K. Build Environ. 1996, 31, 299–305. [Google Scholar] [CrossRef]
- European Commission. What is Integrated Product Policy? Available online: http://ec.europa.eu/environment/ipp/ (accessed 20 January, 2009).
- European Commission. What is EPD? In Environmental Product Declaration; European Commisssion. Available online: http://ec.europa.eu/environment/ipp/epds.htm (accessed 20 January, 2009).
- Sun, J.; Han, B.; Ekwaro-Osire, S.; Zhang, H.-C. Design for environment: methodologies, tools, and implementation. J. Integr. Des. Process Sci. 2003, 7, 59–75. [Google Scholar]
- Anderson, J.; Shiers, D.; Steele, K. The Green Guide to Specification, 4th ed.; IHS BRE Press: Watford, UK, 2009. [Google Scholar]
- BRE Global. Methodology for Environmental Profiles of Construction Products: Product Category Rules for Type III Environmental Product Declaration of Construction Products; IHS BRE Press: Bracknell, UK, 2009; (to be published). [Google Scholar]
- Erlandsson, M.; Levin, P. Environmental assessment of rebuilding and possible performance improvements effect on a national scale. Build Environ. 2004, 39, 1453–1465. [Google Scholar] [CrossRef]
- Sun, M.; Kaebernick, H.; Kara, S. Simplified life cycle assessment for the early design stages of industrial products. CIRP Ann-Manuf. Techn. 2003, 52, 25–28. [Google Scholar] [CrossRef]
- Junnila, S.; Horvath, A.; Guggemos, A. Life-cycle Assessment of Office Building in Europe and the United States. J. Infrastruct. Syst. 2006, 12, 10–17. [Google Scholar] [CrossRef]
- Thormark, C. A low energy building in a life cycle-its embodied energy, energy need for operation and recycling potential. Build Environ. 2002, 37, 429–435. [Google Scholar] [CrossRef]
- Jian, G.; Jiang, L.; Kazunori, H. Life cycle assessment in the environmental impact evaluation of urban development-a case study of land readjustment Project, Hyogo District, Japan. J. Zhejiang Univ. Sci. 2003, 4, 702–708. [Google Scholar] [CrossRef] [PubMed]
- Cole, R.; Kernan, P. Life-cycle energy use in office building. Build Environ. 1996, 31, 307–317. [Google Scholar] [CrossRef]
- Yohanis, Y.G.; Norton, B. The early design model for prediction of energy and cost performance of building design options. Int. J. Solar Energy 2000, 20, 207–226. [Google Scholar] [CrossRef]
- Yohanis, Y.G.; Norton, B. Life-cycle operational and embodied energy for a generic single-storey office building in the UK. Energy 2002, 27, 77–92. [Google Scholar] [CrossRef]
- Junnila, S. Life cycle assessment of environmentally significant aspects of an office building. Nordic. J. Surv. Real Est. Res. 2004, 2(Special series), 81–97. [Google Scholar]
- Energy Use in Offices; Carbon Trust: London, UK, 2003.
- Poirazis, H.; Blomsterberg, A.; Wall, M. Energy simulations for glazed office buildings in Sweden. ENB 2008, 40, 1161–1170. [Google Scholar]
- Menzies, G.F.; Wherrett, J.R. Windows in the workplace: examining issues of environmental sustainability and occupant comfort in the selection of multi-glazed windows. ENB 2005, 37, 623–630. [Google Scholar]
- Aizlewood, C.; Edwards, S.; Hamilton, L.; Shiers, D.; Steele, K. Environmental Weighting: Their Use in the Environmental Assessment of Construction Products; IHS BRE Press: Bracknell, UK, 2007. [Google Scholar]
- Hamilton, L.; Edwards, S.; Aizlewood, C.; Shiers, D.; Thistlethwaite, P.; Steele, K. Creating Environmental Weightings for Construction Products: Results of A Study; IHS BRE Press: Bracknell, UK, 2007. [Google Scholar]
- Communities and Local Government. The Code for Sustainable Homes. Available online: http://www.communities.gov.uk/thecode (accessed on 30 August, 2009).
- 1The Kyoto Protocol is an international agreement linked to the United Nations Framework Convention on Climate Change.
- 2The basket comprises the six main gases with a direct greenhouse effect: carbon dioxide (CO2), methane (CH4), nitrous oxide (N2O), hydro fluorocarbons (HFCs), per fluorocarbons (PFCs) and sulphur hexafluoride (SF6).
- 3Building Research Establishment
- 4Danish Building Research Institute
© 2009 by the authors; licensee Molecular Diversity Preservation International, Basel, Switzerland. This article is an open-access article distributed under the terms and conditions of the Creative Commons Attribution license (http://creativecommons.org/licenses/by/3.0/).
Share and Cite
Khasreen, M.M.; Banfill, P.F.G.; Menzies, G.F. Life-Cycle Assessment and the Environmental Impact of Buildings: A Review. Sustainability 2009, 1, 674-701. https://doi.org/10.3390/su1030674
Khasreen MM, Banfill PFG, Menzies GF. Life-Cycle Assessment and the Environmental Impact of Buildings: A Review. Sustainability. 2009; 1(3):674-701. https://doi.org/10.3390/su1030674
Chicago/Turabian StyleKhasreen, Mohamad Monkiz, Phillip F. G. Banfill, and Gillian F. Menzies. 2009. "Life-Cycle Assessment and the Environmental Impact of Buildings: A Review" Sustainability 1, no. 3: 674-701. https://doi.org/10.3390/su1030674
APA StyleKhasreen, M. M., Banfill, P. F. G., & Menzies, G. F. (2009). Life-Cycle Assessment and the Environmental Impact of Buildings: A Review. Sustainability, 1(3), 674-701. https://doi.org/10.3390/su1030674