1. Introduction
During the last few decades, the scientific community has shown a great interest in the so-called Organ-on-Chip (OoC) devices, namely micro physiological systems (MPS) capable of recapitulating human physiology by substituting traditional cell culture methods and the use of in vivo studies. As a matter of fact, the main advantage of MPS vs. the standard 2D flask-based cell cultures is represented by the possibility to integrate in a single chip different cell lines in co-culture approach, sensors, and microfluidic perfusion, with the aim to imitate more accurately the physiological environment and parallelize the experiments [
1,
2]. Among the several studies which can be conducted by MPS in a complex cell culture medium, the monitoring of copper ion concentration in human tissues is of great interest. Copper is an essential trace element present in most of the human tissues and involved in most of biological and metabolic processes. However, if its concentration is outside a specific physiological range, it can lead to various diseases, such as Menkes, Alzheimer, Horn, etc. [
3,
4]. For these reasons, it could be useful to detect copper ions and to monitor its concentration in an in vitro model to study how it affects cells’ vitality. Inserting a sensor inside the microfluidic chip would also allow a direct and in situ measurement of the ion of interest, thus avoiding the use of traditional spectroscopic techniques, such as Inductively Coupled Plasma Spectroscopy (ICP) and Atomic Absorption Spectroscopy (AAS), which are destructive techniques, in addition to being expensive and bulky [
5,
6].
A valid alternative to quantify ions in a solution is represented by Square Wave Anodic Stripping Voltammetry (SWASV), which is an electrochemical technique used for the detection of heavy metal ions in aqueous solutions. It is a fast and low-cost technique which provides qualitative and quantitative information about heavy metals present in a solution. This analytical method consists of two steps: the first is the application of a negative potential to the working electrode where copper ions were reduced to the metallic phase; the second step, instead, consists of a potential scan carried out to bring the metallic copper previously deposited back as an ion to the solution. From this step, we collect the stripping current measurement as a function of the potential, i.e., the voltammogram used to determine ion concentration [
7,
8,
9].
Usually, the quantitative analysis of the voltammogram is performed by evaluating the peak current or the peak area. However, the only information coming from the peak current intensity value may be insufficient to evaluate accurately the concentration of the analyte of interest, especially with a view to develop an automated recognition model. In fact, the co-presence of multiple ions and organic molecules in complex matrices, as in the case of cell culture media, affects the electrochemical measurement, because of the complexity of electrode–electrolyte microenvironment [
10,
11]. In addition, the scientific community, and private companies active on the OoC research field, are supporting the actions aimed at embedding sensors, avoiding any cell culture perturbation or contamination. From this perspective, it could be helpful to consider a holistic approach from the SWASV absolute peak shape, to use as much information as possible from recorded data, and to select the most relevant features (i.e., variables used to perform the analyte and concentration prediction). Ye et al. have proved that the peak shape of the stripping voltammogram allows the discrimination of heavy metal ions with a high accuracy, without using absolute values of currents and potentials [
12]. Liu et al. have demonstrated that using a selected set of features, extracted from stripping currents, provides more accurate models compared to those obtained by using the single peak value or the full stripping current. Indeed, the model carried out using the single peak value is a univariate linear model that does not consider mutual interferences among ions, whereas the full stripping current considers a lot of redundant information, unnecessary for the classification [
10].
For a better interpretation of the electrochemical measurements, chemometric techniques were recently introduced. They allow for the selection of the most relevant chemical information to develop specific mathematical models starting from experimental data, instead of using theoretical and pre-existing fitting models [
13]. Moreover, chemometrics is used in electrochemistry when it is hard to extrapolate a physic-chemical model of the involved processes, due to electrode reactions, transport phenomena or a combination of both [
14].
In this context, Machine Learning (ML) models have increasingly spread in analytical chemistry fields, thanks to their capability of processing a large amount of data and to develop a multivariate analysis model which takes into consideration all the most relevant parameters [
15,
16,
17]. In fact, supervised methods of machine learning can analyze the relationship between the variables used to perform the prediction (‘’features’’) and the responses to be predicted (‘’labels’’) and then they use the discovered relationship to predict, in an automated way, the output of new SWASV records. Different machine learning approaches to fit data can be considered, leading to different classification accuracies.
In this work, experimental data obtained from the SWASV measurements in cell culture media were exploited to develop a recognition model that allows for obtaining, from a single measurement made by the same sensor, the correct quantification of copper ion concentration. Moreover, a pH evaluation was performed by using two different conditions: physiological condition (pH 7.4) and acidic condition (pH 4). This last condition is useful to improve the electrochemical signal and obtain a peak with a better shape definition that could help in the classification process. This study represents a preparatory investigation about the use of electrochemical methods for the determination of copper ion concentration in the Organ-on-Chip devices and is focused on a comparison among four machine learning approaches, i.e., decision tree, SVM, Naïve-Bayes and neural network, to compare detection accuracies. The resulting trained models were used to forecast new voltammograms starting from their extracted features.
This work demonstrates that the combination of machine learning techniques with anodic stripping voltammetry improves the analytical accuracy of copper ions’ quantification in complex systems, like cell culture media.
2. Materials and Methods
2.1. Reagents and Instruments
A solution of anhydrous copper (II) sulphate 0.01 M in 0.1 M nitric acid was prepared to ensure the complete salt dissolution. The copper sulphate solution was further diluted in phosphate buffer up to a concentration equal to 10−4 M. Working solutions were prepared starting from a 10−4 M solution by diluting with cell culture media (solutions at physiological pH = 7.4).
The cell culture media used are Minimum Essential Medium Eagle (MEM) purchased from Corning (Corning, NY, USA), Dulbecco’s Modified Eagle’s Medium—high glucose (DMEM) from Sigma Aldrich (St. Louis, MO, USA) and Kaighn’s Modification of Ham’s F12 (F12K) was supplied by ATCC (Manassas, VA, USA). All these cell culture media are composed of a combination of nutrients, such as carbon source, vitamins and amino acids, that are necessary for cellular growth.
For the measurements in acidic conditions (pH = 4), the cell culture media with copper sulphate were further diluted with buffer acetate at pH 3.6 in a volume ratio 1:1. In this way, there were prepared solutions in the range 1 ÷ 20 µM of Cu2+ (1, 2, 5, 10 and 20 µM), in two different pH conditions (physiological at pH = 7.4 and acidic at pH = 4). The pH variation in acidic condition is due to the exceeding of buffer capacity of the cell culture media. Indeed, the cell culture media can be considered as a phosphate buffer and, when a large quantity of acidic solution is added, its buffer capacity is exceeded, and the obtained solution can be considered as a pH 4 buffer acetate.
The SWASV measurements were performed using a single-channel potentiostat/galvanostat workstation (Ivium Vertex One, Ivium Technologies B.V., Eindhoven, The Netherlands). A three-electrode system was used to collect SWASV curves: (i) a circular working electrode, 3 mm diameter, realized by gold thin film evaporation (200 nm thick) on 4” silicon/silicon oxide substrate (ii) a stainless-steel counter electrode and (iii) Ag/AgCl/saturated KCl reference electrode (+0.197 V vs. SHE).
2.2. SWASV Data Acquisition
Before SWASV measurements, gold electrodes were cleaned by performing 10 cyclic voltammetry cycles in diluted H2SO4 (50 mM) in the potential range −0.3 ÷ 1.5 V vs. Ag/AgCl.
A SWASV measurement consists of two steps: deposition and stripping. In the deposition step, copper ions were reduced to metallic copper onto the gold electrode surface by applying a negative potential (−0.4 V vs. Ag/AgCl for 30 s).
The stripping step, instead, consisted of the oxidation of metallic copper, previously deposited, and was conducted in the potential range −0.4 V ÷ 0.7 V (pulse amplitude 30 mV, frequency 25 Hz and E step 4 mV). From this step, we obtained the electrochemical record (voltammogram) for the ion concentration measurement. For each condition of copper ion concentration and pH in cell media culture, three electrochemical measurements were carried out.
2.3. Pre-Processing, Features Extraction and Data Augmentation
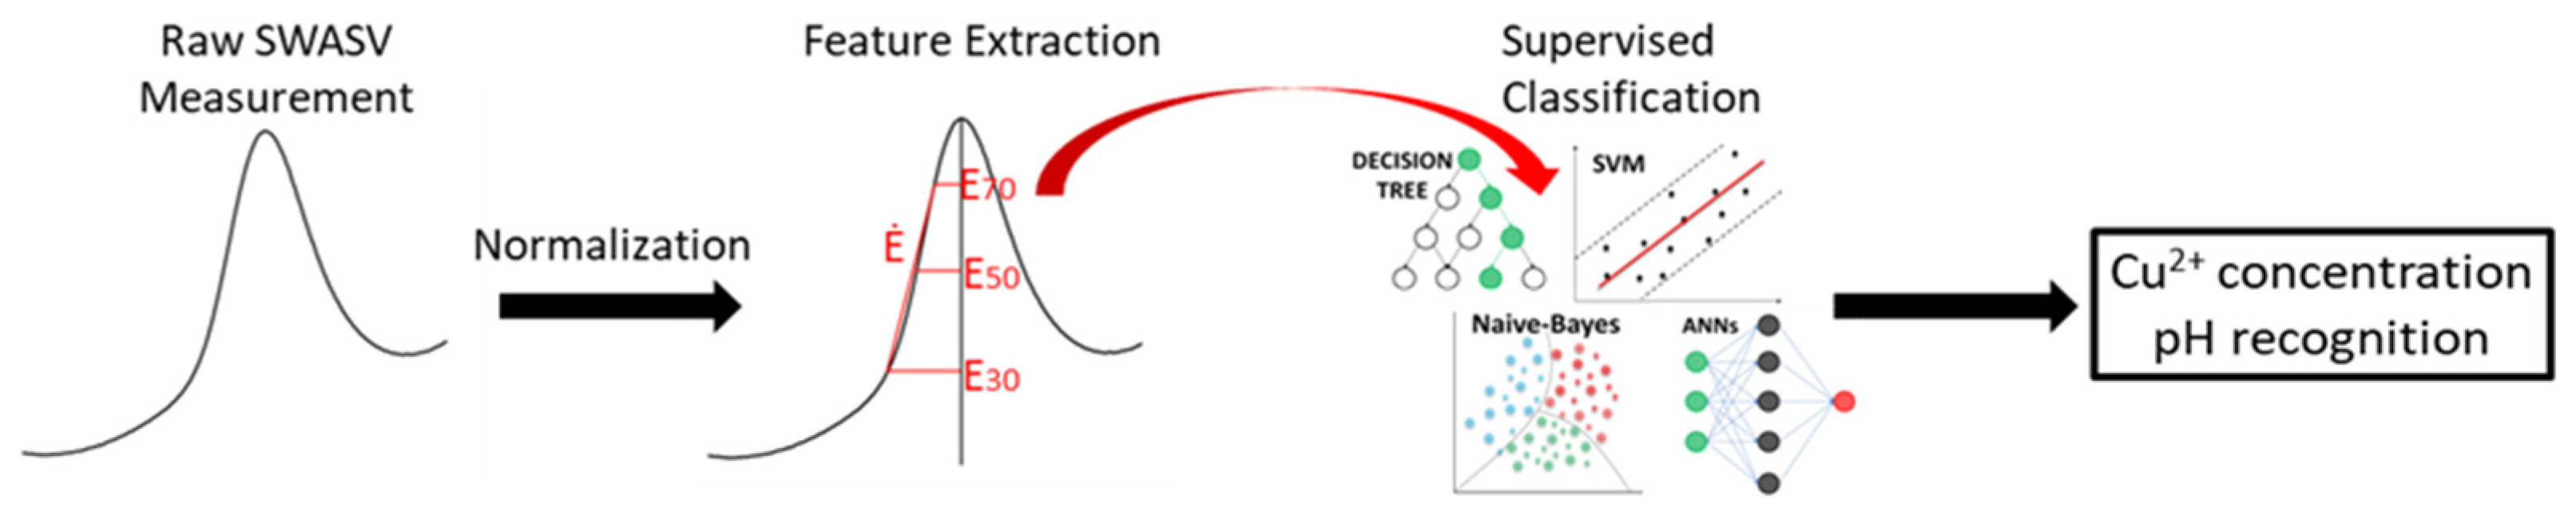
The processing of the experimental data requires a pre-processing procedure composed of two main steps: (1) baseline correction and (2) normalization on Ipeak.
Figure 1 shows the pipeline of the main steps followed. The first step is necessary to start all scans from the same level and, therefore, to eliminate any current bias accumulated by the instrument [
18]. Subsequently, the second current normalization is made referring to the peak current value, so that all current intensity values fall within the range (0–1). Generally, a normalization is made to obtain the same range of input values and to ensure a stable convergence of the mathematical method. The aim of pre-preprocessing steps is also to remove all irrelevant information. In this way, normalized voltammograms were obtained which consider the peak shape, removing any absolute current and potential value effects. Moreover, a greater relevance to peak shape is given, together with the capability to extract more information than the only peak amplitude.
After normalization, a MATLAB script was developed to extract the features of interest. The aim of the features’ extraction is to obtain values that are significant for recognition and discrimination of different labels. As a matter of fact, the availability of a greater number of features related to a peak’s shape allows for a more accurate classification. In this work, “left-side” values of the measured peaks were considered, since the features’ extraction from the “right-side” is more difficult at potentials greater than the copper oxidation potential especially at very low concentrations, due to an ascending current probably linked to the oxidation process of water.
The extracted features are, therefore, half the width of the peak at different levels, i.e., at 30, 50 and 70% (E0.3, E0.5 and E0.7) of the maximum intensity; then, we have the ratio E0.3/E0.7 and the derivative in the ascending part of the peak, which ensures a series of geometric characteristics that result in being useful in the subsequent recognition phase.
As already reported in the Introduction section, the main objective of this paper is to compare different ML approaches for accuracy evaluation of copper ion quantification in complex systems.
Supervised ML models are being successfully used to respond to a whole range of classification problems in different research areas. However, these models are data-hungry, and their performance relies heavily on the size of available training data. In many cases, it is difficult to create training datasets that are large enough. In the present work, this issue is emphasized by the cost to perform a specific measurement, linked greatly to the use of expensive reagents and solvents. To overcome this problem, the technique known in the literature as Data Augmentation was implemented.
Data augmentation, in data analysis, is a technique used to increase the amount of data by adding slightly modified copies of already existing data or newly created synthetic data from existing data. It acts as a regularizer and helps to reduce overfitting when a ML model is trained.
Specifically, in this paper, we focus on Features space Data Augmentation (FDA) methods to improve the classification performance of the output categories [
19]. Five widely different feature space data augmentation methods were evaluated to expand our dataset. Considering the nature of the available data, the well-known “random perturbation” method was selected [
19]. Each experimental value was randomly perturbed in a well-defined neighborhood that was valued from standard deviations of each group (fixed concentration and pH) of experimental data. In this way, other seven values were carried out from each real measurement, which can be considered as equivalent to the real ones.
2.4. Supervised Classifiers
For the final classifier layer, specific ML classifiers have been selected among those that resulted in being the most promising in previous studies, and compared, such as Decision Tree (DT), Support Vector Machine (SVM), Naïve-Bayes (NB) and Artificial Neural Networks (ANNs). Supervised machine learning algorithms are first trained with a labelled training dataset to develop the underlying relationship between input and output. The trained algorithm is then used to categorize test data into predefined labels.
In this study, we employed four kinds of algorithms to improve detection accuracy of Cu2+ concentration. Experimental data were classified using the Classification Learner Toolbox (MATLAB 2021b).
Machine learning algorithms reported above and used for identification are briefly described:
DT is an algorithm used as a predictive model. It uses a flowchart such as a tree structure where features are represented by internal nodes, class labels are represented by leaves, and conjunctions are represented by branches [
20].
SVM is a classification and regression method developed to discover nonlinear relationships. It denotes a set of examples, known as support vectors, that seem to be the most relevant observations for target classes. Kernel is used to improve flexibility for nonlinear data adding more features to fit a hyperplane instead of a two-dimensional space. Most used kernels are the linear kernel, polynomial kernel, and radial kernel [
21].
NB is a classifier based on Bayes theorem for probabilistic classification. It is easy and quick to implement, and it assumes that variables are independent of given classes. In fact, parameters can be trained separately, and this implies a simplification in computational operations [
22].
ANNs are modeling tools that simulate human brain processes. They present a better ability to adapt and learn and have a stronger fault tolerance [
23].
In the present work, the optimal selected parameters for each classifier were obtained through a grid search technique [
24], and they are reported in
Table 1.
2.5. Evaluation of Model Performance
For each classification, 288 samples were used (144 in MEM pH 7.4 and 144 in MEM pH 4).
The information about a classification ML model’s performance is typically summarized into a confusion matrix. This matrix is built by comparing the observed and predicted classes for a set of observations. It contains all the information needed to calculate most of the classification performance metrics. Among them, Accuracy (
Acc) is one of the most common. It represents the proportion between correctly predicted observations and all the observations.
Acc can be expressed by the following formula:
where the value reported in the numerator (the sum of
TP—True Positive and
TN—True Negative) represents an outcome where a specific model predicts in a correct way both the positive and negative classes. On the other hand, the value given in the denominator (the sum of
TP—True Positive,
TN—True Negative,
FP–False Positive and
FN–False Negative) represents the total number of made predictions.
Table 2 details the terms used in the “accuracy” formula that is introduced above.
Moreover, to verify the generalization ability of our proposed model, the evaluation method called K-fold cross validation was applied, since it is a method that is easy to comprehend, works well for a limited data sample and also offers an evaluation that is less biased, making it a popular choice [
25]. The selection of a good value for k is fundamental. It is important to highlight that a poor value for k can result in a poor evaluation of the model’s abilities. Here, we set the value of k = 10. Consequently, we have split our data randomly into 10 parts, and 9 of those parts (90% of samples) were used for training, whereas 1 part (10%) was reserved for testing. The procedure was repeated 10 times each time reserving a different tenth for testing.
3. Results and Discussion
The aim of this work is to study SWASV measurements in cell culture media through machine learning models with the idea to obtain an automatic recognition method of copper ion concentration and pH evaluation.
Electrochemical measurements were performed in a cell culture media in physiological and acidic conditions (pH 7.4 and pH 4) in a range of Cu
2+ concentration between 1 and 20 µM.
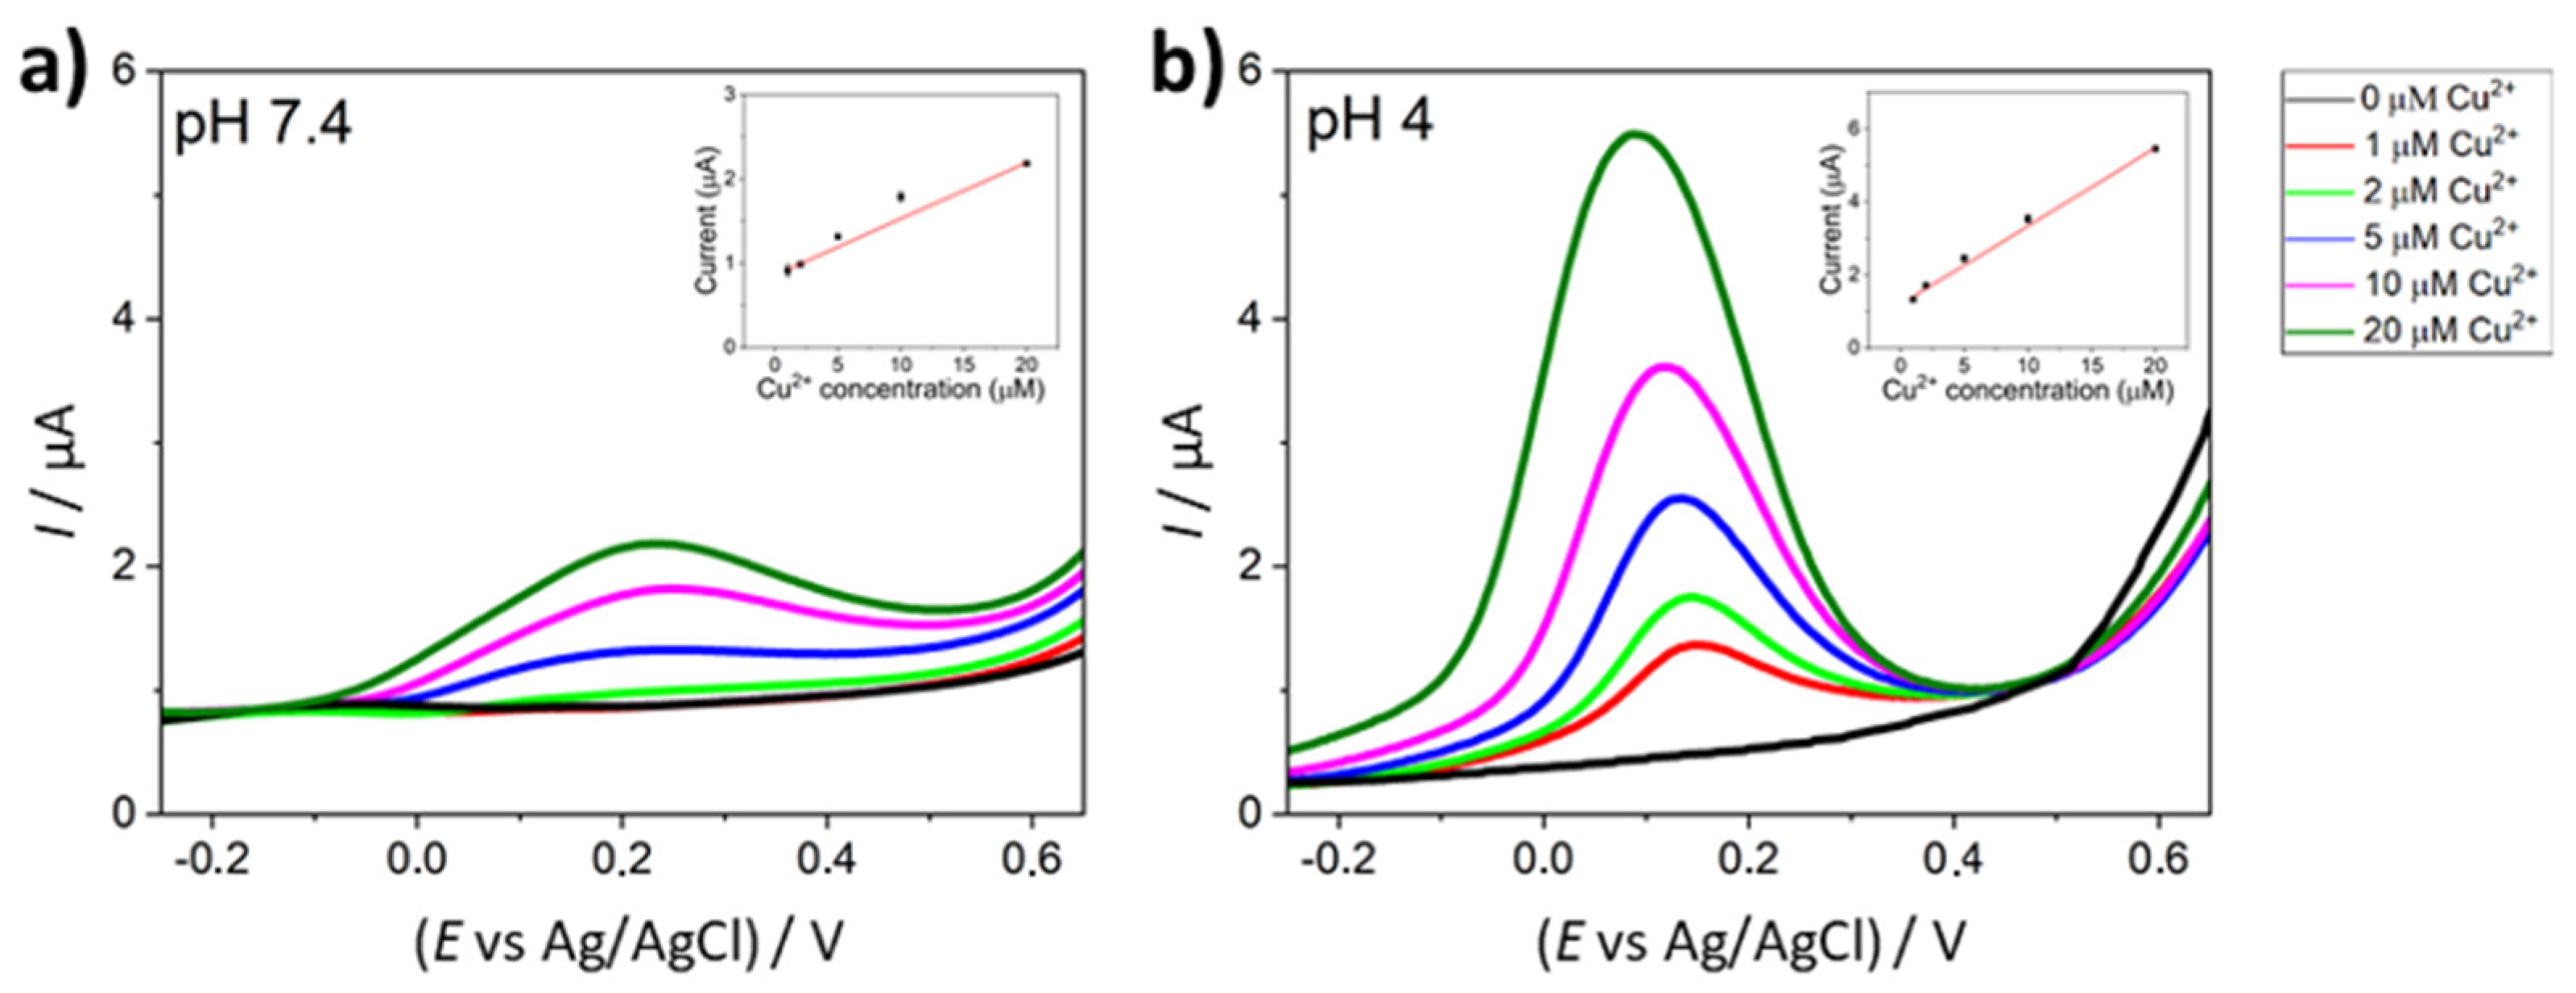
Figure 2 depicts the SWASV measurement performed for each Cu
2+ concentration in the range 1–20 µM and at physiological (
Figure 2a) and acid (
Figure 2b) conditions. A linear correlation between copper concentration and the current intensity peak in both conditions is evident, as shown in the insets of
Figure 2a,b. However, the acidified media are more responsive since the pH of the solution influences the equilibrium between free copper ions and complexed copper, that does not take part in the anodic stripping process.
Starting from these records, the two aforementioned pre-processing steps were applied, i.e., the elimination of current bias and the normalization respect Ipeak.
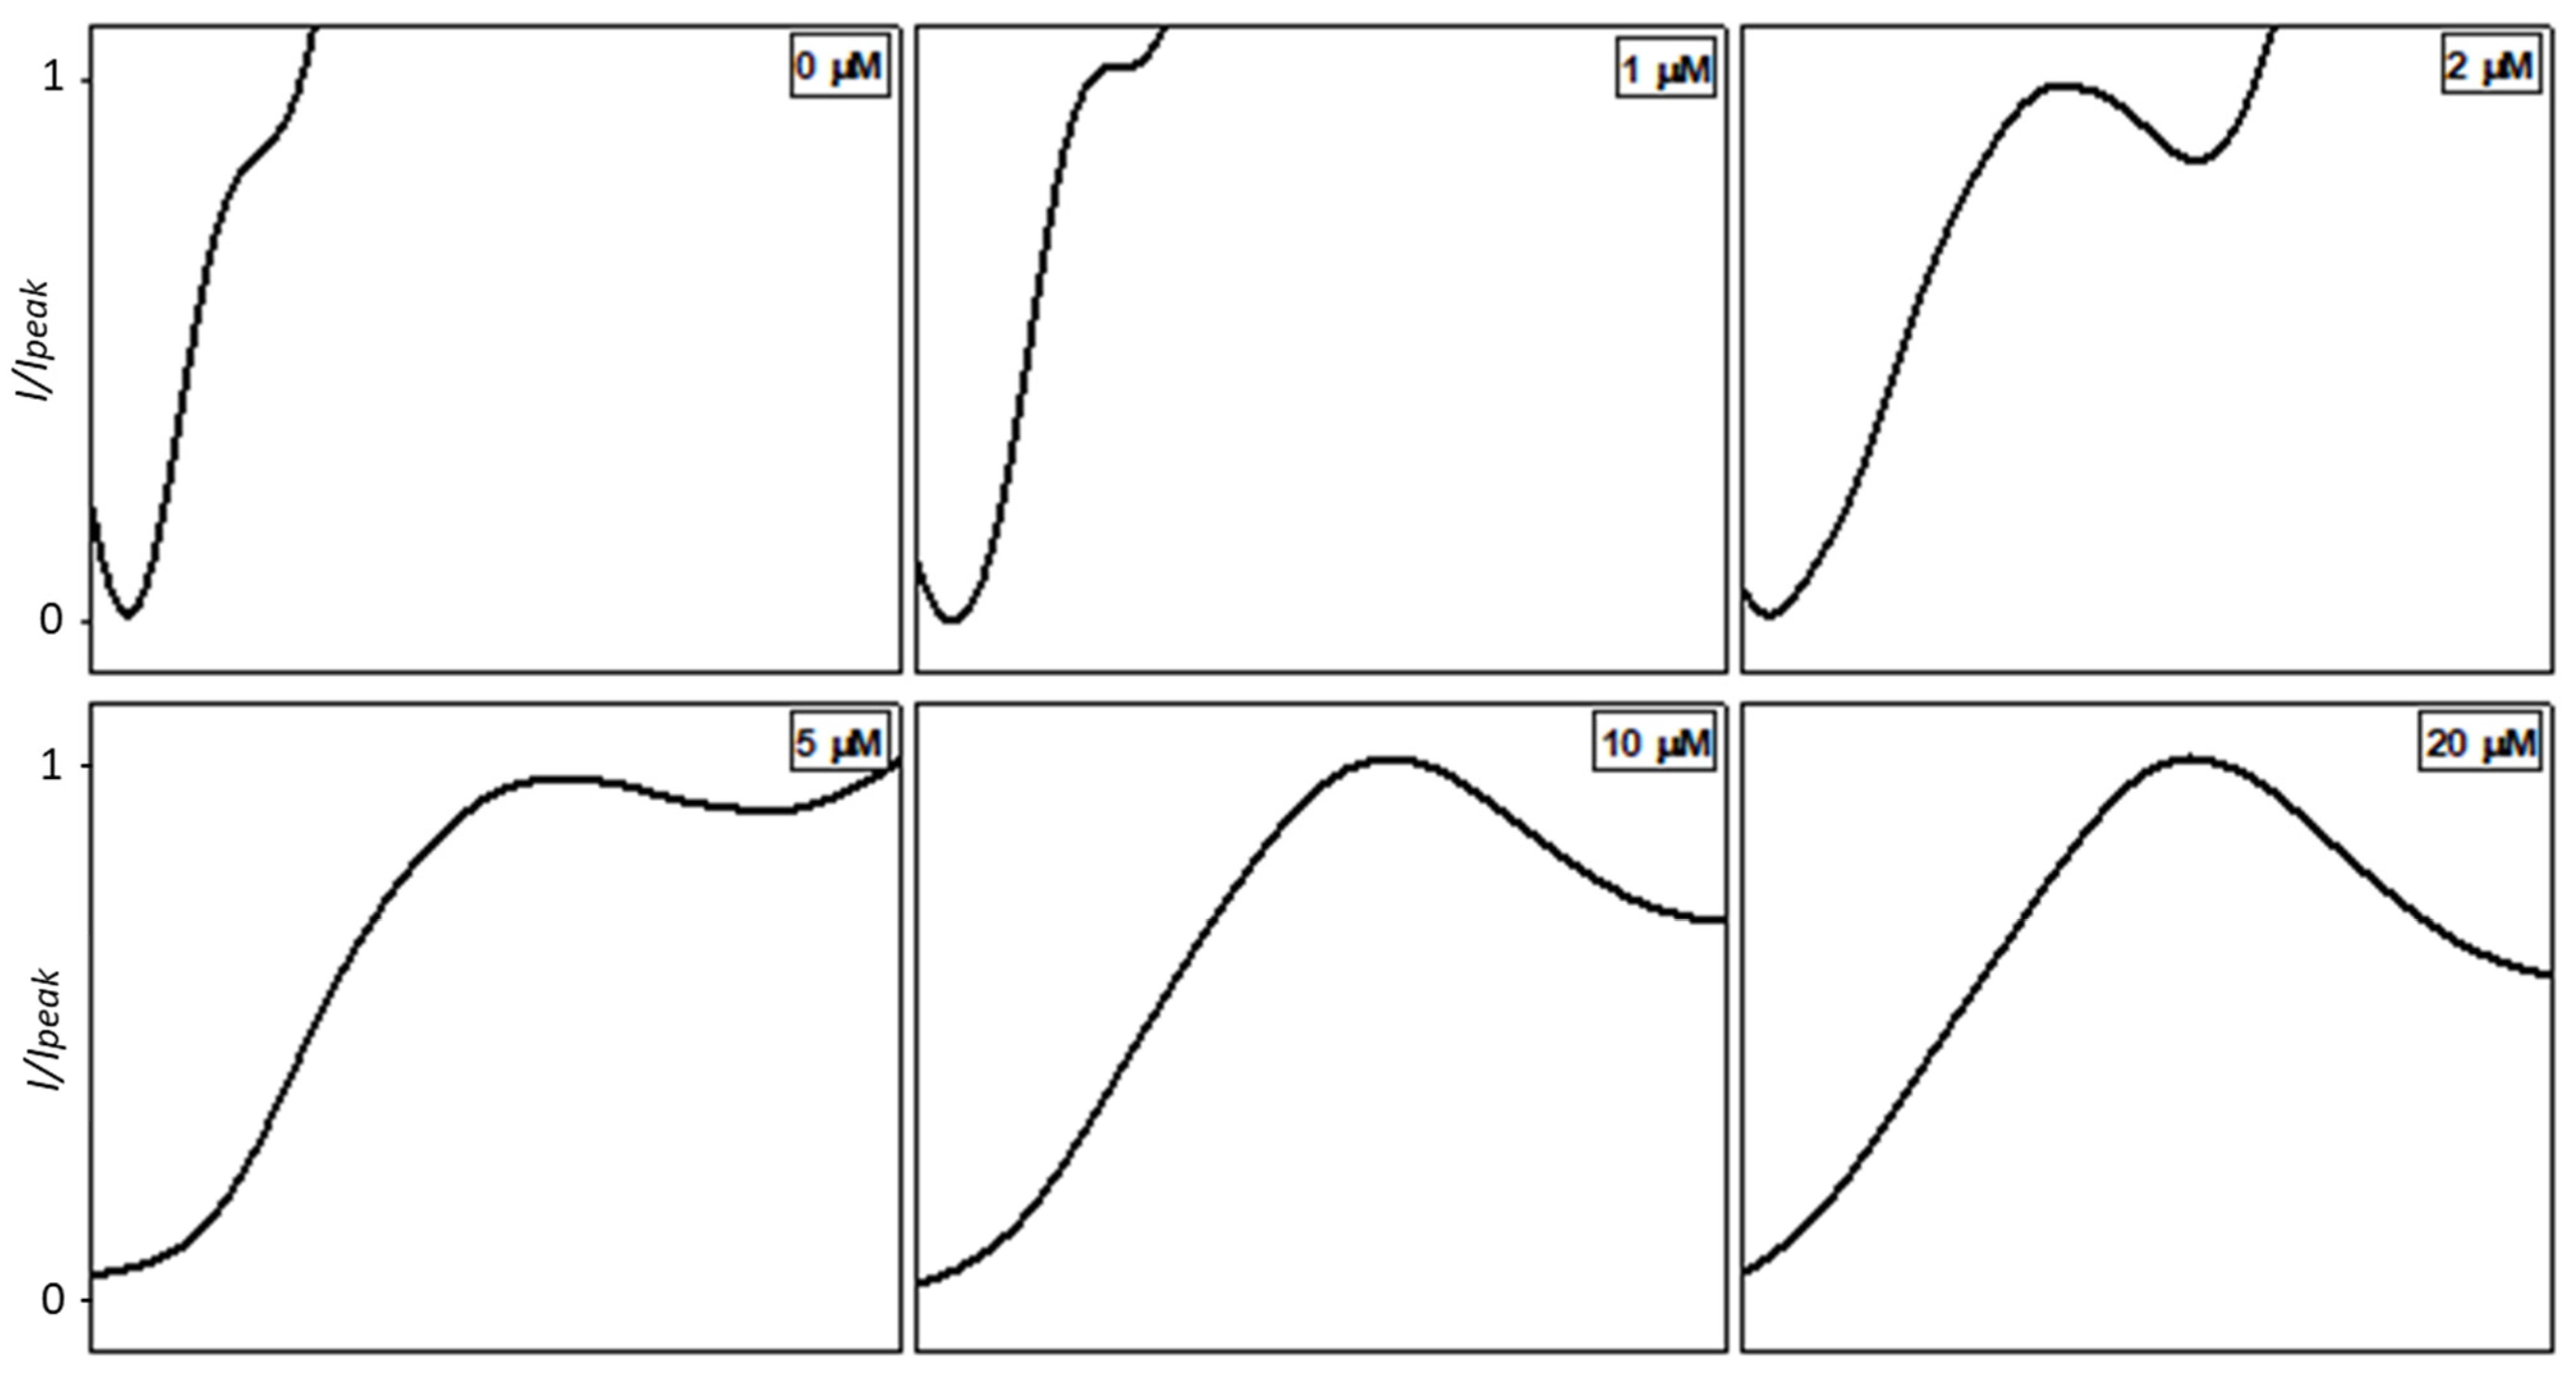
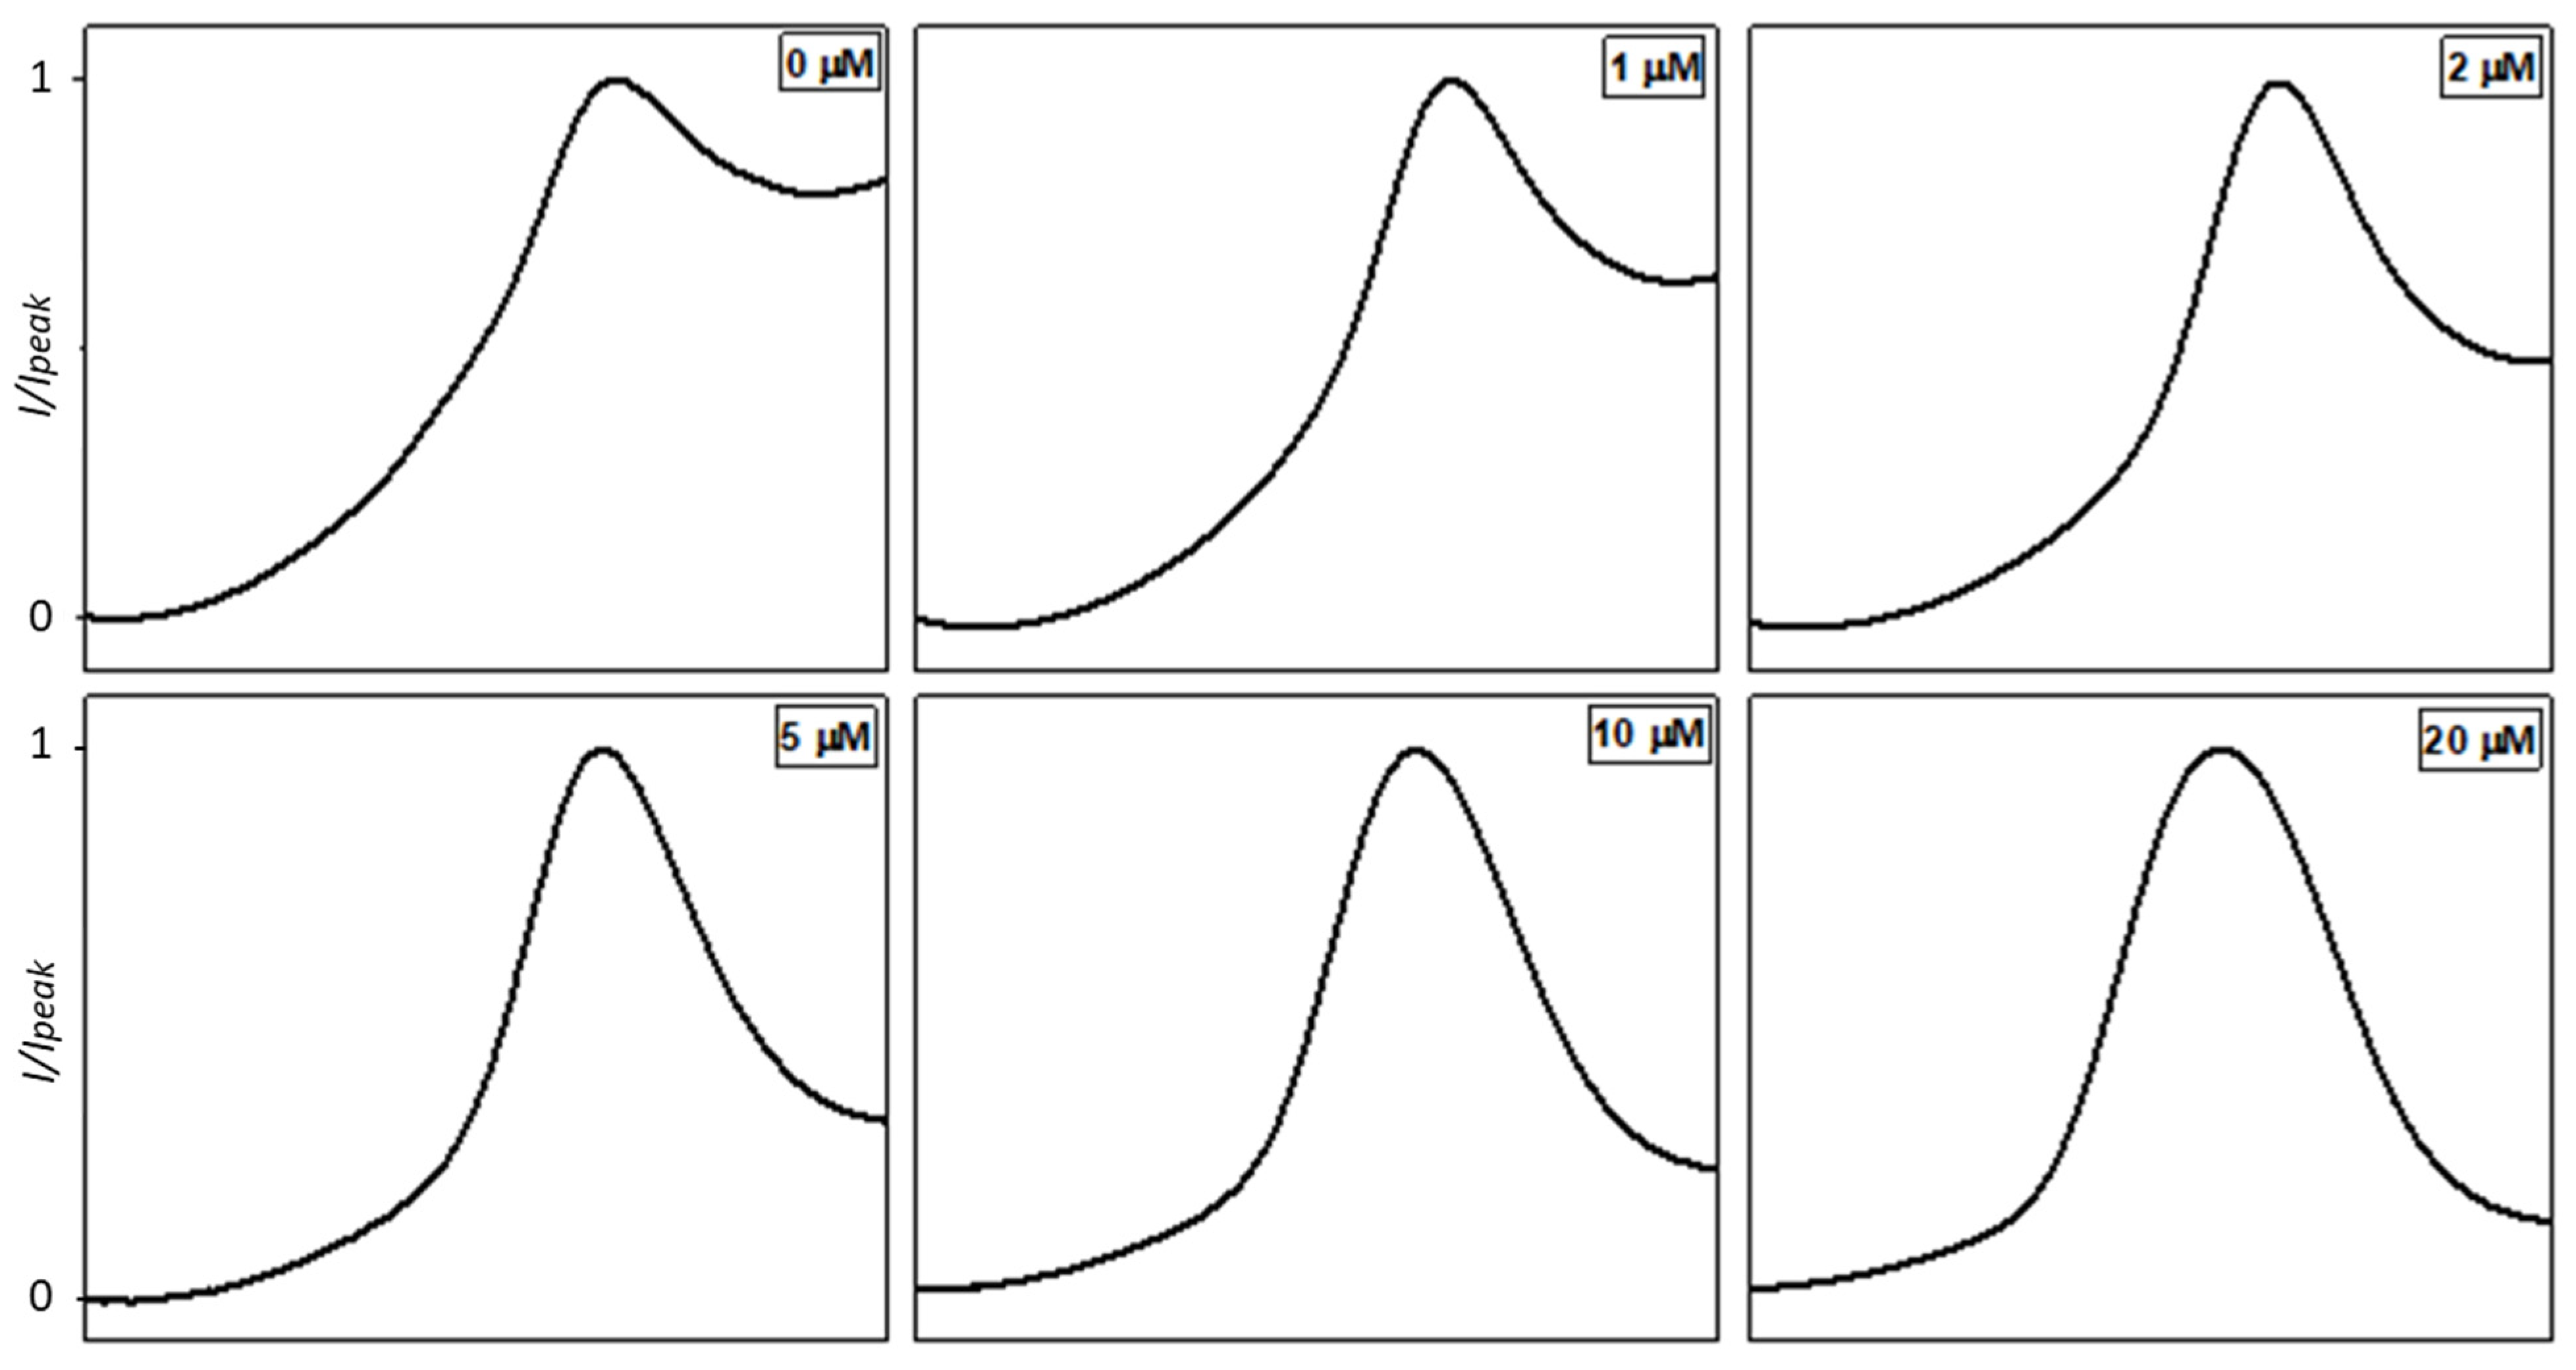
Figure 3 and
Figure 4 show the obtained normalized voltammograms for physiological and acid conditions, respectively. The potential range of
Figure 3 is between −0.2 V and +0.5 V vs. Ag/AgCl, while that of
Figure 4 is between −0.3 V and +0.4 V vs. Ag/AgCl. The potential is deliberately not shown in the figures since the objective of the reported method is to classify the peaks according to their shape and not to their potential and current.
In both cases, a gradual transformation of peak shapes is evident with the increase of copper concentration, thus confirming the validity of our classification idea using a normalized peak shape instead of peak current/area.
In physiological conditions, the shape develops from a broader shape to a more defined peak (
Figure 3). The reason is that, at low concentrations in physiological conditions, the copper ions peak is quite small and comparable to the baseline. At the lower concentrations, an increasing current is visible probably related to water oxidation and such currents tend to cover the peak shape of Cu
2+ SWASV. In contrast, in acidic conditions, the considered peak is more defined and symmetric, also at low ion concentrations (
Figure 4).
To validate the proposed pipeline and select the best machine learning approach, a comparison between chosen algorithms was performed. A step-by-step analysis was conducted for the identification of the initial copper ion concentration at a defined pH condition and then with the whole dataset.
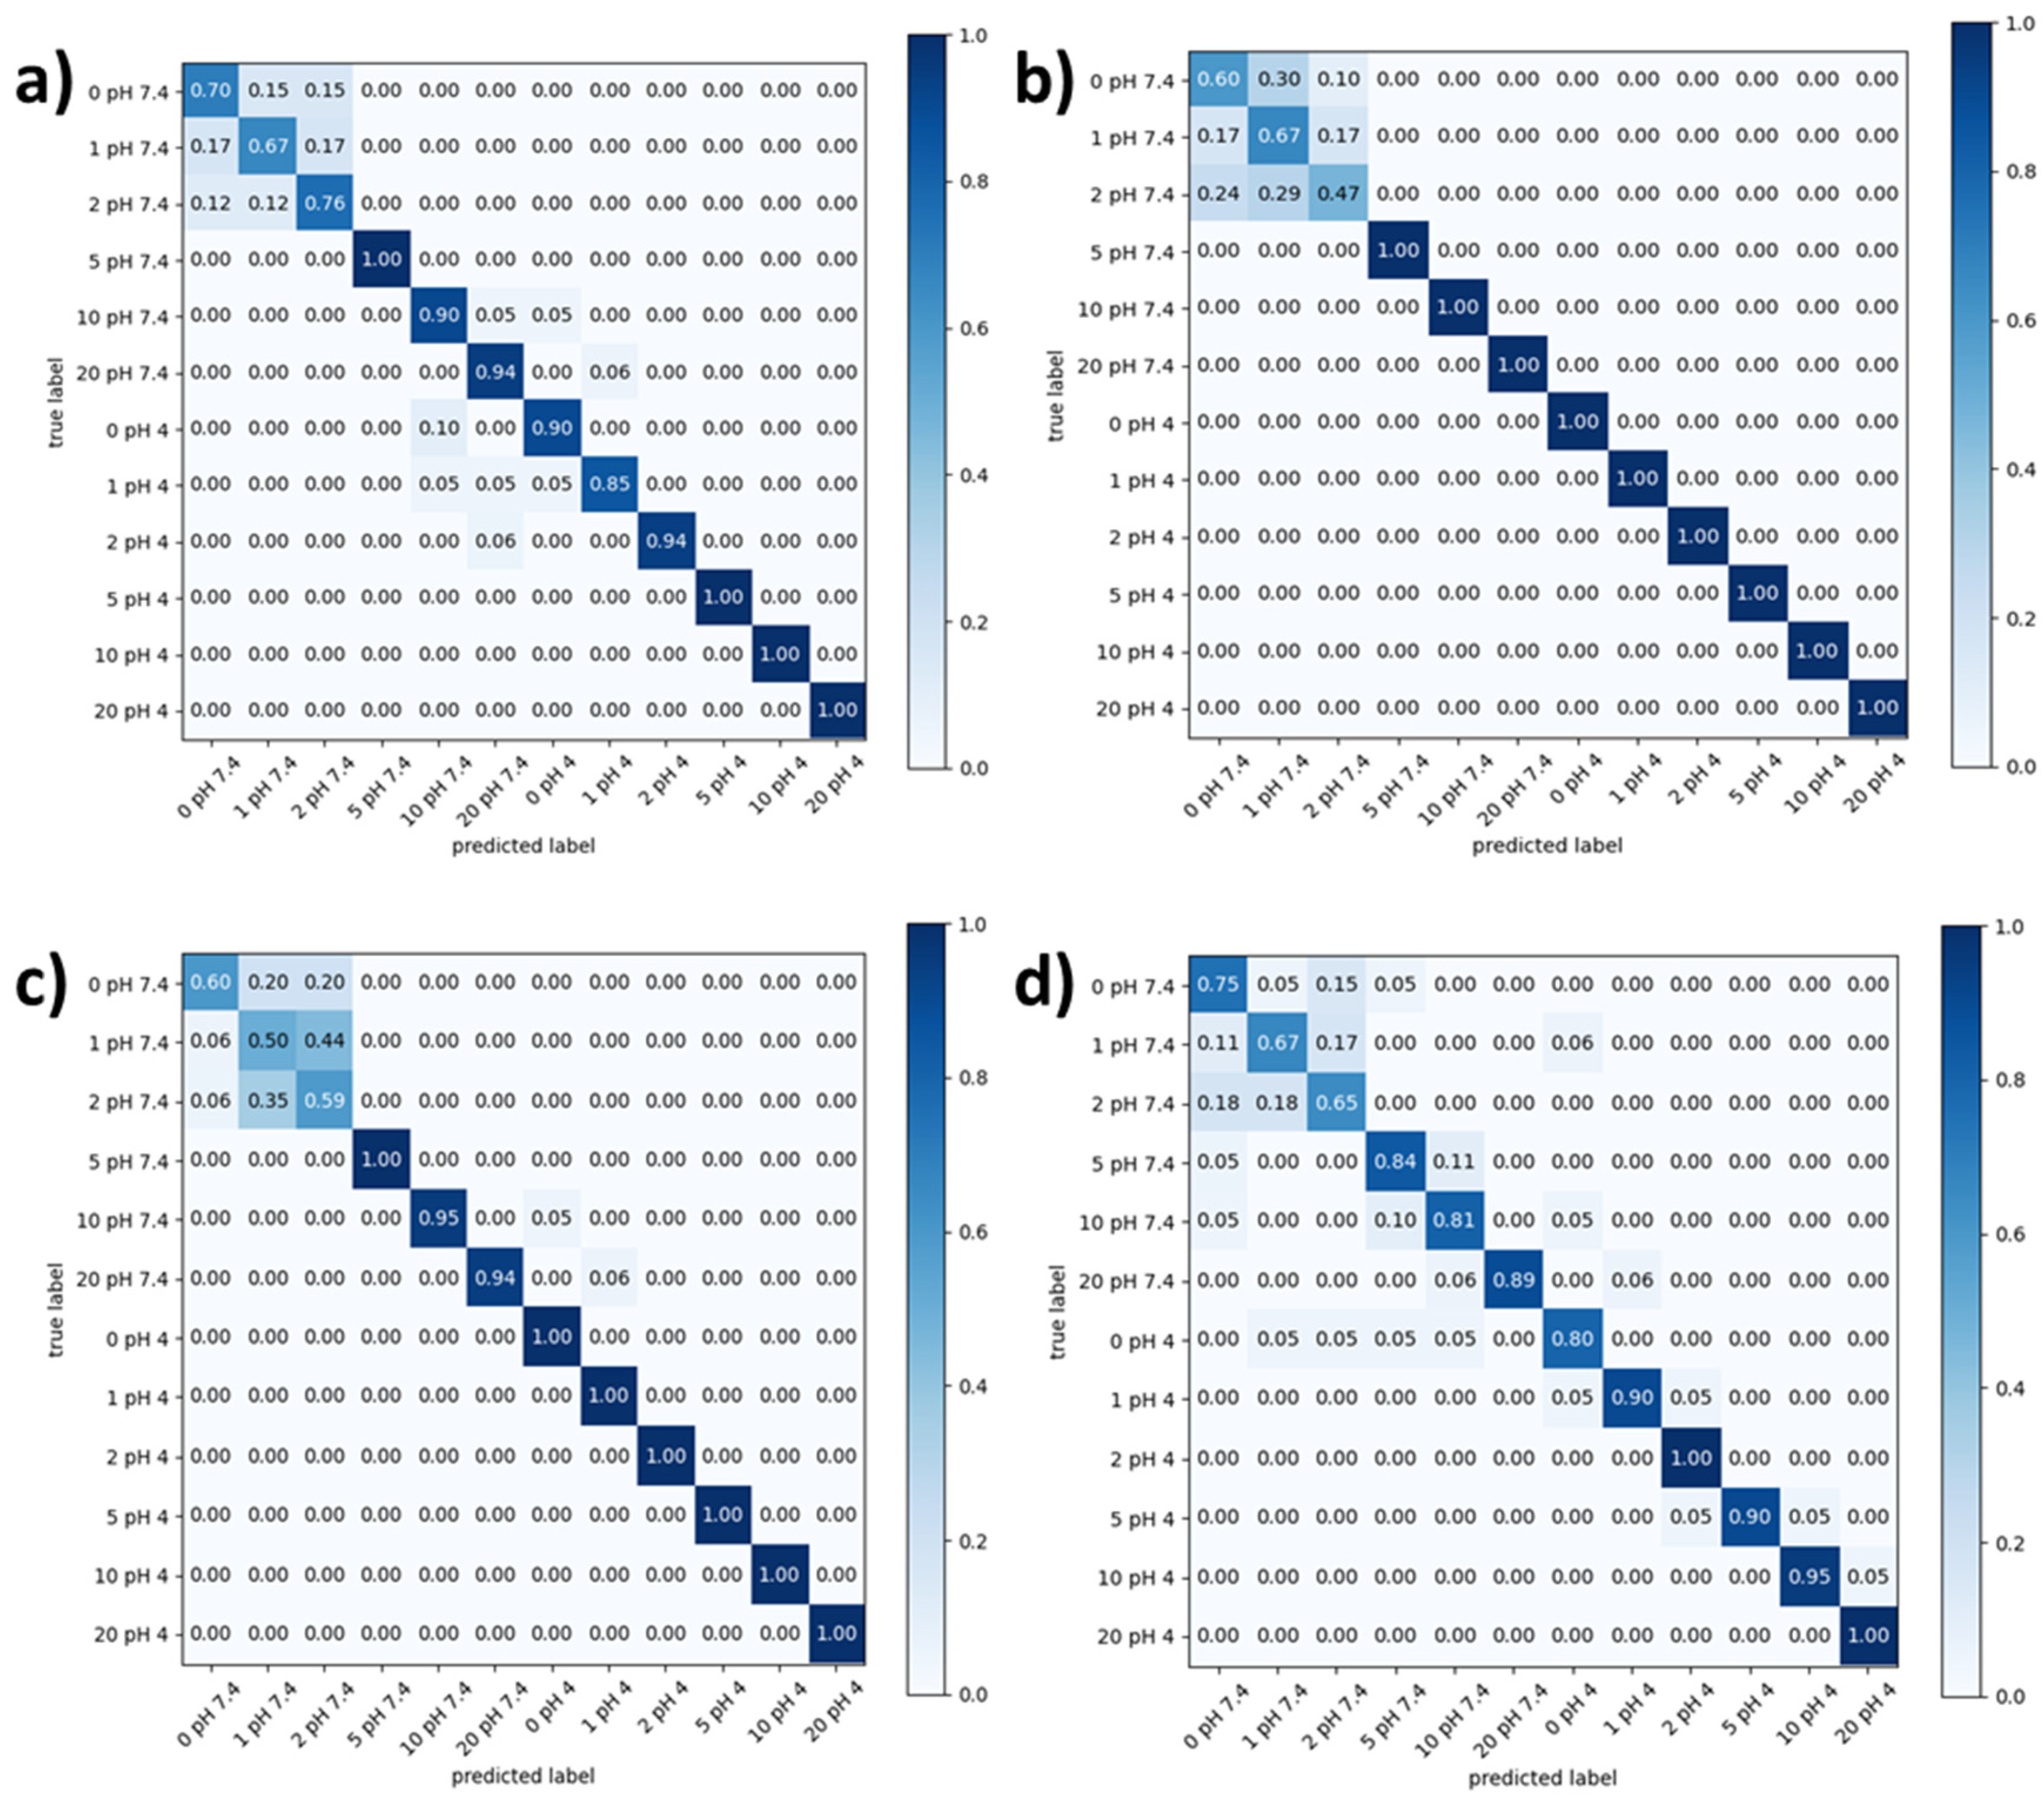
Firstly, confusion matrices were calculated separately at the two pH values considered for the experiments. As deducible from
Figures S1–S4, the results show that, in acidic conditions, there is a clear distinction in the labeling output response, and this involves a remarkable discrimination in concentration. Consequently, features extracted from these measurements are also well-defined and distinct from each other. On the other hand, confusion matrices in physiological condition present a higher confusion percentage, especially at low concentrations (0–2 µM). This behavior is due to the overlapping of extracted features at the considered condition. Nevertheless, the SVM classifier shows a testing accuracy of 82.8%, and it turns out to be the best one.
These accuracies can be considered as very good results, considering that, during real cell culture experiments, it is impossible to perform in acidic pH conditions (cells’ death risk); thus, this reliable method to predict ion concentration avoiding medium acidification and contamination represents an enabling tool technology for continuous OoC devices monitoring (ions and pH, as described below).
Afterward, the two different datasets were combined to elaborate a new forecasting model with both acidic and physiological conditions (pH 4 + pH 7.4) to investigate if extracted features from normalized voltammograms can discriminate copper ion concentration in the same media but in two different pH conditions. In this way, we aimed to obtain a detection model of the media’s pH, since it influences the electrochemical measurements and the peak shape.
Even if the experiments conducted in physiological conditions led to a decrease in the prediction performance, the global models’ accuracies show good results. In fact, labels in different pH conditions are not confused, and this behavior is remarkable in pH evaluation (
Figure 5).
It is also worth noting that, even when the classifier makes a mistake in labeling, the confusion is between two bordering classes, i.e., similar concentrations.
Classifiers rarely confuse different concentrations, confirming their high reliability in the identification of gradual variation of normalized voltammograms and features’ values.
A common trend between all classifiers is that, at low copper ion concentrations and at physiological pH, there is the largest confusion in labels discrimination.
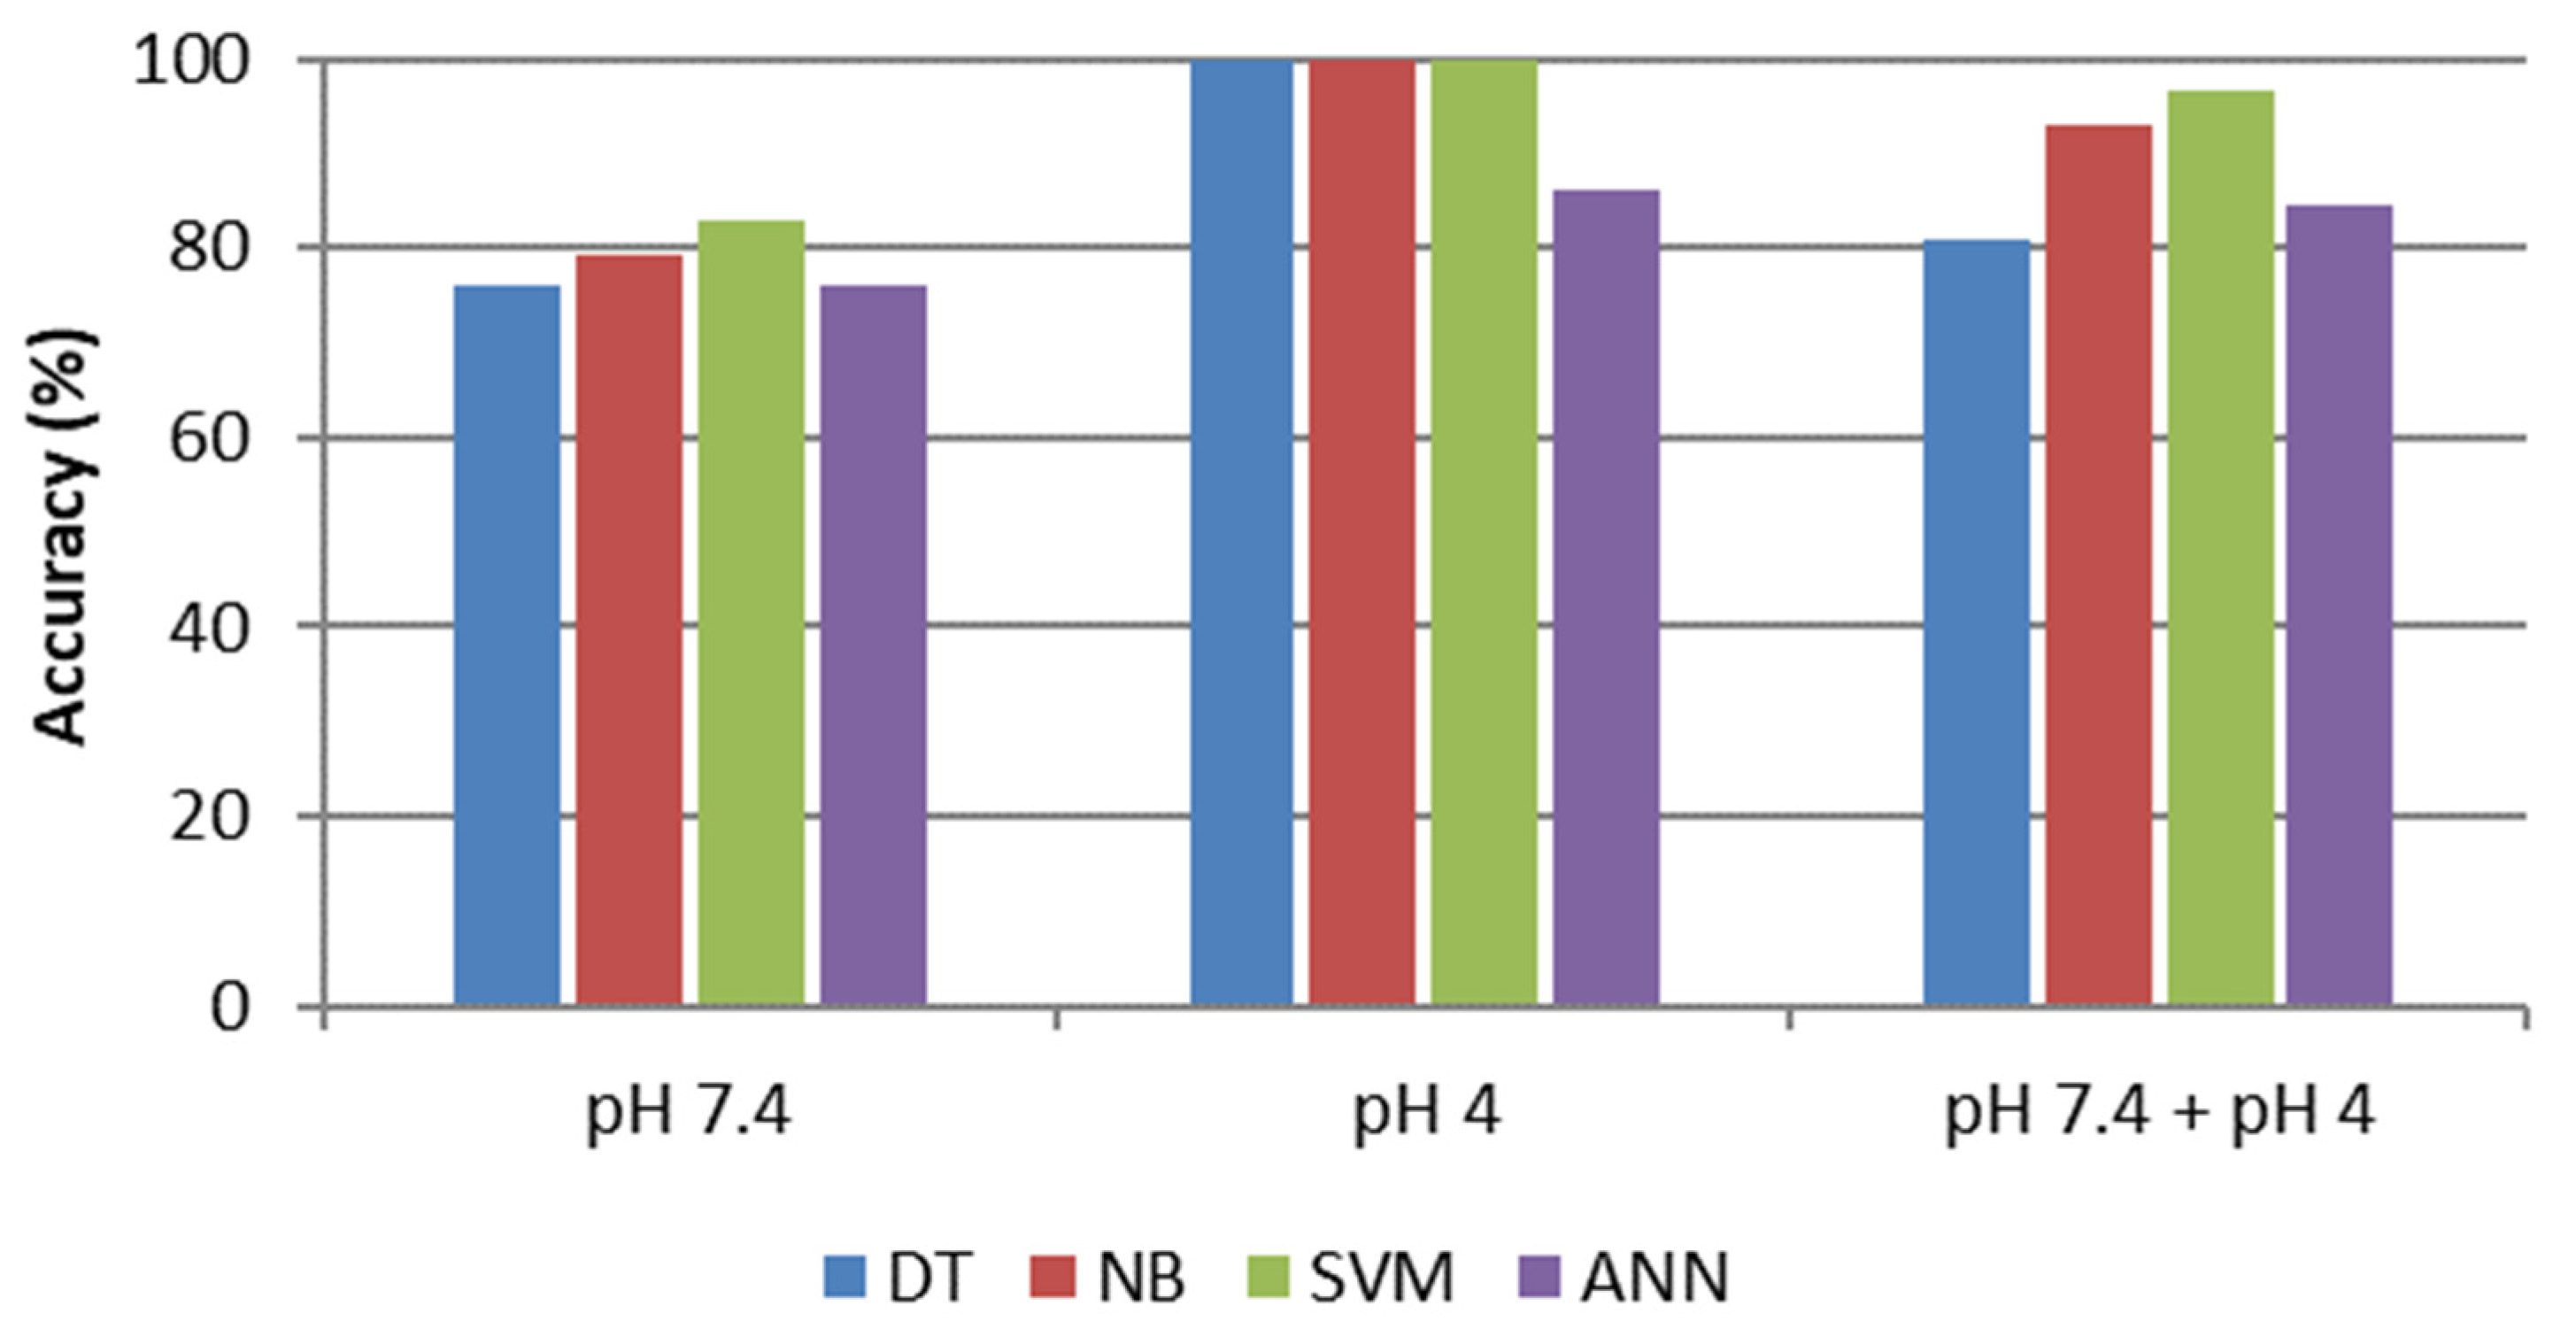
The main remarks that can be deduced from the presented analysis are the following. First, considering the metrics reported in
Figure 6, the four classifiers trained with the whole dataset present a testing accuracy with a clear difference in results. The SVM classifier has 96.6% accuracy, which is 19.26% more than the worst case (i.e., DT) and presents better accuracy results than NB and ANNs, respectively 3.76 and 14.32%.
Furthermore, we conducted the same type of classification in other cell culture media, specifically DMEM and F12, to avert the influence of the considered media on the classification method. As reported in
Supplementary Information (Figures S5–S12), confusion matrices have an analogous trend in the three different investigated cell culture media. This result helps to conclude that the selected features for our investigation can discriminate labels, making the developed models more generalizable and suitable for other media, obtaining analogous results.
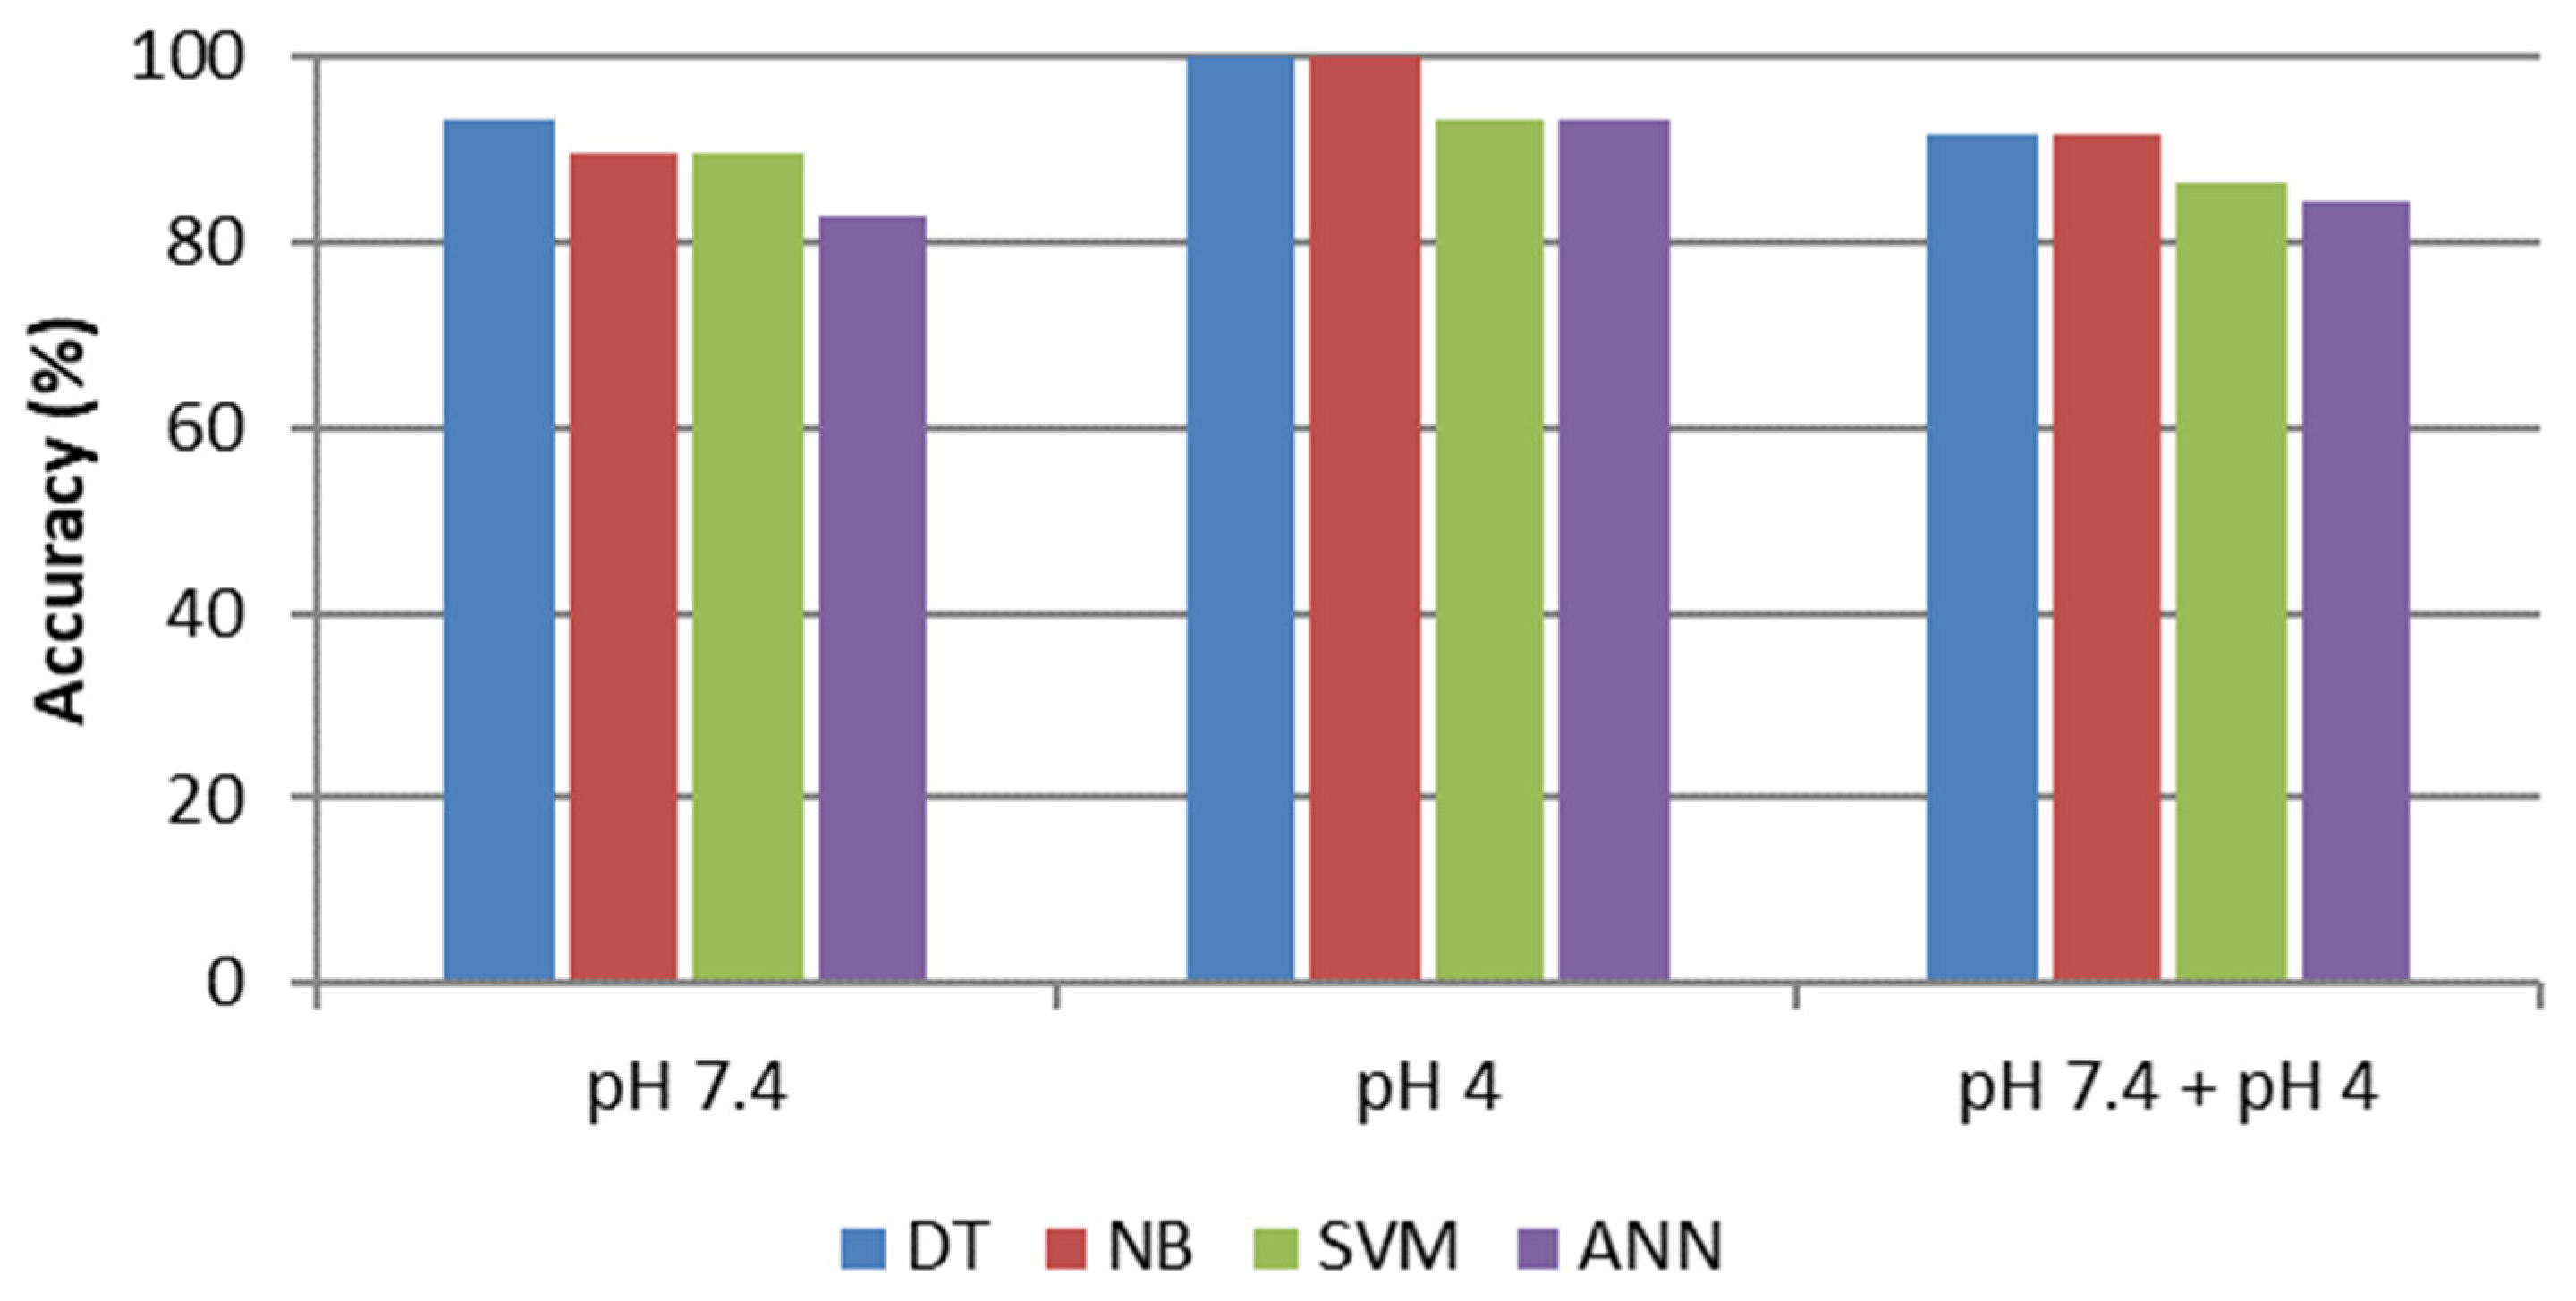
In case of DMEM (
Figure 7) culture media, the best classifiers with the whole dataset are DT and NB (91.4%), even if also other classifiers present similar values (86.4% for SVM and 84.5% for ANN).
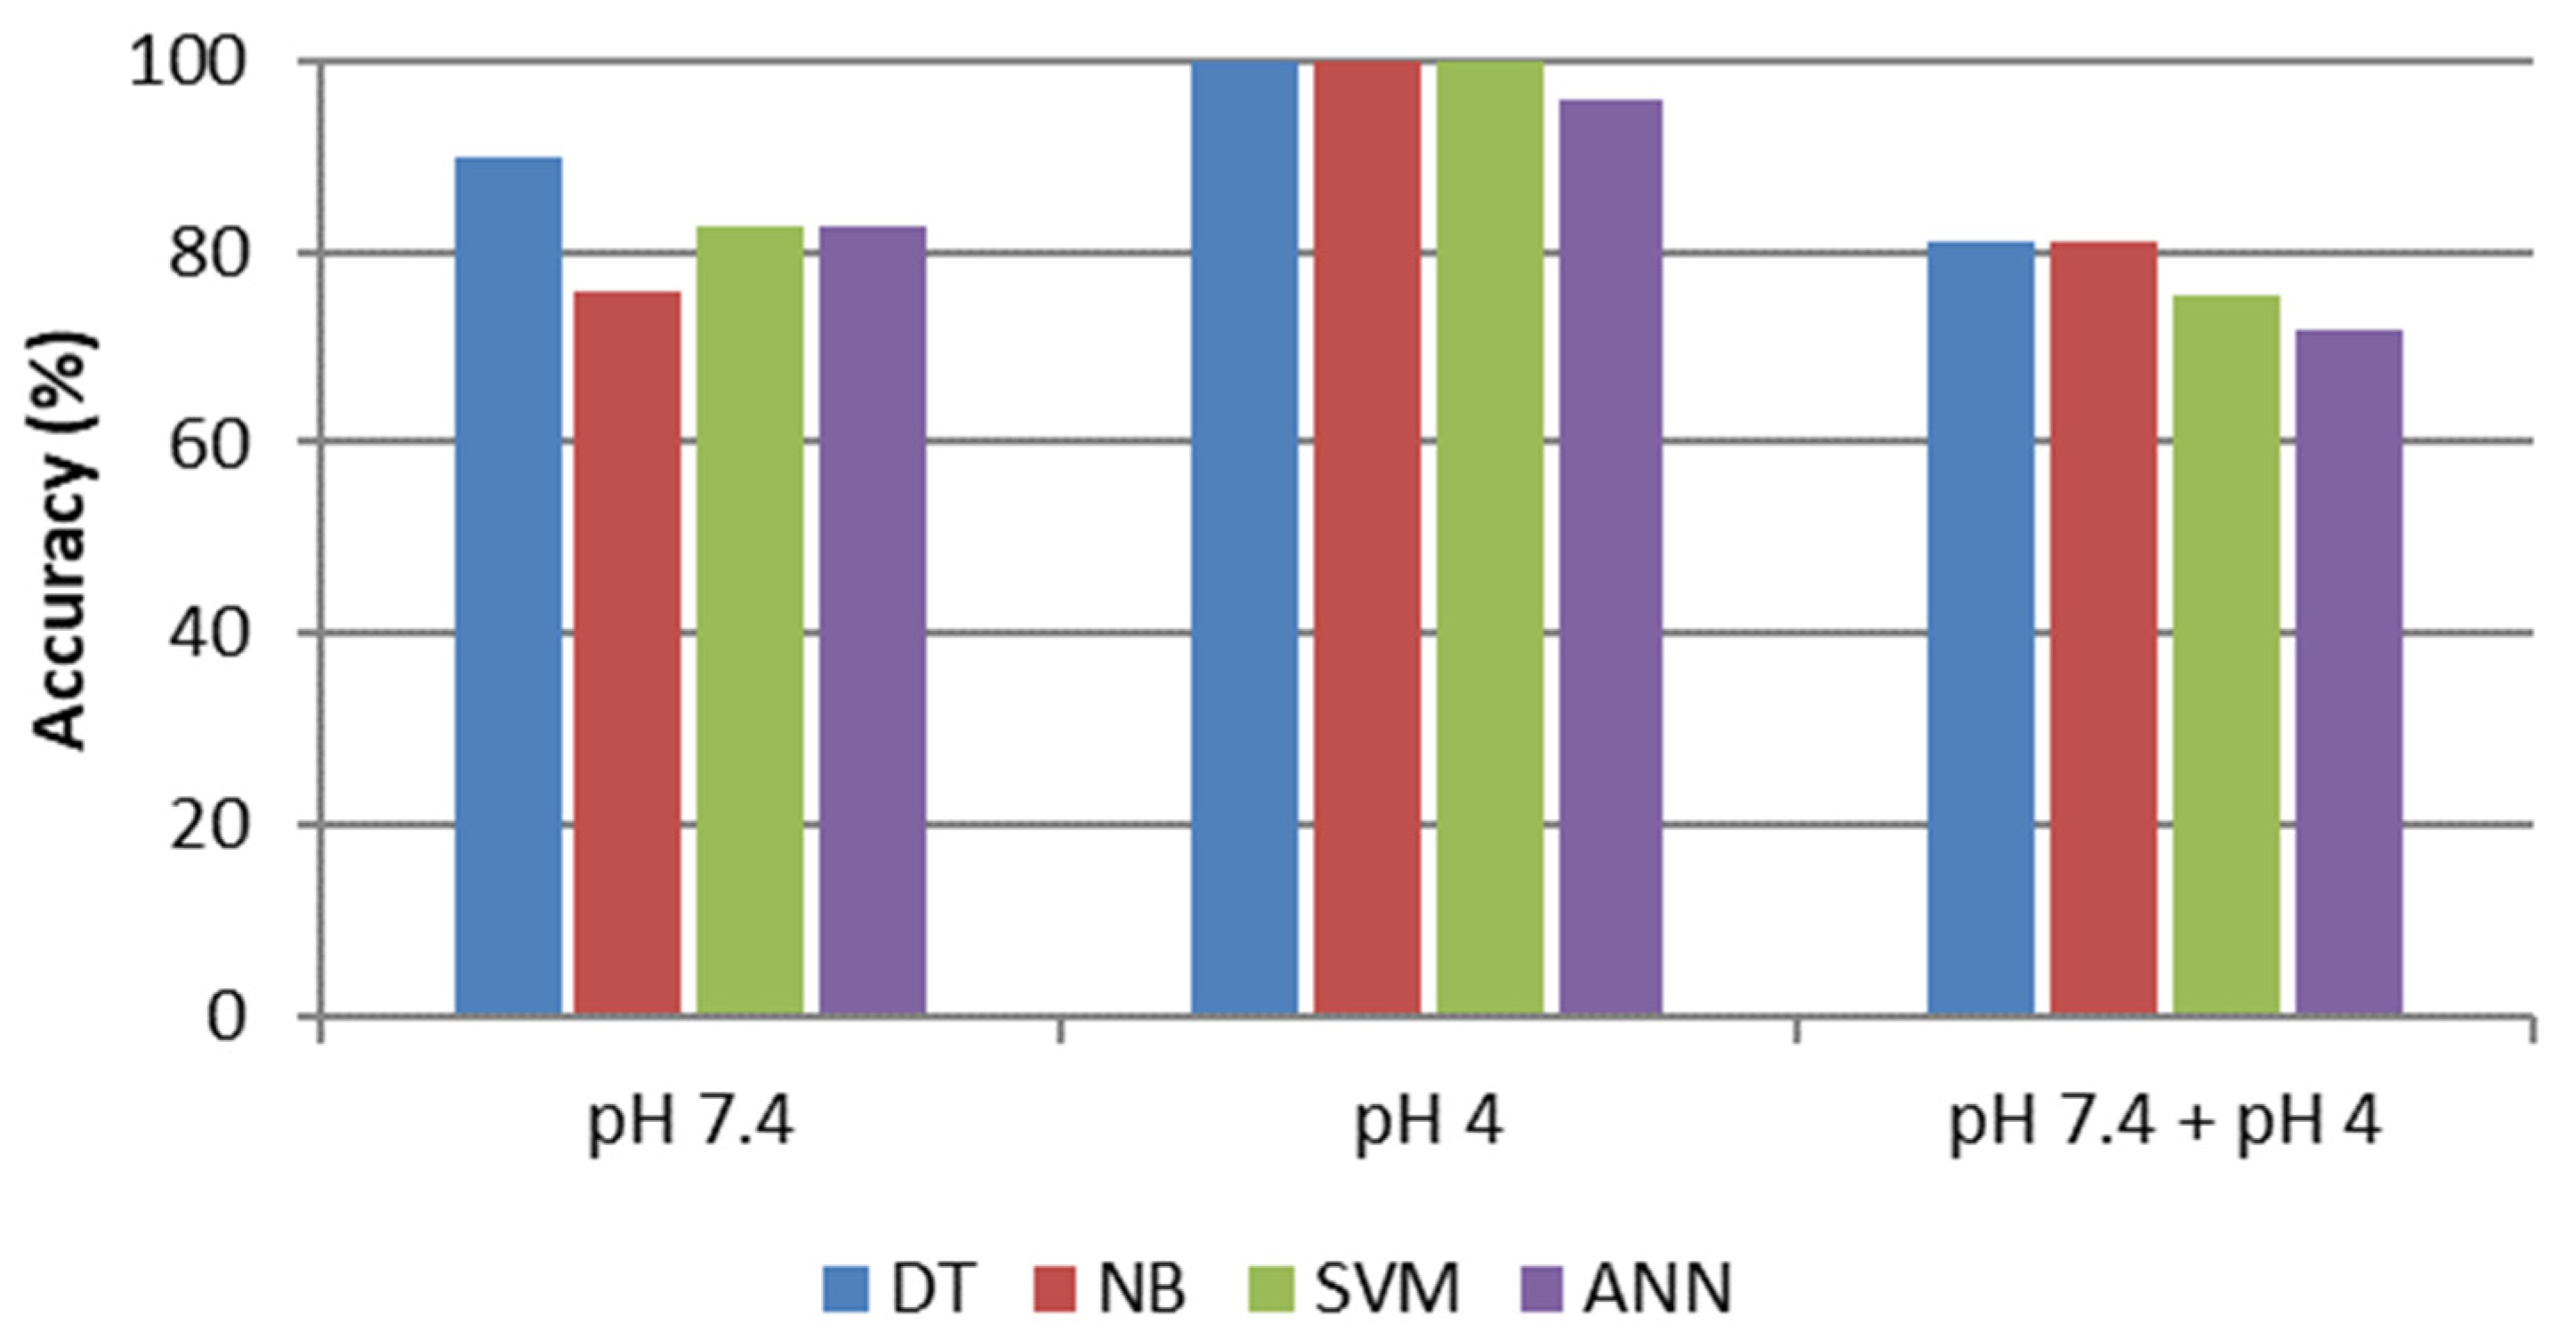
Finally,
Figure 8 shows reported testing accuracies in F12 cell culture media. In this case, testing performances are lower than other media (maximum 81.1% for both DT and NB).
In general, it can be concluded that the considered models can predict in a reliable way the copper ion concentration trends and pH modifications in various analyzed environments. These results confirm again the high added value of the proposed model for the future development of a new embedded monitoring paradigm for Organ-on-Chip devices.
4. Conclusions
This study aims to develop a machine learning forecasting model to evaluate the concentration of an analyte in different commercial cell culture media (MEM, DMEM, F12) by exploiting the electrochemical measurements peaks and their easy-to-extract geometrical features. In particular, the interest was focused on copper ion detection in complex media, like those used for cell culture research, because of their increasing interest in organ on chip applications.
A comparison of statistical results of testing datasets for different machine learning approaches was conducted to determine the best tool. Two of the four analyzed models had better performances: the SVM model gave a testing accuracy of 96.6%, whereas the NB model gave 93.1% in MEM. Instead, in DMEM and F12, the two best classifiers result in DT and NB, which gave the same accuracy in each culture media (91.4% in DMEM and 81.1% in F12).
It has been shown that the coupling of SWASV with machine learning models allows for achieving better detection performances of copper ions and to also predict the pH conditions during measurements. This study confirms that the machine learning approach is a powerful tool in analytical chemistry correlated with biological systems, since it extracts and uses hidden information, supplied by selected extracted features.
Considering that the SWASV technique is a good candidate for low-cost embedded sensing approaches, this work must be considered as a preliminary assessment for the future SWASV integration in the OoC devices. In fact, this paradigm can be materialized with a fluidic chip where the cell culture medium is acidified on a separate chamber from the live cells compartment and wasted after the electrochemical measurement.


 ,
, 


