Article

Microwave-Assisted Synthesis of rGO-ZnO/CuO Nanocomposites for Photocatalytic Degradation of Organic Pollutants

1
Department of Applied Chemistry, Adama Science and Technology University, Adama P.O. Box 1888, Ethiopia
2
Research Institute of Materials Chemistry, Chungnam National University, Daejeon 34134, Republic of Korea
3
Department of Materials Science and Engineering, Adama Science and Technology University, Adama P.O. Box 1888, Ethiopia
4
Department of Chemistry, Chemistry Engineering and Applied Chemistry, Chungnam National University, Daejeon 34134, Republic of Korea
*
Authors to whom correspondence should be addressed.
Crystals 2023, 13(1), 133; https://doi.org/10.3390/cryst13010133
Submission received: 24 December 2022 / Revised: 30 December 2022 / Accepted: 3 January 2023 / Published: 12 January 2023
(This article belongs to the Special Issue Synthesis, Characterization and Application of Novel Nanoparticles)

Abstract

:
Nanomaterial-based catalytic conversion of hazardous organic pollutants into benign substances is one of the green methods employed for wastewater treatment. This study demonstrates the fabrication of (rGO-ZnO)/CuO nanocomposites (NCs) via a microwave (MW)-assisted method for (photo)catalytic application. The crystal structure, optical, morphological, and electrochemical characteristics were examined using X-ray diffraction (XRD), spectroscopic, microscopic, and electrochemical techniques. The analysis indicated that rod-like (rGO-ZnO)/CuO NCs having a nanoscale diameter with enhanced light absorption and well-matched band positions between rGO-ZnO and CuO were formed. Furthermore, the catalytic reduction of 4-nitrophenol (4-NP) and photocatalytic degradation of methylene blue (MB) tests showed remarkable results with rate constants of 0.468 min−1 for 4-NP reduction within 8 min and 0.02213 min−1 for MB degradation within 105 min. Thus, the artful decoration of ZnO nanorods (NRs) with CuO into the (rGO-ZnO)/CuO NCs interface is an effective strategy for fabricating highly efficient photocatalysts.

1. Introduction

Nowadays, nanostructured materials have been acquiring significant attention for applications in environmental remediation [1,2,3,4]. Specifically, heterogeneous photocatalysts have been recognized as a promising method for degrading organic water pollutants [5]. Organic pollutants, for instance, dyes from untreated textile industry effluents, can cause serious health and environmental problems [6,7]. More specifically, MB and 4-NP are among the major industrial pollutants discharged into water bodies, causing toxicity, vomiting, nausea, and eye irritation, among others [8,9]. Therefore, their removal is vital. In this regard, the use of nanomaterials for photocatalytic degradation has an advantage over other conventional methods to remove organic dyes due to their green properties, simplicity, and affordability, among others [10,11]. Generally, catalysis experiments for waste water remediation require mild conditions and simple UV–vis spectroscopy techniques to monitor the reaction/degradation progress, making catalysis a facile, eco-friendly, economical, and flexible approach [12,13].
In the field of photocatalysis, metal oxides and metal oxide-based nanostructured materials have drawn considerable attention due to their distinctive properties [14]. Among these oxides, ZnO has been extensively studied because of its impressive properties. Wide bandgap, affordability, high binding energy, and availability as well as ease of preparation are some of the features that make an n-type ZnO a highly relevant material for photocatalysis [15,16]. However, the practical applications of pristine ZnO were limited due to the high rate of e/h+ recombination, the wide bandgap for the activation by visible light, and the photocorrosion in aqueous media [15,17]. Studies have shown that coupling ZnO with readily available, nontoxic, low-bandgap p-type semiconductor CuO greatly improved visible light absorption capacity, e/h+ recombination rates, and degree of photostability in aqueous media [18,19,20]. Nevertheless, adsorption capacity, recoverability, as well as reusability are still limiting the large-scale application of p-n heterojunction of CuO-ZnO for photocatalytic remediation of organic pollutants. According to the literature reports, using carbonaceous nanomaterials (graphene, carbon nanotubes, etc.) as catalyst support increases the adsorptivity, reduces photocorrosion, and improves the dispersibility of the resulting nanocomposites (NCs) in aqueous media [21,22,23]. High electrical conductivity, large surface area, and 2D structure make graphene the most suitable catalyst-support material [24]. It is therefore highly desirable to prepare CuO-ZnO–graphene NCs for promising heterogeneous photocatalysis.
The photocatalytic activity of nanomaterials is highly morphology-dependent. Owing to their morphology, 1D nanostructures exhibit attractive features that make them a potential candidate for photocatalytic applications [25]. In particular, ZnO nanorods (NRs) are known for having high surface area and aspect ratio, fast charge transfer, high photosensitivity, better charge separation, and efficient confinements on electrons and photons [26,27,28]. Liu et al. have reported that ZnO NRs possess better photocatalytic activities (99.8%) than truncated hexagonal cones (75%) and multilayered disks (23%) against methyl orange under UV irradiation [29]. Hence, designing an effective technique to synthesize a rod-like (rGO-ZnO)/CuO nanostructure is highly desirable to exploit the maximum benefit from its catalytic applications.
Recently, nanostructures comprised of ZnO, rGO, and CuO components with varieties of morphologies were reported for catalytic applications. These include flower-like for photocatalytic degradation of RhB and 4-chlorophenol [21], needle-like for photocatalytic oxidation of flue gas [30], flower-rod-like heterostructures for 4-nitroaniline catalytic reduction [31], and others [32]. Generally, the synthesis methods reported in most cases involve the co-deposition of both ZnO and CuO on rGO or GO sheets. Among the synthesis methods reported are solid-state [21], hydrothermal [30,31,32,33,34], wet chemical/ refluxing [35], and other methods [36,37]. Inherent to the attractive features of nanorods, reports on the synthesis of rod-shaped (rGO-ZnO)/CuO for MB degradation and 4-NP reduction are rare. Impregnation of the preformed rGO-ZnO nano seed with Cu2+ in the presence of polyethylene glycol (PEG) facilitates the growth of the nano-seeds into a rod-shaped multi-heterojunction (rGO-ZnO)/CuO NCs under microwave (MW) irradiation. MW irradiation offers higher reproducibility, purity, yields, and scalability as compared to conventional methods [38,39].
In this context, the purpose of this work is, therefore, to synthesize a novel (rGO-ZnO)/CuO NRs catalyst by MW-assisted method for organic water pollutants removal applications. The optical characteristics, crystal structures, morphology, and composition of the synthesized material were investigated. The (rGO-ZnO)/CuO NCs performance was tested against MB photocatalytic degradation and 4-NP catalytic reduction.

2. Materials and Methods

2.1. Materials

Graphite powder (C) (Blulux, 99.5%), zinc acetate (Zn(CH3COO)2.2H2O) (UNI-CHEM, 99%), copper (II) nitrate (Cu(NO3)2.3H2O) (UNI-CHEM, 99%), potassium permanganate (KMnO4) (alpha, 99.5%), sulfuric acid (H2SO4) (Loba, 98%), orthophosphoric acid (H3PO4), (Loba, 75%), sodium borohydride (NaBH4) (SRL, 95%), ascorbic acid (C6H8O6) (SRL, 99%), sodium hydroxide (NaOH) (Loba, 98%), polyethylene glycol 200 (Loba), concentrated hydrochloric acid (HCl) (Loba, 35.4%), methylene blue (C16H18ClN3S.3H2O), and hydrogen peroxide (H2O2) (Fine chemicals, 30%) were used. Distilled water (DW) was used for washing and solution-preparation purposes.

2.2. Method

2.2.1. Synthesis of GO

GO was synthesized using improved Hammer’s method with few modifications [40]. Briefly, 1 g graphite powder and 160 mL mixture of H2SO4/H3PO4 (volume ratio 9:1) were mixed in the ice bath under magnetic stirring. After 30 min of stirring, 6 g of KMnO4 was slowly added to the mix keeping the temperature below 10 °C using the ice bath. After that, the whole content was stirred overnight at a temperature between 35 °C to 40 °C. To the resulting mixture, 100 mL DW was added slowly under stirring. Then, an additional 100 mL of DW was added instantly. Eventually, 5 mL H2O2 was added to the mixture and stirred for 10 min, which resulted in a yellowish solution. The yellow suspension was left overnight to stand still. The supernatant was decanted away, and the residue was washed repeatedly with DW and finally with ethanol. The resulting brown residue was dried at 60 °C for 12 h.

2.2.2. Synthesis of rGO

Ascorbic acid was used to reduce graphene oxide according to the procedure described elsewhere with some modifications [41]. GO dispersion (0.2 mg/mL) was prepared in water and ethanol mix (with 8:2 volume fraction H2O/CH3CH2OH) utilizing ultrasonication for 1 h. To the resulting 400 mL dispersion, 1.2 g of ascorbic acid was added and stirred for 20 min. The pH of the medium was adjusted to 10 by NaOH (20 wt%) aqueous solution. Then, the mixture was subjected to MW irradiation for 15 min at 50% of the 1000-watt output power oven. Subsequently, the black suspension was left to stand still for 6 h to settle the rGO. To purify the resulting product, the residue was filtered and washed well with water repeatedly until the filtrate pH reached 7 and then with ethanol. In the end, the residue was dried for 12 h at 80 °C.

2.2.3. Synthesis of (rGO-ZnO)/CuO NCs

The (rGO-ZnO)/CuO NCs were synthesized according to the following procedure. First, 80 mg rGO was dispersed in a 150 mL mixture of DW and ethanol in a 2:8 ratio under sonication for 30 min. To this dispersion, 50 mL of 0.225 M Zn(CH3COO)2.2H2O was added and then stirred for 20 min at 70 °C. Then, the pH was adjusted to 10 by NaOH (20 wt%) [42]. The resulting greyish-white suspension was put in the microwave oven and irradiated for 10 min at 50% of the 1000-watt output power oven. After cooling, the content was stirred for 20 min at 70 °C. To this suspension, 12 mL (Cu(NO3)2.3H2O) (0.225 M) and 10 mL polyethylene glycol (PEG-200) were added drop by drop. NaOH was used to adjust the pH to 10. The resulting greyish solution was further MW irradiated for 10 min. Finally, the resulting precipitate was washed with ample water and then with ethanol. Drying was carried out at 80 °C for 6h and then at 200 °C for 2 h. For comparison, CuO-ZnO NCs and ZnO NPs were prepared. Hence, the same route as that of (rGO-ZnO)/CuO was followed: (i) without the addition of GO (to prepare CuO-ZnO) and (ii) without the addition of GO and Cu(NO3)2.3H2O (to prepare ZnO). The products obtained were then used for characterization and catalytic degradation and reduction of pollutants. Scheme 1 shows the synthesis overview of (rGO-ZnO)/CuO.

2.3. Characterizations

To investigate the crystallinity and structural phases of the samples, an X-ray diffraction (XRD) instrument (XRD-7000S, Shimadzu, Kyoto, Japan) with Cu Kα radiation was used. A UV–vis spectrophotometer (Azzota: SM-1600, Hyderabad, India) was used to determine the UV–vis absorbance spectrum. Similarly, FTIR spectral characterization of the samples was performed using Spectrum 65 FT-IR (Perkin Elmer, Waltham, MA, USA) in the range 4000–400 cm−1 using KBr pellets. Scanning electron microscopy (SEM) (HITACHI, S-4800, Tokyo, Japan) was employed to analyze the surface morphology of the samples and the elemental mapping of the species found in the sample. The emission spectra of the samples were obtained by a fluorescence spectrophotometer (Agilent Cary Eclipse Fluorescence Spectrophotometer, Santa Clara, CA, USA). The electrochemical measurements were conducted using the Ivium Technologies system with an IviumSoft (v4.1018) and a standard three-electrode cell with Ag/AgCl reference electrode (saturated), platinum wire counter electrode, and FTO coated with the catalyst sample as working electrode.

2.4. Performance Evaluation

Photocatalytic performance of the (rGO-ZnO)/CuO sample was tested against the MB degradation (with a 150-watt tungsten-halogen lamp, Philips). First, 120 mL of MB (10 ppm) and 20 mg catalyst were used to prepare the reaction suspension. The catalyst and dye molecules were homogenously dispersed by sonication for 30 min. While stirring, the mixture was irradiated by visible light. The progress of degradation was monitored by withdrawing 4 mL sample every 15 min and recording the absorbance. After filtration, the absorbance of each sample was measured. The trapping experiment was carried out similarly to the MB photodegradation using 20 mg (rGO-ZnO)/CuO NCs, 1 mmol scavenger, and 120 mL of 10 ppm MB. Equations (1) and (2) were used to determine degradation percentage (D%) and reaction rate, respectively [23].
D ( % ) = C 0 C t C 0 × 100  
ln ( C t C o ) = kt  
where k stands for the rate constant, and C0 and Ct stand for concentrations before (or at time = 0 min) and after exposure to light (or at time = t min), respectively.
To evaluate the catalytic performance of the prepared samples, 4-NP was used as a model pollutant along with NaBH4 as a reductant. Typically, a 40 mg catalyst sample and 40 mg NaBH4 were mixed with 100 mL of 20 ppm 4-NP in a 250 mL beaker. The progress of catalysis was determined by a UV–vis spectrophotometer [43]. The absorbance spectrum of the solution was recorded every 3 min by withdrawing 3 mL out of the mixture. Finally, Equation (2) was used to analyze the rate of reduction.

3. Results and Discussion

3.1. X-ray Diffraction Analysis

The information about the crystalline structure and phase composition of the synthesized materials was obtained from the XRD analysis. The XRD pattern of GO, rGO, ZnO, CuO-ZnO, and (rGO-ZnO)/CuO samples are displayed in Figure 1A. The characteristic XRD peaks of GO and rGO were displayed at 2θ of 9.9° and 24.4°, with a corresponding interlayer distance of about 0.89 nm and 0.36 nm, as shown in Figure 1A. The relatively wider interlayer distance of GO could be attributed to the presence of carboxyl, hydroxyl, and epoxide groups formed by the oxidation of the graphite [44,45,46], whereas the reduction of GO to rGO resulted in an interlayer distance decreased to about 0.3640 nm, which is closer to that of the literature values for bulk graphite, suggesting the reduction of the hydroxyl, carboxyl, and epoxide functional groups [45,46]. Further, the peak at 2θ of 9.9° was absent, while the new peak at 2θ of 24.4° also indicates the reduction of the oxygen-containing functional groups.
As illustrated in Figure 1A, the diffraction patterns of (rGO-ZnO)/CuO appeared at 2θ of (31.76, 34.42, 36.26, 47.56, 56.62, 62.88, and 67.98°), which could be from (100), (002), (101), (102), (110), (103), and (112) planes of hexagonal ZnO phases according to JCPDS card (36-1451), respectively. Most of the diffraction peaks arising from CuO were weak and masked by strong peaks from the ZnO phase related to the relatively smaller CuO content. Hence, the weak diffraction peaks appeared at 2θ of (35.54, 38.90, 58.26, and 61.52°) assigned to planes ((11-1), (200), (202), and (11-3)) belonging to the monoclinic CuO phases according to JCPDS card (36-1451), respectively. Distinct peaks related to the rGO were not seen in the pattern of (rGO-ZnO)/CuO, which might be due to the low crystallinity and small amount of rGO producing low intensity [44,47].

3.2. FTIR Analysis

To investigate the metal–oxygen linkage of the prepared materials, the FTIR analysis was conducted, and the resulting spectra of the ZnO, CuO-ZnO, and (rGO-ZnO)/CuO are given in Figure 1B. The bands at 3422 and 1300 cm−1 correspond to the O–H groups stretching and bending vibrational frequencies, respectively. Similarly, the peak at 1628 cm−1 could be ascribed to the C=O bond stretching [48]. The source of the O-H and C=O functional groups could be due to the adsorbed H2O and CO2 molecules during sample preparation. The M-O stretching vibrations of metal oxides usually appear in the ranges between 400 and 600 cm−1 of the FTIR spectrum. In light of this, the peaks that appeared in the range 400–510 cm−1 (Figure 1B) could belong to the Cu–O and Zn–O vibrations of CuO and ZnO samples, respectively [49]. The pristine ZnO sample displayed a peak at 415 cm−1 corresponding to Zn-O vibrations [50]. Similarly, the CuO-ZnO and (rGO-ZnO)/CuO samples showed peaks between 410 and 490 cm−1 belonging to the Cu-O and Zn-O vibration band supporting the XRD analysis [50,51]. The peaks of the composite samples did not show a significant difference from that of pristine ZnO, which could be due to the low content of rGO and CuO in the (rGO-ZnO)/CuO sample [52]. The FTIR spectra of GO and rGO were given in Figure S1A (see Supplementary Materials).

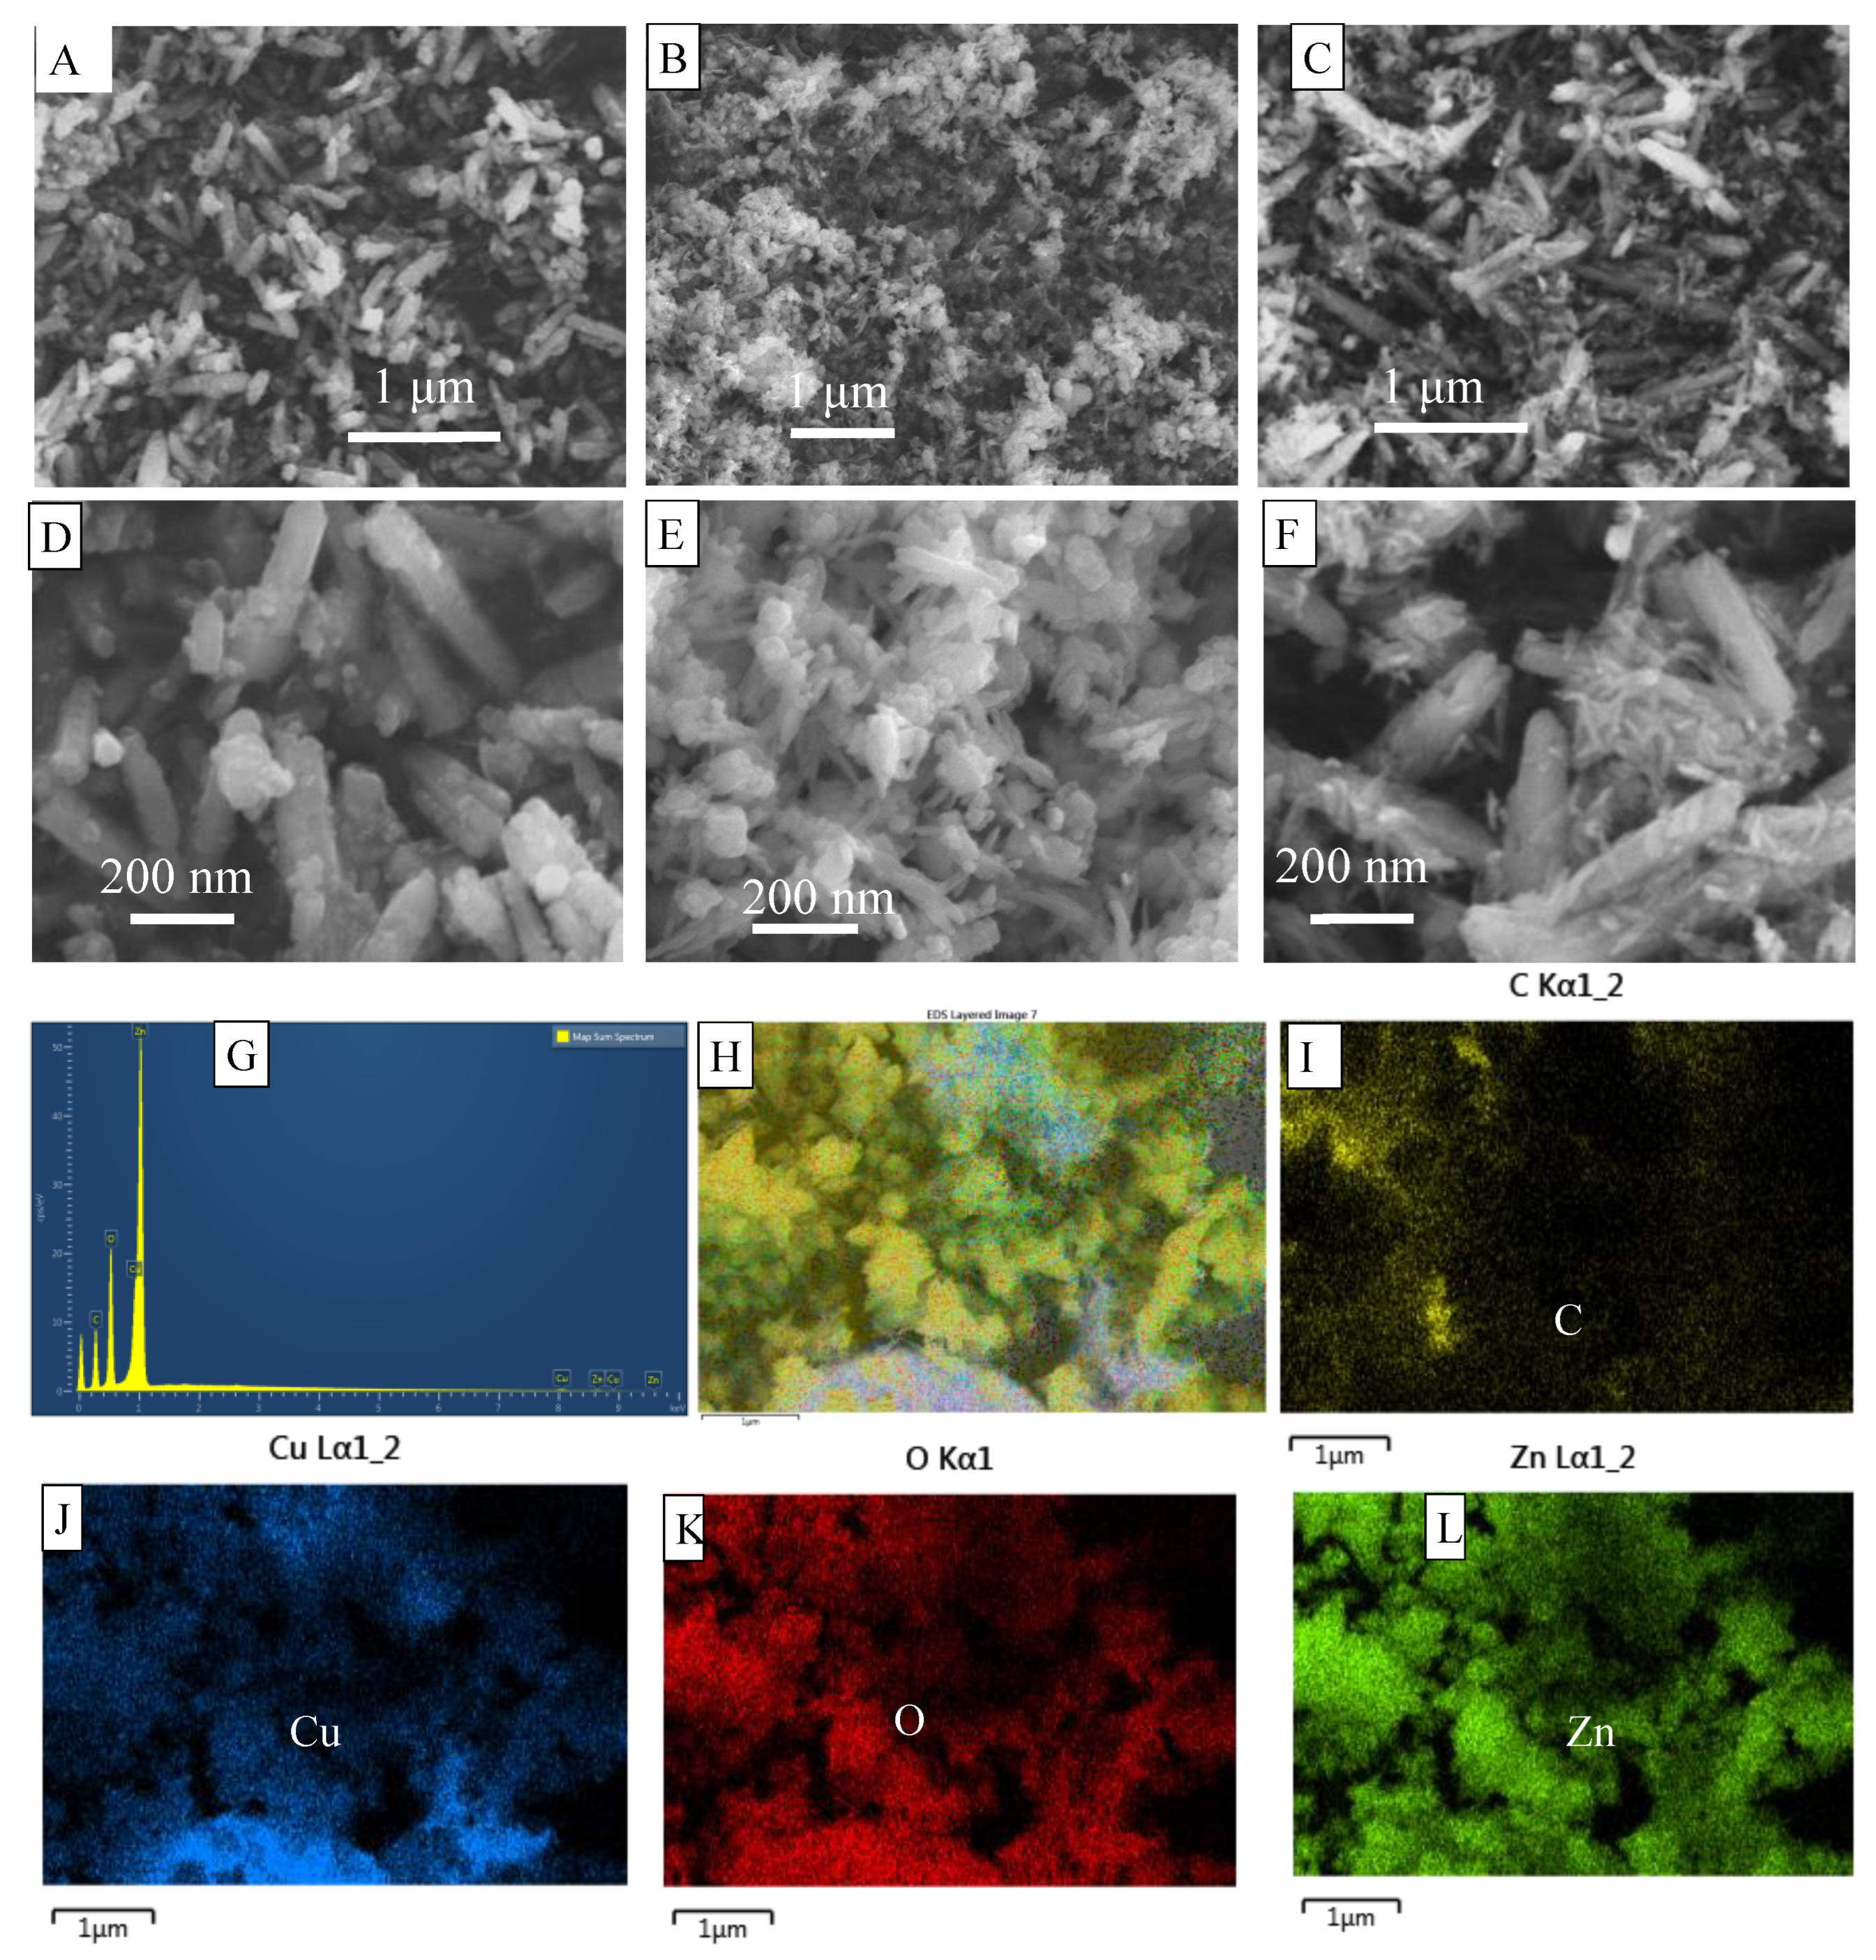
3.3. Morphology Characterization

The SEM image analysis provides morphological information about the samples prepared. Figure 2 shows SEM images and EDS results of ZnO, CuO-ZnO, and (rGO-ZnO)/CuO samples. The low-magnification (1 μm) SEM micrograph of the (rGO-ZnO)/CuO sample (Figure 2C) exhibited random arrays of rod-shaped morphology. The high-magnification SEM micrographs (Figure 2F) showed that the whiskers were uniformly distributed on the NRs, where some particles appear to be elongated and hexagonal. The rod-shaped crystals fall in the nanoscale regime with an average diameter of about 70 nm. Similarly, pure ZnO (Figure 2A,D) samples are composed of NRs with an average diameter of about 65 nm, whereas the image of CuO-ZnO samples (Figure 2E) illustrate the presence of one-dimensional heterostructures (ribbon-like and short rod-like nanostructures), indicating that the growth rate is slower than those in the case of ZnO NRs or (rGO-ZnO)/CuO NCs [53].
The EDS spectrum of the (rGO-ZnO)/CuO depicted in Figure 2G showed that the sample contained Zn, Cu, O, and C elements, confirming the presence of the expected elements. Furthermore, the EDS mapping analysis illustrated that the Zn, Cu, O, and C elements were homogeneously distributed throughout the (rGO-ZnO)/CuO sample. This implies that the rGO, ZnO, and CuO were properly integrated with the sample [54]. In addition, the absence of traces of other elements in the EDS spectra signifies the purity of the synthesized material and supports the XRD data [55].
A TEM image of rGO-ZO/CuO samples in Figure 3 illustrates a rod-like morphology that correlates with the SEM image. The rods consist of different sizes with lengths ranging from 230–780 nm and diameters 30–96 nm. The HRTEM image shown in Figure 3 indicates a high degree of crystallinity, as evidenced by lattice fringes [56]. Calculated inter-planar spacings were 0.190 nm, corresponding to between the hexagonal ZnO (102) and 0.187 nm between monoclinic CuO (20-2) planes. The results of this study are consistent with those found in the literature [JCPDS 361451] for ZnO and [JCPDS 481548] for CuO.

3.4. UV–vis and PL Analysis

The characteristic UV–vis absorption peaks of GO and rGO suspension in ethanol and photographs of their powder as well as the corresponding aqueous suspensions are given in Figure S1B–D. A strong absorbance at 235 nm and a weak shoulder at 303 nm were observed for GO. The intense band at 235 nm could be assigned to the π-π* transitions of aromatic C-C bonds, and the weaker shoulder around 303 nm could be due to the n-π* transitions of C=O bonds [57]. Upon reduction of GO, the shoulder peak at 303 nm disappeared, and that at 235 nm was red-shifted to the broader peak at around 265 nm and attributed to the aromatic C-C π→π* transition, indicating the restoration of the aromatic structure in the electronic conjugation of rGO [58]. The results for both GO and rGO are in close agreement with the values reported elsewhere [59,60]. Therefore, the shift in the 235 nm peak to the 265 nm and the color change from brown to black confirms the reduction of GO into rGO using ascorbic acid [58,61].
Similarly, the spectra displayed in Figure 4A,B belong to the absorbance and the corresponding Tauc’s plot of ZnO, CuO-ZnO, and (rGO-ZnO)/CuO samples. All samples displayed a strong absorption band in the UV region (λmax ≈ 367 nm), which is supported by the absorbance of ZnO nanoparticles reported elsewhere [62]. As it can be seen from the Figure, both CuO-ZnO and (rGO-ZnO)/CuO samples displayed a significant portion of their absorption spectra in the visible range compared to the ZnO sample, indicating a smaller energy bandgap compared to ZnO [50]. The direct bandgap of the samples was obtained using Tauc’s formula (Equation (3)) [63] from the curves fitting of ( α h ν ) 2   vs .   h ν , as depicted in Figure 4B [64], by extrapolating the slope of the linear region to the x-axis intersection (i.e., at ( α h ν ) 2 = 0 ) . The estimated bandgap from the fitted graph was 3.09 eV for ZnO, 2.89 eV for CuO-ZnO, and 2.43 eV for (rGO-ZnO)/CuO samples. The result revealed that CuO-ZnO NCs possess a lower bandgap than that of ZnO NPs. Therefore, modifying ZnO with CuO and rGO resulted in improved visible light harvesting (rGO-ZnO)/CuO samples, which makes it an effective photocatalyst for pollutant dye degradation under visible light [65,66].
( α h ν ) n = C ( h ν E g )  
where α, h, v, Eg, n, and C are the absorption coefficient, Planck’s constant, light frequency, bandgap energy, the power factor of the transition mode (2 for direct, 0.5 for indirect), and constant related to the material, respectively.
The room temperature emission spectra of ZnO NPs, CuO-ZnO NCs, and (rGO-ZnO)/CuO NCs are depicted in Figure 4C. At an excitation wavelength of 340 nm, the PL spectra are composed of a strong emission band at 383 nm (UV region) and relatively weaker emission bands at 462 and 496 nm (visible region), including a shoulder band at 422 nm [67]. The intense emission band at 383 nm could be assigned to e/h+ recombination originating from the near band-edge of ZnO [67], whereas the other relatively weaker emission peaks in the visible range could be attributed to the recombination originating from the deep-level defects of the corresponding material [68]. As it is displayed in Figure 4C, the emission intensity from pure ZnO is higher than that of the composite both from the near band-edge and from the defect levels, indicating better e/h+ separation and decreased defect level in the CuO-ZnO and (rGO-ZnO)/CuO NCs [67,69]. That is, the photogenerated electrons in the conduction band (CB) of CuO transfer effectively to the CB of ZnO and rGO sheets, preventing the direct recombination of excitons [70]. Therefore, modifying ZnO with CuO and rGO indicated that the decreased recombination rate with improved visible light absorption could make the resulting modified nanomaterials a potential candidate for photocatalysis [71].

3.5. Electrochemical Analysis

The electrochemical behavior of the synthesized photocatalyst materials was investigated by electrochemical impedance spectroscopy (EIS) and Mott–Schottky (MS) analysis. In this study, the EIS and MS results of the (rGO-ZnO)/CuO NCs were compared to those of CuO-ZnO and ZnO. An EIS survey of the resistance and capacitance properties of synthesized nanomaterials across the semiconductor-electrolyte interface was carried out to examine charge carriers’ separation, transfer, and recombination behavior. According to the impedance analysis shown in Figure S2A, CuO-ZnO NCs displayed the smallest impedance arc radius compared to ZnO NRs and (rGO-ZnO)/CuO NCs, indicating a suppressed recombination rate due to fast electron transfer across the interface [72]. In the EIS analysis, Nyquist plots with a smaller semicircle arc indicate materials with better conductivity leading to facilitated transfer of charge carriers, which could lead to enhanced photocatalytic performance [73]. The results obtained from the EIS are consistent with the PL analysis (Figure 4C).
Similarly, the Mott–Schottky plots of (rGO-ZnO)/CuO NCs, CuO-ZnO NCs, and ZnO NRs are illustrated in Figure S2B–D. A plot of ZnO NRs showed a positive slope, indicating an n-type semiconductor with a flat band potential (Efb) of −0.4 V vs. Ag/AgCl. However, in the case of (rGO-ZnO)/CuO NCs and CuO-ZnO NCs, the co-existence of negative and positive slopes was observed, confirming the effective development of p-n heterojunction between CuO and ZnO [74]. The values were shown in Figure S2C,D with −0.4 and 1.2 V for CuO-ZnO NCs and 0.37 and 1.3 V for (rGO-ZnO)/CuO NCs vs. Ag/AgCl. The potentials relative to the reversible hydrogen electrode (RHE) were obtained using the Nernst equation and potentials measured vs. Ag/AgCl (Equation (4)) [75].
E RHE = E Ag / AgCl + E Ag / AgCl 0 + 0.059   pH  
where E0Ag/AgCl(sat) = 0.197 V, and the electrolyte pH is 7.
Hence, the corresponding Efb relative to RHE is given in Table S1. According to the literature, the Efb of the n-type semiconductors is close to the conduction band-edge (i.e., CB is more negative Efb by ~0.1 V), and that of the p-type semiconductors is close to the valence band-edge (i.e., VB is more positive than Efb by ~0.1 V) [76]. Combining these values with the bandgap energy obtained from Tauc’s formula, the VB of ZnO and the CB of CuO can be calculated using Equation (5) [76]. Thus, using the Efb and the calculated band gaps, the conduction and valence band potentials of ZnO NRs, CuO-ZnO NCs, and (rGO-ZnO)/CuO NCs were determined (Table S1). In the (rGO-ZnO)/CuO NCs, the CB and VB potentials of ZnO and CuO were found to be 0.14 and 2.57 V for ZnO and −0.42 and 2.01 V for CuO, respectively. Further, from the band-edge position of VB and CB of ZnO and CuO in the (rGO-ZnO)/CuO NCs, type II staggered band alignment was formed between ZnO and CuO.
E VB = E CB + E g  

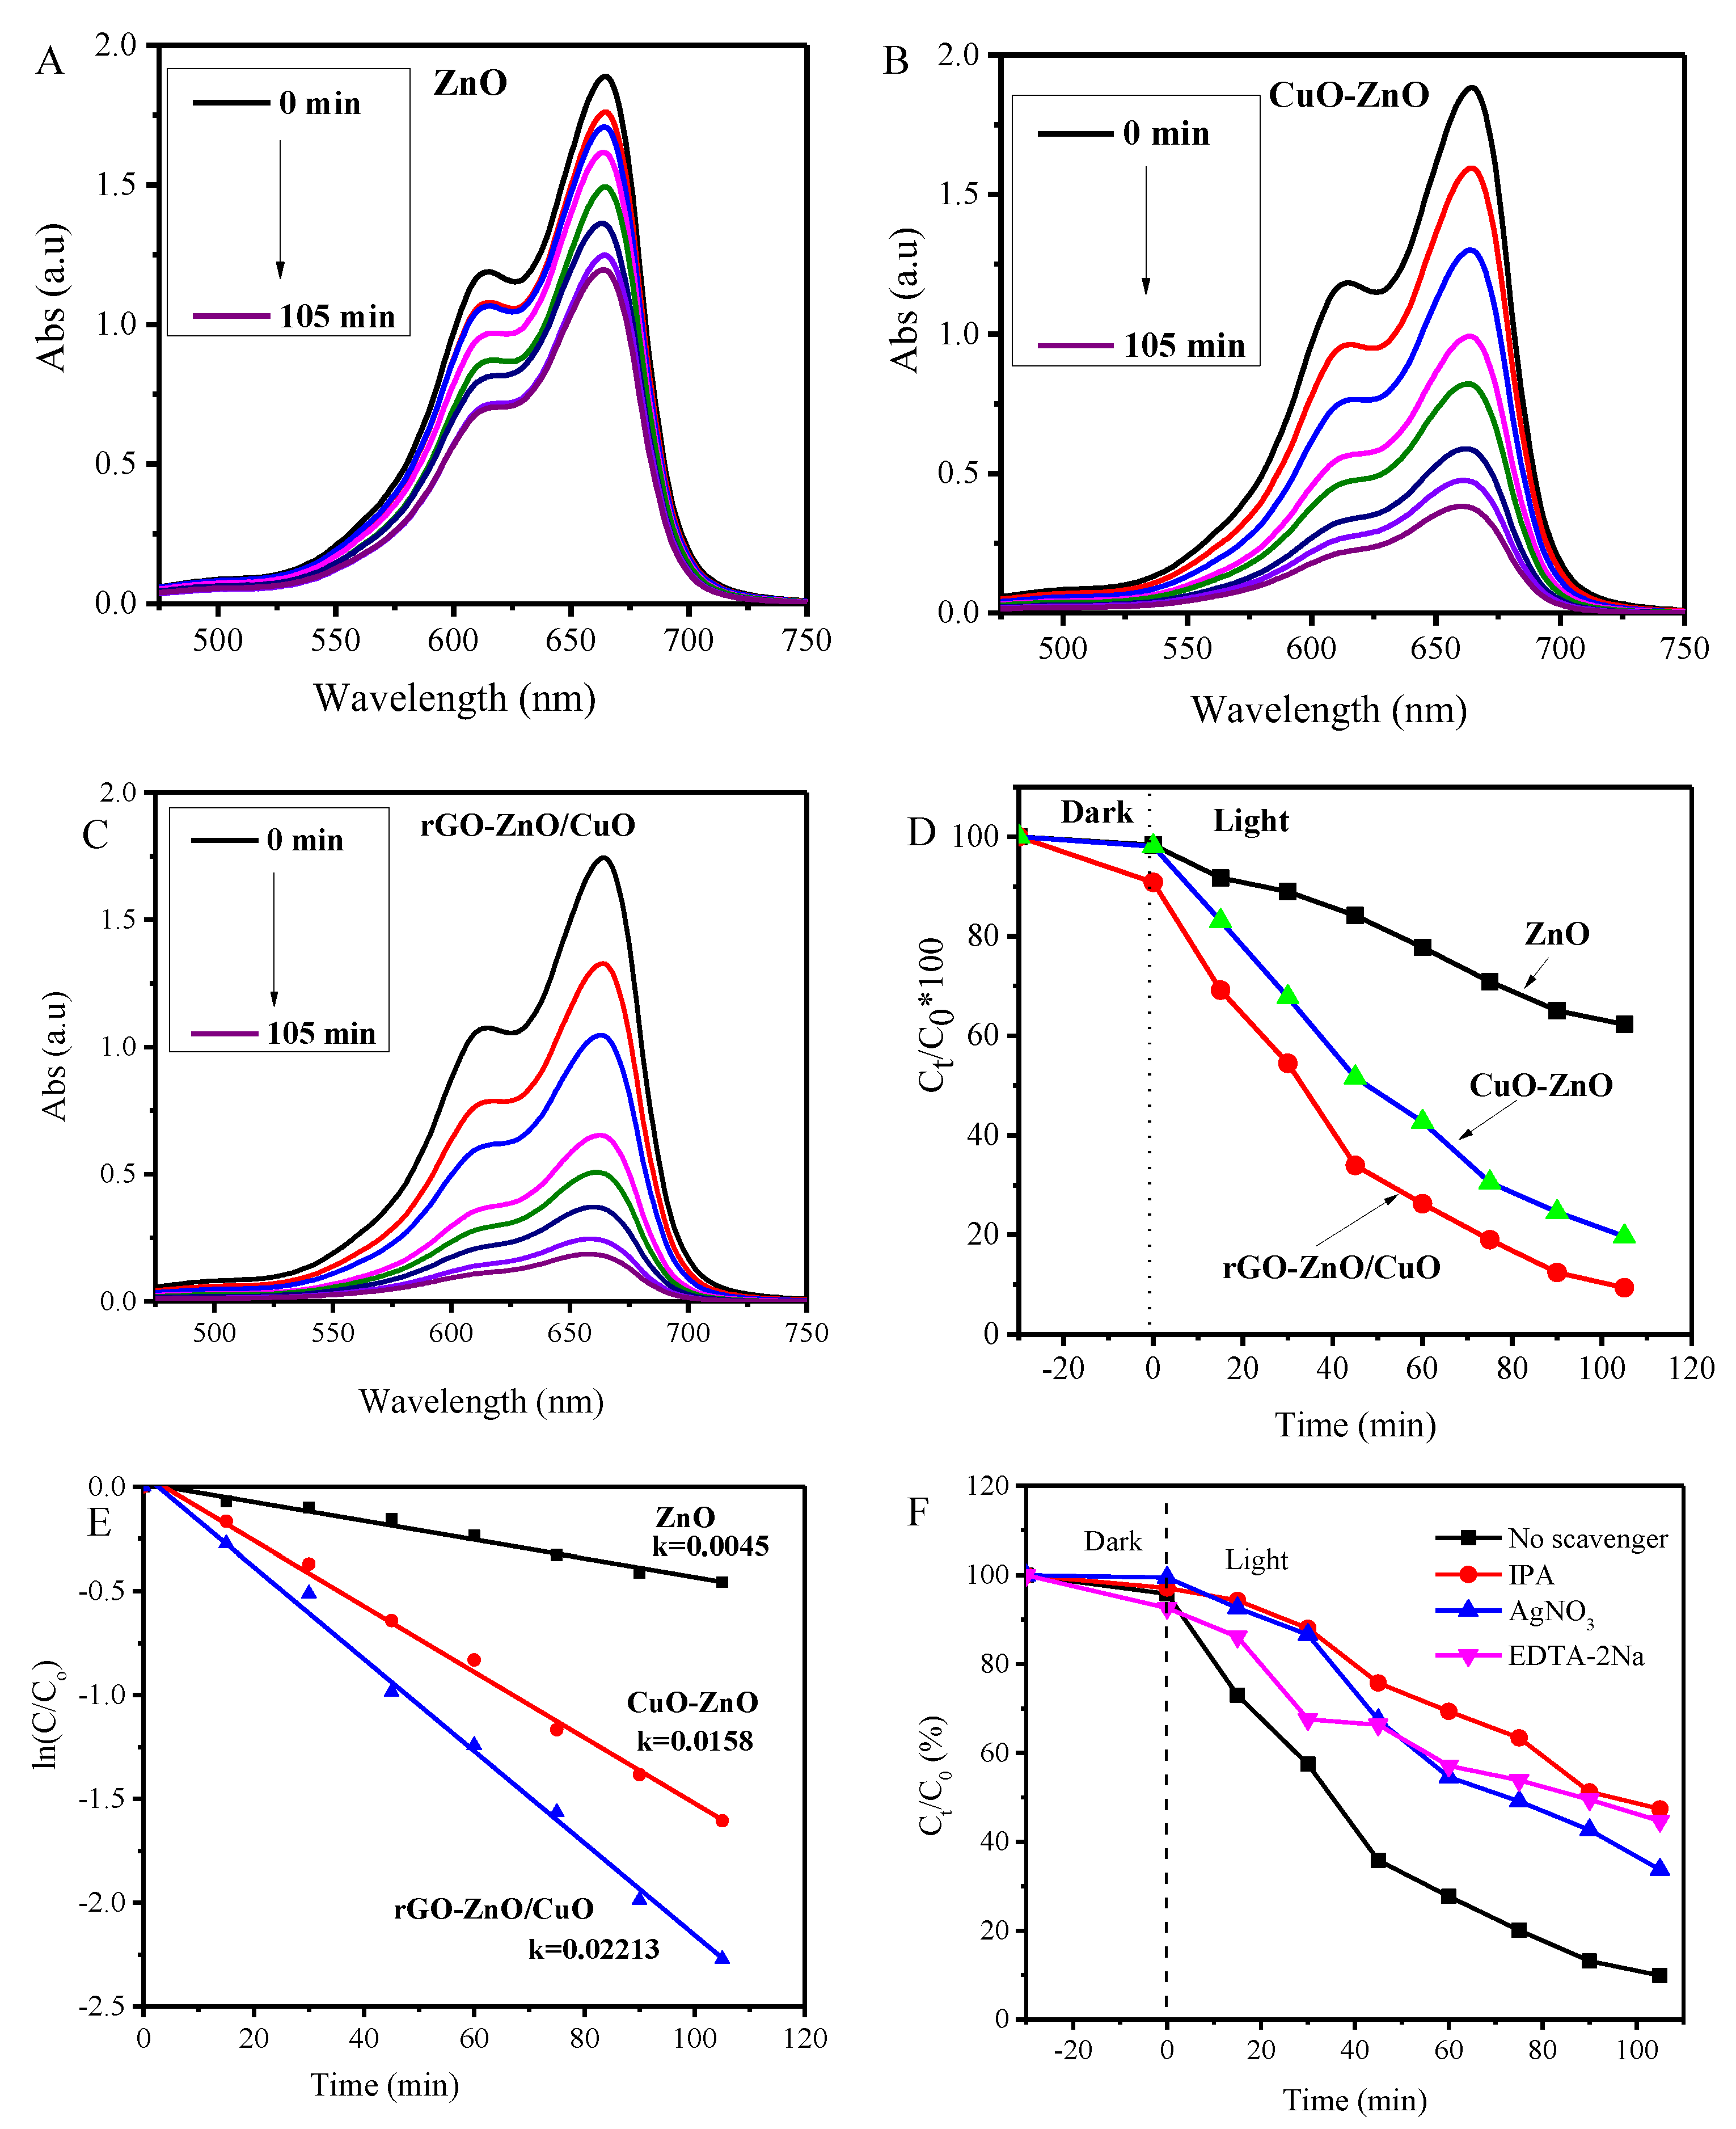
3.6. Photocatalytic Activity and Mechanism

The photocatalytic performance of ZnO NRs, CuO-ZnO NCs, and (rGO-ZnO)/CuO NCs were evaluated against MB degradation as a test organic pollutant under visible light irradiation (Figure 5). The aqueous solution of MB showed a strong absorbance peak at 664 nm [77]. The absorbance of MB solution in the presence of catalysts showed a gradual decrease under irradiation indicating MB degradation. According to the result, pure ZnO NRs degraded about 37% of the initial MB concentration within 105 min, whereas CuO-ZnO NCs and (rGO-ZnO)/CuO NCs degraded about 80% and 90% of the initial MB within 105 min, respectively (Figure 5A,D). In addition, the kinetics of the degradation reaction was displayed in Figure 5E,F. According to the linear fit of ln(Ct/Co) vs. time (Figure 5F), the rate constant (k) was found to be 0.0045 min−1, 0.0158 min−1, and 0.0221 min−1 for ZnO, CuO-ZnO NCs, and (rGO-ZnO)/CuO NCs, respectively. This enhancement in the photocatalytic performance compared to pure ZnO NRs signifies that the introduction of CuO and rGO improved the visible light absorption and suppressed the rate of recombination [15]. The result from the optical studies supported the improved performance of the NCs. Particularly, the weaker PL intensity of the composite than of pure ZnO suggests the enhanced separation of the excitons [78,79]. In other words, a higher charge separation assists the migration of excitons to the surface and reacts with the adsorbed species, leading to the higher activities of the composite compared to the pristine ZnO [79]. The ratio constant (rate constant per g of catalyst) of (rGO-ZnO)/CuO NCs for the photocatalytic degradation of MB compared to the previously reported materials is given in Table 1. It indicates that (rGO-ZnO)/CuO NCs showed remarkable performance.
A trapping experiment was performed to find out the main active species involved in photocatalysis using ethylenediaminetetraacetic acid disodium (EDTA-2Na), AgNO3, and isopropanol (IPA) to scavenge photogenerated holes (h+), superoxide radicals (O2), and hydroxyl radicals (OH), respectively [79]. The results of the experiment are illustrated in Figure 5F. As can be seen from the Figure, the addition of the scavengers resulted in decreased efficiency of MB photocatalytic degradation, indicating that h+, OH, and O2 are the active species involved. These active species could be generated in varieties of ways. Under visible light illumination of (rGO-ZnO)/CuO, excitons generate where e resides in the CB, and h+ resides in the VB, leading to the generation of other active species (i.e., reactive oxygen species): (i) The O2 could be generated by the reaction between photogenerated electrons and adsorbed oxygen, where CB potentials are more negative than the potential of O2/O2 (−0.16V) (Equation (6)) [80]. The O2 further reacts and forms other reactive oxygen species (Equations (7), (8) and (10)). (ii) The OH could be generated as shown in the Equations (Equations (10)–(13)). The OH degrades MB to yield degraded products (Equations (15) and (16)). (iii) The photogenerated holes in the VB or trap states react with the adsorbed species (OH, H2O, or MB) and generate reactive radicals that further react with other species and degrade the pollutants (Equations (12)–(14) and (16)). Oxidation of the adsorbed species (H2O, OH) to generate OH occurs when the VB edge potentials are more positive than that of OH/OH (1.9V vs. NHE) and H2O/OH + H+ (2.73 V vs. NHE) [81].
O2 + eO2
O2 + H2O → HOO + OH
O2 + H+ → HOO
HOO + H+ + e → H2O2
O2 + H2O2OH + OH + O2
HOO + H2O → OH + H2O2
H2O + h+OH + H+
OH + h+OH
RH + h+ → R + H+
RH + OH → R + H2O
R → intermediate/final degraded product
  RH   catalyst   +   hv   intermediates     CO 2 + H 2 O + inorganic   products
where RH stands for MB dye.

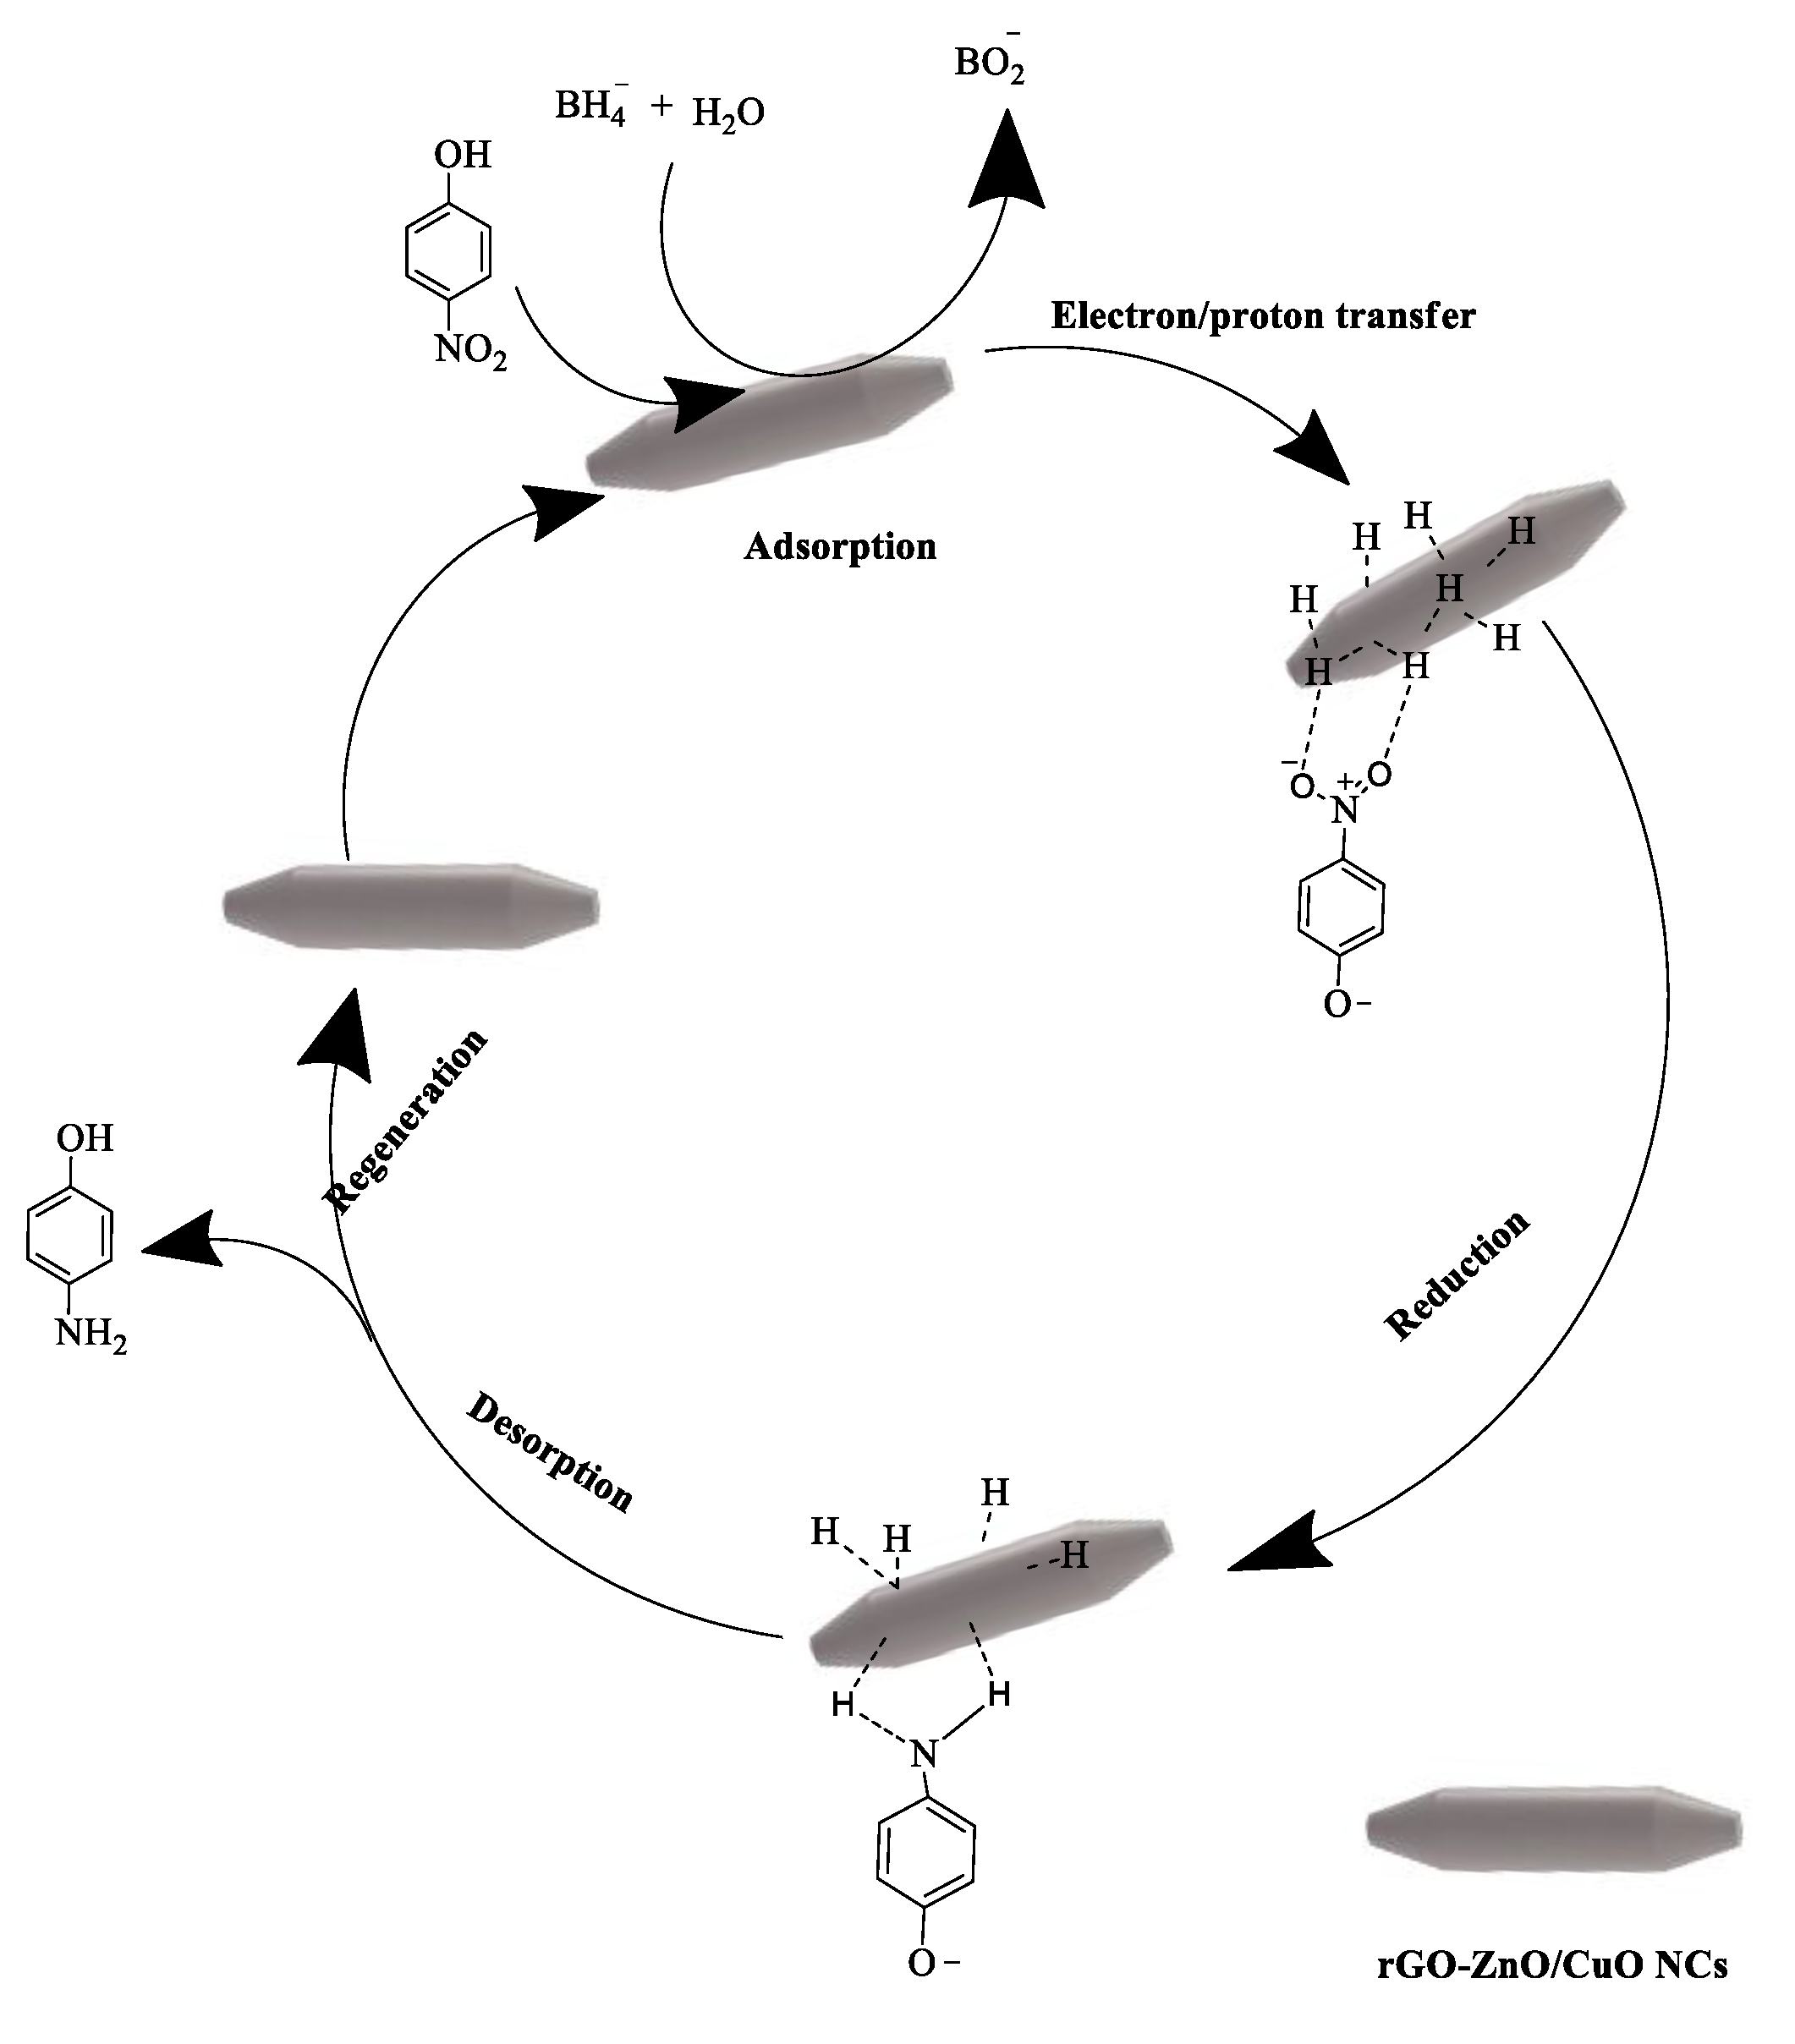
3.7. Catalytic Reduction Activity

Catalytic reduction of 4-NP to 4-aminophenol (4-AP) was used to evaluate the performance of the prepared (rGO-ZnO)/CuO in the presence of NaBH4. Figure 6 shows the reduction progress and kinetics of the (rGO-ZnO)/CuO NCs. The absorbance of the 4-NP aqueous solution showed maximum absorbance at 319 nm. However, the addition of NaBH4 made the band at 319 nm disappear, and a new band emerged at 405 nm, indicating the formation of a 4-nitrophenolate ion (Figure 6A). Upon addition of catalysts to the NaBH4 containing 4-NP solution, absorbance at 405 was decreased, while a new band at 300 nm appeared, revealing the formation of 4-AP. Both (rGO-ZnO)/CuO and CuO-ZnO NCs reduced almost all 4-NP in less than 9 min, whereas ZnO NRs exhibited insignificant catalytic activity, showing that ZnO has lower catalytic efficiency compared to CuO-ZnO and (rGO-ZnO)/CuO NCs (Figure 6B–D).
The kinetics analysis of the reduction reaction of 4-NP using NaBH4 in the presence of ZnO NRs, CuO-ZnO NCs, and (rGO-ZnO)/CuO NCs is given in Figure 6E,F. Based on the kinetic analysis, it was found that the data most closely fitted the pseudo-first-order reaction equation (Equation (2)) [82]. The rate constants of ZnO NRs, CuO-ZnO NCs, and (rGO-ZnO)/CuO NCs were found to be 0.00026, 0.465, and 0.468 min−1, respectively. The result indicated that the rate of reduction reaction was high when the nanocomposites were used (Figure 6F). The mechanism of the 4-NP reduction reaction involves the following: (i) adsorption of BH 4 and 4-NP to the catalyst surface, (ii) transfer of electrons from BH 4 to the adsorbed 4-NP [83], (iii) transfer of protons from the BH 4 and H2O to the 4-NP [84], and (iv) desorption steps. In the (rGO-ZnO)/CuO NCs, the highest rate of reaction could be related to the presence of rGO and the CuO-ZnO p-n heterojunction facilitating the adsorption and transfer of charged species [43]. The key steps in 4-NP reduction by (rGO-ZnO)/CuO NCs are illustrated in Scheme 2.

4. Conclusions

In summary, rod-shaped (rGO-ZnO)/CuO NCs were successfully synthesized via a simple and repeatable MW-assisted method. The synthesized samples were characterized using XRD, spectroscopic, and microscopic techniques. The crystalline structure of (rGO-ZnO)/CuO NCs with CuO and ZnO phases was obtained. Moreover, EDS results confirmed that the sample was composed of O, C, Cu, and Zn elements distributed homogeneously. Additionally, (rGO-ZnO)/CuO NCs exhibited enhanced visible light absorption with a reduced e/h+ recombination rate compared to the pristine ZnO NPs. Furthermore, (rGO-ZnO)/CuO NCs showed enhanced performance against MB degradation with rate constants of 0.02213 min−1 and that of 4-NP reduction with 0.468 min−1. This makes (rGO-ZnO)/CuO NCs a potential candidate for treating water polluted by organic dyes.

Supplementary Materials

The following supporting information can be downloaded at: https://www.mdpi.com/article/10.3390/cryst13010133/s1, Figure S1: FTIR spectra of GO and rGO samples (A), UV–visible absorbance spectra of GO and rGO suspensions in ethanol (B), and photographs of powder and aqueous suspension (before drying) of GO (C) and rGO (D); text description of Figure S1; Figure S2: (A) EIS Nyquist plots of (rGO-ZnO)/CuO NCs, CuO-ZnO NCs, and ZnO NPs; Mott–Schottky plots of (B) ZnO NRs, (C) CuO-ZnO NCs, and (D) (rGO-ZnO)/CuO NCs vs. Ag/AgCl. References [85,86] are cited in the supplementary materials.

Author Contributions

Conceptualization, F.K.S. and O.A.Z.; methodology, A.G.B., F.K.S. and O.A.Z.; software, A.G.B., L.T.T. and J.G.; formal analysis, A.G.B. and L.T.T.; investigation, A.G.B.; resources, A.G.B., L.T.T., F.K.S. and O.A.Z.; data curation, A.G.B., F.K.S. and O.A.Z.; writing—original draft preparation, A.G.B.; writing—review and editing, F.K.S., L.T.T. and O.A.Z.; visualization, F.K.S. and O.A.Z.; supervision, F.K.S. and O.A.Z.; funding acquisition, F.K.S., O.A.Z. and J.L. All authors have read and agreed to the published version of the manuscript.

Funding

This research was funded by Adama Science and Technology University (No. ASTU/AS-R/013/2021), Wachemo University, and by Brain Pool program funded by the Ministry of Science and ICT through the National Research Foundation of Korea (NRF-2021H1D3A2A01099457, 2022H1D3A2A01093556).

Data Availability Statement

All the generated data during the study are included in the manuscript.

Acknowledgments

The authors would like to thank the Postgraduate program of Adama Science and Technology University, the Research and Technology Transfer Office, Wachemo University, Brain Pool program, and the National Research Foundation of Korea.

Conflicts of Interest

The authors declare no conflict of interest.

References

  1. Khalid, Z.B.; Nasrullah, M.; Nayeem, A.; Wahid, Z.; Singh, L.; Krishnan, S. Application of 2D Graphene-Based Nanomaterials for Pollutant Removal from Advanced Water and Wastewater Treatment Processes. In ACS Symposium Series; American Chemical Society: New York, NY, USA, 2020; pp. 191–217. [Google Scholar]
  2. Lu, F.; Astruc, D. Nanomaterials for removal of toxic elements from water. Coord. Chem. Rev. 2018, 356, 147–164. [Google Scholar] [CrossRef]
  3. Ibrahim, R.; Hayyan, M.; AlSaadi, M.; Hayyan, A.; Ibrahim, S. Environmental application of nanotechnology: Air, soil, and water. Environ. Sci. Pollut. Res. 2016, 23, 13754–13788. [Google Scholar] [CrossRef]
  4. Zhang, Y.; Wu, B.; Xu, H.; Liu, H.; Wang, M.; He, Y.; Pan, B. Nanomaterials-enabled water and wastewater treatment. NanoImpact 2016, 3, 22–39. [Google Scholar] [CrossRef]
  5. Silva, C.; Faria, J. Effect of key operational parameters on the photocatalytic oxidation of phenol by nanocrystalline sol-gel TiO2 under UV irradiation. J. Mol. Catal. A Chem. 2009, 305, 147–154. [Google Scholar] [CrossRef]
  6. Mandeep; Gupta, G.; Liu, H.; Shukla, P. Pulp and paper industry–based pollutants, their health hazards and environmental risks. Curr. Opin. Environ. Sci. Health 2019, 12, 48–56. [Google Scholar] [CrossRef]
  7. Sivaram, N.; Gopal, P.; Barik, D. Toxic waste from textile industries. In Energy from Toxic Organic Waste for Heat and Power Generation; Elsevier: Amsterdam, The Netherlands, 2018; pp. 43–54. [Google Scholar]
  8. Ahmad, M.; Mushtaq, S.; Al Qahtani, H.; Sedky, A.; Alam, M. Investigation of TiO2 Nanoparticles Synthesized by Sol-Gel Method for Effectual Photodegradation, Oxidation and Reduction Reaction. Crystals 2021, 11, 1456. [Google Scholar] [CrossRef]
  9. Alam, M.; Al Qahtani, H.; Aamir, M.; Abuzir, A.; Khan, M.; Albuhulayqah, M.; Mushtaq, S.; Zaidi, N.; Ramya, A. Phyto Synthesis of Manganese-Doped Zinc Nanoparticles Using Carica papaya Leaves: Structural Properties and Its Evaluation for Catalytic, Antibacterial and Antioxidant Activities. Polymers 2022, 14, 1827. [Google Scholar] [CrossRef]
  10. Anwer, H.; Mahmood, A.; Lee, J.; Kim, K.; Park, J.; Yip, A. Photocatalysts for degradation of dyes in industrial effluents: Opportunities and challenges. Nano Res. 2019, 12, 955–972. [Google Scholar] [CrossRef]
  11. Gadipelly, C.; Mannepalli, L. Nano-metal oxides for organic transformations. Curr. Opin. Green Sustain. Chem. 2019, 15, 20–26. [Google Scholar] [CrossRef]
  12. Das, T.; Remanan, S.; Ghosh, S.; Das, N. An environment friendly free-standing cellulose membrane derived for catalytic reduction of 4-nitrophenol: A sustainable approach. J. Environ. Chem. Eng. 2021, 9, 104596. [Google Scholar] [CrossRef]
  13. Das, T.; Das, N. Advances on catalytic reduction of 4-nitrophenol by nanostructured materials as benchmark reaction. Int. Nano Lett. 2022, 12, 223–242. [Google Scholar] [CrossRef]
  14. Nagajyothi, P.; Vattikuti, S.V.P.; Devarayapalli, K.; Yoo, K.; Shim, J.; Sreekanth, T. Green synthesis: Photocatalytic degradation of textile dyes using metal and metal oxide nanoparticles-latest trends and advancements. Crit. Rev. Environ. Sci. Technol. 2020, 50, 2617–2723. [Google Scholar] [CrossRef]
  15. Pirhashemi, M.; Habibi-Yangjeh, A.; Pouran, S.R. Review on the criteria anticipated for the fabrication of highly efficient ZnO-based visible-light-driven photocatalysts. J. Ind. Eng. Chem. 2018, 62, 1–25. [Google Scholar] [CrossRef]
  16. Ullah, H.; Mushtaq, L.; Ullah, Z.; Fazal, A.; Khan, A. Effect of vegetable waste extract on microstructure, morphology, and photocatalytic efficiency of ZnO–CuO nanocomposites. Inorg. Nano-Metal Chem. 2021, 51, 963–975. [Google Scholar] [CrossRef]
  17. Ong, C.; Ng, L.; Mohammad, A. A review of ZnO nanoparticles as solar photocatalysts: Synthesis, mechanisms and applications. Renew. Sustain. Energy Rev. 2018, 81, 536–551. [Google Scholar] [CrossRef]
  18. Sahu, K.; Bisht, A.; Kuriakose, S.; Mohapatra, S. Two-dimensional CuO-ZnO nanohybrids with enhanced photocatalytic performance for removal of pollutants. J. Phys. Chem. Solids 2020, 137, 109223. [Google Scholar] [CrossRef]
  19. Liu, C.; Meng, F.; Zhang, L.; Zhang, D.; Wei, S.; Qi, K.; Fan, J.; Zhang, H.; Cui, X. CuO/ZnO heterojunction nanoarrays for enhanced photoelectrochemical water oxidation. Appl. Surf. Sci. 2019, 469, 276–282. [Google Scholar] [CrossRef]
  20. Taraka, T.Y.; Gautam, A.; Jain, S.; Bojja, S.; Pal, U. Controlled addition of Cu/Zn in hierarchical CuO/ZnO p-n heterojunction photocatalyst for high photoreduction of CO2 to MeOH. J. CO2 Util. 2019, 31, 207–214. [Google Scholar] [CrossRef]
  21. Kumaresan, N.; Sinthiya, M.; Ramamurthi, K.; Babu, R.R.; Sethuraman, K. Visible light driven photocatalytic activity of ZnO/CuO nanocomposites coupled with rGO heterostructures synthesized by solid-state method for RhB dye degradation. Arab. J. Chem. 2020, 13, 3910–3928. [Google Scholar] [CrossRef]
  22. Li, X.; Shen, R.; Ma, S.; Chen, X.; Xie, J. Graphene-based heterojunction photocatalysts. Appl. Surf. Sci. 2018, 430, 53–107. [Google Scholar] [CrossRef]
  23. Liu, F.; Che, Y.; Chai, Q.; Zhao, M.; Lv, Y.; Sun, H.; Wang, Y.; Sun, J.; Zhao, C. Construction of rGO wrapping Cu2O/ZnO heterostructure photocatalyst for PNP and PAM degradation. Environ. Sci. Pollut. Res. 2019, 26, 25286–25300. [Google Scholar] [CrossRef] [PubMed]
  24. Zhen, Z.; Zhu, H. Structure and properties of graphene. In Graphene: Fabrication, Characterizations, Properties and Applications; Elsevier: Amsterdam, The Netherlands, 2017; pp. 1–12. [Google Scholar]
  25. Zhang, G.; Sun, S. Advantages and Challenges of One-Dimensional Nanostructures for Fuel Cell Applications; Elsevier Ltd.: Amsterdam, The Netherlands, 2017. [Google Scholar]
  26. Ramos, P.; Sánchez, L.; Rodriguez, J. A review on improving the efficiency of photocatalytic water decontamination using ZnO nanorods. J. Sol-Gel Sci. Technol. 2022, 102, 105–124. [Google Scholar] [CrossRef]
  27. Zhou, W.; Zhang, X.; Zhao, D.; Gao, M.; Xie, S. ZnO nanorods: Morphology control, optical properties, and nanodevice applications. Sci. China Phys. Mech. Astron. 2013, 56, 2243–2265. [Google Scholar] [CrossRef]
  28. Aspoukeh, P.; Barzinjy, A.; Hamad, S. Synthesis, properties and uses of ZnO nanorods: A mini review. Int. Nano Lett. 2022, 12, 153–168. [Google Scholar] [CrossRef]
  29. Liu, T.; Wang, Q.; Jiang, P. Morphology-dependent photo-catalysis of bare zinc oxide nanocrystals. RSC Adv. 2013, 3, 12662–12670. [Google Scholar] [CrossRef]
  30. Man, H.; Wen, C.; Luo, W.; Bian, J.; Wang, W.; Li, C. Simultaneous deSOx and deNOx of marine vessels flue gas on ZnO-CuO/rGO: Photocatalytic oxidation kinetics. J. Ind. Eng. Chem. 2020, 92, 77–87. [Google Scholar] [CrossRef]
  31. Tantubay, K.; Das, P.; Sen, M.B. Ternary reduced graphene oxide–CuO/ZnO nanocomposite as a recyclable catalyst with enhanced reducing capability. J. Environ. Chem. Eng. 2020, 8, 103818. [Google Scholar] [CrossRef]
  32. Firoozi, S.; Hosseini-Sarvari, M. Visible-Light-Induced C-P-Bond Formation Using Reduced Graphene Oxide Decorated with Copper Oxide/Zinc Oxide (rGO/CuO/ZnO) as Ternary Recyclable Nanophotocatalyst. ChemistrySelect 2021, 6, 1764–1771. [Google Scholar] [CrossRef]
  33. Maity, C.; Hatui, G.; Verma, K.; Udayabhanu, G.; Pathak, D.; Nayak, G. Single pot fabrication of N doped reduced GO (N-rGO) /ZnO-CuO nanocomposite as an efficient electrode material for supercapacitor application. Vacuum 2018, 157, 145–154. [Google Scholar] [CrossRef]
  34. Wang, C.; Zhu, J.; Liang, S.; Bi, H.; Han, Q.; Liu, X.; Wang, X. Reduced graphene oxide decorated with CuO-ZnO hetero-junctions: Towards high selective gas-sensing property to acetone. J. Mater. Chem. A 2014, 2, 18635–18643. [Google Scholar] [CrossRef]
  35. Jyoti; Varma, G.D. Synthesis of CuO-ZnO/rGO ternary composites for superior NO2 gas sensor at room temperature. Mater. Res. Express 2019, 6, 035011. [Google Scholar] [CrossRef]
  36. Jyoti; Srivastava, A.; Varma, G. Highly selective and efficient room temperature NO2 gas sensors based on Zn-doped CuO nanostructure-rGO hybrid. J. Mater. Sci. Mater. Electron. 2018, 29, 10640–10655. [Google Scholar] [CrossRef]
  37. Asgar, H.; Deen, K.; Haider, W. Estimation of electrochemical charge storage capability of ZnO/CuO/reduced graphene oxide nanocomposites. Int. J. Energy Res. 2020, 44, 1580–1593. [Google Scholar] [CrossRef]
  38. Schütz, M.; Xiao, L.; Lehnen, T.; Fischer, T.; Mathur, S. Microwave-assisted synthesis of nanocrystalline binary and ternary metal oxides. Int. Mater. Rev. 2018, 63, 341–374. [Google Scholar] [CrossRef]
  39. Kumar, A.; Kuang, Y.; Liang, Z.; Sun, X. Microwave chemistry, recent advancements, and eco-friendly microwave-assisted synthesis of nanoarchitectures and their applications: A review. Mater. Today Nano 2020, 11, 100076. [Google Scholar] [CrossRef]
  40. Zaaba, N.; Foo, K.; Hashim, U.; Tan, S.; Liu, W.; Voon, C. Synthesis of Graphene Oxide using Modified Hummers Method: Solvent Influence. Procedia Eng. 2017, 184, 469–477. [Google Scholar] [CrossRef]
  41. De Silva, K.; Huang, H.; Yoshimura, M. Progress of reduction of graphene oxide by ascorbic acid. Appl. Surf. Sci. 2018, 447, 338–346. [Google Scholar] [CrossRef]
  42. Prakash, A.; Sahu, N.; Bahadur, D. Enhanced photocatalytic performance of ZnO-reduced graphene oxide hybrid synthesized via ultrasonic probe-assisted study. In AIP Conference Proceedings; American Institute of Physics: College Park, MD, USA, 2013; Volume 1512, pp. 312–313. [Google Scholar]
  43. Zelekew, O.; Kuo, D. Facile synthesis of SiO2@CuxO@TiO2 heterostructures for catalytic reductions of 4-nitrophenol and 2-nitroaniline organic pollutants. Appl. Surf. Sci. 2017, 393, 110–118. [Google Scholar] [CrossRef]
  44. Bolaghi, Z.K.; Masoudpanah, S.; Hasheminiasari, M. Photocatalytic activity of ZnO/RGO composite synthesized by one-pot solution combustion method. Mater. Res. Bull. 2019, 115, 191–195. [Google Scholar] [CrossRef]
  45. Alam, S.; Sharma, N.; Kumar, L. Synthesis of Graphene Oxide (GO) by Modified Hummers Method and Its Thermal Reduction to Obtain Reduced Graphene Oxide (rGO)*. Graphene 2017, 6, 1–18. [Google Scholar] [CrossRef]
  46. Thakur, S.; Karak, N. Green reduction of graphene oxide by aqueous phytoextracts. Carbon N. Y. 2012, 50, 5331–5339. [Google Scholar] [CrossRef]
  47. Omar, F.; Ming, H.N.; Hafiz, S.; Ngee, L. Microwave synthesis of zinc oxide/reduced graphene oxide hybrid for adsorption-photocatalysis application. Int. J. Photoenergy 2014, 2014, 176835. [Google Scholar] [CrossRef] [Green Version]
  48. Priyadharsan, A.; Shanavas, S.; Vasanthakumar, V.; Balamuralikrishnan, B.; Anbarasan, P. Synthesis and investigation on synergetic effect of rGO-ZnO decorated MoS2 microflowers with enhanced photocatalytic and antibacterial activity. Colloids Surf. A Physicochem. Eng. Asp. 2018, 559, 43–53. [Google Scholar]
  49. Harish, S.; Archana, J.; Sabarinathan, M.; Navaneethan, M.; Nisha, K.; Ponnusamy, S.; Muthamizhchelvan, C.; Ikeda, H.; Aswal, D.K.; Hayakawa, Y. Controlled structural and compositional characteristic of visible light active ZnO/CuO photocatalyst for the degradation of organic pollutant. Appl. Surf. Sci. 2017, 418, 103–112. [Google Scholar] [CrossRef]
  50. Islam, M.; Dominguez, A.; Alvarado-Tenorio, B.; Bernal, R.; Montes, M.; Noveron, J. Sucrose-Mediated Fast Synthesis of Zinc Oxide Nanoparticles for the Photocatalytic Degradation of Organic Pollutants in Water. ACS Omega 2019, 4, 6560–6572. [Google Scholar] [CrossRef] [Green Version]
  51. Renuka, L.; Anantharaju, K.; Vidya, Y.; Nagaswarupa, H.; Prashantha, S.; Nagabhushana, H. Synthesis of Sunlight Driven ZnO/CuO Nanocomposite: Characterization, Optical, Electrochemical and Photocatalytic Studies. Mater. Today Proc. 2017, 4, 11782–11790. [Google Scholar] [CrossRef]
  52. Govindasamy, G.; Mydin, R.; Sreekantan, S.; Harun, N. Compositions and antimicrobial properties of binary ZnO–CuO nanocomposites encapsulated calcium and carbon from Calotropis gigantea targeted for skin pathogens. Sci. Rep. 2021, 11, 99. [Google Scholar] [CrossRef]
  53. Parra, M.; Haque, F. Poly (Ethylene Glycol) (PEG)-assisted shape-controlled synthesis of one-dimensional ZnO nanorods. Optik 2015, 126, 1562–1566. [Google Scholar] [CrossRef]
  54. Wang, Y.; Jiang, F.; Chen, J.; Sun, X.; Xian, T.; Yang, H. In Situ Construction of CNT/CuS Hybrids and Their Application in Photodegradation for Removing Organic Dyes. Nanomaterials 2020, 10, 178. [Google Scholar] [CrossRef] [Green Version]
  55. Kumar, A.; Rout, L.; Achary, L.; Mohanty, S.; Dash, P. A combustion synthesis route for magnetically separable graphene oxide-CuFe2O4-ZnO nanocomposites with enhanced solar light-mediated photocatalytic activity. New J. Chem. 2017, 41, 10568–10583. [Google Scholar] [CrossRef]
  56. Galani, S.; Panda, A. Enhanced Thermocatalytic Activity of Porous Yellow ZnO Nanoflakes: Defect- and Morphology-Induced Perspectives. Chem.—An Asian J. 2019, 14, 612–620. [Google Scholar] [CrossRef]
  57. Arias, F.; Guevara, M.; Tene, T.; Angamarca, P.; Molina, R.; Valarezo, A.; Salguero, O.; Vacacela Gomez, C.; Arias, M.; Caputi, L.S. The adsorption of methylene blue on eco-friendly reduced graphene oxide. Nanomaterials 2020, 10, 4–5. [Google Scholar] [CrossRef] [PubMed] [Green Version]
  58. Mahendran, G.; Ramalingam, S.; Rayappan, J.; Kesavan, S.; Periathambi, T.; Nesakumar, N. Green preparation of reduced graphene oxide by Bougainvillea glabra flower extract and sensing application. J. Mater. Sci. Mater. Electron. 2020, 31, 14345–14356. [Google Scholar] [CrossRef]
  59. Johra, F.; Lee, J.; Jung, W. Facile and safe graphene preparation on solution based platform. J. Ind. Eng. Chem. 2014, 20, 2883–2887. [Google Scholar] [CrossRef]
  60. Momeni, M.; Ghayeb, Y.; Menati, M. Fabrication, characterization and photoelectrochemical properties of cuprous oxide-reduced graphene oxide photocatalysts for hydrogen generation. J. Mater. Sci. Mater. Electron. 2018, 29, 4136–4146. [Google Scholar] [CrossRef]
  61. Rabchinskii, M.; Dideikin, A.; Kirilenko, D.; Baidakova, M.V.; Shnitov, V.V.; Roth, F.; Konyakhin, S.V.; Besedina, N.A.; Pavlov, S.I.; Kuricyn, R.A.; et al. Facile reduction of graphene oxide suspensions and films using glass wafers. Sci. Rep. 2018, 8, 14154. [Google Scholar] [CrossRef] [Green Version]
  62. Singh, D.; Pandey, D.; Yadav, R.; Singh, D. A study of ZnO nanoparticles and ZnO-EG nanofluid. J. Exp. Nanosci. 2013, 8, 731–741. [Google Scholar] [CrossRef] [Green Version]
  63. Saravanakkumar, D.; Sivaranjani, S.; Kaviyarasu, K.; Ayeshamariam, A.; Ravikumar, B.; Pandiarajan, S.; Veeralakshmi, C.; Jayachandran, M.; Maaza, M. Synthesis and characterization of ZnO-CuO nanocomposites powder by modified perfume spray pyrolysis method and its antimicrobial investigation. J. Semicond. 2018, 39, 033001. [Google Scholar] [CrossRef]
  64. Lei, X.; Cao, Y.; Chen, Q.; Ao, X.; Fang, Y.; Liu, B. ZIF-8 derived hollow CuO/ZnO material for study of enhanced photocatalytic performance. Colloids Surf. A Physicochem. Eng. Asp. 2019, 568, 1–10. [Google Scholar] [CrossRef]
  65. Sathishkumar, P.; Sweena, R.; Wu, J.; Anandan, S. Synthesis of CuO-ZnO nanophotocatalyst for visible light assisted degradation of a textile dye in aqueous solution. Chem. Eng. J. 2011, 171, 136–140. [Google Scholar] [CrossRef]
  66. Yu, J.; Zhuang, S.; Xu, X.; Zhu, W.; Feng, B.; Hu, J. Photogenerated electron reservoir in hetero-p-n CuO-ZnO nanocomposite device for visible-light-driven photocatalytic reduction of aqueous Cr(vi). J. Mater. Chem. A 2015, 3, 1199–1207. [Google Scholar] [CrossRef]
  67. Xu, L.; Zhou, Y.; Wu, Z.; Zheng, G.; He, J.; Zhou, Y. Improved photocatalytic activity of nanocrystalline ZnO by coupling with CuO. J. Phys. Chem. Solids 2017, 106, 29–36. [Google Scholar] [CrossRef]
  68. Lavín, A.; Sivasamy, R.; Mosquera, E.; Morel, M. High proportion ZnO/CuO nanocomposites: Synthesis, structural and optical properties, and their photocatalytic behavior. Surf. Interfaces 2019, 17, 100367. [Google Scholar] [CrossRef]
  69. Park, Y.; Yang, J.; Ryu, B.; Cho, J.; Cuong, T.; Hong, C.-H. Solution-processed multidimensional ZnO/CuO heterojunction as ultraviolet sensing. Opt. Mater. Express 2015, 5, 1752. [Google Scholar] [CrossRef]
  70. Zou, W.; Zhang, L.; Liu, L.; Wang, X.; Sun, J.; Wu, S.; Deng, Y.; Tang, C.; Gao, F.; Dong, L. Engineering the Cu2O-reduced graphene oxide interface to enhance photocatalytic degradation of organic pollutants under visible light. Appl. Catal. B Environ. 2016, 181, 495–503. [Google Scholar] [CrossRef]
  71. Chen, C.; Liu, X.; Fang, Q.; Chen, X.; Liu, T.; Zhang, M. Self-assembly synthesis of CuO/ZnO hollow microspheres and their photocatalytic performance under natural sunlight. Vacuum 2020, 174, 109198. [Google Scholar] [CrossRef]
  72. Prabhu, Y.; Rao, V.N.; Shankar, M.; Sreedhar, B.; Pal, U. The facile hydrothermal synthesis of CuO@ZnO heterojunction nanostructures for enhanced photocatalytic hydrogen evolution. New J. Chem. 2019, 43, 6794–6805. [Google Scholar] [CrossRef]
  73. Tufa, L.; Oh, S.; Tran, V.; Kim, J.; Jeong, K.-J.; Park, T.; Kim, H.J.; Lee, J. Electrochemical immunosensor using nanotriplex of graphene quantum dots, Fe3O4, and Ag nanoparticles for tuberculosis. Electrochim. Acta 2018, 290, 369–377. [Google Scholar] [CrossRef]
  74. Xu, H.; Fang, W.; Xu, L.; Liu, F. Batch Preparation of CuO/ZnO-Loaded Nanofiber Membranes for Photocatalytic Degradation of Organic Dyes. Langmuir 2020, 36, 14189–14202. [Google Scholar] [CrossRef]
  75. Wei, Q.; Wang, Y.; Qin, H.; Wu, J.; Lu, Y.; Chi, H.; Yang, F.; Zhou, B.; Yu, H.; Liu, J. Construction of rGO wrapping octahedral Ag-Cu2O heterostructure for enhanced visible light photocatalytic activity. Appl. Catal. B Environ. 2018, 227, 132–144. [Google Scholar] [CrossRef]
  76. Guo, F.; Huang, X.; Chen, Z.; Cao, L.; Cheng, X.; Chen, L.; Shi, W. Construction of Cu3P-ZnSnO3-g-C3N4 p-n-n heterojunction with multiple built-in electric fields for effectively boosting visible-light photocatalytic degradation of broad-spectrum antibiotics. Sep. Purif. Technol. 2021, 265, 118477. [Google Scholar] [CrossRef]
  77. Thatikayala, D.; Min, B. Ginkgo leaves extract-assisted synthesis of ZnO/CuO nanocrystals for efficient UV-induced photodegradation of organic dyes and antibacterial activity. J. Mater. Sci. Mater. Electron. 2021, 32, 17154–17169. [Google Scholar] [CrossRef]
  78. Shaker-Agjekandy, S.; Habibi-Yangjeh, A. Microwave-assisted one-pot method for preparation of ZnO/AgI nanocomposites with highly enhanced photocatalytic activity under visible-light irradiation. Desalin. Water Treat. 2016, 57, 16015–16023. [Google Scholar] [CrossRef]
  79. Fang, H.; Guo, Y.; Wu, T.; Liu, Y. Biomimetic synthesis of urchin-like CuO/ZnO nanocomposites with excellent photocatalytic activity. New J. Chem. 2018, 42, 12779–12786. [Google Scholar] [CrossRef]
  80. Hayyan, M.; Hashim, M.; Alnashef, I. Superoxide Ion: Generation and Chemical Implications. Chem. Rev. 2016, 116, 3029–3085. [Google Scholar] [CrossRef] [Green Version]
  81. Jenny, S.; Masaya, M.; Masato, T.; Jinlong, Z.; Yu, H.; Masakazu, A.; Detlef, W.B. Understanding TiO2 photocatalysis: Mechanisms and materials. Chem. Rev. 2014, 114, 9919–9986. [Google Scholar]
  82. Imangaliyeva, A.; Mastai, Y.; Seilkhanova, G. In situ synthesis and catalytic properties of Cu2O nanoparticles based on clay materials and polyethylene glycol. J. Nanoparticle Res. 2019, 21, 97. [Google Scholar] [CrossRef]
  83. Kandula, S.; Jeevanandam, P. Synthesis of Cu2O@Ag Polyhedral Core-Shell Nanoparticles by a Thermal Decomposition Approach for Catalytic Applications. Eur. J. Inorg. Chem. 2016, 2016, 1548–1557. [Google Scholar] [CrossRef]
  84. Zhao, Y.; Li, R.; Jiang, P.; Zhang, K.; Dong, Y.; Xie, W. Mechanistic Study of Catalytic Hydride Reduction of -NO2 to -NH2 Using Isotopic Solvent and Reducer: The Real Hydrogen Source. J. Phys. Chem. C 2019, 123, 15582–15588. [Google Scholar] [CrossRef]
  85. Emiru, T.; Ayele, D. Controlled synthesis, characterization and reduction of graphene oxide: A convenient method for large scale production. Egypt. J. Basic Appl. Sci. 2017, 4, 74–79. [Google Scholar] [CrossRef] [Green Version]
  86. Majumdar, D.; Baugh, N.; Bhattacharya, S. Ultrasound assisted formation of reduced graphene oxide-copper (II) oxide nanocomposite for energy storage applications. Colloids Surf. A Physicochem. Eng. Asp. 2017, 512, 158–170. [Google Scholar] [CrossRef]
Scheme 1. Diagrammatic illustration of (rGO-ZnO)/CuO NCs synthesis by MW-assisted method.
Crystals 13 00133 sch001
Figure 1. (A) XRD patterns of GO, rGO, ZnO, CuO-ZnO, and (rGO-ZnO)/CuO samples; (B) FTIR spectra of ZnO, CuO-ZnO, and (rGO-ZnO)/CuO samples.
Crystals 13 00133 g001
Figure 2. ZnO (A,D), CuO-ZnO, (B,E), and (rGO-ZnO)/CuO (C,F) samples with low and high magnifications; (G) EDS spectrum of (rGO-ZnO)/CuO; (H) layered image; and EDS elemental mappings of: (I) carbon, (J) copper, (K) oxygen, and (L) zinc.
Crystals 13 00133 g002
Figure 3. TEM images of (rGO-ZnO)/CuO (A,B) and HRTEM (C).
Crystals 13 00133 g003
Figure 4. (A) UV–vis absorbance spectra, (B) Tauc’s plot, and (C) PL spectra of ZnO, CuO-ZnO, and (rGO-ZnO)/CuO samples.
Crystals 13 00133 g004
Figure 5. Progress of MB degradation using catalysts: ZnO NRs (A), CuO-ZnO NCs (B), and (rGO-ZnO)/CuO NCs (C); (D) plots of Ct/C0 vs. t; (E) plots of ln(Ct/C0) vs. t for MB degradation using ZnO, CuO-ZnO, and (rGO-ZnO)/CuO NCs; (F) effect of scavengers on the photocatalytic degradation of MB using (rGO-ZnO)/CuO NCs.
Crystals 13 00133 g005
Figure 6. Photocatalytic degradation of MB using catalysts: ZnO NRs (A), CuO-ZnO NCs (B), and (rGO-ZnO)/CuO NCs (C); (D) plots of Ct/C0 vs. reaction time (min); (E) plots of ln(Ct/C0) vs. reaction time (min) for MB degradation using ZnO, CuO-ZnO, and (rGO-ZnO)/CuO NCs; (F) effect of scavengers on the photocatalytic degradation of MB using (rGO-ZnO)/CuO NCs.
Crystals 13 00133 g006
Scheme 2. Mechanism of 4-NP reduction in the presence of (rGO-ZnO)/CuO NCs and NaBH4.
Crystals 13 00133 sch002
Table 1. Comparison of (rGO-ZnO)/CuO NCs to previous reports against photocatalytic degradation of MB.
CatalystSynthesis
Method
Experimental ConditionsPerformanceRef.
Catalyst
(mg)
Conc. of
MB
LightEfficiency
(%)
Ratio Constant,
K (min−1g−1)
ZnO/CuOCombustion4020 ppmSolar93 in 60 min0.5575[51]
CuO-ZnOWet chemical55 µMSolar93.8 in 20 min27.2[18]
ZnO–CuOCo-precipitation250.001 MVis95.60.94[16]
GO–CuFe2O4–ZnOCombustion1040 ppmSolar100 in 40 min9.94[55]
ZnO/CuOBiocombustion4010 ppmUV99.2 in 60 min1.45[77]
MoS2-ZnO-rGOHydrothermal10020 ppmSolar90 in 75 min-[48]
(rGO-ZnO)/CuOMW4010 ppmVis90 in 105 min11.7This work
Disclaimer/Publisher’s Note: The statements, opinions and data contained in all publications are solely those of the individual author(s) and contributor(s) and not of MDPI and/or the editor(s). MDPI and/or the editor(s) disclaim responsibility for any injury to people or property resulting from any ideas, methods, instructions or products referred to in the content.

