Article

Influence of Sublacustrine Fan Depositional Model on Distribution and Morphology of Reservoirs: A Case Study in Eastern Slope of Liaoxi Uplift, Bohai Bay Basin, East China

1
School of Earth Resources, China University of Geosciences, Wuhan 430074, China
2
Key Laboratory of Tectonics and Petroleum Resources, Ministry of Education, China University of Geosciences, Wuhan 430074, China
3
School of Resources and Civil Engineering, Northeastern University, Shenyang 110819, China
4
CNOOC Tianjin Branch, Tianjin 300459, China
*
Authors to whom correspondence should be addressed.
Energies 2023, 16(2), 851; https://doi.org/10.3390/en16020851
Submission received: 28 November 2022 / Revised: 30 December 2022 / Accepted: 9 January 2023 / Published: 11 January 2023
(This article belongs to the Special Issue Modeling and Production of Oil-Gas Reservoirs)

Abstract

:
The study on morphology and distribution of sublacustrine fan are necessary for the exploration of oil and gas, which could help to effectively predict the reservoirs of sublacustrine fans. In this paper, the distribution and geomorphology of sublacustrine fans of Dongying Formation in Liaoxi uplift (Bohai Bay Basin, East China) and their controlling factors (including shape and formations) have been analyzed in detail based on seismic, core, and logging data. The main conclusions achieved in this study are: (1) During the sequence of the third member of Dongying Formation (SQd3), two types of sublacustrine fan, including channelized fan (in channel shape) and non-channelized fan (in tongue shape and lobe shape), developed on the eastern slope of Liaoxi uplift, which inherited the characteristics of sediments structural maturity in braided river delta front (good sandstone sorting and high structural maturity); (2) Steep slope was favorable for forming tongue shape sublacustrine fans with large ratio of length and width, while gentle slope tended to deposit lobe shape fans; high mud content tended to form stable channels with strong erosion on the slope end, while high sand content tended to form continuous lobes with lobe shape; (3) In the basin with uplift, the beneficial combination among provenance, relative lake level change and paleomorphology, determines the development and distribution of sublacustrine fan, and the sublacustrine fan deposits are mainly concentrated in the TST. The Yanshan fold belt in the west provided sufficient sediments to the Liaodong Bay during LST for the development of a sublacustrine fan in the east slope of Liaoxi uplift since the Liaoxi uplift sunk into the water, with the result that the deposition of braided river delta front can overlap the uplift. The incised canyons in the Liaoxi uplift provided the channels for sediments entering into the eastern slope, and the main sedimentary location of lacustrine fans was between two stages of faults. This study could provide a theoretical basis for researching the characteristics and distribution of other sublacustrine fans in similar basin backgrounds.

1. Introduction

The study of the submarine fan model has resulted in the development process of the classical submarine fan model (turbidity currents) [1,2], Reading and Richards’s submarine fan classification model (high-density turbidity currents) [3,4,5], and the slope fan model (sandy debris flow) [6,7,8]. Subsequently, those research findings were successfully applied in the study of the lake basin [9,10,11]. Therefore, the study of gravity flow in lake basins is in the stage of rapid development [10,12,13,14,15]. Due to the limited scale of the lake basins and frequent tectonic movements, the sedimentary facies of the sublacustrine fan changed faster, and the controlling factors were more complicated than the submarine fan. In recent years, the research on sublacustrine fans has been mainly focused on the gravity flow deposition model (fluid properties), original mechanism, and controlling factors of sublacustrine fans [16,17,18,19,20]. In the sedimentary model of lake basins, it has been gradually recognized that sandy debris flow and high-density turbidity currents in slopes with low-density turbidity currents at the basin floor [21]. This model summarizes the evolution process of gravity flow and the distribution of sublacustrine fans in lake basins and tentatively divides the sandy debris flow and high-density turbidity currents into different evolution stages of gravity flow.
In addition, it has been proved that the depositional process of sublacustrine fans was controlled by a variety of factors, including paleomorphology, relative lake level fluctuations, synsedimentary faults activities, and other tectonic movements [16,22]. However, previous studies have rarely summarized the shape of sublacustrine fans and their controlling factors, which control the distribution of sand bodies and the formation of lithological traps. Relative sea/lake level changes and tectonic movements are the main factors controlling the sequence pattern, as well as the development of sublacustrine fans [23,24,25]. It is well known that submarine fans (sublacustrine fans) mainly develop in low-stand system tract (LST) [26,27]. Nevertheless, with the development of the study, it has been proved that the sublacustrine fan in this study area was not formed in LST, which indicated that the previous exploration direction was not correct. Thus, it is important that the controlling factors of sublacustrine fan geomorphology and its development in the sequence stratigraphic frame.
The Liaodong Bay Depression is the slope zone at the edge of the basin with uplift-like (Liaoxi uplift) “island chain”. It is believed that the Liaoxi uplift mainly played an important role in blocking the distant source of Yanshan from entering the Liaozhong sag during the third member of the Dongying Formation (Ed3), but the “island chain” special structural pattern may provide the possibility for the development of the sublacustrine fan. During the second member of the Dongying Formation (Ed2), the Liaoxi uplift was located underwater and covered by distal braided river delta deposits. The end of the large-scale distal braided river delta front is the place where the sublacustrine fans develop. Therefore, the previous research work on the sublacustrine fan in the Liaodong Bay Depression mainly focused on the strata of the lower second member of the Dongying Formation (Ed2x) in the northern region [28,29]. The sandy debris flow model plays a good guiding role in the prediction of sublacustrine fans [30,31,32]. However, with the progress of exploration in lithological traps, sublacustrine fans have been discovered in the Ed3, on the eastern slope of the Liaoxi uplift. In this paper, seismic data, cores data, and logging data from Liaoxi uplift have been analyzed in detail, which were used to discuss: (1) shape characteristics and types of the sublacustrine fan in the SQd3; (2) controlling factors of the sublacustrine fan shape; (3) controlling factors of sublacustrine fan enrichment. This work would provide a theoretical basis for predicting the distribution of sublacustrine fans and lithological traps more effectively.

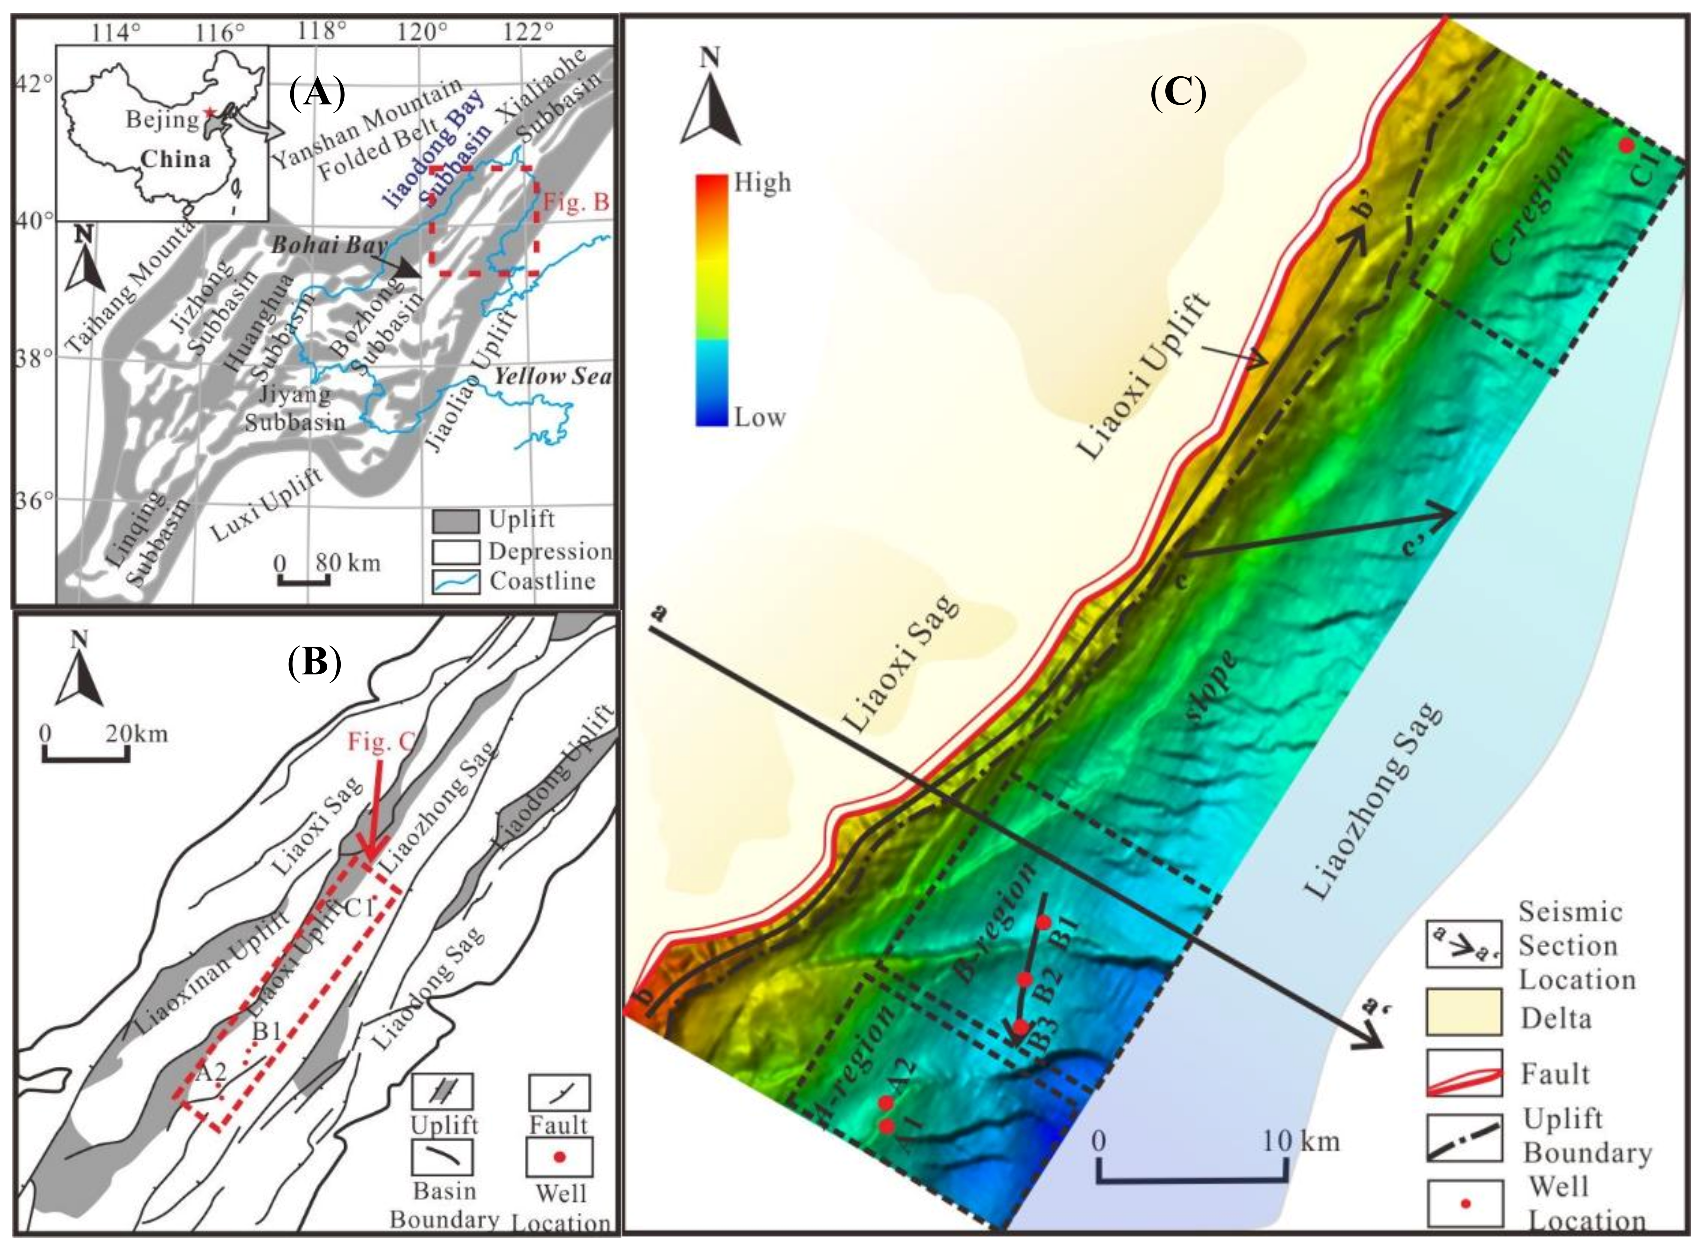
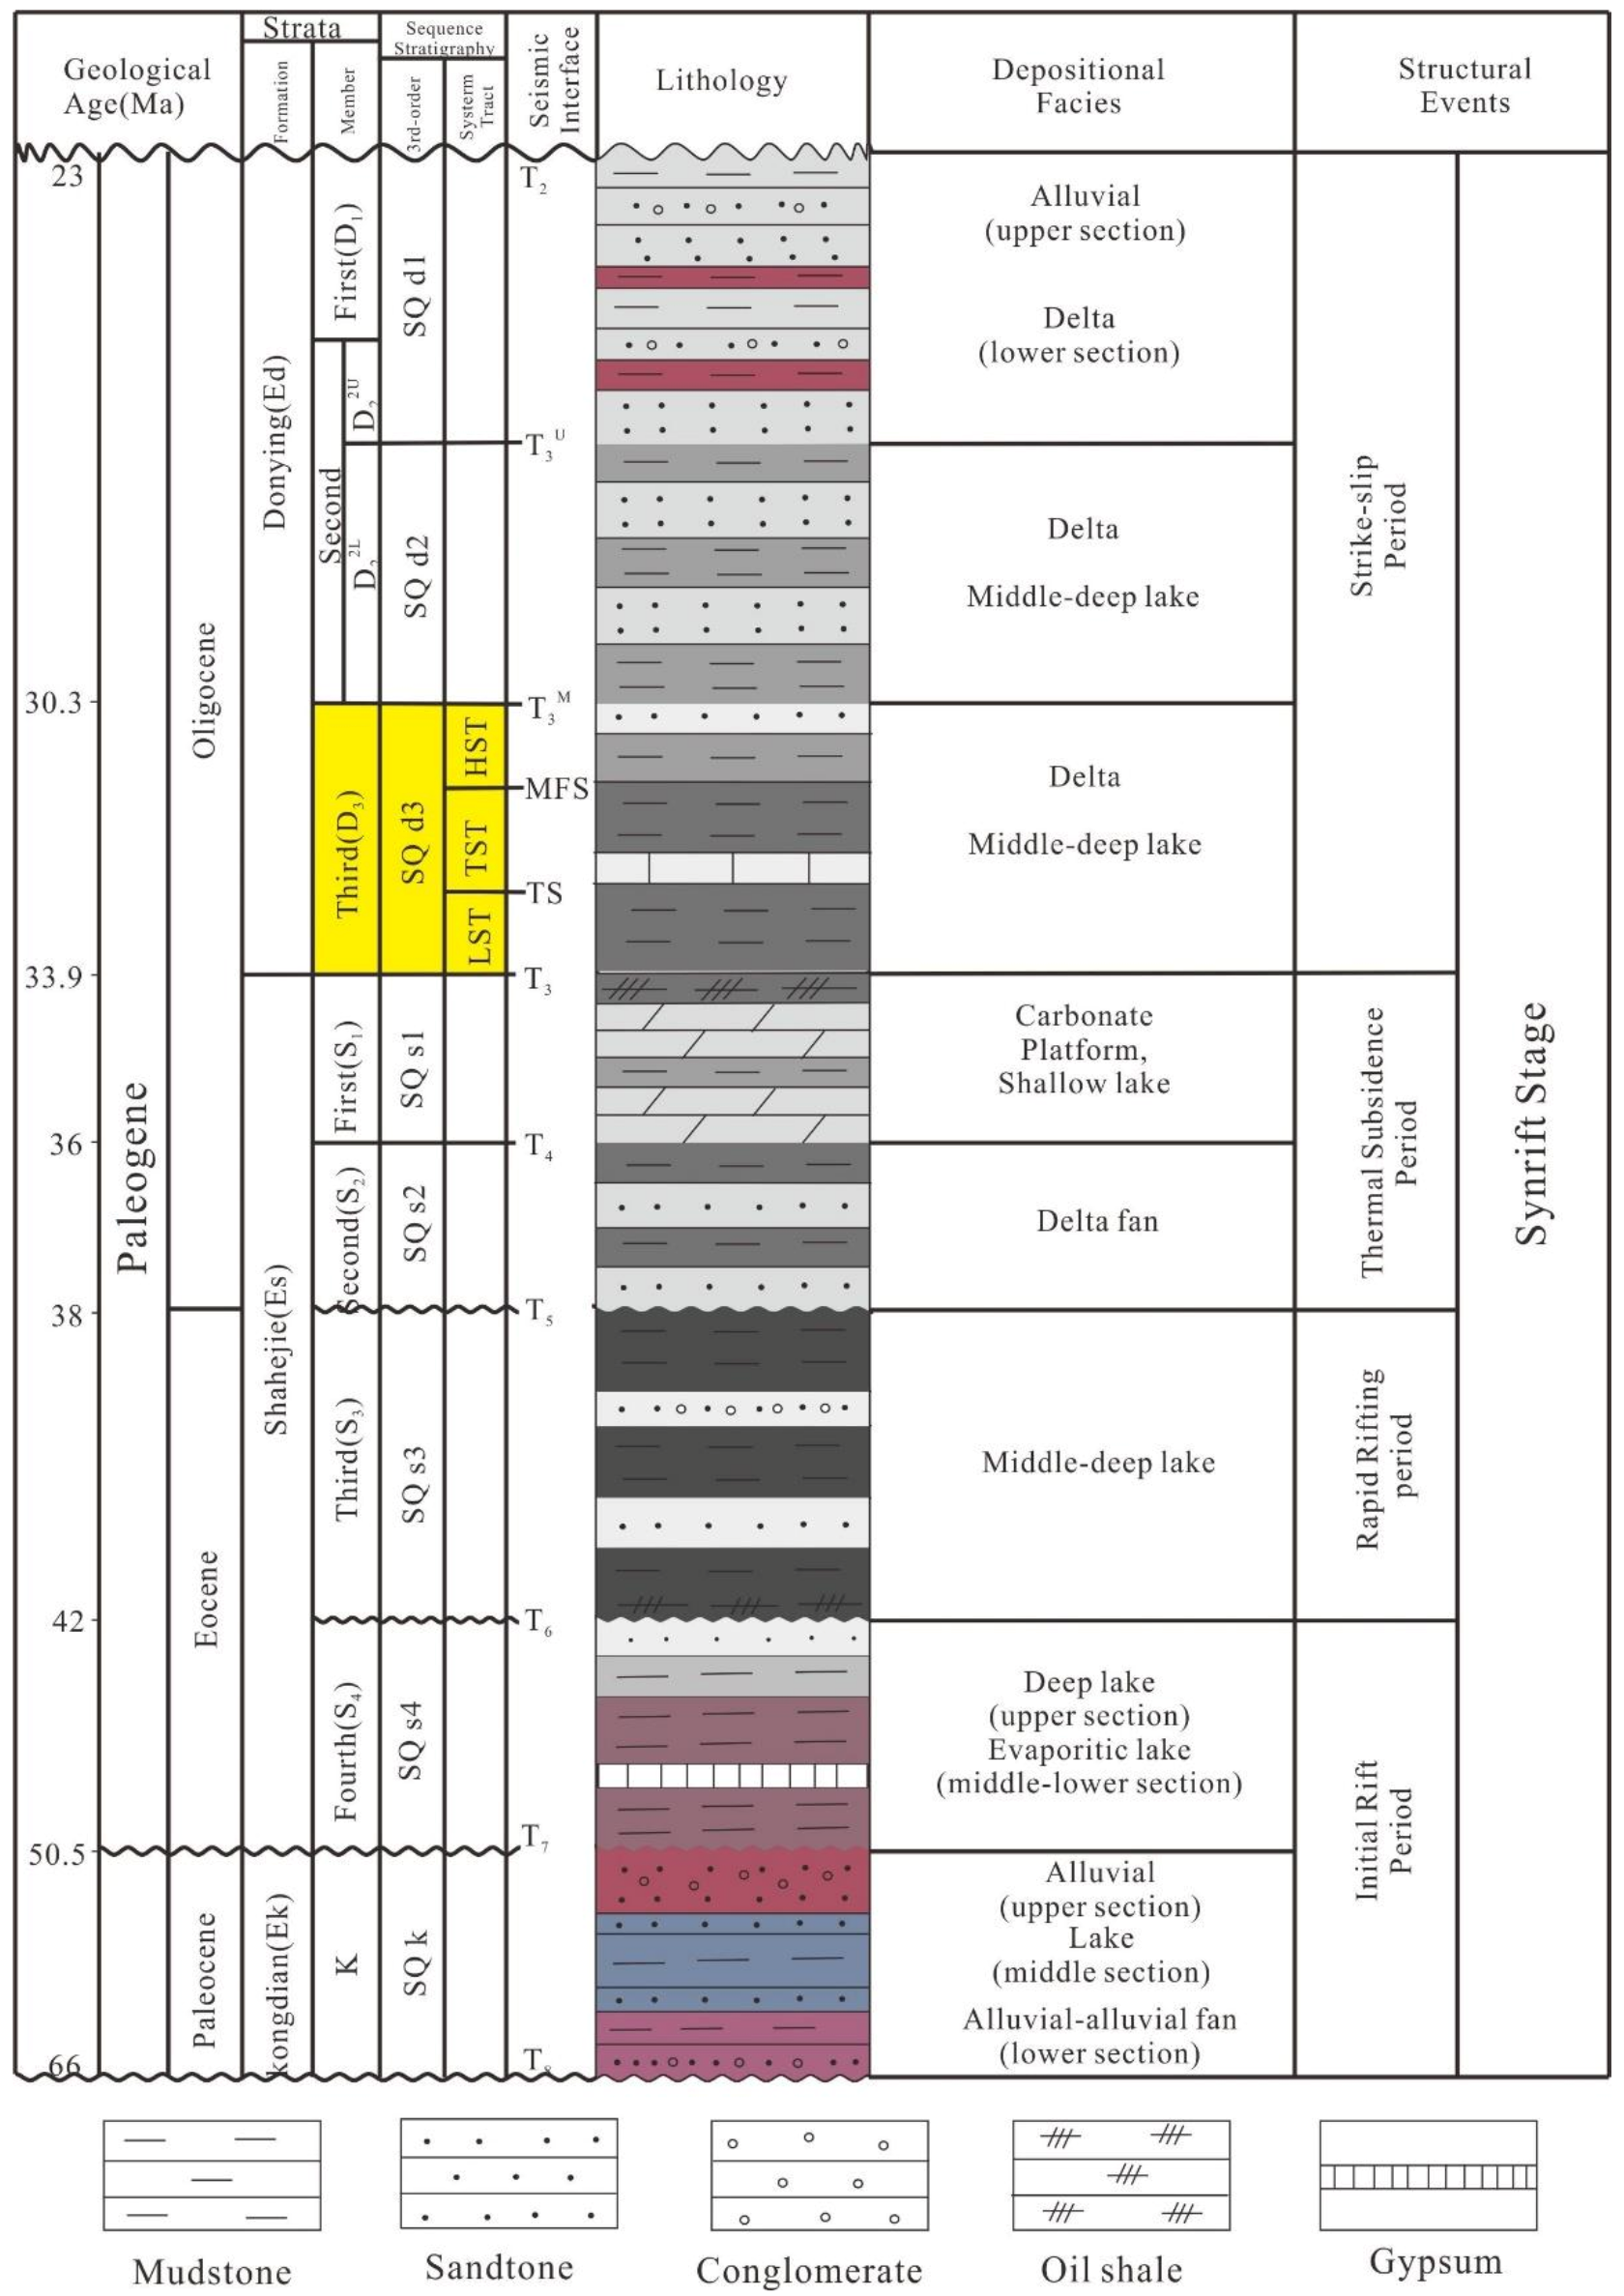
2. Regional Geological Setting

The Bohai Bay Basin is located in the coastal area of northeastern China (Figure 1A). The Liaodong Bay Depression is located in the northeastern part of the Bohai Bay basin, with a northeast trend, which is between the Jiaoliao Uplift (east) and the Yanshan Uplift (west). The Liaodong Bay Depression belongs to the first-level structural unit of the Bohai Bay Basin, where contains three sags (Liaoxi Sag, Liaozhong Sag, Liaodong Sag) and three uplifts (Liaoxinan Uplift, Liaoxi Uplift, Liaodong Uplift) in structural pattern (Figure 1B and Figure 2A) [33,34,35].
During the Paleogene, the Liaodong Bay Depression experienced four stages of tectonic evolution (Figure 3): (1) initial rifting from Paleocene to middle Eocene; (2) rapid rifting in the late Eocene; (3) thermal subsidence after the first rifting in the early Oligocene (Es2, Es1); (4) rifting of strike-slip pull-apart from middle to late Oligocene (Ed) [36,37].
The Paleogene strata in Liaodong Bay include Shahejie Formation and Dongying Formation (Figure 3). The Shahejie Formation consists of the fourth member of Shahejie (Es4), the third member of Shahejie (Es3), the second member of Shahejie (Es2), and the first member of Shahejie (Es1) from bottom to upward. During this depositional stage, sublacustrine fans, fan deltas, braided river deltas, beach bars, and other deposits formed in Liaodong Bay. The Dongying Formation consists of the third member of Dongying (Ed3), the second member of Dongying (Ed2X, Ed2U), and the first member of Dongying (Ed1) from bottom to up, which deposited mainly in fan deltas, braided river deltas, meandering river deltas and sublacustrine fans [38].
Figure 1. (A) Tectonic division and location of Bohai Bay Basin (modified from Jia et al., 2021 [39]). (B) Regional tectonic units of Liaodong Bay Depression. (C) Residual landform of Liaoxi uplift and slope.
Energies 16 00851 g001
Figure 2. (A) Seismic section and structural units of Paleogene strata in Liaodong Bay Depression. (B) Seismic section and sequence boundaries of the SQd3. Annotation: a-a’ and c-c’ are the numbers of seismic section. Figure 1C shows locations.
Energies 16 00851 g002
The study area covers the Liaoxi Uplift and the eastern gentle slope belt (Figure 1C). The Liaoxi Uplift is located in the middle of Liaodong Bay, where the structural characteristics show faulting in the west and overtaking in the east. The western boundary is a normal fault with strike-slip properties, adjacent to the Liaoxi Sag, while the east is a gentle slope, adjacent to the Liaozhong Sag. This study is focused on the Ed3, which is deposited in the 3 sedimentary facies: braided river delta (on the west side of the Liaoxi uplift), deep lacustrine (on the east side of the Liaozhong sag), sublacustrine fan (in the gentle slope of the uplift).
Figure 3. Comprehensive stratigraphic column of Shahejie Formation and Dongying Formation in Liaodong Bay Depression, Bohai Bay Basin (modified after Huang et al., 2016 [40]).
Energies 16 00851 g003

3. Data and Methods

3.1. Data

The data used in this study includes core, log, and 3D seismic data, which were provided by CNOOC Tianjin Branch. The core depth of well B2 is 3224.5 m–3232.5 m, which is in the TST of SQd3. There are 8 sampling points for grain size analysis of Well B1, and the depth is located in the TST of SQd3. The logging curve mainly used in this study is the GR curve. The area of 3D seismic data in this study is about 1000 km2, and the main frequency of the data volume is 27 Hz. A total of 6 wells in the study area can be used, which contain various sedimentary facies.

3.2. Methods

3.2.1. Well-Seismic Data Combination

Because seismic data are in the time domain and well data are in the depth domain, the time–depth relationship needs to be used to link the two. The calibration of the horizon in the well and seismic can be realized by a synthetic seismogram. The general process of making a synthetic seismogram is as follows: (1) the reflection coefficient is calculated from acoustic wave and density logging curve; (2) and the initial synthetic seismogram is obtained by convolution of the reflection coefficient and the extracted seismic wavelet; (3) the initial synthetic seismogram is corrected according to the more accurate velocity field, and then matched with the seismic trace beside the well to obtain the final synthetic seismogram.

3.2.2. Sequence Stratigraphic

Based on the sequence stratigraphic interpretation techniques [41,42], the isochronous stratigraphic framework of the Ed3 was established. The three-level sequence interfaces are T3 (bottom boundary) and T3M (top boundary), respectively (Figure 4). The initial flooding surface (TS) and the maximum flooding surface (MFS) are identified in the sequence of Ed3 (SQd3), divided the SQd3 into the low-stand system tract (LST), the transgressive system tract (TST) and the high-stand system tract (HST). The onlap above the TS and downlap above the MFS could be recognized in the seismic sections (Figure 2B).

3.2.3. Method of the Paleomorphology Reconstruction

In the sequence framework, based on the determination of sedimentary system types by coring data, the distribution and evolution of sedimentary facies in the study area are analyzed in combination with seismic facies characteristics, seismic attribute characteristics, and drilling data.
On the basis above, the paleomorphology is analyzed by using the horizon data of seismic interpretation and fault interpretation data. Hence, on the basis of the frequently used methods for ancient landform restoration, the process of this method is as follows: (1) select isochronous seismic reflection interface; (2) calculate the residual thickness of formation; (3) correct differential settlement. The stratum between T3M to MFS and MFS to TS was selected as the target layer in this study area, which was used to reconstruct the paleomorphology of the HST and the TST.

3.2.4. Method of Relative Lake Level Change Analysis

Furthermore, the relative lake level changes during SQd3 were recovered, based on logging curve GR for spectrum analysis, combined with the existing understanding. It mainly includes two steps: (1) the true value of the GR curve was replaced with the predicted value of maximum entropy spectrum analysis to obtain the spectrum change attribute analysis curve (PEFA). Then the PEFA curve is integrated to obtain the spectrum attribute trend analysis curve (INPEFA). INPEFA curve shows the trend of PEFA value, and its change is controlled by regional events. Therefore, the results of INPEFA can be used to divide high-frequency cycles. (2) Fisher chart takes the number of cycles as the horizontal axis and the cumulative offset of average thickness as the vertical axis. The obtained curve can reflect the change of accommodation space during deposition. Thus, the Fisher chart can be used to analyze the division results of high-frequency cycles and fit the relative lake level change curve.

4. Results

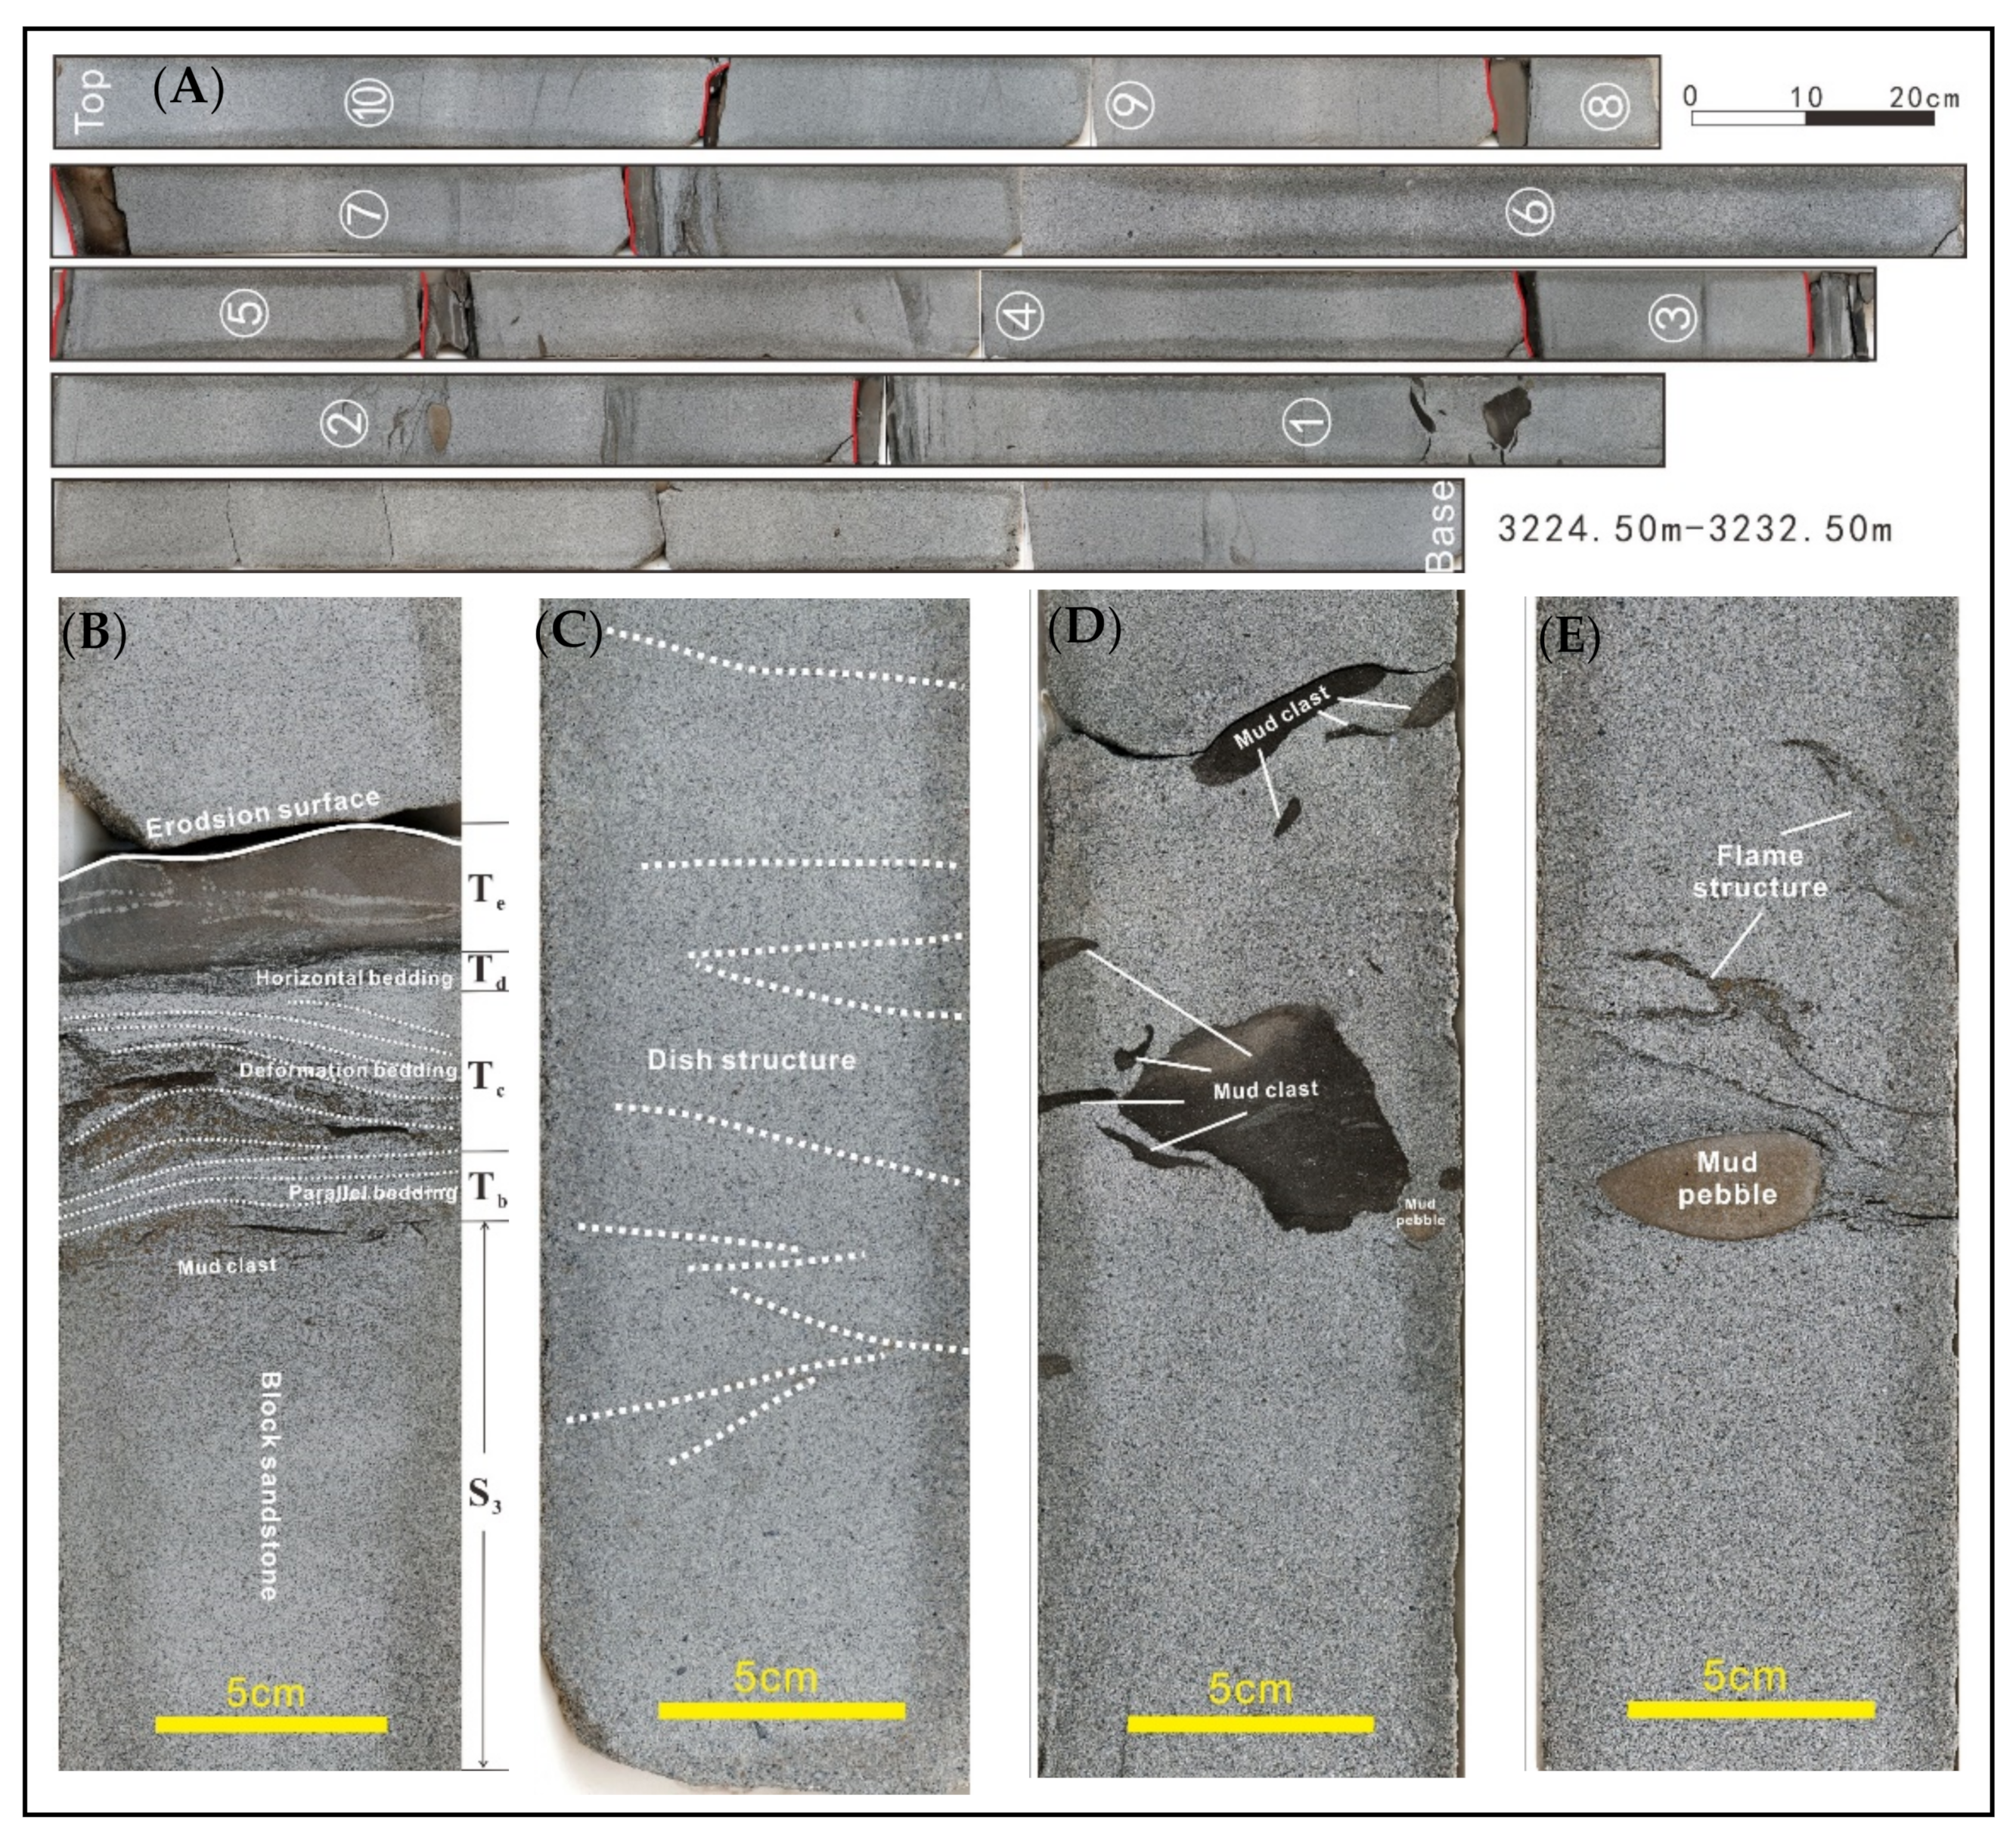
4.1. Sedimentary Characteristics

According to the data analysis of drilling coring and core slices, it is considered that the deposits of gravity flow in the study area are mainly fine-medium sandstone containing coarse sands with medium sorting. The clastic particles are in sub-angular and sub-circular shapes, with particle supporting structure, contacting in point-line (Figure 5A). The content and properties of the matrix can reflect the flow characteristics of the medium and the sorting of clastic components, so it is also an important indicator of the structural maturity of clastic rocks. The deposits of turbidity currents contain a large number of matrices, with the result that sediments are matrix-supporting structures. However, the deposits of HDTC in the study area are mainly filled with cement and supported by particles with few matrices. It suggests the sediments of the HDTC inherit the structural maturity of braided river delta front sediments.
The coring section of well B2 is located in the TST with a length of 8 m, and a total of 10 gravity flow deposits are identified (Figure 4A). Each stage of gravity flow deposition consists of two lithofacies (LF): the massive sandstone facies (LF1) at the bottom and the Bouma sequence (LF2) at the top. LF1 is mainly composed of massive medium sandstone without bedding (Figure 4B). In these lithofacies, mud clasts and mud pebbles occasionally occur (Figure 4D,E), with the escaped structure of water such as flame structure and dish structure (Figure 4C,E). The thickness ranges between 11 cm and 203 cm. LF2 appears as an incomplete Bouma sequence, which includes: parallel bedding of the Tb section (1.5 cm); deformation bedding of the TC section (3.5 cm); horizontal bedding of the Td section (1 cm); and massive mudstone of the Te section (2 cm) (Figure 4B). The subsequent gravity flow lay on the mudstone at the top of the underlying gravity flow deposition, resulting in the erosion surface between the boundary (Figure 4A). Gray mudstone could be occasionally found in the Te section.
Massive sandstones were possibly deposited in the high-density turbidity currents (HDTC), which can be compared with the S3 section of the HDTC deposition sequence published by Lowe (1982) [43]. The sandstone-mudstone couples with the Bouma sequence can be interpreted as deposits of low-density turbidity currents (LDTC). A complete Bouma sequence developed at the top of the 6th gravity flow deposition, and the incomplete Bouma sequence developed in the other nine periods, mainly composed of mudstones of the Te section. Because the new gravity flow caused erosion to the early deposition, the mudstone is in unconformable contact with the upper sandstone. Different gravity flow deposits are bounded by brown mudstone, indicating that they were shallow water environment sediments, which were transported by turbidity currents to the deep lake environment. The existence of brown mudstone in the deep lake area is also a piece of important evidence to identify gravity flow deposition.
Based on the data from well B1, the interval of C value is 576.148 μm–949.738 μm, while the range of M value is 165.465 μm–285.918 μm, showing that the change range of C value and M value is large. The C-M centerline of the well B1 deposition in TST is roughly parallel to the C-M baseline (Figure 5B), which indicates the deposits of turbidity currents. This is because the velocity of gravity flow is very fast; when the velocity decreases, deposition occurs quickly, and the particles are buried immediately after deposition, resulting in the lack of rolling particles in the components. Therefore, the C value of sediment is closely related to the M value.
The particle size distribution histogram of deposits of HDTC in well B1 is in the form of positive skewness and single peak, the average particle size is 2.986, and the peak state is 1.153 (Figure 5C). The Probability Value Cumulative Curve presents an upward arch with two units, which represent the jumping subpopulation and the floating subpopulation, respectively. However, the Probability Value Cumulative Curve of typical turbidity currents deposits is approximately one-unit, with a low slope, illustrating poor sediment sorting and large suspended sub-total content. On the contrary, the large slope of the HDTC Curve indicates the sorting of sediments is well. Moreover, the two stages of the Curve show a gentle transition, indicating that the two subpopulations have a high degree of mixing and a low degree of sedimentary differentiation. Therefore, the deposits of HDTC in the study area often have good sorting due to the deposits of HDTC largely inheriting the structural maturity of braided river delta front deposits.

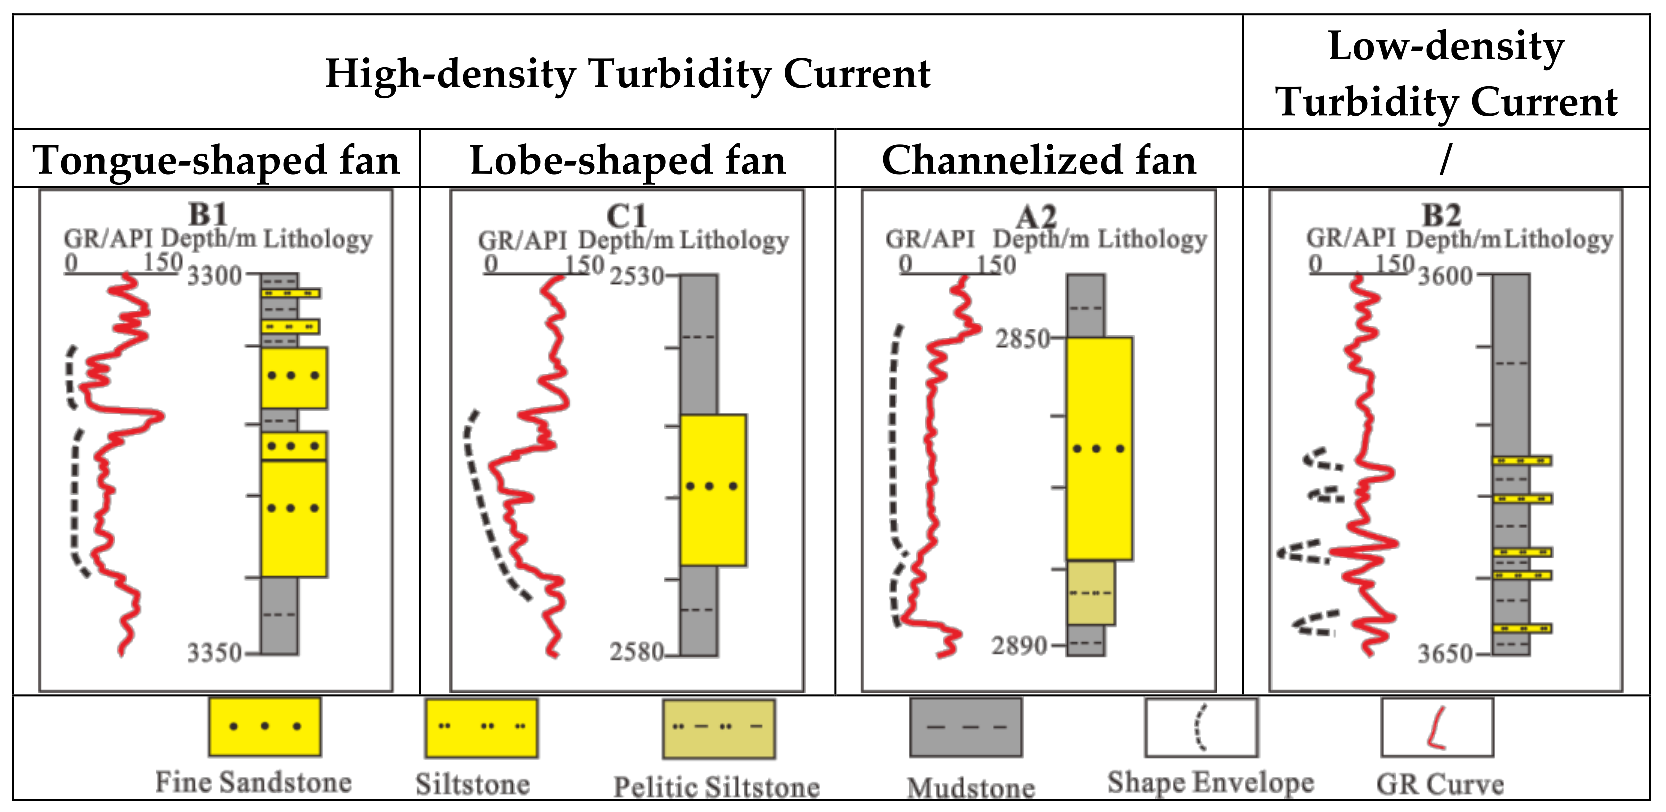
4.2. Logging Curve Characteristics

The deposits of HDTC are mainly fine-medium sandstone, with the thickness of each layer >5 m. The tongue-shaped sublacustrine fan is composed of thick sandstone with thin mudstone, in which the GR curve is box-shaped (Figure 6, well B1). The lobe-shaped sublacustrine fan is composed of thick mudstone intercalated with thick sandstone, in which the GR curve is funnel-shaped (Figure 6, well C1). The channelized fan is composed of thick argillaceous siltstone at the bottom and thick fine sandstone at the top, in which the GR curve is box-shaped (Figure 6, well A2).
The deposits of LDTC are mainly siltstone and fine sandstone, interbedded with thin siltstone and thick mudstone, and the thickness of each layer is less than 3 m. The GR curve is finger-shaped (Figure 6, well B2).

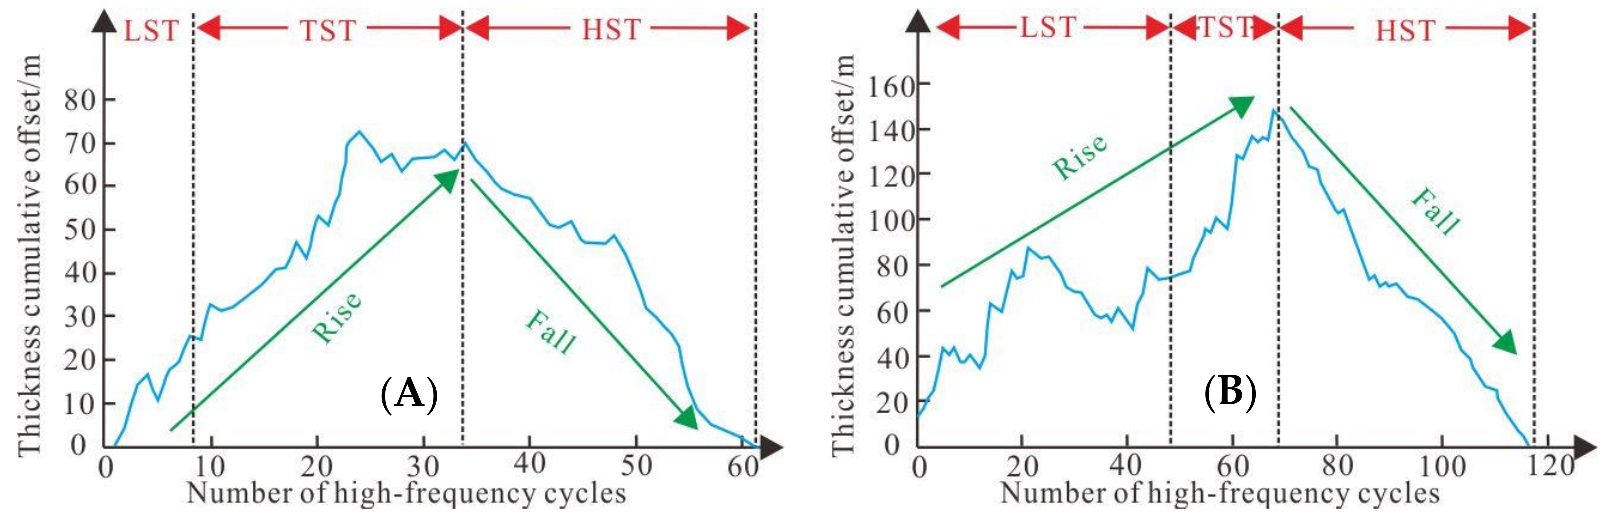
4.3. Relative Lake Level Change

The values of relative lake level were obtained by maximum entropy spectrum analysis, replacing the real value to obtain the PEFA curve. On this basis, the PEFA curve is integrated to obtain a curve INPEFA indicating the trend of PEFA value. The positive trend represents that the mudstone content on the curve is more than predicted in a period of time, which was a transgressive/proluvial stage. The negative trend represents that the sandstone content on the curve is more than predicted over a period of time, which was a regression stage. According to the trend of the INPEFA curve, the high-frequency cycles of wells B1 and B3 were divided. Well B1 is divided into 63 high-frequency cycles, and well B3 is divided into 116 high-frequency cycles (Table 1, Figure 7).
The Fisher diagram takes the number of cycles as the horizontal axis and the accumulation of average thickness offset as the vertical axis to reflect the change of accommodation space, and then reflect the law of rise and fall of lake level [44,45,46]. On the cumulative migration curve, the positive trend represents the continuous growth of accommodation space, indicating the rise of the relative lake level; the negative trend represents the decrease of accommodation space, indicating the decline of the relative lake level. According to the cumulative migration of high-frequency cycle thickness, the relative lake level change of wells B1 and B3 was analyzed, and it was found that: (1) the relative lake level changes of the two wells had similar trends in the period of SQd3, in which the relative lake level fluctuated in the LST + TST period and decreased rapidly in the HST period (Figure 8); (2) in the TST, the relative lake level experienced a slow-fast-slow rise process (Figure 7).

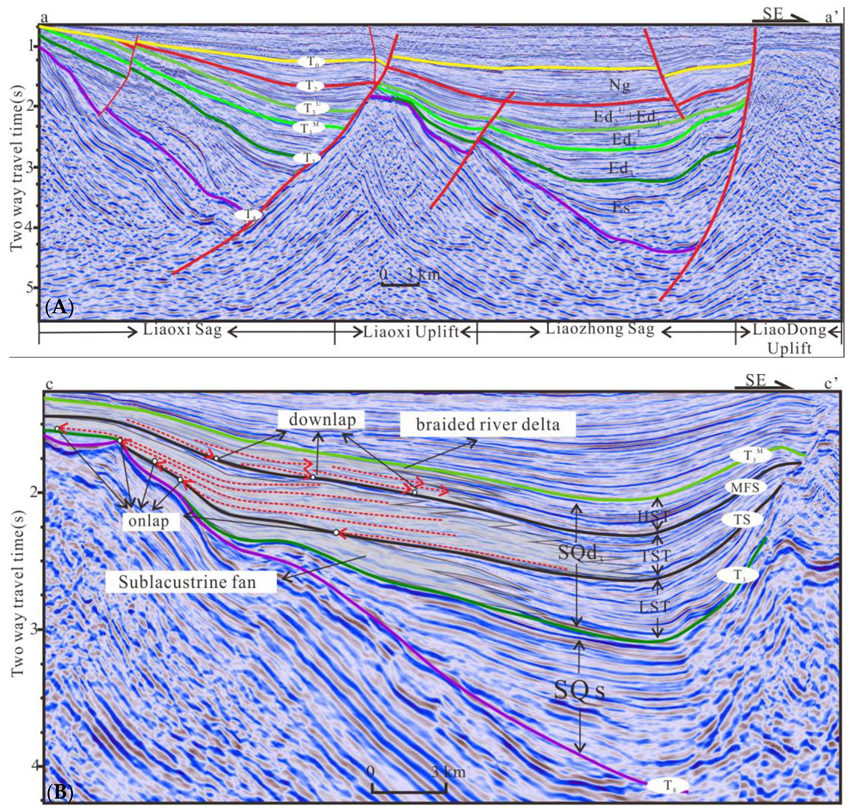
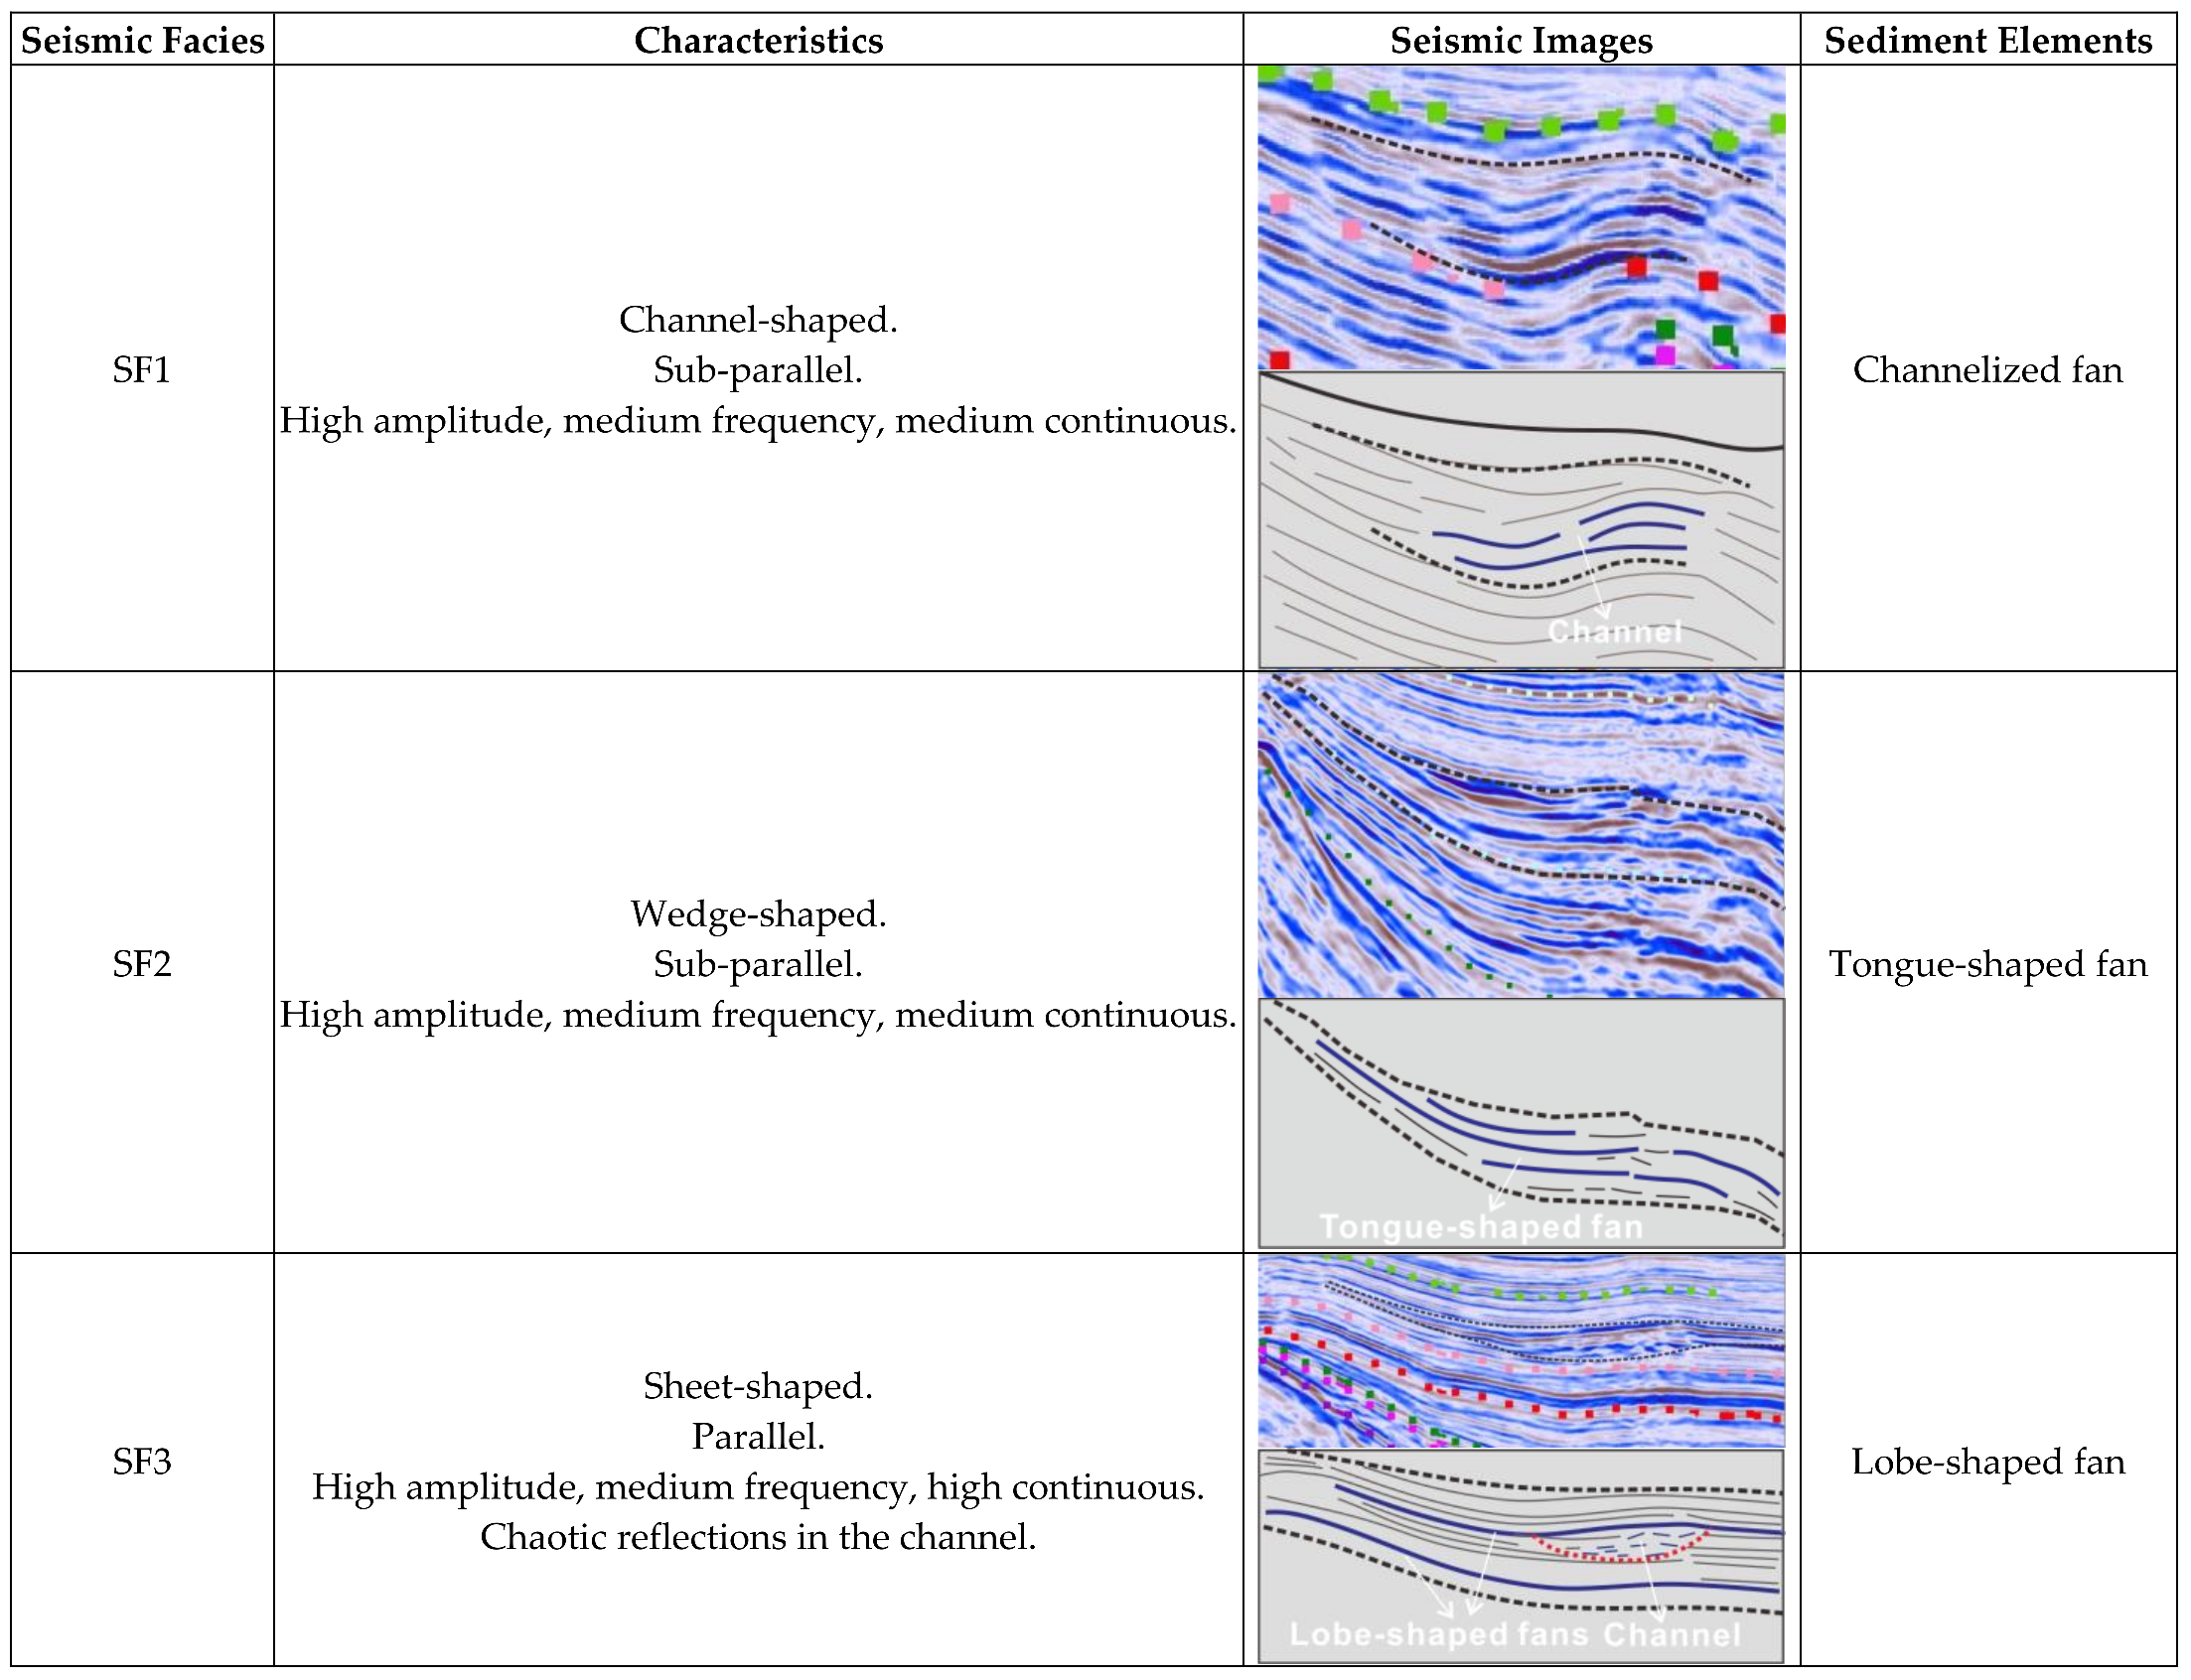
4.4. Seismic Facies Characteristics

Combined with seismic interpretation and attribute analysis, the characteristics of seismic facies of different sublacustrine fans were analyzed. In this study, three seismic facies were identified in deposits of HDTC, as described below.
The external shape of SF1 is channel-shaped. The internal event axis, which are high amplitude, medium frequency, and medium continuity, are subparallel with each other. This reflection structure is consistent with the characteristics of the river channel (Figure 9, SF1).
The external shape of SF2 is wedge-shaped. The internal event axis, which are high amplitude, medium frequency, and medium continuity, are subparallel with each other. This reflection structure is often regarded as sublacustrine fan deposition, characterized by a tongue-shaped fan in the study area (Figure 9, SF2).
The external of SF3 is sheet-shaped. The internal event axis, which are high amplitude, medium frequency, and good continuity, are parallel with each other. This reflection structure is often interpreted as sublacustrine fan deposition, characterized by a lobe-shaped fan in the study area. Some lens with clutter reflection structure could be found in lobe-shaped fan, which is often interpreted as a channel (Figure 9, SF1).

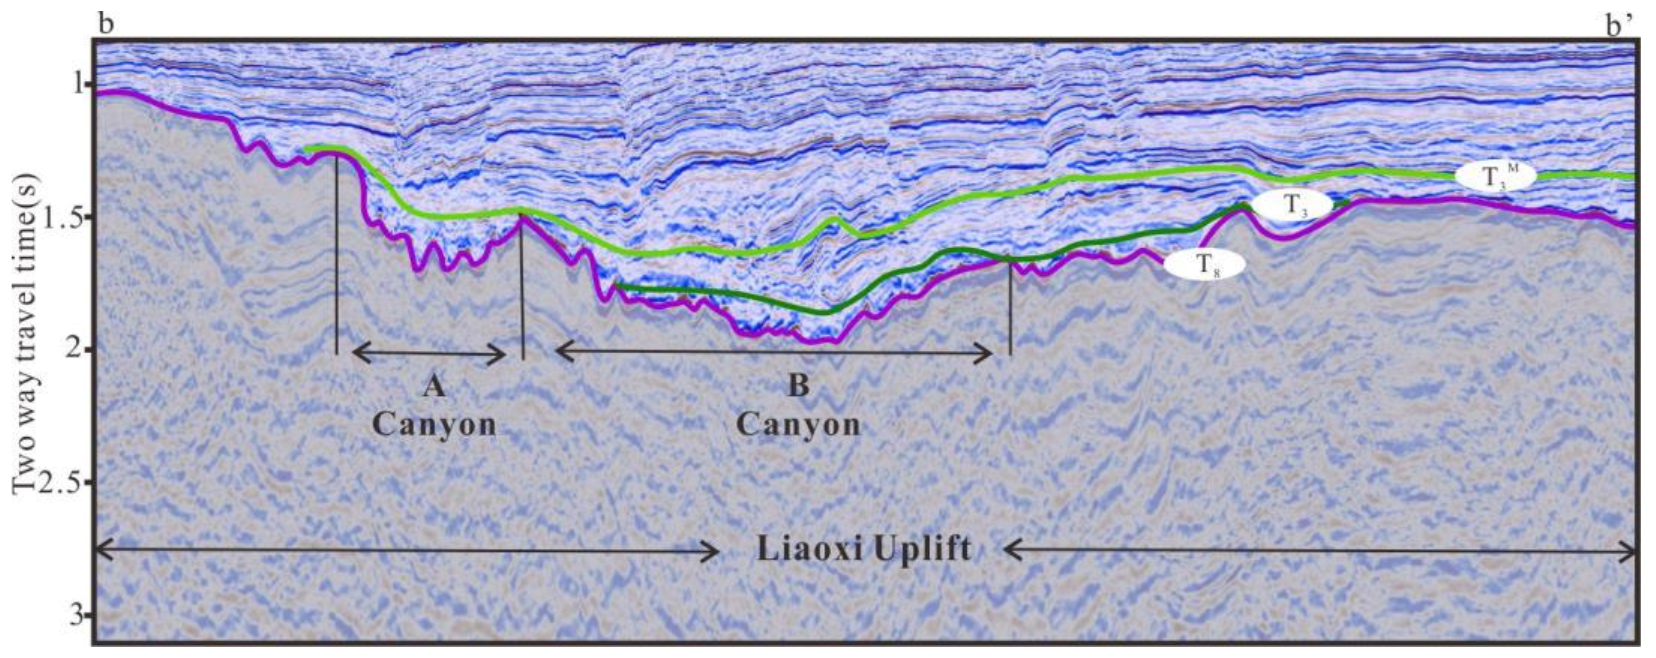
4.5. Paleomorphic Features

Paleomorphology plays an important role in controlling sequence and sedimentary systems. Therefore, the reconstruction of paleomorphology can identify the development and distribution of the sedimentary system, as well as judge the characteristics of the paleogeographic environment, paleontology, and tectonic evolution [47,48,49]. In the period of SQd3, the Liaoxi uplift was corroded only when the “island chain” outcropped during the LST, but its contribution to the depression deposition can be ignored.
Figure 10 indicates that the paleomorphology in the study area is composed of three units, including uplift, slope, and basin floor. In the uplift area, there are two canyons (A and B in Figure 10A and Figure 11), from where the sediments in the distal braided river delta front entered the uplift area. The slope area has different slope break systems due to the existence of faults (Figure 10A). Region A is a single fault slope break system, region B is multiple faults slope break system, and region C is a sedimentary slope break system (Table 2). Moreover, the slope gradient in different areas is also different. By measuring the two-dimensional plane distance (∆L) and three-dimensional space distance (∆s) between two points of the measurement line, the angle formula is used α = Arccosine (∆L/∆s) gets the slope. During the period of TST, the slope of region B is 2.3° (Figure 10B), and the slope of region C is 0.8° (Figure 10C). In the HST, the slope of region A is 0.8° (Figure 10E).

5. Discussion

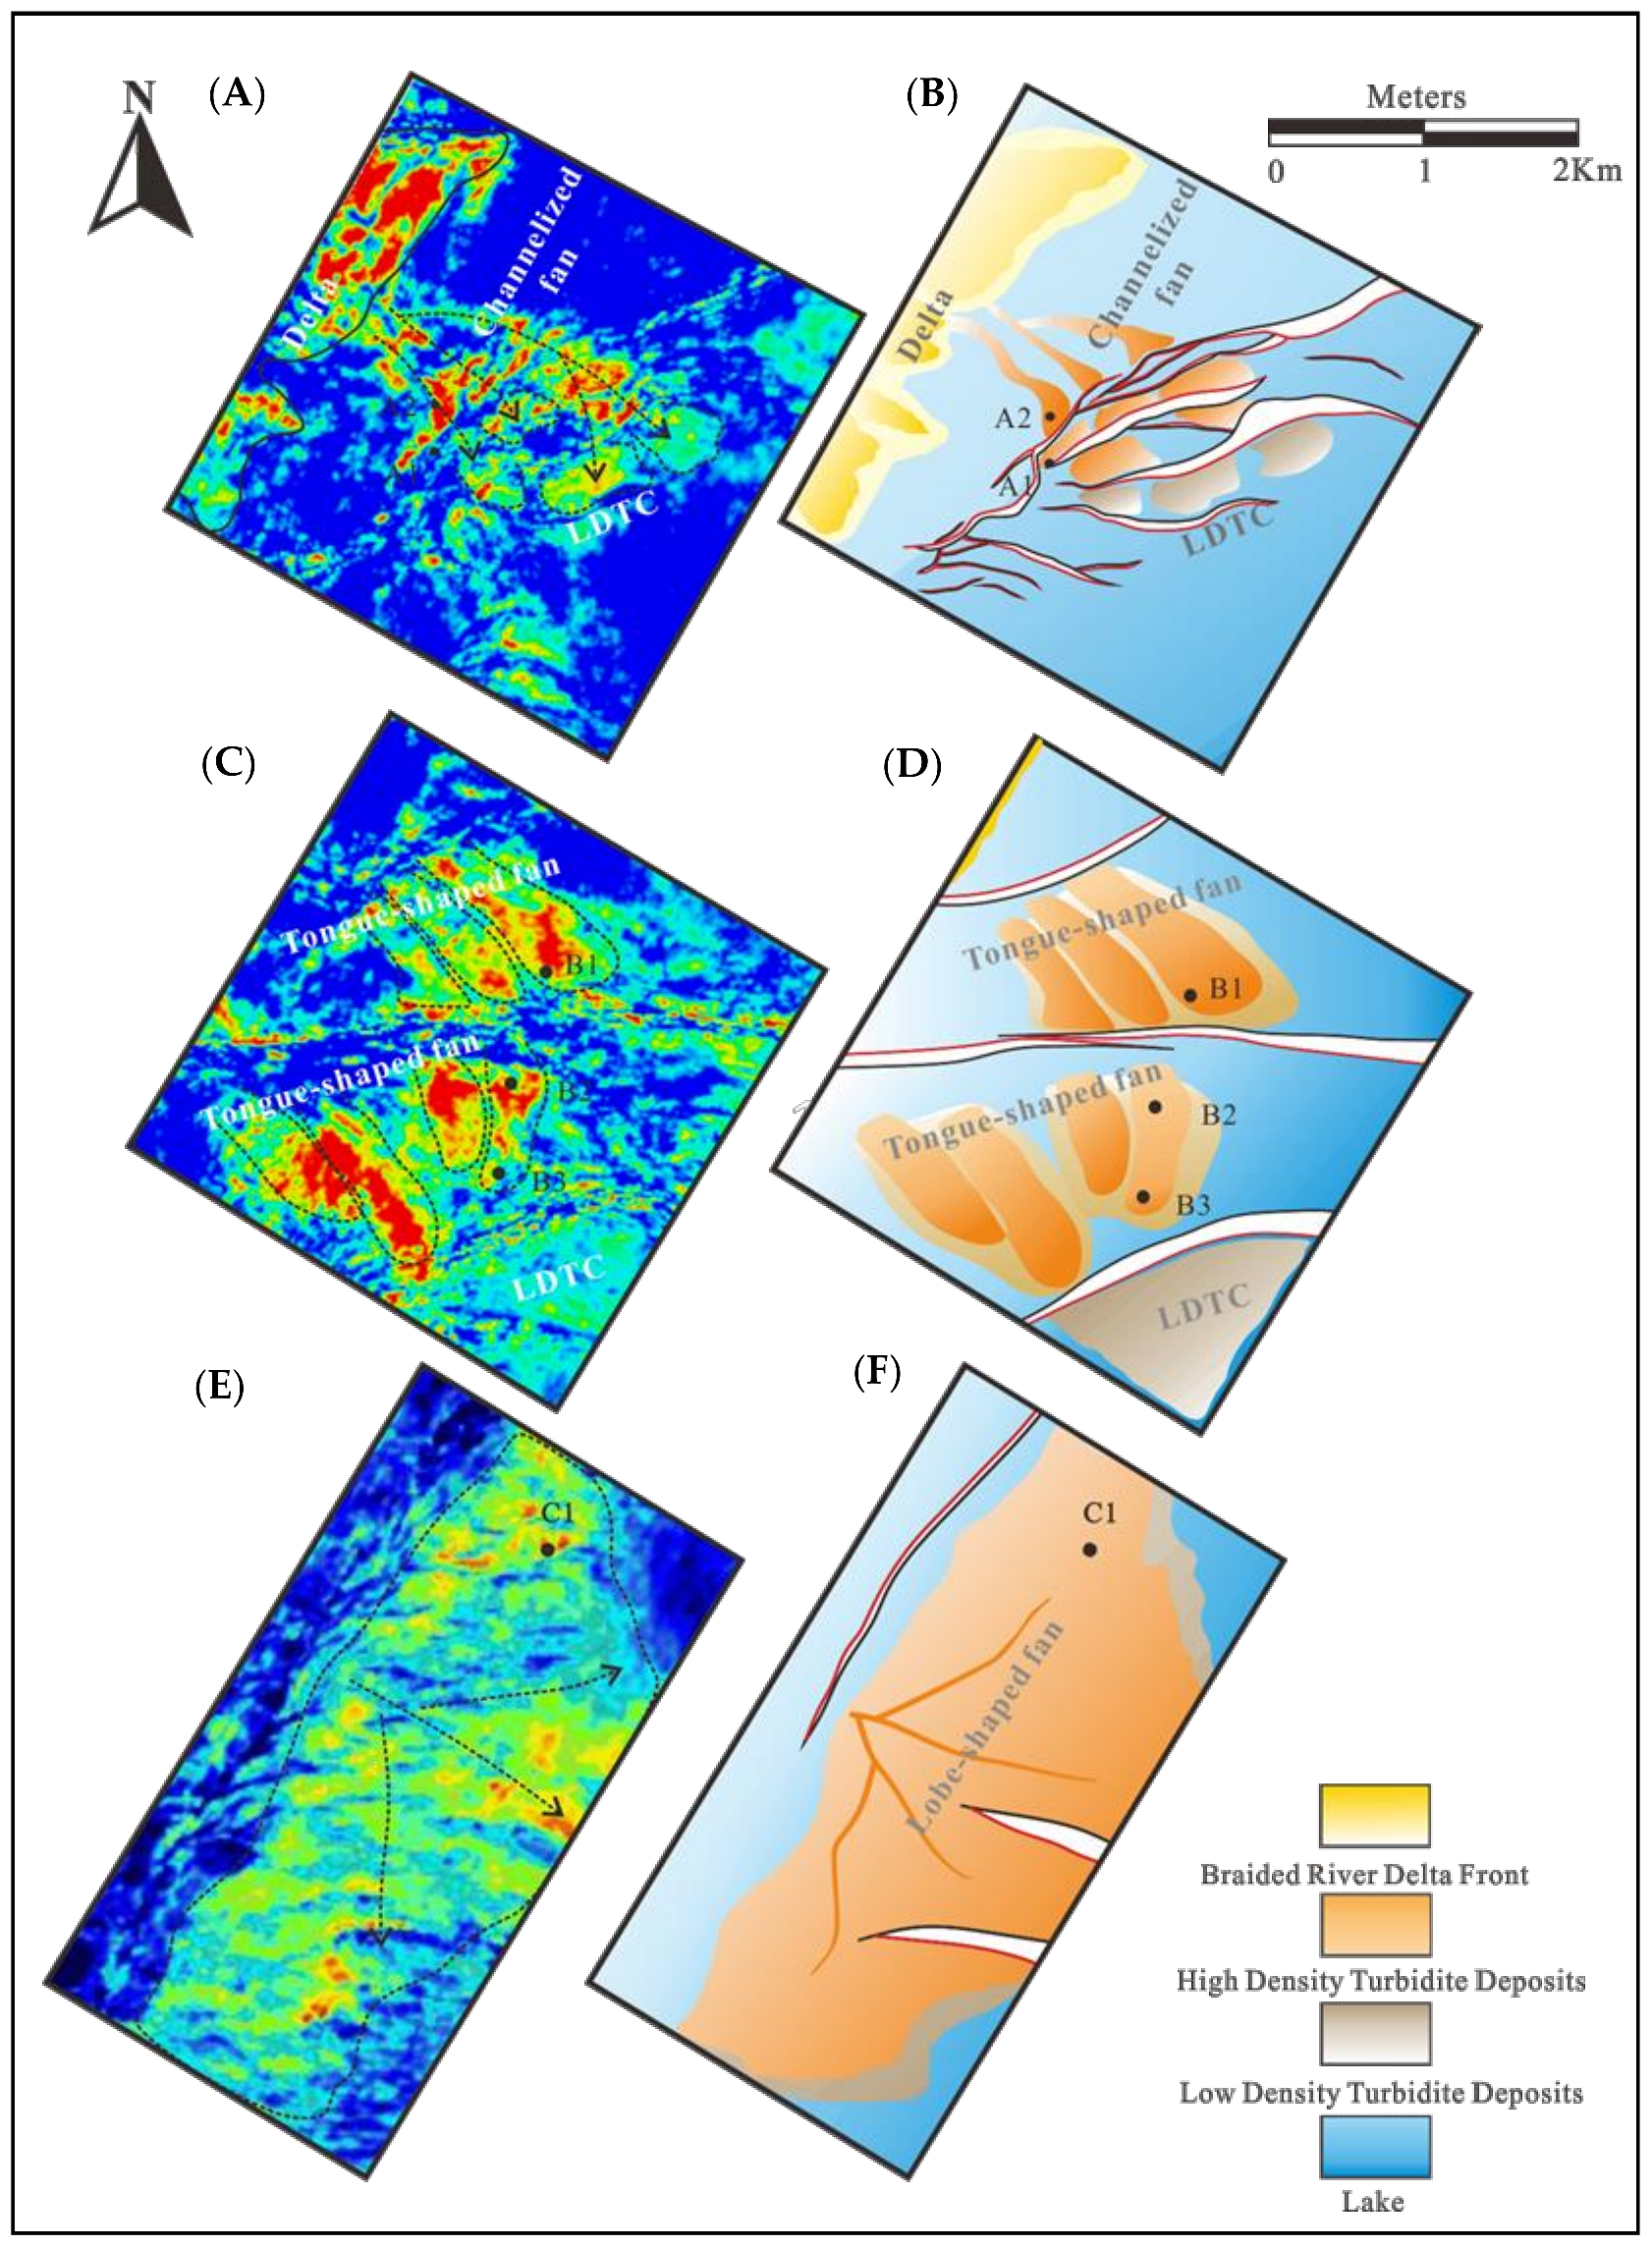
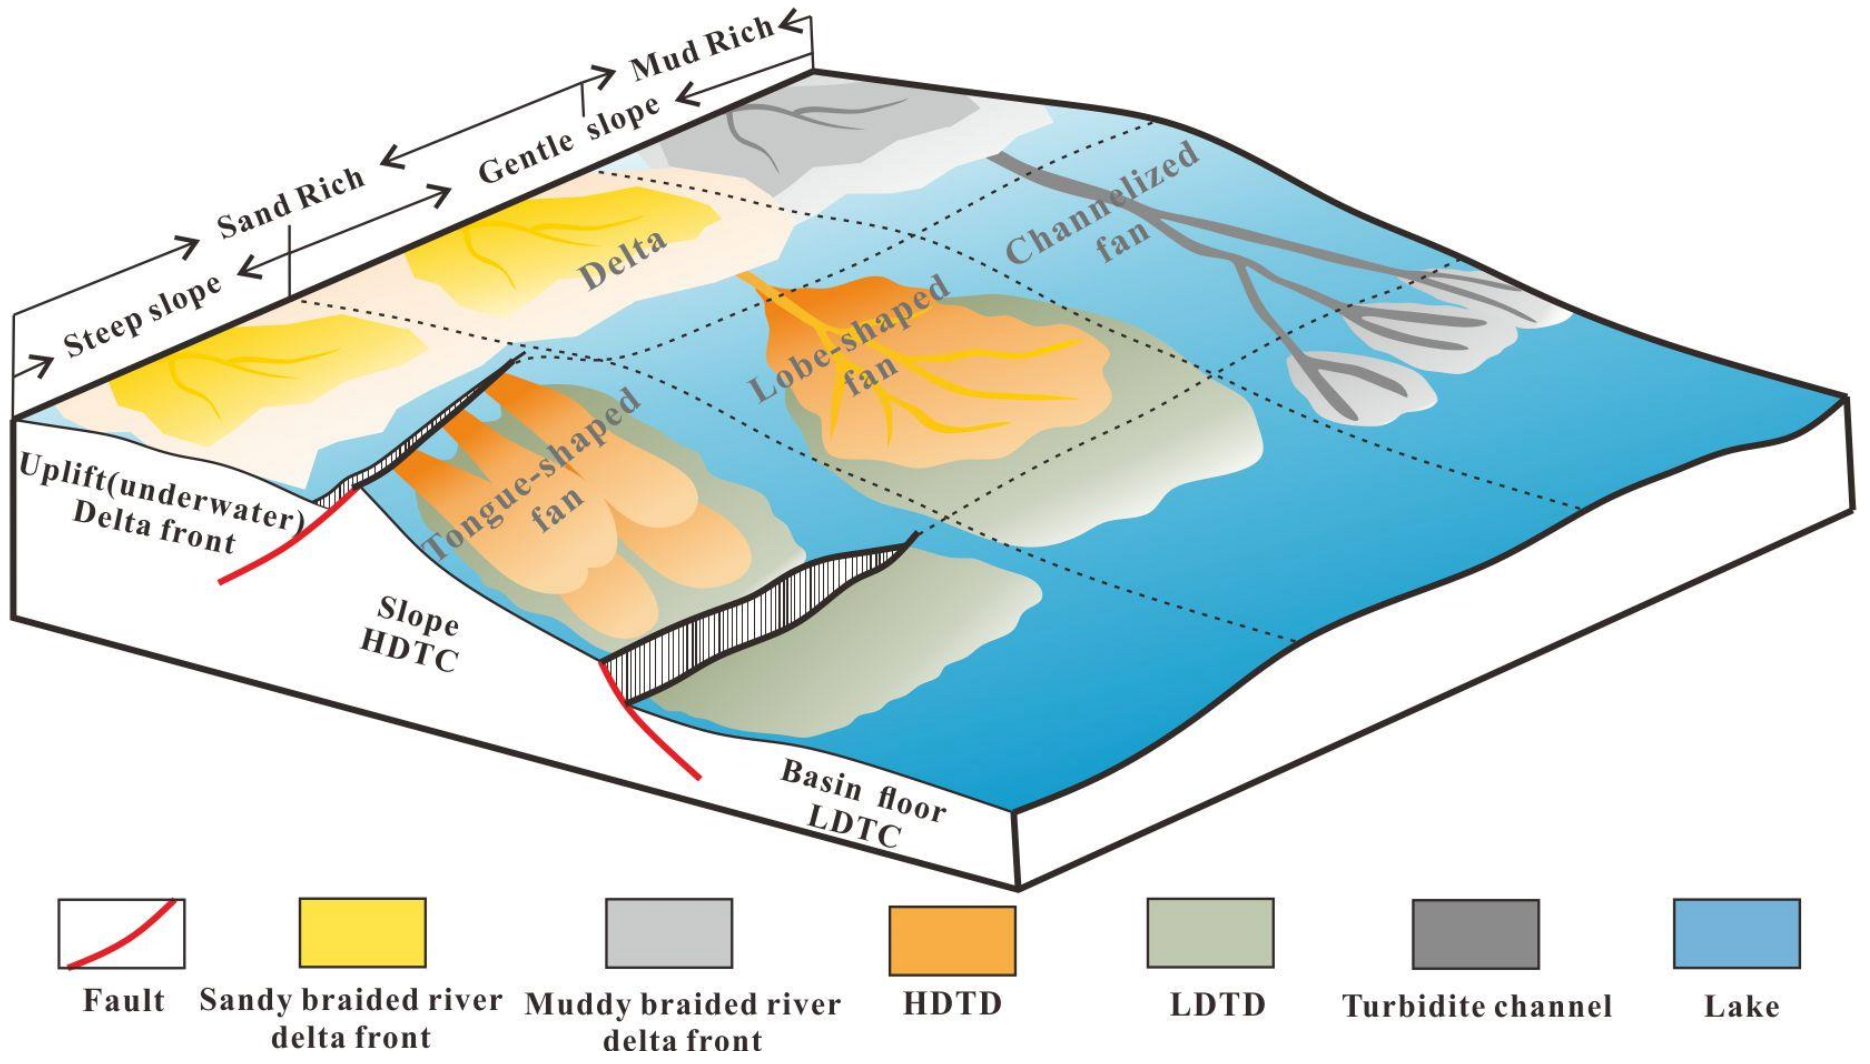
5.1. Types and Distribution Characteristics of Sublacustrine Fan

Combined with seismic attributes, drilling data, and seismic facies analysis, during the SQd3, it is considered that two types of sublacustrine fan developed in three regions, including channelized fan and non-channelized fan, among which non-channelized fan includes a tongue-shaped fan and lobe-shaped fan. The channelized fan developed in HST, A region (Figure 12A,B). The tongue-shaped fan developed in TST, B region (Figure 12C,D). The lobe-shaped fan developed in TST, C region (Figure 12E,F).

5.1.1. Channelized Fan

The channelized fan is obviously banded on the RMS attribute plane (Figure 12A), which seismic reflection characteristics are characterized by medium frequency, high amplitude, medium continuous, sub-parallel, and valley-shaped outer envelope (Figure 9). The GR curve of the channel sediments is in the form of a box shape, with silty mudstone in the early stage and fine sandstone in the late stage (Figure 6). In the early stage, the muddy low-density turbidity current formed turbidite channels on the slope, which were filled by the sandy high-density turbidity current in the late stage. Finally, the gravity flow passed through the fault and evolved into low-density turbidity, residing at the bottom of the slope in a sheet shape (Figure 12B).

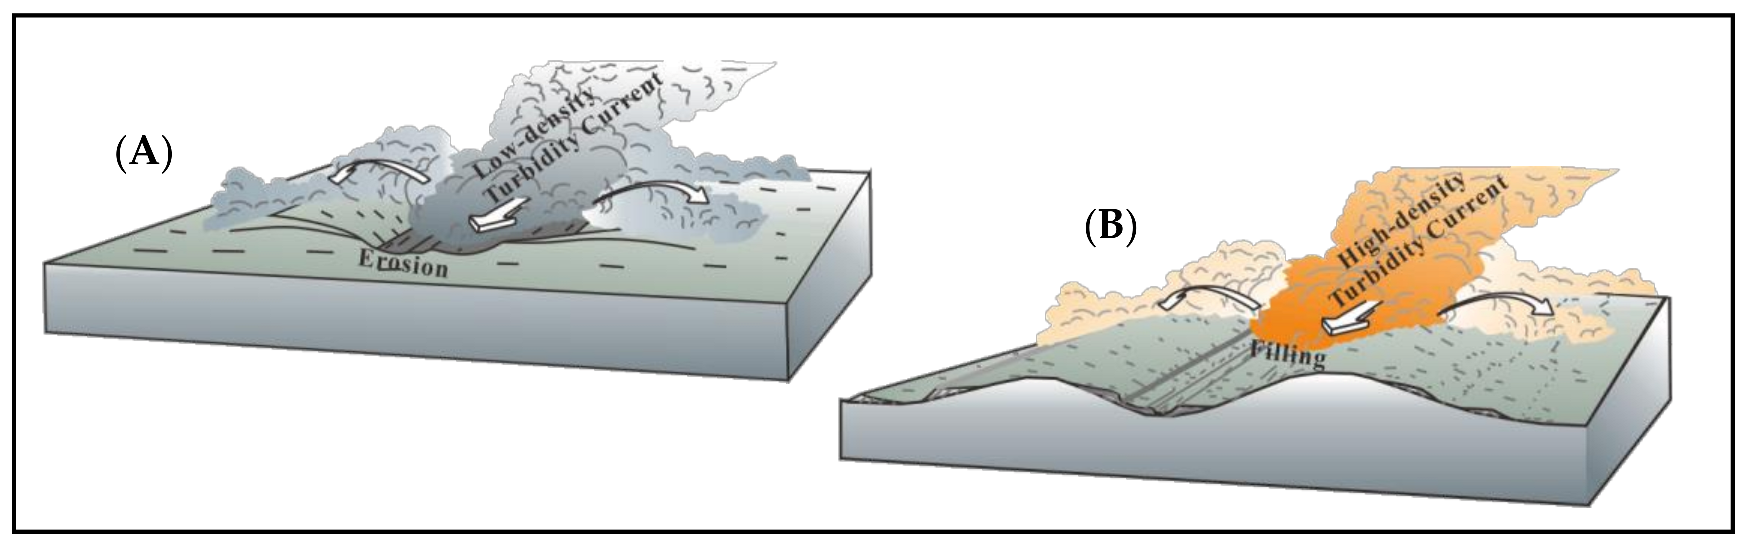
5.1.2. Non-Channelized Fan

Tongue-Shaped Fan

The seismic facies characteristics of the tongue-shaped fan are characterized by medium frequency, high amplitude, medium continuous, progradational reflection structure, and wedge-shaped outer envelope (Figure 9). This is different from those of overlying and underlying mudstone with low frequency and low amplitude reflection. The RMS attribute plane of the tongue-shaped fan shows a clear tongue shape (Figure 12C). Moreover, its GR curve is characterized by a toothed box shape, indicating that it was formed by the accumulation of multi-stages gravity flow events (Figure 6). The sediments derived from the braided river delta front since the previous sediments were liquefied and collapsed due to the exogenic process. Therefore, the massive sandstone of a tongue-shaped fan often contains a large number of floating mud gravels and cracked mud debris, with massive liquefied deformation structures. Afterward, the slumping sediments were liquefied to form the HDTC, which is rapidly transported downward along the slope to form tongue-shaped deposits with a large ratio of growth and width. The structure of the deposits is massive, lacking a traction structure with some floating mud pebbles and mud clasts inside (Figure 4). The subsequently formed LDTC with remaining fine-grained materials continued to move forward to form sheet sand deposits at the front and flanks of the tongue-shaped fan (Figure 12D).

Lobe-Shaped Fan

The seismic reflection characteristics of the lobe-shaped fan are characterized by medium frequency, high amplitude, high continuous, and sheet-shaped outer envelope (Figure 9). It can be obviously seen that the large lobe-shaped outer envelope shape is in the RMS attribute plane (Figure 12E). The log curve of the lobe-shaped fan is finger-shaped and funnel-shaped, indicating that it is formed by multi-stage lobes (Figure 6). The HDTC first forms a stable main supply channel filled by coarse-grained sediments. With the HDTC moving forward, the channel forked and the sediments accumulated along the sides to form small lobes. With the accumulation of sediments, the lobes gradually connected into pieces to form a composite large lobe-shaped fan. The distributary channel and lobes were mainly deposited in medium and fine sandstone. Like the tongue-shaped fan pattern, the LDTC continues to move forward and deposit (Figure 12F).

5.2. Controlling Factors of Sublacustrine Fans Morphology

Deposits formed in the same gravity flow (HDTC) could show different forms, which has an important impact on the distribution of sand and the prediction of traps. Based on the analysis of structural and sedimentary characteristics in the study area, it is considered that the slope and material source (sandy of braided river delta front) jointly control the shape of the sublacustrine fan.
The sedimentary form and channelization degree of the submarine fan were closely related to the sand content of the sediments’ provenance [3,4,5]. When gravity flow was rich in sand, the channelization degree was low and unstable. With the increase of mud content, the erosion ability of gravity flow to the basement was enhanced [50], and the degree of channelization became higher, accompanied by the embankment system formed. Under the steep slope background, the gravity flow deposition is a tongue-shaped fan with a large aspect ratio [51,52,53]. In the process of the numerical simulation of the delta, the smaller the slope, the easier it is for the lobes to migrate laterally to form contiguous fans [54].

5.2.1. Slope Gradient

During the TST, sand-rich sublacustrine fans developed in regions B and C. Due to the development of the fault system and obvious change of slope landform in region B, the slope is larger than that in other regions, with a slope of 2.3° (Figure 10B). During the downward transportation of sand-rich HDTC along the slope, it was prone to form tongue-shaped sediment with a large growth width ratio, due to its fast transportation speed, long transportation distance, and short time of sedimentation. When the slope is gentle, e.g., region C (0.8°, Figure 10C), the HDTC was transported and accumulated not only downward, but also laterally, which was probably to form lobe-shaped sediment with a small growth width ratio. Therefore, steep slopes and complex structures tended to form fast gravity flows, which would accumulate at the foot of the slope in a large ratio of length and width, without a stable channel (Figure 13). Afterward, the subsequent LDTC continues to move forward and deposit at the basin floor (Figure 12).

5.2.2. Sand Richness (Braided River Delta Front)

The structural background of the slope in region A (HST) is similar to that in region C (TST), the slope of which were both 0.8° (Figure 10C,E). In the HST, braided river delta front deposits were developed in the uplift near region A (Figure 12B), where argillaceous siltstone was deposited at the bottom, and medium fine sandstone was deposited at the upper part. Sublacustrine fan deposits were found in well A2 in the slope, which consists of argillaceous siltstone formed by turbidite channel filling deposits at the bottom, and medium to fine sandstone at the upper part (Figure 6, well A2). Hence, in the early stage, the mud-rich LDTC first transformed the slope bottom (Figure 14A), forming a stable long turbidite channel, and in the later stage, the sand-rich HDTC was transported and deposited along the ancient turbidity channel (Figure 14B). Sand-rich HDTC was developed in region C, where gravity flow had a strong destructive ability to the surrounding system. The channel was prone to bifurcation and diversion, which promoted the development of lobes and formed contiguous sand. Thus, the sublacustrine fan is in lobe shape. The difference in sand abundance of provenance led to the different morphology of the sublacustrine fan (Figure 13). The low sand content and strong erosion ability of gravity flow on the slope end tended to form a stable turbidite channel, while high sand content tended to form continuous lobes.

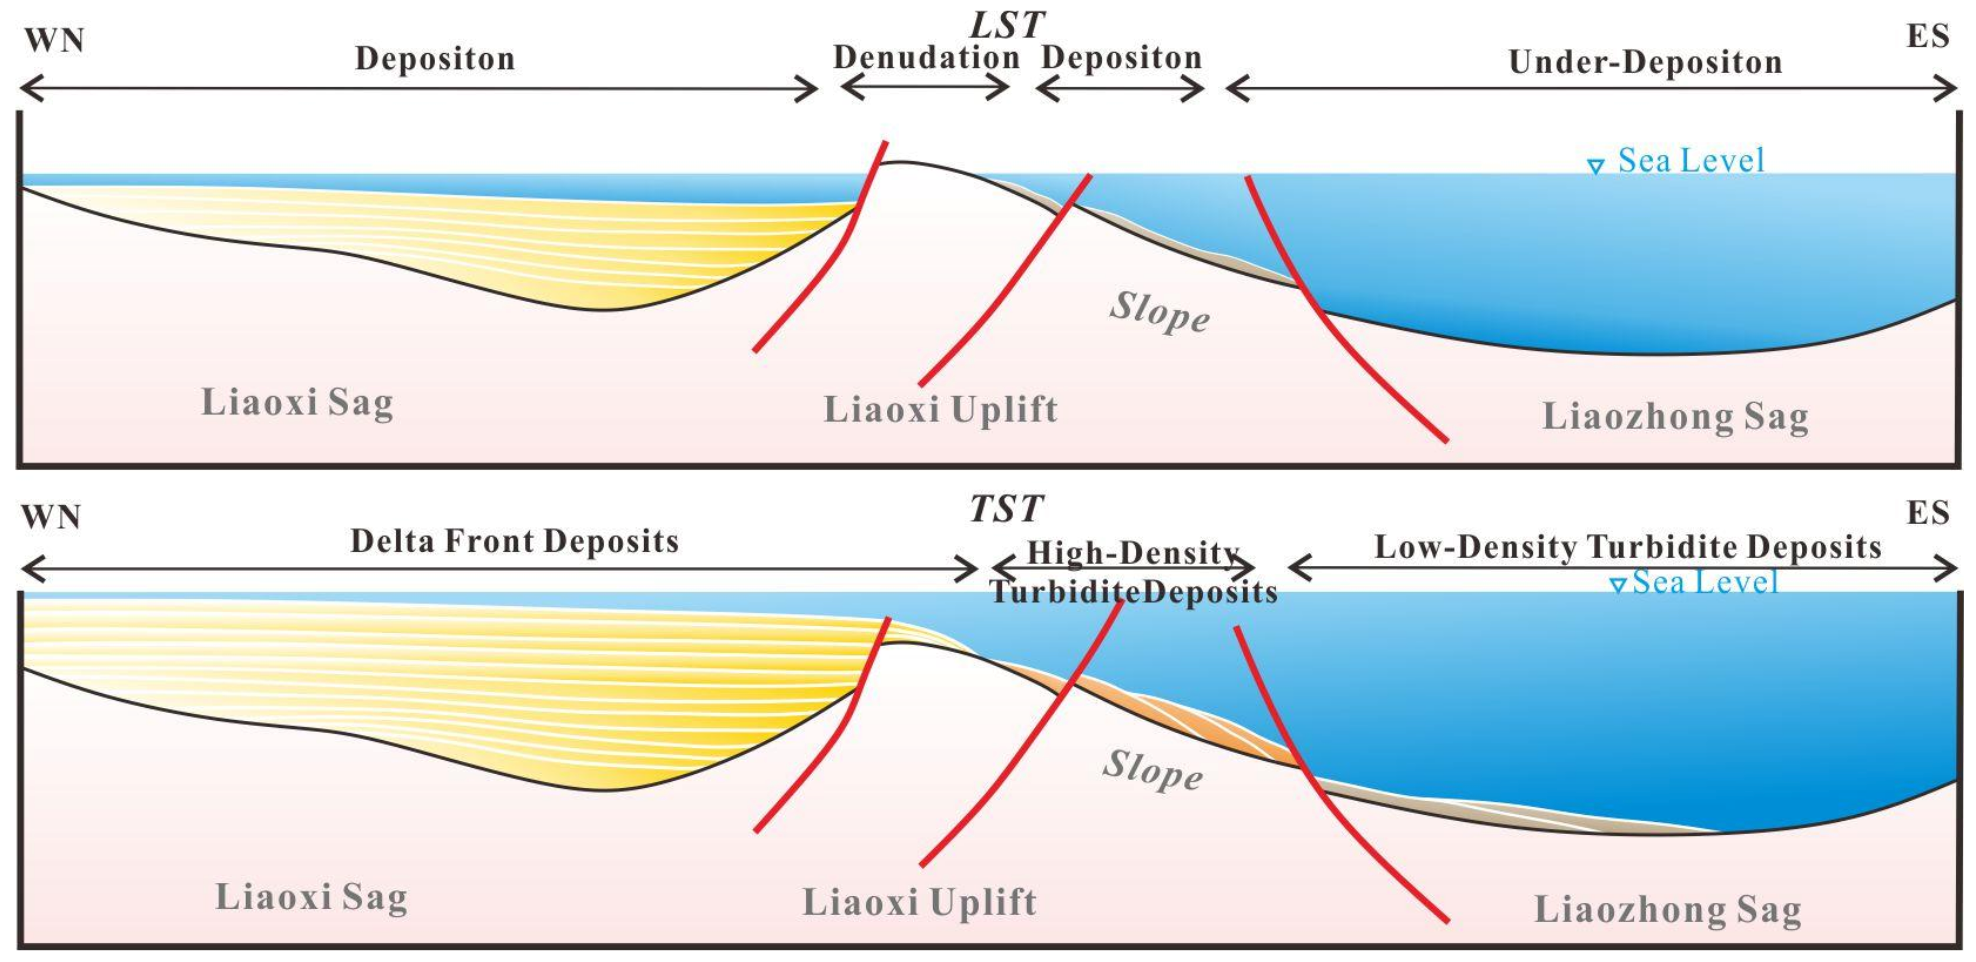
5.3. Controlling Factors for the Development of Sublacustrine Fans in TST

5.3.1. Provenance

Abundant material sources are the prerequisite for the development of sublacustrine fans [19]. The Yanshan fold belt in the west of Liaodong Bay was the main sediment source in the filling process of the basin during the SQd3. The Liaoxi Depression is located at the edge of the basin (Figure 1B), with a sufficient supply of terrigenous sediment. The depression is mainly filled with braided river delta deposits on the Liaoxi Uplift [56], without argillaceous deposits. In the TST, the Yanshan fold belt was still strongly weathered and denuded, so the ability to provide sediment for Liaodong Bay was still strong. Therefore, with the rise of the lake level, the deposition of the braided river delta did not retreat much to the edge of the basin, resulting in the deposition of the braided river delta front that could still reach Liaoxi uplift, which provided the material source for the development of sublacustrine fan in the east slope of Liaoxi uplift (Figure 15).

5.3.2. Relative Lake Level Change

The occurrence of gravity flow is closely related to the fluctuation of lake/sea level. The rise of relative sea/lake level increases the activity of faults [57,58], the rapid burial of sediments, and the increase of pore pressure [59], which are conducive to the occurrence of gravity flow. At the same time, the rise of relative sea/lake level increases the accommodation space of the slope at the edge of the basin [60,61,62], the uplift in the basin, and the slope. Compared with the sea level, the fluctuation period of lake level is more frequent with a larger scope [63,64,65,66,67]. The gravity flow is sensitive to the change in relative lake level. The western part of the Liaoxi uplift is bounded by large faults (Figure 1C), many of which are developed in the slope of region B, and the activity of faults was strong in the SQd3. Figure 16 shows the cross-section of three wells in region B, in which it can be found that the lacustrine fan deposits are mainly developed in the TST, while a few low-thickness lacustrine fan deposits developed in the LST.
During the LST, the Liaoxi sag was in the stage of rapid filling at the low lake level, when the Liaoxi uplift was exposed in the form of an island chain (Figure 15). However, the ability of Liaoxi uplift to provide a material source to the slope was limited, due to its limited scope. Therefore, it was difficult to form large-scale deposition on the slope relying on the poor ability of Liaoxi uplift to provide a material source, since the distal clasts were blocked by the uplift from entering the slope. During the TST, the Liaoxi uplift sunk into the water with the result that the deposition of the braided river delta front could overlap the uplift, providing adequate materials for the deposition of sublacustrine fans. The slope evolved into a semi-deep lake environment, which provided sufficient accommodation space for the deposition of sublacustrine fans (Figure 10A and Figure 15).
In the meantime, the lake level change experienced a slow-fast-slow rising process in the TST (Figure 7 and Figure 8). During the period of the lake level rising rapidly, the growth rate of accommodation space was much greater than the supply rate of material sources. The deposition of the braided river delta retreats to the edge of the basin, which inhibited the development of sublacustrine fans. In the stage of the lake level rising slowly, the sediment supply rate was greater than the growth rate of accommodation space. The deposition of the braided river delta overlapped the uplift and slope, which provides a material source for the development of sublacustrine fans. Thus, the TST deposits were composed of two aggradation subsequence sets, with two sections of sublacustrine fan sandstone and one section of lacustrine mudstone.

5.3.3. Paleomorphology

Paleomorphology plays a key role in controlling the transportation and distribution of sediments [18,68,69,70]. The existence of an undercut valley is often the principal channel for the sediment transport [71,72]. The break system of the slope also controls the configuration of accommodation space. The lacustrine fan deposits in the TST were mainly concentrated in region B. Through the restoration of paleomorphology, it was found that there are two incised canyons on the uplift. According to the observation of the drilling sequence and seismic profile, the Shahejie formation developed in the incised canyons (Figure 11). It indicates that the incised canyons existed before the SQd3. During the SQd3, the Liaodong Bay Depression once again went through slip-rifting, with the lake level rising rapidly. Meanwhile, the incised canyons provided a channel for the deposition of the braided river delta front to enter the Liaoxi uplift and slope. Furthermore, it provided the material source for the development of sublacustrine fans.
A group of north dipping faults and a group of south-dipping faults were developed in the slope (Figure 10A). The differential activities of these two groups of faults resulted in a variety of accommodation space configurations and slope break systems. Region B has multiple faults and a single fault slope break system. Between the two stages of faults is the main location of lacustrine fans sedimentation (Figure 12).

5.4. Reservoir Distribution and Implications

On the basis of analyzing the type of gravity flow and the structure of the sublacustrine fan, using the core, logging, and seismic data, it is very important to establish an appropriate sedimentary model for predicting the distribution of the sublacustrine fan. The shape of the sublacustrine fan controls the distribution of the sandstone reservoirs [18,53,73,74,75], which is closely related to the subsequent engineering drilling [76,77]. The classic turbidite fan model considers that the sublacustrine fan is the fan shape controlled by the main supply channel, and the sandstone is mainly distributed in the distributary channel and lobe [1]. Reading and Richard put forward twelve turbidite fan models based on provenance system and sediment grain size [3], which greatly enriched the content of the sublacustrine fan model. Shanmugam’s slope fan model further supplements the content of the sublacustrine fan model [78]. The sublacustrine fan caused by sandy clastic flow is mainly tongue-shaped. At the same time, the stratigraphic sequence model considers that the sublacustrine fan is mainly developed in the lowstand system tract [79]. However, there are many types of sublacustrine fans in the study area. Therefore, in our actual research work, we should not be limited to a single model but should combine the actual situation and synthesize various models to obtain a model suitable for the study area (Figure 13).
On the whole, the sublacustrine fan in the study area is mainly concentrated in the TST of SQd3 (Figure 15 and Figure 16). A tongue-shaped sublacustrine fan developed in region B (Figure 12C,D). The shape of the sandstone reservoir is tongue shape, which indicates that the sandstone reservoir changes rapidly laterally and extends far longitudinally. In region C, the lobe-shaped sublacustrine fan is developed (Figure 12E,F), and sandstone reservoirs are mainly developed in channels and lobed bodies, indicating that sandstone reservoirs are mainly developed in the upper and middle of the sublacustrine fan, while the lower fan reservoirs are poor. In region A, channelized sublacustrine fan is developed (Figure 12A,B), and the sandstone reservoir is in a strip shape. The development scale of the sandstone reservoir is the smallest, and the lateral change is too fast.

6. Conclusions

During the SQd3, two types of sublacustrine fan, including channelized fan and non-channelized fan, developed on the east slope of Liaoxi uplift, which inherited the characteristics of sediments structural maturity in braided river delta front (good sandstone sorting and high structural maturity). It can be divided into three forms of sublacustrine fans in the slope of Liaoxi uplift, including tongue shape, lobe shape, and channel shape.
The slope gradient and the source nature from the braided river delta front control the shape of the sublacustrine fan. A steep slope was favorable for forming tongue shape sublacustrine fans with large ratio of length and width, while a gentle slope tended to deposit lobe shape fans. High mud content tended to form stable channels with strong erosion on the slope end, while high sand content tended to form continuous lobes with lobe shape.
In the basin with uplift, the beneficial combination of provenance, relative lake level change, and paleomorphology determines the development and distribution of sublacustrine fan. The Yanshan fold belt in the west provided sufficient sediments to the Liaodong Bay during LST for the development of a sublacustrine fan in the east slope of Liaoxi uplift since the Liaoxi uplift sunk into the water, with the result that the deposition of braided river delta front can overlap the uplift. The incised canyons in the Liaoxi uplift provided the channels for sediments entering into the eastern slope, and the main sedimentary location of lacustrine fans was between two stages of faults.

Author Contributions

Software, X.D.; Formal analysis, E.L.; Resources, X.W.; Writing—original draft, H.W.; Writing—review & editing, S.J.; Funding acquisition, Y.Z. All authors have read and agreed to the published version of the manuscript.

Funding

The authors gratefully acknowledge the project support from the CNOOC (China) Co., Ltd. Tianjin Branch (CCL2020TJX0NST1284). This work was supported by the National Natural Science Foundation Research (No. 41902127) and Innovative Research Group Project of the National Natural Science Foundation of China (No. 41972117).

Data Availability Statement

Not applicable.

Conflicts of Interest

The authors declare no conflict of interest.

References

  1. Walker, R.G. Deep-Water sandstone facies and ancient submarine fans: Models for exploration for stratigraphic traps. Am. Assoc. Pet. Geol. 1978, 62, 932–966. [Google Scholar]
  2. Normark, W.R. Growth patterns of deep sea fans. Am. Assoc. Pet. Geol. Bull. 1978, 54, 2170–2195. [Google Scholar]
  3. Reading, H.G.; Richards, M. Turbidite Systems in Deep-Water Basin Margins Classified by Grain Size and Feeder System1. Aapg Bull. 1994, 78, 792–822. [Google Scholar]
  4. Richards, M.; Bowman, M. Submarine fans and related depositional systems II: Variability in reservoir architecture and wireline log character. Mar. Petrol. Geol. 1998, 15, 821–839. [Google Scholar] [CrossRef]
  5. Richards, M.; Bowman, M.; Reading, H. Submarine-fan systems I: Characterization and stratigraphic prediction. Mar. Petrol. Geol. 1998, 15, 689–717. [Google Scholar] [CrossRef]
  6. Shanmugam, G. High-denstiy turbidity currents: Are they sandy debris flows? J. Sediment. Res. 1996, 66, 2–10. [Google Scholar] [CrossRef]
  7. Shanmugam, G. Slope turbidite packets in a fore-arc basin fill sequence of the Plio-Pleistocene Kakegawa Group: Their formation and sea-level changes—Discussion. Sediment. Geol. 1997, 112, 297–300. [Google Scholar] [CrossRef]
  8. Shanmugam, G. The Bouma Sequence and the turbidite mind set. Earth Sci. Rev. 1997, 42, 201–229. [Google Scholar] [CrossRef]
  9. Feng, Y.; Li, S.; Lu, Y. Sequence stratigraphy and architectural variability in Late Eocene lacustrine strata of the Dongying Depression, Bohai Bay Basin, Eastern China. Sediment. Geol. 2013, 295, 1–26. [Google Scholar] [CrossRef]
  10. Jia, J.; Liu, Z.; Miao, C.; Fang, S.; Zhou, R.; Meng, Q.; Chen, Y.; Yan, L.; Yang, D. Depositional model and evolution for a deep-water sublacustrine fan system from the syn-rift Lower Cretaceous Nantun Formation of the Tanan Depression (Tamtsag Basin, Mongolia). Mar. Petrol. Geol. 2014, 57, 264–282. [Google Scholar] [CrossRef]
  11. Liu, X.; Chen, H.; Xiao, X.; Zhang, T. Mixing Characteristics of Oil Inclusions with Different Thermal Maturities in the Wenliu Uplift, Dongpu Depression, Bohai Bay Basin, North China. J. Earth Sci. China 2020, 6, 1251–1258. [Google Scholar] [CrossRef]
  12. Fongngern, R.; Olariu, C.; Steel, R.; Mohrig, D.; Krézsek, C.; Hess, T. Subsurface and outcrop characteristics of fluvial-dominated deep-lacustrine clinoforms. Sedimentology 2018, 65, 1447–1481. [Google Scholar] [CrossRef]
  13. Maejima, W.; Das, R.; Pandya, K.L.; Hayashi, M.; Maejima, W.; Chaudhuri, A.K. Deglacial control on sedimentation and basin evolution of Permo-Carboniferous Talchir Formation, Talchir Gondwana Basin, Orissa, India. Gondwana Res. 2004, 7, 339–352. [Google Scholar] [CrossRef]
  14. Yao, Y.; Guo, Q.; Wang, H. Source-to-Sink Comparative Study between Gas Reservoirs of the Ledong Submarine Channel and the Dongfang Submarine Fan in the Yinggehai Basin, South China Sea. Energies 2022, 15, 4298. [Google Scholar] [CrossRef]
  15. Xue, Y.A.; Zhao, M.; Liu, X. Reservoir Characteristics and Controlling Factors of the Metamorphic Buried Hill of Bozhong Sag, Bohai Bay Basin. J. Earth Sci. China 2021, 32, 919–926. [Google Scholar] [CrossRef]
  16. Guo, J.; Jiang, Z.; Xie, X.; Liang, C.; Wang, W.; Busbey, A.B.; Jia, C.; Meng, J. Deep-lacustrine sediment gravity flow channel-lobe complexes on a stepped slope: An example from the Chengbei Low Uplift, Bohai Bay Basin, East China. Mar. Petrol. Geol. 2021, 124, 104839. [Google Scholar] [CrossRef]
  17. Lin, C.; Kenneth, E.; Li, S.; Wan, Y.; Ren, J.; Zhang, Y. Sequence architecture, depositional systerm, and controls on development of lacustrine basin fills in part of the Erlian basin, northeast China. Aapg Bull. 2001, 85, 2017–2043. [Google Scholar]
  18. Liu, E.; Wang, H.; Li, Y.; Zhou, W.; Leonard, N.D.; Lin, Z.; Ma, Q. Sedimentary characteristics and tectonic setting of sublacustrine fans in a half-graben rift depression, Beibuwan Basin, South China Sea. Mar. Petrol. Geol. 2014, 52, 9–21. [Google Scholar] [CrossRef]
  19. Liu, E.; Wang, H.; Pan, S.; Qin, C.; Jiang, P.; Chen, S.; Yan, D.; Lü, X.; Jing, Z. Architecture and depositional processes of sublacustrine fan systems in structurally active settings: An example from Weixinan Depression, northern South China Sea. Mar. Petrol. Geol. 2021, 134, 105380. [Google Scholar] [CrossRef]
  20. Xia, S.; Liu, J.; Liu, Z.; Ye, D.; Chang, Y.; Gao, N.; Li, H.; Liang, X. The geophysical identification, characteristics, and petroliferous significance of sublacustrine fan deposits in the second member of Dongying Formation in Liaozhong Depression, Bohai Bay Basin. Geol. J. 2018, 53, 692–706. [Google Scholar] [CrossRef]
  21. Cao, Y.; Jin, J.; Liu, H.; Yang, T.; Liu, K.; Wang, Y.; Wang, J.; Liang, C. Deep-water gravity flow deposits in a lacustrine rift basin and their oil and gas geological significance in eastern China. Petrol. Explor Dev. 2021, 48, 286–298. [Google Scholar] [CrossRef]
  22. Liu, E.; Wang, H.; Feng, Y.; Pan, S.; Jing, Z.; Ma, Q.; Gan, H.; Zhao, J. Sedimentary architecture and provenance analysis of a sublacustrine fan system in a half-graben rift depression of the South China Sea. Sediment. Geol. 2020, 409, 105781. [Google Scholar] [CrossRef]
  23. Lei, Z.; Jiang, Z.; Zhang, J. Sedimentary characteristics, genetic types and control factors of deep-water sandstones in the western Linjin Sag, China. Mar. Petrol. Geol. 2019, 113, 104130. [Google Scholar] [CrossRef]
  24. Liu, J.; Xian, B.; Wang, J.; Ji, Y.; Lu, Z.; Liu, S. Sedimentary architecture of a sub-lacustrine debris fan: Eocene Dongying Depression, Bohai Bay Basin, east China. Sediment. Geol. 2017, 362, 66–82. [Google Scholar] [CrossRef]
  25. Praet, N.; Moernaut, J.; Van Daele, M.; Boes, E.; Haeussler, P.J.; Strupler, M.; Schmidt, S.; Loso, M.G.; Batist, M.D. Paleoseismic potential of sublacustrine landslide records in a high-seismicity setting (south-central Alaska). Mar. Geol. 2017, 384, 103–119. [Google Scholar] [CrossRef]
  26. Sun, M.; Wang, H.; Liao, J.; Gan, H.; Xiao, J.; Ren, J.; Zhao, S.E. Sedimentary characteristics and model of gravity flow depositional system for the first member of upper Miocene Huangliu Formation in Dongfang area, Yinggehai basin, northwestern South China Sea. J. Earth Sci. China 2014, 25, 506–518. [Google Scholar] [CrossRef]
  27. Van der Merwe, W.C.; Flint, S.S.; Hodgson, D.M. Sequence stratigraphy of an argillaceous, deepwater basin-plain succession: Vischkuil Formation (Permian), Karoo Basin, South Africa. Mar. Petrol. Geol. 2010, 27, 321–333. [Google Scholar] [CrossRef]
  28. Gao, W.; Zhang, Z.; Guo, J.; Tan, H.; Jiang, B.; Li, Y. Seismic response mechanism analysis and reservoir description for sublacustrine fan of Dongying Formation in Liaodong Bay. China Offshore Oil Gas 2017, 29, 48–55. [Google Scholar]
  29. Wang, Q.; Du, X.; Jia, D.; Xu, C. Numerical Simulation Study of Sublucstrine fan Sedimentation in Lower second member of Liaozhong Sag. Pet. Geol. Eng. 2015, 29, 15–18+153–154. [Google Scholar]
  30. Jia, D.; Zhou, X.; Li, J.; Lai, W.; Zhu, C. Depositional model and controlling factors of sedimentary gravity flows in the central-northern Liaozhong sag, China. J. Chengdu Univ. Technol. 2010, 37, 69–74. [Google Scholar]
  31. Wu, K.; Wu, J.; Zhang, Z.; Jin, X.; Liu, Y.; Yu, Q. Sedimentary model and seismic respones characteristic of the sublucatrine fan in Northern Liaozhong Depression. J. Northeast. Pet. Univ. 2012, 36, 6+33–37+50. [Google Scholar]
  32. Zhang, H.; Lv, D.; Guan, D.; Wang, Q.; Liu, J. Study on hydrocarbon accumulation difference of sub-lacustrine fan in Dongying Formation in Liaozhong Sag, Liaodong Bay. China Pet. Explor. 2021, 26, 95–106. [Google Scholar]
  33. Qi, J.; Chen, F. Structural Style of the Liaodongwan-Xialiaohe Rift Basin. Oil Gas Geol. 1992, 13, 272–282. [Google Scholar]
  34. Zhu, X.; Dong, Y.; Yang, J.; Zhang, Q.; Li, D.; Xu, C.; Yu, S. The Paleogene Sequence Stratigraphic Framework and Distribution of Sedimentary Systems in the Liaodong Bay Area. Earth Sci. 2008, 51, 1–10. [Google Scholar]
  35. Zhou, X.; Wang, Q.; Feng, C.; Ye, T.; Liu, X.; Hao, Y.; Zhou, L. Formation Conditions and Geological Significance of Large Archean Buried Hill Reservoirs in Bohai Sea. Earth Sci. J. China Univ. Geosci. 2022, 47, 1534–1548. [Google Scholar]
  36. Zhu, W.; Mi, L.; Gong, Z. Oil and Gas Accumulation and Exploration in the Bohai Sea; Science Press: Beijing, China, 2009; p. 77. [Google Scholar]
  37. Zhou, X.; Yu, Y.; Tang, L.; Lv, D.; Wang, Y. Cenozoic basin structure and division of tectonic units in the Bohai Sea. China Offshore Oil Gas 2010, 22, 285–289. [Google Scholar]
  38. Xia, Q.; Zhou, X.; Li, J. The Sequence Sedimentary Evolution and Reservoir Distribution of Paleogene of Bohai Sea; Petroleum Industry Press: Beijing, China, 2012; pp. 14–22. [Google Scholar]
  39. Jia, N.; Huang, L.; Liu, C.; Li, D.; Xu, C. Differential faulting in a narrow rift basin influenced by synchronous strike-slip motion: The Liaodong Bay sub-basin, offshore Bohai Bay Basin, China. Mar. Petrol. Geol. 2021, 124, 104853. [Google Scholar] [CrossRef]
  40. Huang, L.; Liu, C.; Wang, Y.; Xue, Y.; Zhao, J. Hydrocarbon accumulation in strike-slip fault restraining bends: New insights into the tectonic controls on the Penglai 19-3 and Penglai 25-6 oil fields, Tan-Lu fault zone, east China. Aapg Bull. 2016, 100, 1239–1263. [Google Scholar] [CrossRef]
  41. Catuneanu, O. Principles of Sequence Stratigraphy; Elsevier: Amsterdam, The Netherlands, 2006; p. 375. [Google Scholar]
  42. Catuneanu, O. Model-independent sequence stratigraphy. Earth Sci. Res. 2019, 188, 312–388. [Google Scholar] [CrossRef]
  43. Lowe, D.R. Sediment Gravity Flows II: Depositional models with special reference to the deposits of high-density turbidity currents. J. Sediment. Petrol. 1982, 52, 279–297. [Google Scholar]
  44. Fisher, A.G. The lofer cyclothems of the alpine Triassic. Kans. Geol. Surv. Bull. 1964, 169, 107–149. [Google Scholar]
  45. Read, J.F.; Goldhammer, R.K. Use of Fischer plots to define third-order sea-level curves in Ordovician peritidal cyclic carbonates, appalachians. Geology 1988, 16, 895–899. [Google Scholar] [CrossRef]
  46. Sadler, P.M.; Osleger, D.A.; Montanez, I.P. On the labeling, length, and objective basis of Fischer plots. J. Sediment. Petrol. 1993, 63, 360–368. [Google Scholar]
  47. Crerar, E.E.; Arnott, R.W.C. Facies distribution and stratigraphic architecture of the Lower Cretaceous McMurray Formation, Lewis Property, northeastern Alberta. B Can. Petrol. Geol. 2007, 55, 99–124. [Google Scholar] [CrossRef]
  48. Liu, J.; Steel, R.J.; Lin, C.; Yang, H.; Yang, Y.; Peng, L.; Gong, Y.; Chu, C. Geomorphology control on the development of reservoir depositional systems, Devonian Donghetang Formation in the Tabei Uplift of the Tarim Basin, China. Mar. Petrol. Geol. 2012, 38, 177–194. [Google Scholar] [CrossRef]
  49. Posamentier, H.W.; Allen, G.P. Variability of the sequence stratigraphic model: Effects of local basin factors. Sediment. Geol. 1993, 86, 91–109. [Google Scholar] [CrossRef]
  50. Shanmugam, G. New perspectives on deep-water sandstones: Implications. Pet. Explor. Dev. 2013, 40, 294–301. [Google Scholar] [CrossRef]
  51. Migeon, S.; Ducassou, E.; Le Gonidec, Y.; Rouillard, P.; Mascle, J.; Revel-Rolland, M. Lobe construction and sand/mud segregation by turbidity currents and debris flows on the western Nile deep-sea fan (Eastern Mediterranean). Sediment. Geol. 2010, 229, 124–143. [Google Scholar] [CrossRef]
  52. Shanmugam, G. New Perspective on Deep-Water Sandstones: Origin, Recognition, Initiation, and Reservoir Quality. In Handbook of Petroleum Exploration and Production; Elsevier: Amsterdam, The Netherlands, 2006; Volume 9, p. 524. [Google Scholar]
  53. Zou, C.; Wang, L.; Li, Y.; Tao, S.; Hou, L. Deep-lacustrine transformation of sandy debrites into turbidites, Upper Triassic, Central China. Sediment. Geol. 2012, 265–266, 143–155. [Google Scholar] [CrossRef]
  54. Song, Y.; Yin, T.; Zhang, C.; Liu, Z. Numerical simulation of a branch-channel delta. Pet. Geol. Oilfield Dev. Daqing 2021, 40, 42–50. [Google Scholar]
  55. Shanmugam, G.; Spalding, T.D.; Rofheart, D.H. Process Sedimentology and Reservior Quality of Deep-Marine Bottom-Current Reworked Sands (Sandy Contourites): An example from the Gulf of Mexico. AMerican Assoc. Pet. Geol. Bull. 1993, 77, 1241–1259. [Google Scholar]
  56. Xu, C.; Xu, X.; Qiu, D.; Lai, W.; Zhou, X. Structural and sequence stratigraphic frameworks and palaeogeography of the Paleogene in central-southern Liaoxi Sag, Liaodongwan Bay area. J. Palaeogeogr. 2005, 7, 449–459. [Google Scholar]
  57. Brothers, D.S.; Luttrell, K.M.; Chaytor, J.D. Sea-level-induced seismicity and submarine landslide occurrence. Geology 2013, 41, 979–982. [Google Scholar] [CrossRef]
  58. Neves, M.C.; Roque, C.; Luttrell, K.M.; Vázquez, J.T.; Alonso, B. Impact of sea-level rise on earthquake and landslide triggering offshore the Alentejo margin (SW Iberia). Geo Mar. Lett 2016, 36, 415–424. [Google Scholar] [CrossRef]
  59. Trincardi, F.; Cattaneo, A.; Correggiari, A.; Mongardi, S. Submarine Slides during Relative Sea Level Rise: Two Examples from the Eastern Tyrrhenian Margin; Springer: Dordrecht, The Netherlands, 2003; pp. 469–478. [Google Scholar]
  60. Jiang, Z.; Liu, H. Lacustrine palaeoshoreline and its controls on sandbodies and hydrocarbon. J. Palaeogeogr. 2010, 12, 589–598. [Google Scholar]
  61. Wang, C.; Zhang, Y.; Lin, S.; Zheng, R.; Wei, Y.; Wang, H.; Hou, C.; Gou, X. Discovery of double slope breaks and its significance in Chang 81 sand group in Zhenyuan Area, Ordos Basin. Oil Gas Geol. 2017, 38, 457–466. [Google Scholar]
  62. Zhang, H.; Wang, H.; Liu, X.; Zhao, H. Determination of lacustrine palaeoshore line and its controls on the high quality reservoir: A case from the 8th member of Shihezi Formation in North Ordos Basin. Acta Sedimentol. Sin. 2015, 33, 348–356. [Google Scholar]
  63. Jiang, Z.; Liu, H.; Zhang, S.; Su, X.; Jiang, Z. Sedimentary characteristics of large-scale lacustrine beach-bars and their formation in the Eocene Boxing Sag of Bohai Bay Basin, East China. Sedimentology 2011, 58, 1087–1112. [Google Scholar] [CrossRef]
  64. Scholz, C.A.; Rosendahl, B.R. Low lake stands in lakes Malawi and tanganyika, East Africa, delineated with multifold seismic data. Science 1988, 240, 1645–1653. [Google Scholar] [CrossRef]
  65. Thompson, T.A.; Baedke, S.J.; Tanner, W.F. Beach-ridge development in Lake Michigan; shoreline behavior in response to quasi-periodic lake-level events. Mar. Geol. 1995, 129, 163–174. [Google Scholar] [CrossRef]
  66. White, J.D. Pliocene subaqueous fans and Gilbert-type deltas in maar crater lakes, Hopi Buttes, Navajo Nation (Arizona), USA. Sedimentology 1992, 39, 931–946. [Google Scholar] [CrossRef]
  67. Wu, W.; Lin, C.; Zhou, X.; Li, Q.; Xing, Z.; Yan, Y. Paleoclimate evolution and its influence on lake level changes of Paleogene dongying epoch in liaodong Bay, east China. J. China Univ. Pet. Ed. Nat. Sci. 2012, 36, 33–39+46. [Google Scholar]
  68. Feng, D.; Deng, H.; Zhou, Z.; Gao, X.; Cui, L. Paleotopographic controls on facies development in various types of braid-delta depositional systems in lacustrine basins in China. Geosci Front. 2015, 6, 579–591. [Google Scholar] [CrossRef] [Green Version]
  69. Lemons, D.R.; Chan, M.A. Facies Architecture and Sequence Stratigraphy of Fine-Grained Lacustrine Deltas Along the Eastern Margin of Late Pleistocene Lake Bonneville, Northern Utah and Southern Idaho. AAPG Bullein 1999, 83, 635–665. [Google Scholar]
  70. Yoon, S.H.; Chough, S.K.; Park, S.J. Sequence model and its application to a Miocene shelf–slope system in the tectonically active Ulleung Basin margin, East Sea (Sea of Japan). Mar. Petrol. Geol. 2003, 20, 1089–1103. [Google Scholar] [CrossRef]
  71. Prather, B.E. Controls on reservoir distribution, architecture and stratigraphic trapping in slope settings. Mar. Petrol. Geol. 2003, 20, 529–545. [Google Scholar] [CrossRef]
  72. Qian, W.; Yin, T.; Zhang, C.; Tang, H.; Hou, G. Diagenetic evolution of the Oligocene Huagang Formation in Xihu sag, the East China Sea Shelf Basin. Sci. Rep. 2020, 10, 19402. [Google Scholar] [CrossRef] [PubMed]
  73. Jia, B.; Chen, Z.; Xian, C. Investigations of CO2 storage capacity and flow behavior in shale formation. J. Petrol. Sci. Eng. 2022, 208, 109659. [Google Scholar] [CrossRef]
  74. Yiming, L.; Jiaren, Y.; Fei, Z.; Xuechun, L.; Aiping, Q.; Weilong, L.; Jun, Z. Fluid Identification and Evaluation of Tight Sandstone Reservoir in Es2 of Qibei Slope Belt in Qikou Sag. Earth Sci. J. China Univ. Geosci. 2022, 47, 1762–1776. [Google Scholar]
  75. Cui, J.; Yuan, X.; Wu, S.; Zhang, R.; Jin, S.; Li, Y. Rock Types and Reservoir Characteristics of Shahejie Formation Marl in Shulu Sag, Jizhong Depression, Bohai Bay Basin. J. Earth Sci. China 2021, 32, 986–997. [Google Scholar] [CrossRef]
  76. Peng, G.; Pang, X.; Xu, Z.; Luo, J.; Yu, S.; Li, H.; Hu, T.; Wang, C.; Liu, Y. Characteristics of Paleogene Whole Petroleum System and Orderly Distribution of Oil and Gas Reservoirs in South Lufeng Depression, Pearl River Mouth Basin. Earth Sci. J. China Univ. Geosci. 2022, 47, 2494–2508. [Google Scholar]
  77. Chengmin, N.; Haifeng, Y.; Dijiang, Z.; Can, Z.; Jingsong, P. Study on the Ultra-Late Hydrocarbon Accumulation and Migration Lagging Effect in Laizhouwan Sag, Bohai Sea. Earth Sci. J. China Univ. Geosci. 2022, 47, 464–478. [Google Scholar]
  78. Shanmugam, G. Submarine fans: A critical retrospective (1950–2015). J. Palaeogeogr. 2016, 5, 110–184. [Google Scholar] [CrossRef] [Green Version]
  79. Vail, P.R.; Mitchum, R.M.; Todd, R.G. Seismic Stratigraphy and Global Changes of Seal-evel. In Seismic Stratigraphy-Applications to Hydrocarbon Exploration; AAPG Memoir, Payton, C.E., Eds.; American Association of Petroleum Geologists: Tulsa, OK, USA, 1977; Volume 26, pp. 49–212. [Google Scholar]
Figure 4. Photographs of gravity flow sedimentary core in well B2 (See Figure 1C for well location). (A) Whole cores with 10 periods of gravity flow deposition (3224.50 m–3232.50 m). (B) S3 of HDTC and Bouma sequence Tb-e of LDTC (3226.52 m–3226.72 m). (C) Dish structure (3225.2 m–3225.5 m). (D) Mud clasts (3230.79 m–3131.06 m). (E) Mud pebbles and flame structures (3229.82 m–3230.54 m).
Energies 16 00851 g004
Figure 5. Characteristics of granular structure in well B1 (See Figure 1C for well location). (A) Core slice (3131 m) (B) C-M chart (Sample points in TST). (C) Probability Cumulative Curve (3330 m).
Energies 16 00851 g005
Figure 6. Logging curve characteristics of high- and low-density turbidite deposits. See Figure 1C for the locations of these wells.
Energies 16 00851 g006
Figure 7. High frequency sequence division scheme and relative lake level change curve.
Energies 16 00851 g007
Figure 8. Fisher chart. (A) Well A1. (B) Well A3.
Energies 16 00851 g008
Figure 9. Seismic facies characteristics of different sublacustrine fans.
Energies 16 00851 g009aEnergies 16 00851 g009b
Figure 10. Paleomorphology of the Liaoxi uplift and slope. (A) Paleomorphology of Liaoxi uplift and slope in TST. (B) Slope gradient in region B is 2.3°. (C) The slope gradient in region C is 0.8°. (D) Paleomorphology of Liaoxi uplift and slope in HST. (E) The slope gradient in region A is 0.8°.
Energies 16 00851 g010
Figure 11. Seismic section along Liaoxi uplift. There are two canyons on the uplift, and the Shahejie strata developed in the canyons. Annotation: A and B are the numbers of canyons; b-b’ is the number of seismic section. Figure 1C shows locations.
Energies 16 00851 g011
Figure 12. Plane distribution of RMS amplitude and sedimentary facies (Figure 1C shows locations). (A) Plane distribution of RMS in the region A (HST). (B) Plane distribution of sedimentary facies in the region A (HST). (C) Plane distribution of RMS in the region B (TST). (D) Plane distribution of sedimentary facies in the region B (TST). (E) Plane distribution of RMS in the region C (TST). (F) Plane distribution of sedimentary facies in the region C (TST).
Energies 16 00851 g012
Figure 13. Patterns of sublacustrine fan morphology.
Energies 16 00851 g013
Figure 14. Transformation of basin floor by turbidity currents (modified after Shanmugam et al., 1993 [55]). (A) Low-density turbidity currents eroded the basin floor. (B) Turbidite channel filled with deposits of high-density turbidity currents.
Energies 16 00851 g014
Figure 15. Patterns of sag filling by the distal source. In the LST, the Liaoxi uplift was exposed to the water surface, preventing the distal source from entering the uplift. In the TST, the uplift was located underwater, and the distal source entered the uplift, providing provenance for the sublacustrine fans.
Energies 16 00851 g015
Figure 16. Well connection diagram of region B. Sublacustrine fans are mainly developed in TST. Figure 1C shows locations.
Energies 16 00851 g016
Table 1. SQD3 high-frequency cycles thickness cumulative offset of well A1 and A3.
A1 A3
NumberBD/mTCO/mNumberBD/mTCO/mNumberBD/mTCO/mNumberBD/mTCO/mNumberBD/mTCO/m
13653.40.2349402972.2856.996814078.7614.2683403614.1254.251793154.76106.5538
23637.085.7498412957.1653.391724054.0421.0966413607.451.3193803149.88102.9021
33615.4813.6648422944.6851.226734036.623.6048423600.0462.6276813143.24104.2903
43591.4816.5397432930.7650.501644023.831.9531433578.4466.2559823131.498.8786
53572.5210.0546442915.451.936554005.1644.0614443564.3679.0041833126.5292.5869
63563.1617.9695452897.8847.131463982.7640.249745354176.3924843122.5285.8952
73539.419.6444462886.8446.886373976.0443.717946353373.1407853118.7679.5234
83521.8825.399447287146.401383961.9637.7462473525.9673.249863114.8473.3117
93500.0424.6743482855.448.556293957.436.5745483515.5674.3172873110.674.62
103484.9232.8292492837.1644.7111103947.8840.2828493504.0475.7855883098.9270.2483
113460.9231.3841502824.9238.946113933.7238.071503492.2875.813889309371.9566
123446.2832.099512814.632.221123925.434.0993513481.9676.7221903080.9270.4648
133429.7233.534522805.2429.0959133918.9241.8876523470.5277.5503913072.0472.1731
143412.4435.2089532792.5227.4108143900.5262.6359533459.484.6986923059.8868.9214
153394.6837.3638542778.1223.3257153869.1661.4641543441.889.6069933052.6866.3097
163376.6840.7187552766.3613.4806163859.858.9324553426.5296.1952943044.8465.9379
173357.2441.4337562760.126.5156173851.8866.8807563409.5693.5834953034.7665.4062
183340.6847.18865727510.0305183833.6477.389573401.88100.571796302563.4345
193319.0843.1035582741.640.2654193812.6873.9772583384.5299.32973016.6861.0628
203307.3252.9384592725.08−1.8997203805.6474.7255593375.4894.7883983008.6860.051
213281.6451.1333602711.160.2552213794.4487.3138603369.72108.2566992999.3258.0793
223267.258.4883612692.68−1.4298223771.5686.6221613345.8128.84481002990.6856.1876
233243.870.6432622678.28−2.3949233761.883.5303623314.84126.47311012982.1253.3359
243215.4872.6781632663.160243754.682.8386633306.92133.30141022974.650.2441
253197.469.553 25374583.2669643289.72137.08971032967.444.6724
263184.6865.4679 263734.1282.2552653275.48134.23791042962.6841.1807
273172.9267.6229 273724.7676.9234663267.96136.18621052955.7239.209
283154.7663.5378 283719.7270.6317673255.72134.53451062947.433.7972
293142.266.2927 293715.5670.26683247.08148.08281072942.5231.1055
303123.4866.7676 303705.6467.6483693222.92145.4711082934.8426.9738
313107.1667.0025 313697.9667.9166703215140.77931092928.6824.9221
32309168.3575 323687.464.9048713209.4136.88761102920.4424.2303
333073.5665.9524 333680.0460.2131723202.68135.63591112910.8418.0186
343059.8869.9873BD:Bottom depth
TCO:Thickness cumulative
offset
343674.4458.0014733193.56131.42411122906.7614.9269
353039.9665.9022353666.3655.9497743187.4126.33241132899.5610.8752
363028.263.4971363657.9657.6579753182.2122.12071142893.086.6634
373014.7659.8921373645.854.5662763176.04122.70911528875.1717
383002.5258.687383638.661.2345773164.92115.45721162878.120
392987.6457.9619393621.4857.8228783161.8112.0455
Table 2. Characteristics of three forms of sublacustrine fans.
Channelized FanTongue-Shaped FanLobe-Shaped Fan
System DomainHSTTSTTST
RegionABC
Slope Break Systemsingle faultmultiple faultssedimentary slope break
Characteristics of logBox-shapedBox-shapedfunnel-shaped
Characteristics of seismicChannel-shapedWedge-shapedSheet-shaped
Controlling factorsSteep slope, sand richGentle slope, sand richGentle slope, mud rich
Disclaimer/Publisher’s Note: The statements, opinions and data contained in all publications are solely those of the individual author(s) and contributor(s) and not of MDPI and/or the editor(s). MDPI and/or the editor(s) disclaim responsibility for any injury to people or property resulting from any ideas, methods, instructions or products referred to in the content.

