
Critical Review on Interrelationship of Electro-Devices in PV Solar Systems with Their Evolution and Future Prospects for MPPT Applications


Abstract
:1. Introduction
2. Conspectus of PV Systems
3. PV Panel
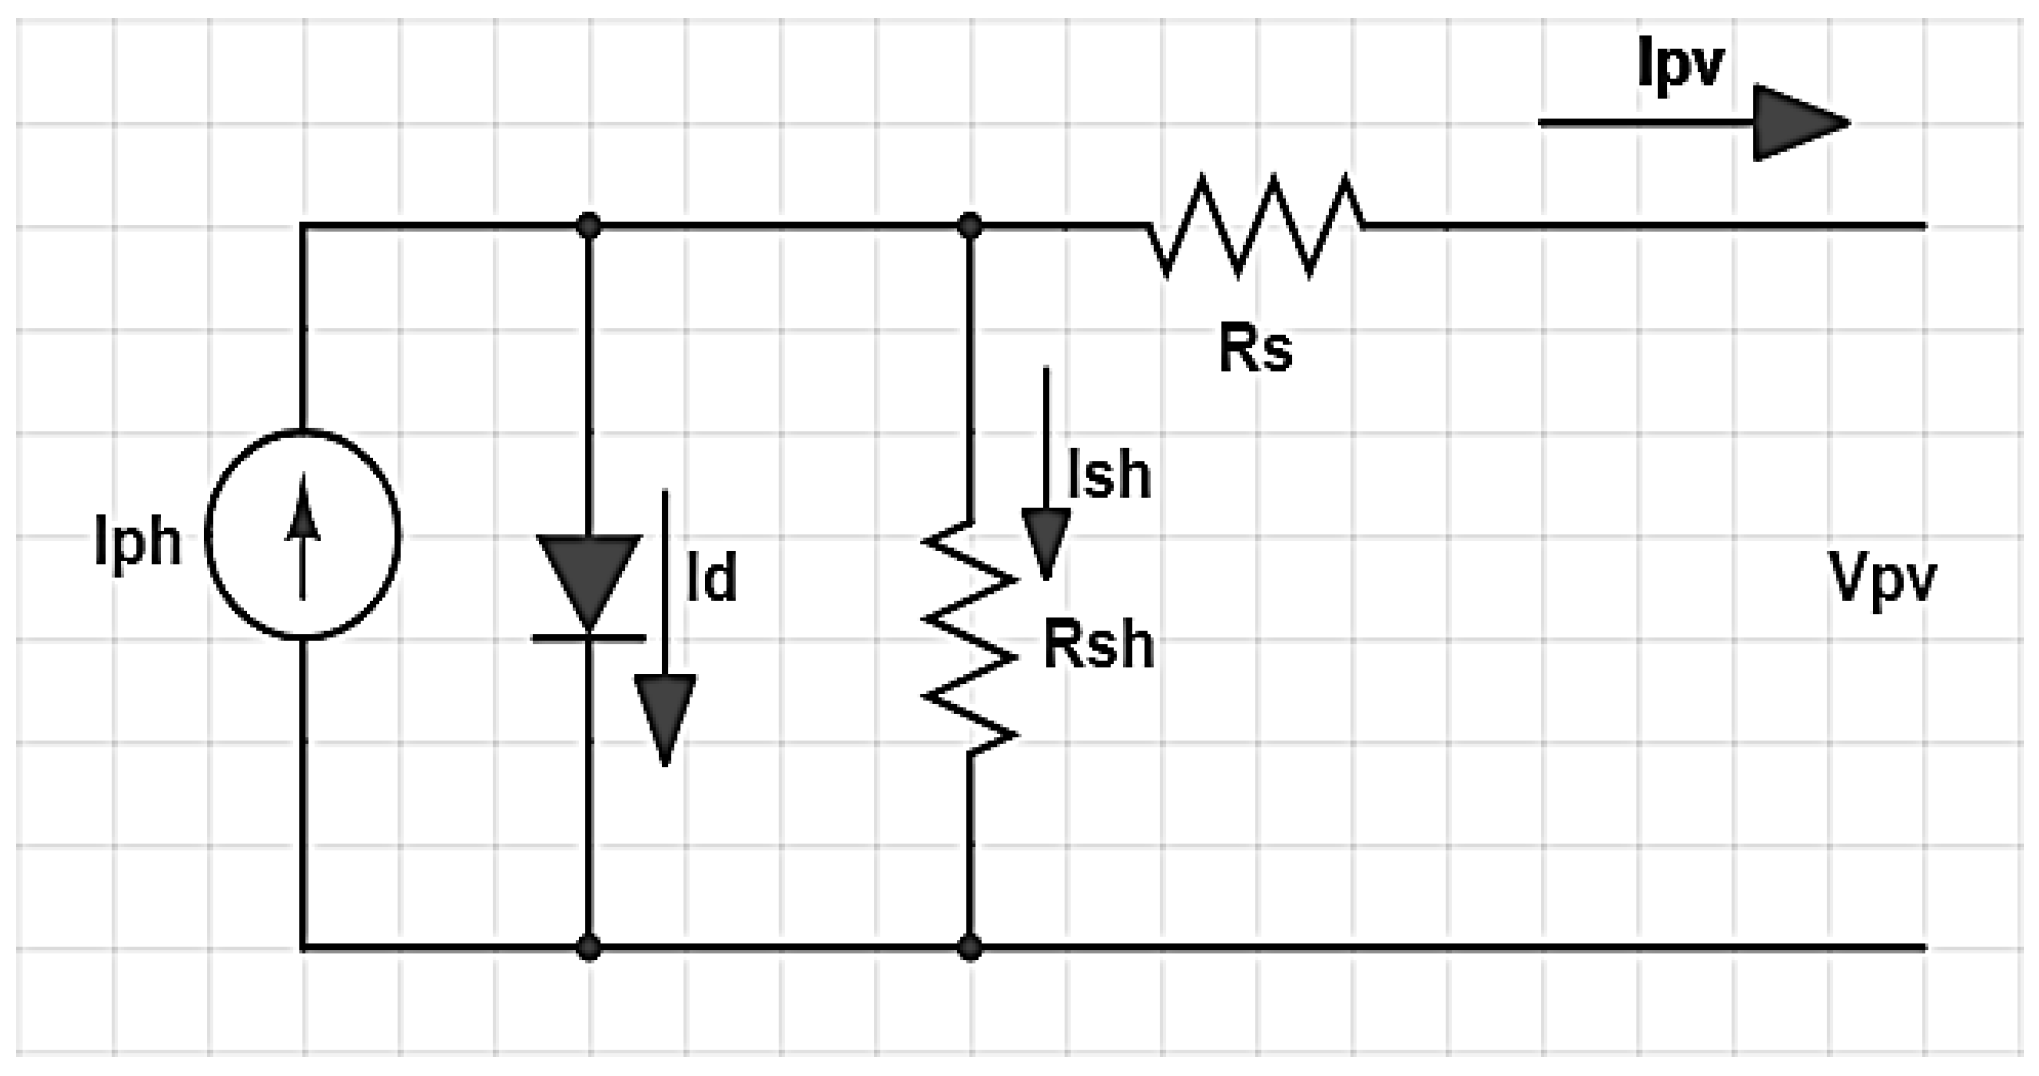
3.1. PV Cell
3.1.1. Mathematical Modeling
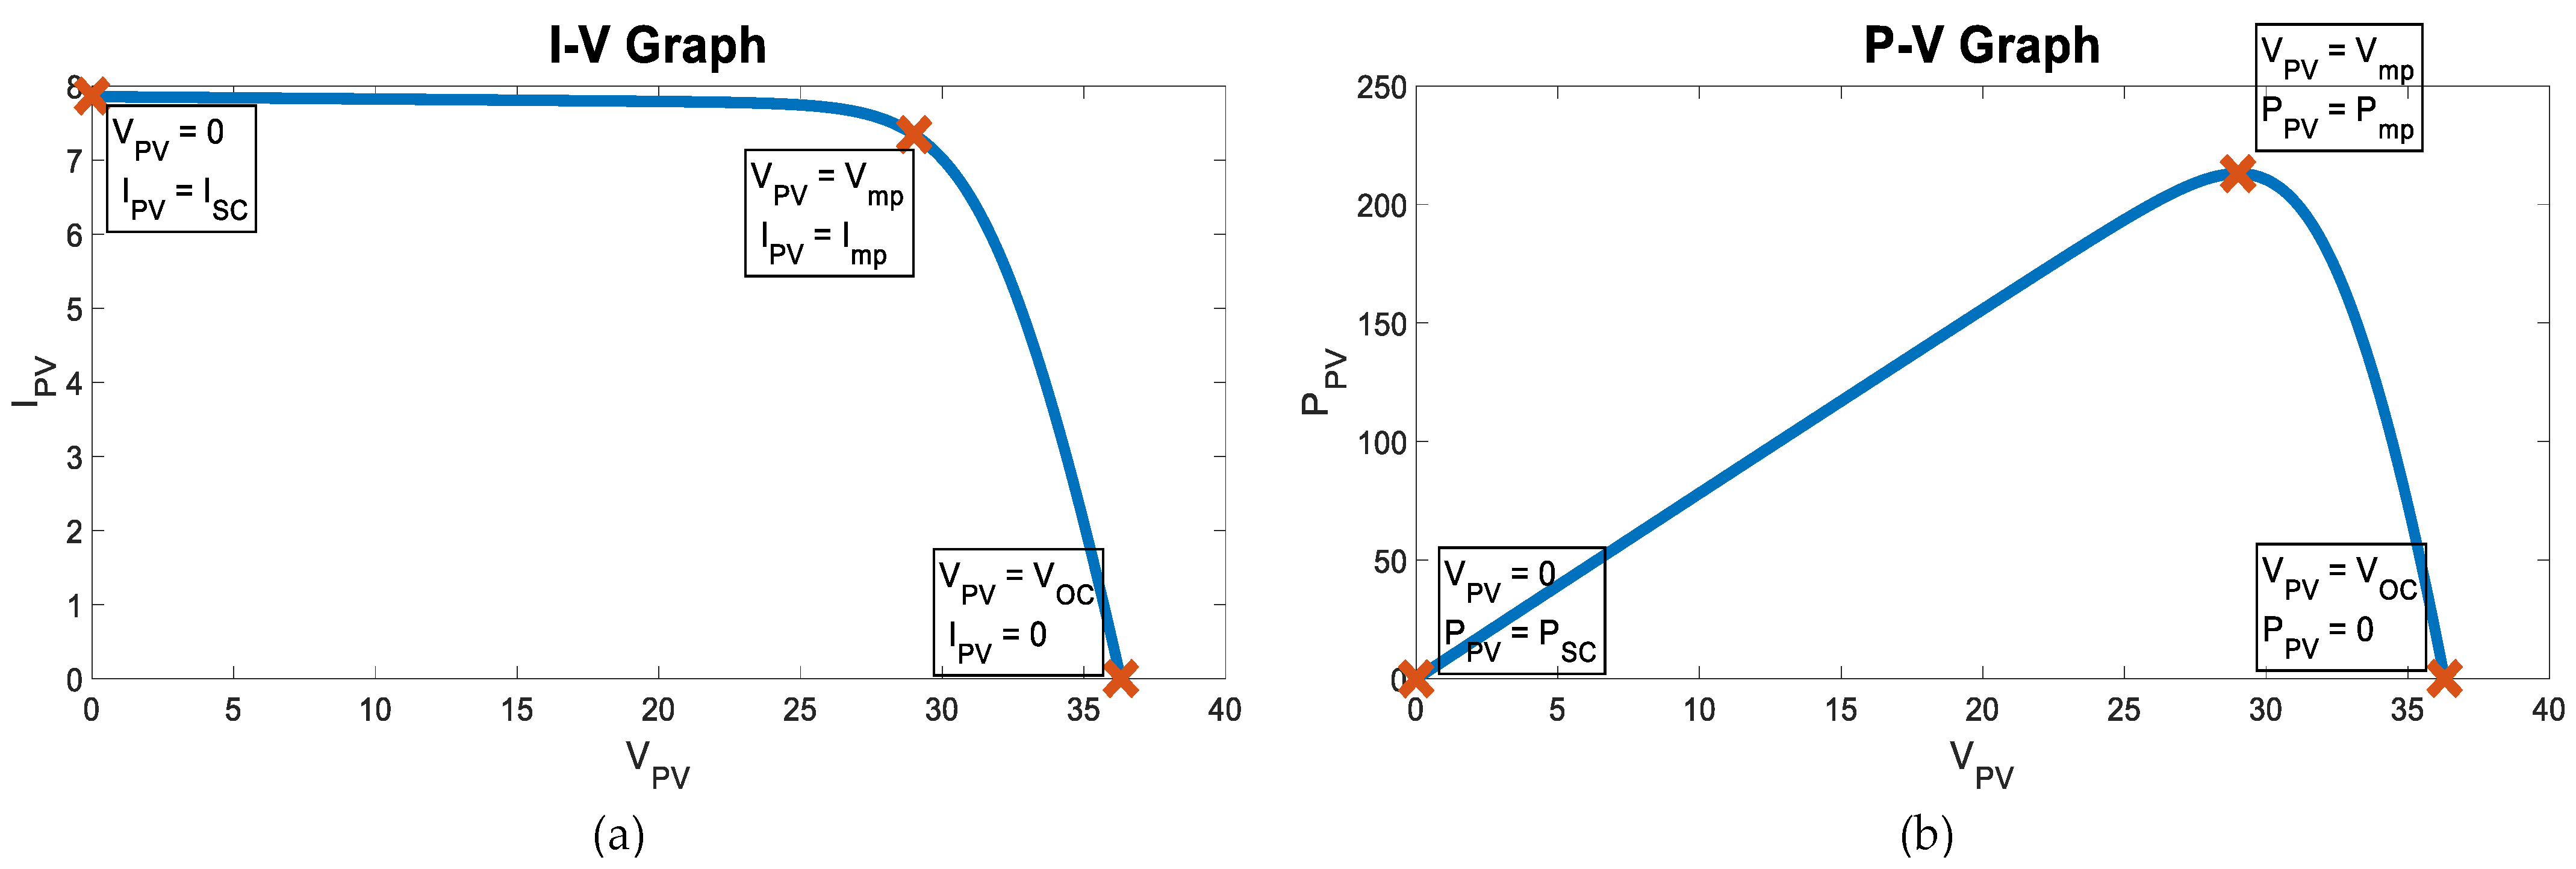
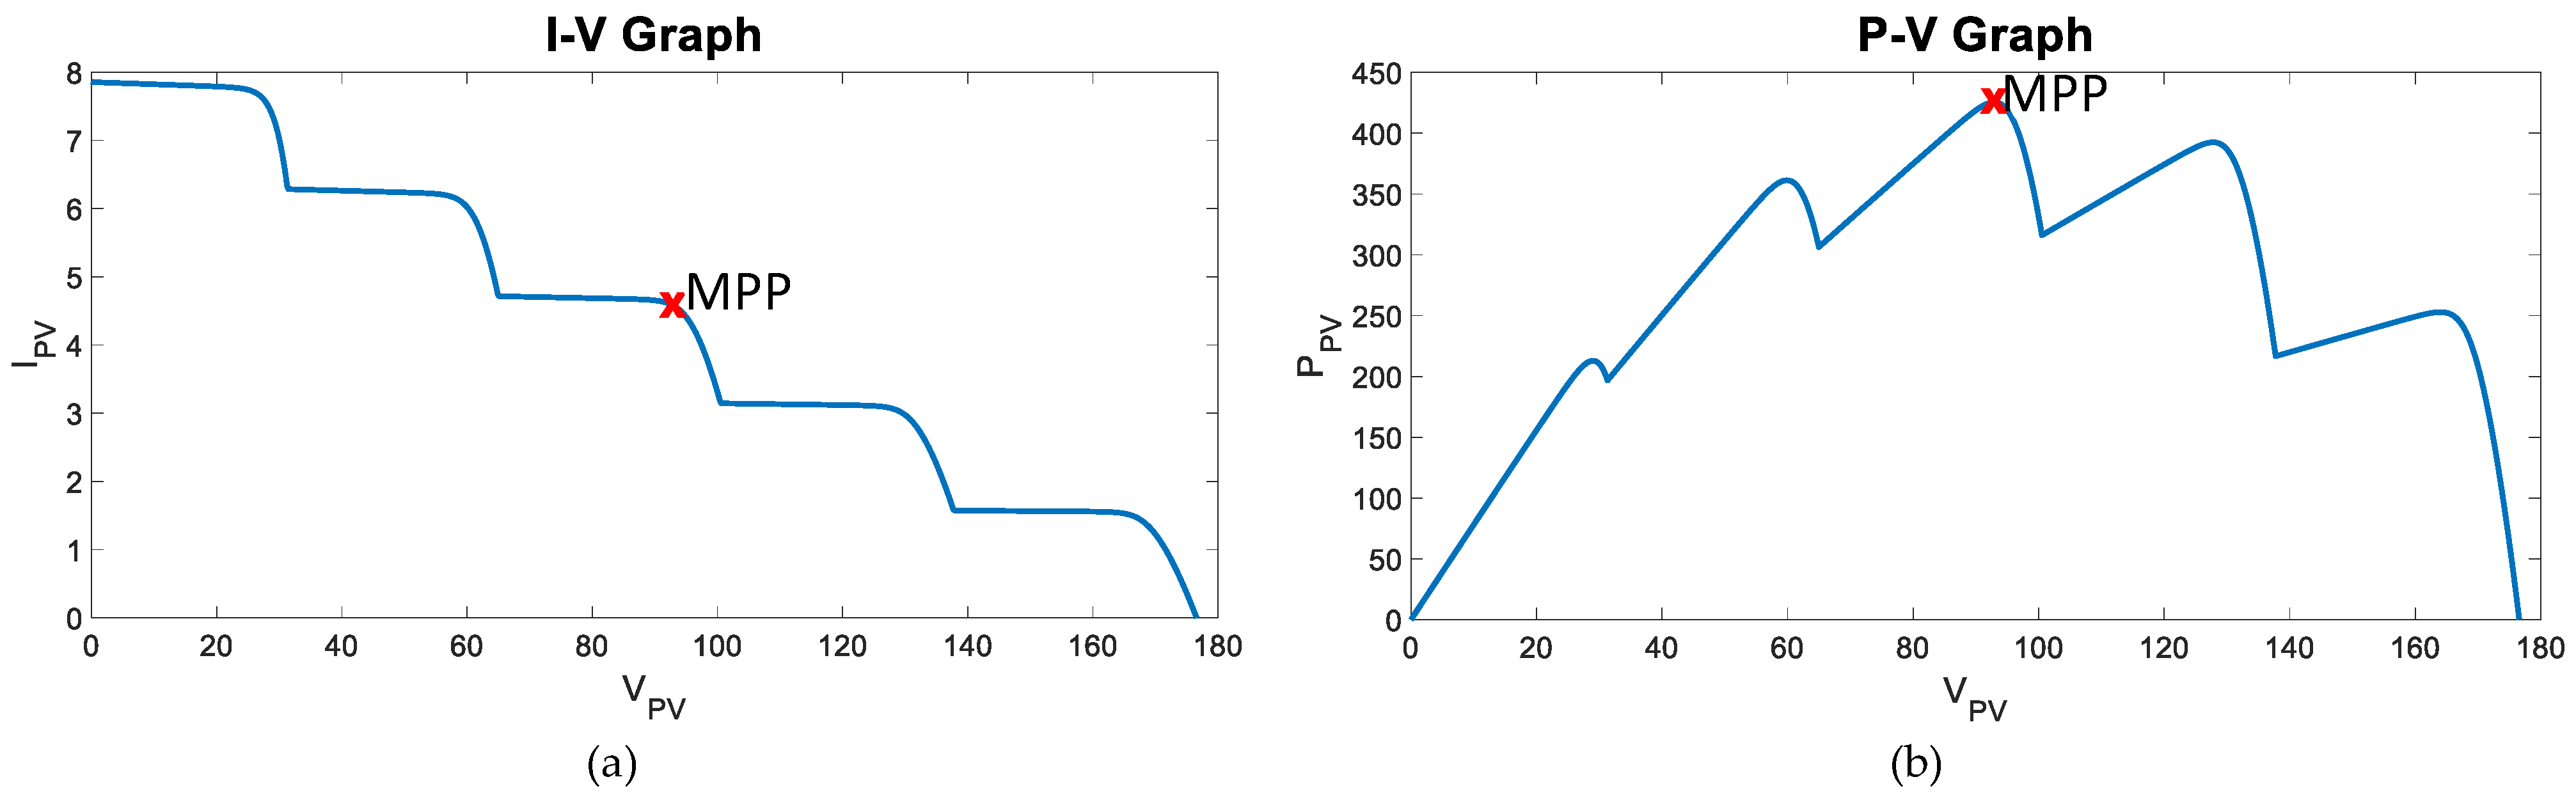
3.1.2. Output Characteristics and Maximum Power Point
3.1.3. Solar Cell Technology in Generations
3.2. PV Panel
3.2.1. Mathematical Modeling
3.2.2. Impact of Partial Shading Condition on PV array
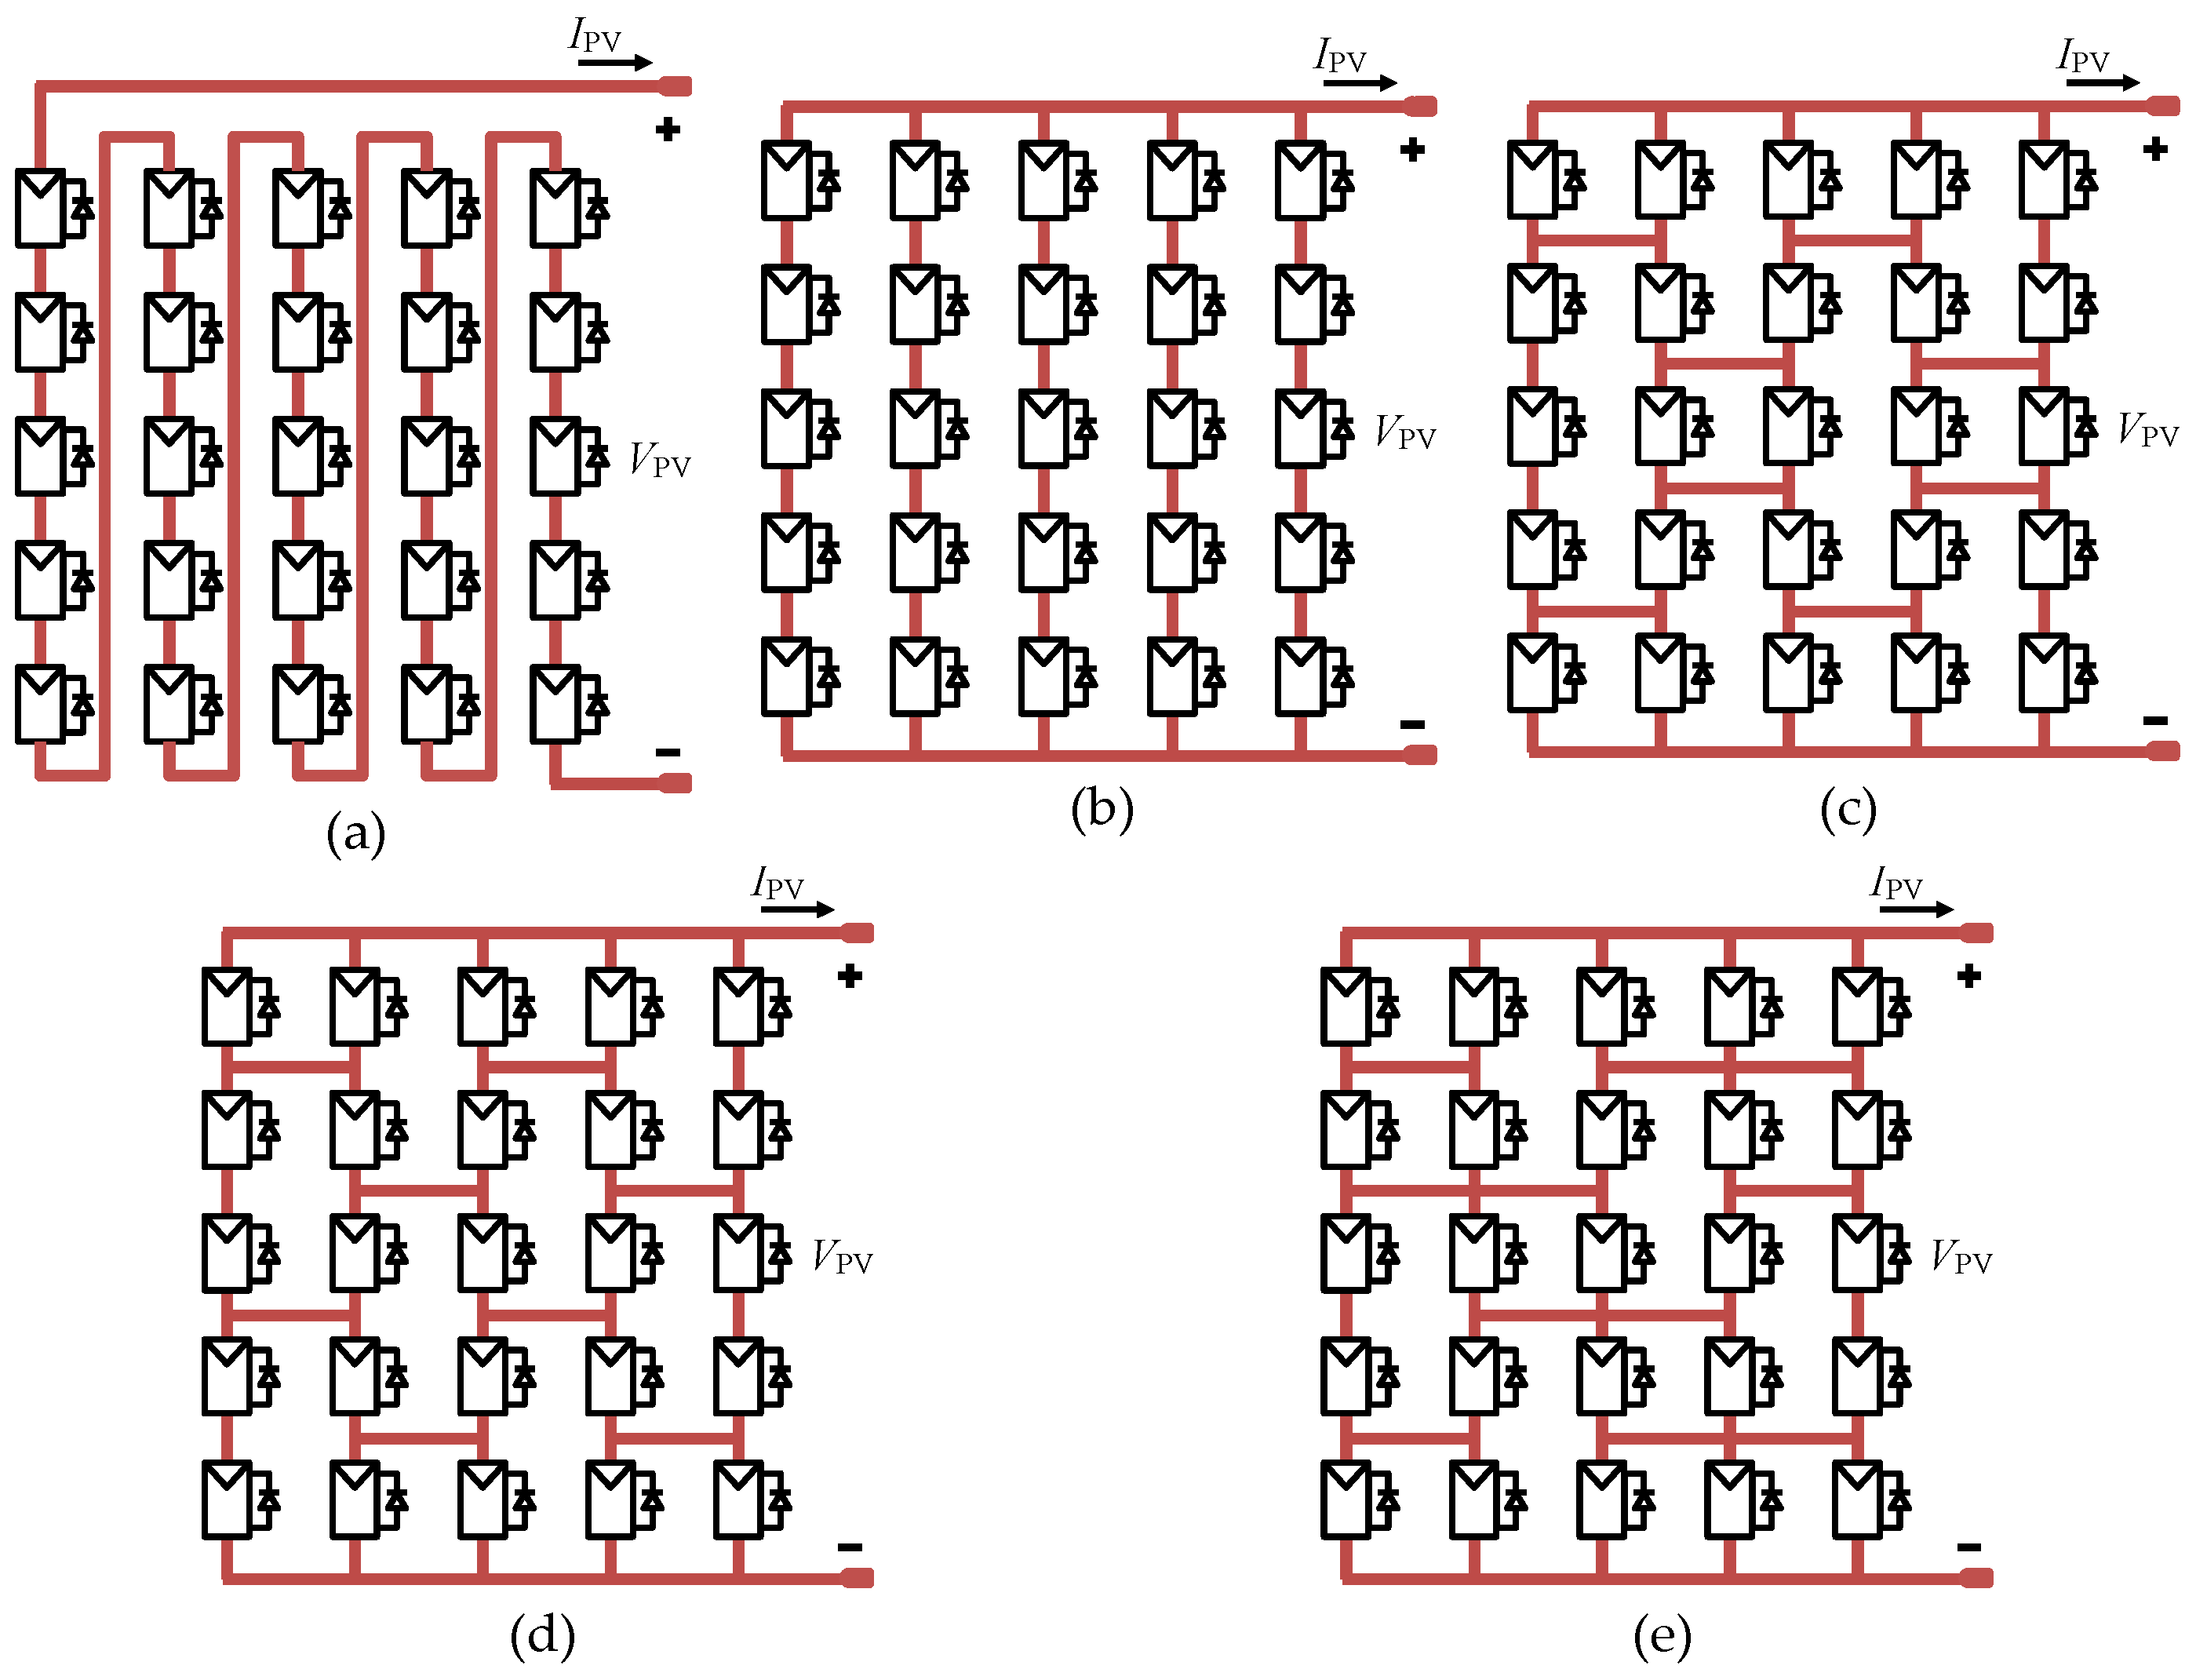
3.2.3. PV Array Configuration
4. Controller
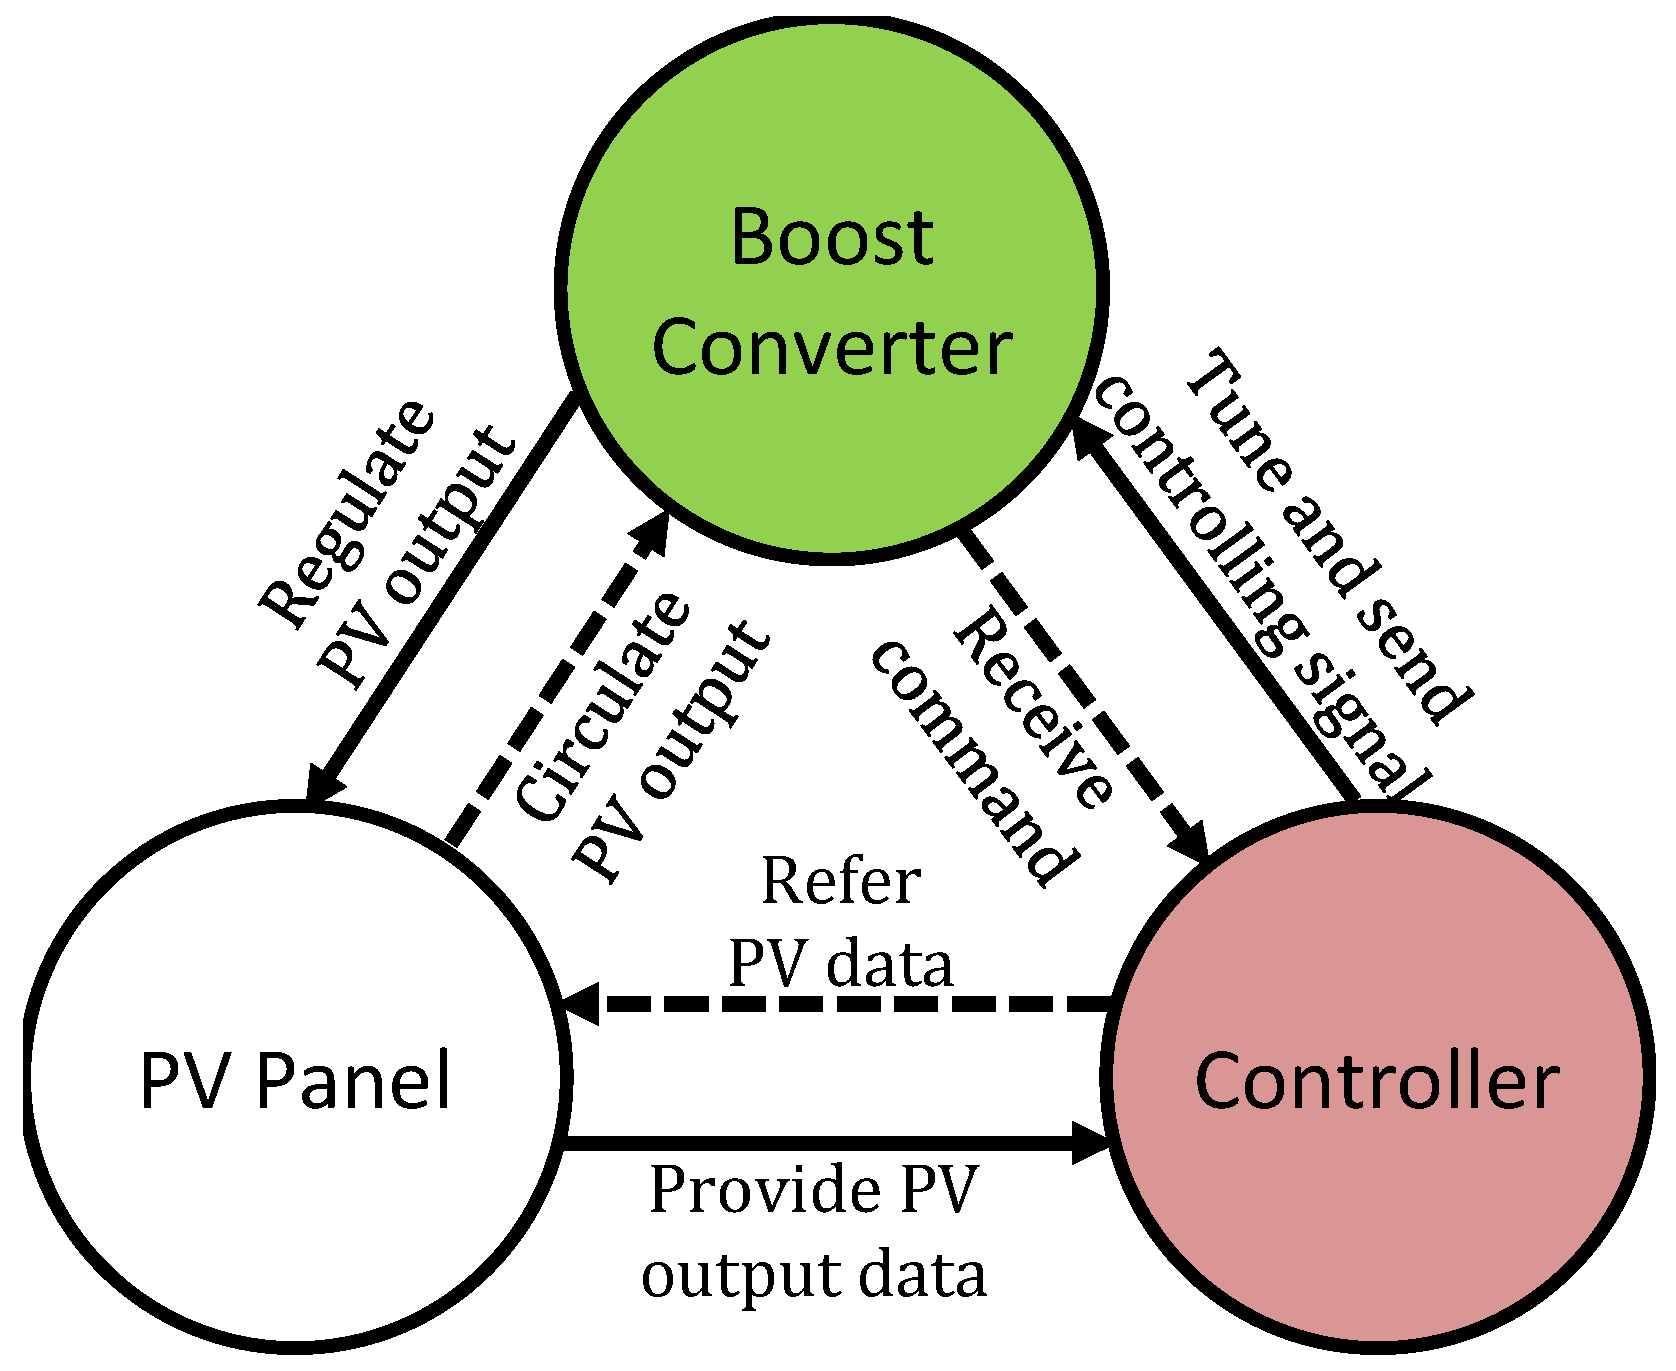
4.1. Working Principles Related to Other Devices
4.2. MPPT Techniques and Classification
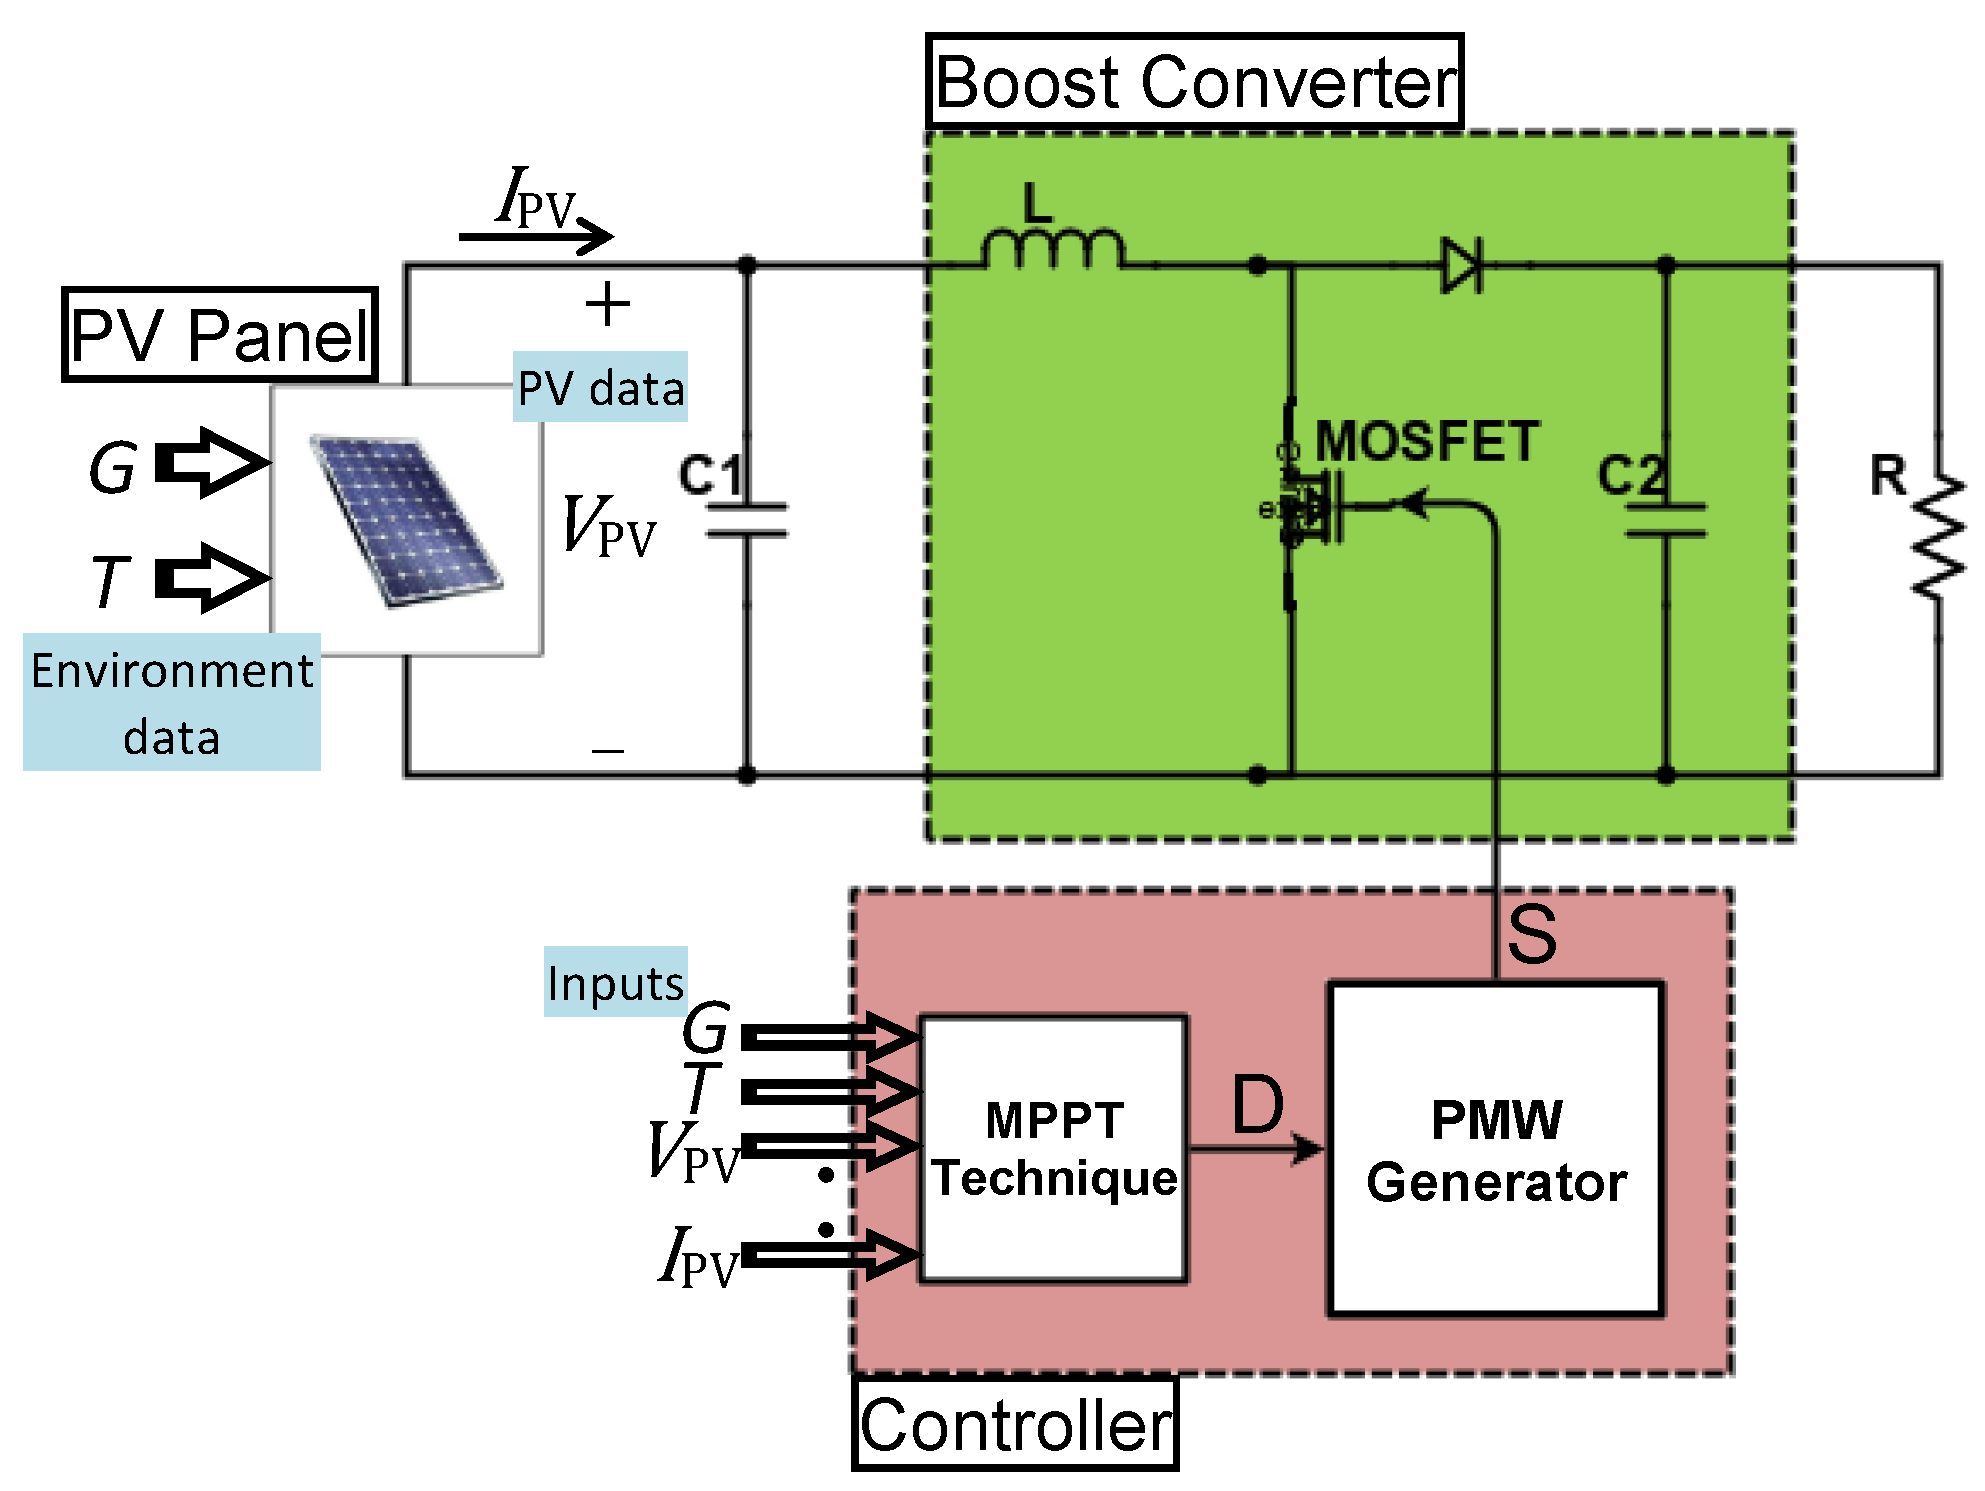
5. DC-DC Boost Converter
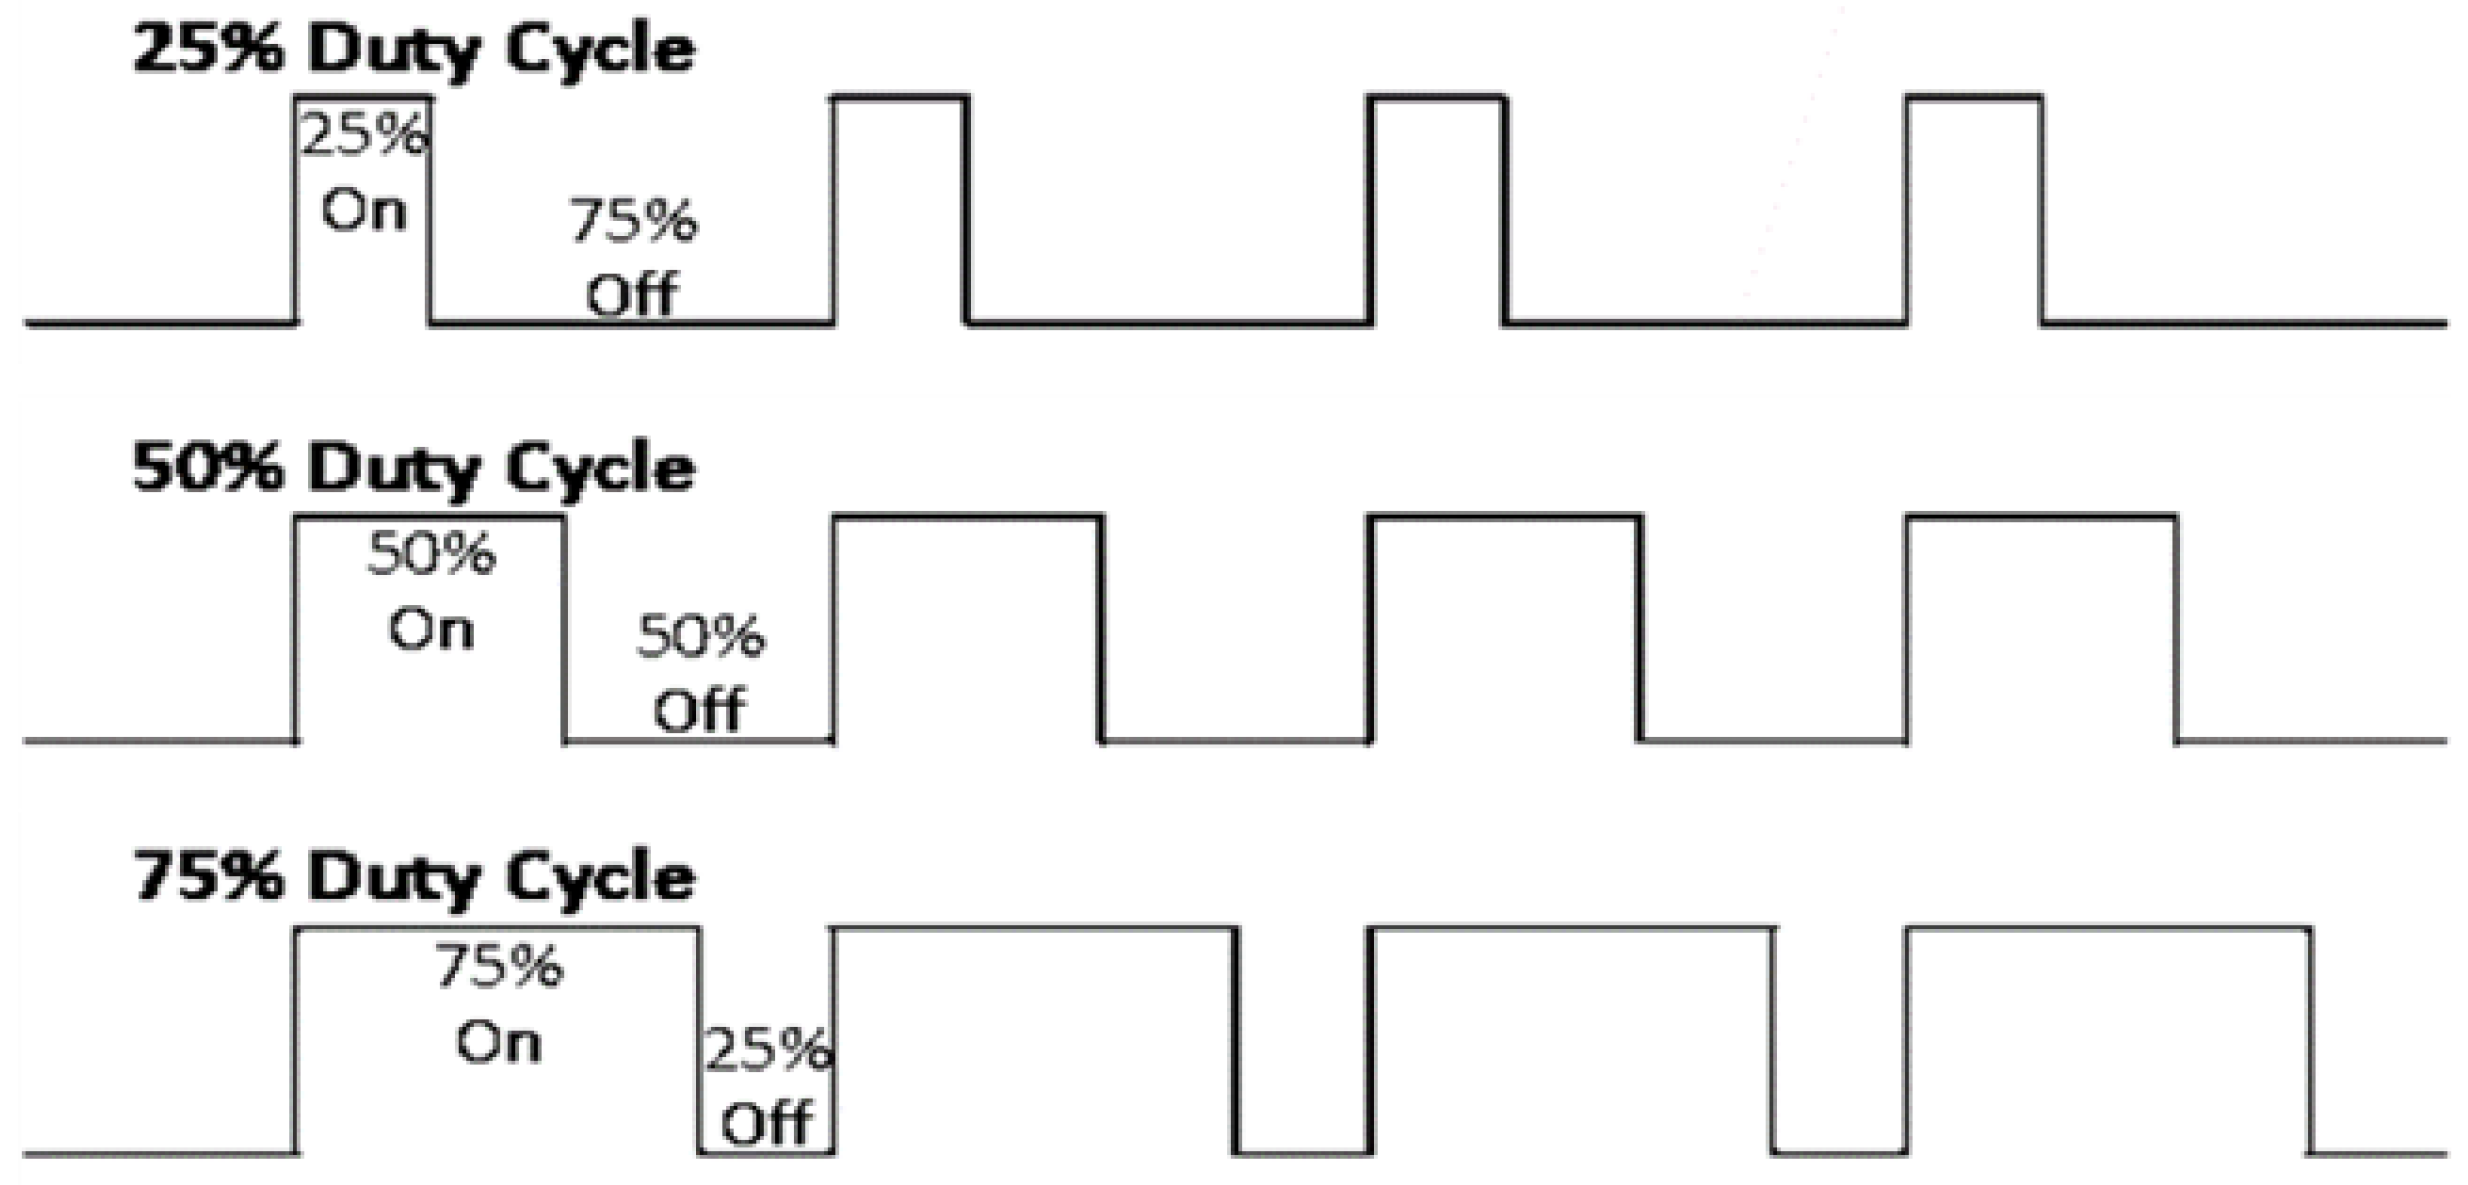
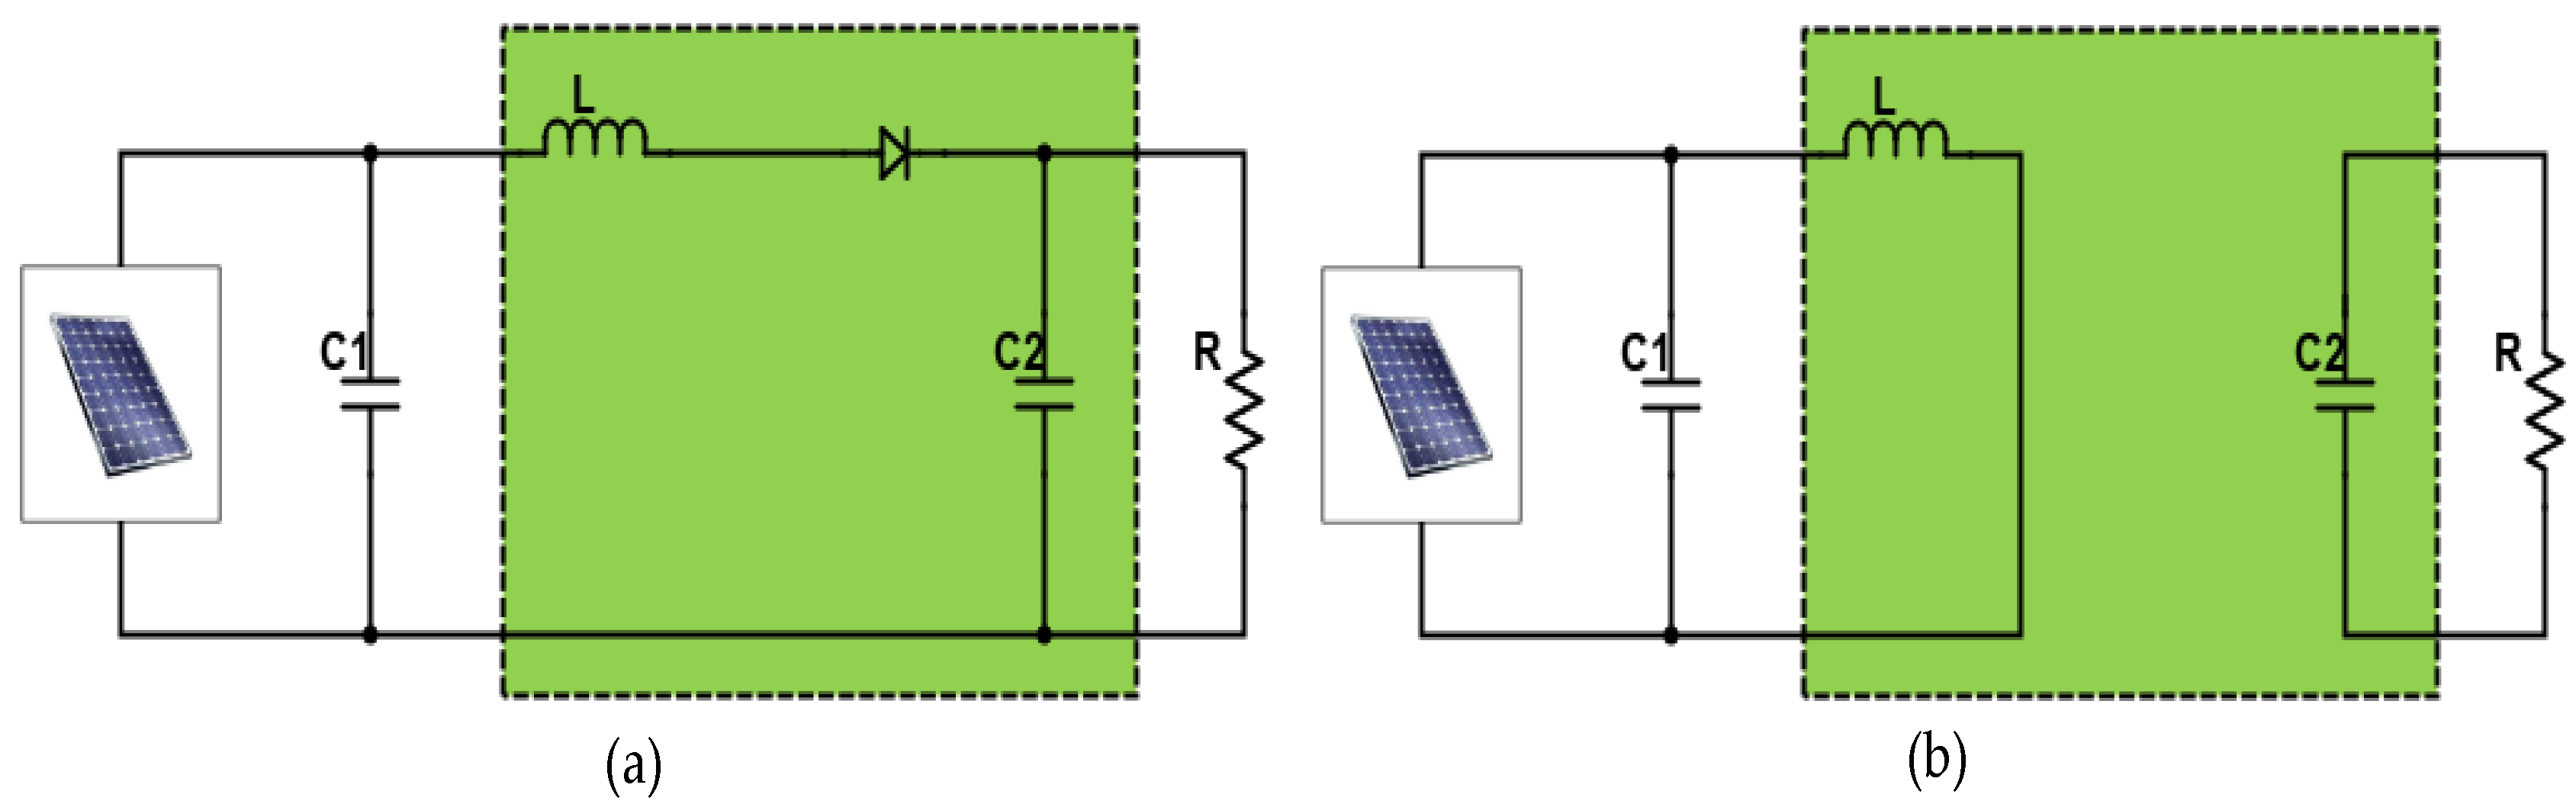
5.1. Working Principles Related to Other Devices
- (1)
- The digital PWM signal S contributes to the “ON” to “OFF” ratio of the MOSFET for duration within a period.
- (2)
- As the inductor L releases energy when the MOSFET is turned “OFF”, the sign of the inductor L is reversed, the positive sign of the PV panel is connected to the negative sign of the inductor L, and the total voltage received by the load R is now an added value. Therefore, it can be reasonably deduced that .
- (3)
- The power drawn from the PV panel should theoretically be equivalent to the power delivered to the load R due to the effective voltage stabilization when the MOSFET is switched “ON” and “OFF” at fixed time intervals during high frequency cycles. Hence, .
- (4)
- As and , the current drawn from the PV panel is theoretically larger than the current supplied to the load, and, hence, .
5.2. Converter Topologies
6. Conclusions
Author Contributions
Funding
Institutional Review Board Statement
Informed Consent Statement
Data Availability Statement
Acknowledgments
Conflicts of Interest
References
- Rio, J.; Silitonga, P. Energy Efficiency CambodiaPromoting and Demonstrating Energy Management System in Cambodia; ASEAN Centre of Energy: Jakarta, Indonesia, 2020. [Google Scholar]
- Tao, M.; Hamada, H.; Druffel, T.; Lee, J.-J.; Rajeshwar, K. Review—Research Needs for Photovoltaics in the 21st Century. ECS J. Solid State Sci. Technol. 2020, 9, 125010. [Google Scholar] [CrossRef]
- Mao, M.; Duan, Q.; Duan, P.; Hu, B. Comprehensive improvement of artificial fish swarm algorithm for global MPPT in PV system under partial shading conditions. Trans. Inst. Meas. Control. 2018, 40, 2178–2199. [Google Scholar] [CrossRef]
- Wang, W.; Yu, N.; Johnson, R. A model for commercial adoption of photovoltaic systems in California. J. Renew. Sustain. Energy 2017, 9, 025904. [Google Scholar] [CrossRef] [Green Version]
- Wei, C.K.; Saad, A.Y. The Potential of Solar Energy for Domestic and Commercial Buildings in Malaysia. J. Adv. Res. Fluid Mech. Therm. Sci. 2020, 75, 91–98. [Google Scholar] [CrossRef]
- Nwaigwe, K.N.; Mutabilwa, P.; Dintwa, E. An overview of solar power (PV systems) integration into electricity grids. Mater. Sci. Energy Technol. 2019, 2, 629–633. [Google Scholar] [CrossRef]
- Ceran, B.; Jurasz, J.; Mielcarek, A.; Campana, P.E. PV systems integrated with commercial buildings for local and national peak load shaving in Poland. J. Clean. Prod. 2021, 322, 129076. [Google Scholar] [CrossRef]
- Ontiri, G.K.; Amuhaya, L.L. A Review of Emerging Photovoltaic Construction Technologies to Increase Efficiencies in Solar as a Renewable Energy Source. Am. Acad. Sci. Res. J. Eng. Technol. Sci. 2022, 85, 348–369. [Google Scholar]
- Kumari, J.S.; Babu, C.S. Mathematical Modeling and Simulation of Photovoltaic Cell using Matlab-Simulink Environment. Int. J. Electr. Comput. Eng. 2015, 2, 26–34. [Google Scholar] [CrossRef]
- Seyedmahmoudian, M.; Mekhilef, S.; Rahmani, R.; Yusof, R.; Renani, E.T. Analytical Modeling of Partially Shaded Photovoltaic Systems. Energies 2013, 6, 128–144. [Google Scholar] [CrossRef] [Green Version]
- Sathyanarayana, P.; Ballal, R.; Sagar, P.L.; Kumar, G. Effect of Shading on the Performance of Solar PV Panel. Energy Power 2015, 5, 1–4. [Google Scholar] [CrossRef]
- Babu, G.S.; Charan, B.P.; Krishna, A.R. Comparative analysis of I-V & P-V characteristics of a series and parallel connected SPV modules. Int. J. Curr. Eng. Sci. Res. (IJCESR) 2016, 3, 1–6. [Google Scholar]
- Tiwari, G.N.; Meraj, M.; Khan, M.E.; Dwevedi, V.K. Effect of Series and Parallel Combination of Photovoltaic Thermal Collectors on the Performances of Integrated Active Solar Still. J. Therm. Sci. Eng. Appl. 2022, 14, 081006. [Google Scholar] [CrossRef]
- Gallegos, C.D.R.; Alvarez-Alvarado, M.S. Analysis of the Stationary and Transient Behavior of a Photovoltaic Solar Array: Modeling and Simulation. Int. J. Comput. Appl. Technol. 2015, 127, 26–33. [Google Scholar] [CrossRef]
- Parthiban, R.; Ponnambalam, P. An Enhancement of the Solar Panel Efficiency: A Comprehensive Review. Front. Energy Res. 2022, 10, 937155. [Google Scholar] [CrossRef]
- Salem, F.; Awadallah, M.A. Detection and assessment of partial shading in photovoltaic arrays. J. Electr. Syst. Inf. Technol. 2016, 3, 23–32. [Google Scholar] [CrossRef] [Green Version]
- Saadsaoud, M.; Abbassi, H.A.; Kermiche, S.; Ouada, M. Study of Partial Shading Effects on Photovoltaic Arrays with Comprehensive Simulator for Global MPPT Control. Int. J. Renew. Energy Res. 2016, 6, 413–420. [Google Scholar]
- Dadjé, A.; Djongyang, N.; Tchinda, R. Electrical Power Losses in a Photovoltaic Solar Cell Operating under Partial Shading Conditions. J. Power Energy Eng. 2017, 5, 19–33. [Google Scholar] [CrossRef] [Green Version]
- Soomar, A.M.; Hakeem, A.; Messaoudi, M.; Musznicki, P.; Iqbal, A.; Czapp, S. Solar Photovoltaic Energy Optimization and Challenges. Front. Energy Res. 2022, 10, 1–18. [Google Scholar] [CrossRef]
- Tofoli, F.L.; de Pereira, D.C.; de Paula, W.J. Comparative Study of Maximum Power Point Tracking Techniques for Photovoltaic Systems. Int. J. Photoenergy 2015, 2015, 1–10. [Google Scholar] [CrossRef] [Green Version]
- Pakkiraiah, B.; Sukumar, G.D. Research Survey on Various MPPT Performance Issues to Improve the Solar PV System Efficiency. J. Sol. Energy 2016, 2016, 1–20. [Google Scholar] [CrossRef] [Green Version]
- Lu, Y.; Khan, Z.A.; Alvarez-Alvarado, M.S.; Zhang, Y.; Huang, Z.; Imran, M. A Critical Review of Sustainable Energy Policies for the Promotion of Renewable Energy Sources. Sustainability 2020, 12, 5078. [Google Scholar] [CrossRef]
- ASEAN. ASEAN Action Plan for Energy Cooperation (APAEC) 2016–2025; Zamora, C.G., Ed.; ASEAN Centre for Energy: Jakarta, Indonesia, 2015. [Google Scholar]
- Dewangan, D.; Ekka, J.P.; Arjunan, T.V. Solar photovoltaic thermal system: A comprehensive review on recent design and development, applications and future prospects in research. Int. J. Ambient Energy 2022, 43, 1–25. [Google Scholar] [CrossRef]
- Decker, C. Energy transportation: Electricity. In Handbook of Energy Economics and Policy—Fundamentals and Applications for Engineers and Energy Planners; Rubino, A., Sapio, A., Scala, M.L., Eds.; Academic Press: Cambridge, MA, USA, 2021; pp. 193–238. ISBN 978-0-12-814712-2. [Google Scholar]
- Paynter, R.T.; Boydell, B.J.T. Power Transmission and Distribution: An Overview. In Introduction to Electricity; Pearson: Upper Saddle River, NJ, USA, 2010; pp. 1095–1097. [Google Scholar]
- Annestrand, S.A. Power Transmission, High-Voltage. In Encyclopedia of Physical Science and Technology; Academic Press: Cambridge, MA, USA, 2003; pp. 35–55. [Google Scholar] [CrossRef]
- Paynter, R.T.; Boydell, B.J.T. Transmission Lines and Substations. In Introduction to Electricity; Pearson: Upper Saddle River, NJ, USA, 2010; pp. 1102–1104. [Google Scholar]
- Dhass, A.D.; Beemkumar, N.; Harikrishnan, S.; Ali, H.M. A Review on Factors Influencing the Mismatch Losses in Solar Photovoltaic System. Int. J. Photoenergy 2022, 1–27. [Google Scholar] [CrossRef]
- Engr Alumona, T.L.; Nwosu, M.O.; Ezechukwu, A.O.; Chijioke, J. Overview Of Losses And Solutions In Power Transmission Lines. Netw. Complex Syst. 2014, 4, 24–31. [Google Scholar]
- Doukas, H.; Karakosta, C.; Flamos, A.; Psarras, J. Electric power transmission: An overview of associated burdens. Int. J. Energy Res. 2011, 35, 979–988. [Google Scholar] [CrossRef]
- Hameiri, Z. Photovoltaics literature survey (no. 172). Prog. Photovolt. 2022, 30, 204–208. [Google Scholar] [CrossRef]
- Sarah, K.E.; Roland, U.; Ci, O.E.N. A Review of Solar Photovoltaic Technologies. Int. J. Eng. Res. Technol. 2020, 9, 741–749. [Google Scholar] [CrossRef]
- IEA. Renewables 2021: Analysis and Forecasts to 2026; OECD Publishing: Paris, France, 2021. [Google Scholar]
- Sedra, A.S.; Smith, K.C. Microelectronic Circuits 5TH Edition; Oxford University Press: Oxford, UK, 2004; ISBN 0195142527. [Google Scholar]
- Dambhare, M.V.; Butey, B.; Moharil, S. V Solar photovoltaic technology: A review of different types of solar cells and its future trends. J. Phys. Conf. Ser. 2021, 1913, 1–16. [Google Scholar] [CrossRef]
- Moller, H.J. Semiconductors for Solar Cells; Artech House: Norwood, MA, USA, 1993; ISBN 9780890065747. [Google Scholar]
- Fahrenbruch, A.; Bube, R. Fundamentals Of Solar Cells; Academic Press: Cambridge, MA, USA, 1983; ISBN 9780323145381. [Google Scholar]
- Villalva, M.G.; Gazoli, J.R.; Filho, E.R. Comprehensive Approach to Modeling and Simulation of Photovoltaic Arrays. IEEE Trans. Power Electron. 2009, 24, 1198–1208. [Google Scholar] [CrossRef]
- Salmi, T.; Bouzguenda, M.; Gastli, A.; Masmoudi, A. MATLAB/Simulink Based Modelling of Solar Photovoltaic Cell. Int. J. Renew. Energy Res. 2012, 2, 213–218. [Google Scholar]
- Hossain, M.S.; Roy, N.K.; Ali, M.O. Modeling of solar photovoltaic system using MATLAB/Simulink. In Proceedings of the 2016 19th International Conference on Computer and Information Technology (ICCIT), Dhaka, Bangladesh, 18–20 December 2016; p. 16692888. [Google Scholar]
- Vergura, S. A Complete and Simplified Datasheet-Based Model of PV Cells in Variable Environmental Conditions for Circuit Simulation. Energies 2016, 9, 326. [Google Scholar] [CrossRef] [Green Version]
- Kesİlmİş, Z.; Erol, H.; Uçman, M. Power Optimization in Partially Shaded Photovoltaic Systems. Tech. J. 2018, 12, 34–38. [Google Scholar] [CrossRef]
- De Soto, W.; Klein, S.A.; Beckman, W.A. Improvement and validation of a model for photovoltaic array performance. Sol. Energy 2006, 80, 78–88. [Google Scholar] [CrossRef]
- Jahangir, A.; Mishra, S. Autonomous Battery Storage Energy System Control of PV-Wind Based DC Microgrid. In Proceedings of the 2018 2nd International Conference on Power, Energy and Environment: Towards Smart Technology (ICEPE), Shillong, India, 1–2 June 2018; p. 18508739. [Google Scholar]
- Messenger, R.A.; Abtahi, A. Photovoltaic Systems Engineering, 4th ed.; CRC Press: Boca Raton, FL, USA, 2017; ISBN 9781498772778. [Google Scholar]
- Prakash, R.; Singh, S. Designing and Modelling of Solar Photovoltaic Cell and Array. IOSR J. Electr. Electron. Eng. 2016, 11, 35–40. [Google Scholar] [CrossRef]
- Rauschenbach, H.S. Solar Cell Array Design Handbook: The Principles and Technology of Photovoltaic Energy Conversion; Springer: Dordrecht, The Netherlands, 1980; Volume 1. [Google Scholar] [CrossRef] [Green Version]
- Seyedmahmoudian, M.; Mohamadi, A.; Kumary, S.; Maung, A.; Oo, T.; Stojcevski, A. A Comparative Study on Procedure and State of the Art of Conventional Maximum Power Point Tracking Techniques for Photovoltaic System. Int. J. Comput. Electr. Eng. 2014, 6, 402–414. [Google Scholar] [CrossRef] [Green Version]
- Pastuszak, J.; Węgierek, P. Photovoltaic Cell Generations and Current Research Directions for Their Development. Materials 2022, 15, 5542. [Google Scholar] [CrossRef]
- Kuczyńska-Łażewska, A.; Klugmann-Radziemska, E.; Witkowska, A. Recovery of Valuable Materials and Methods for Their Management When Recycling Thin-Film CdTe Photovoltaic Modules. Materials 2021, 14, 7836. [Google Scholar] [CrossRef] [PubMed]
- Al-Ezzi, A.S.; Ansari, M.N.M. Photovoltaic Solar Cells: A Review. Appl. Syst. Innov. 2022, 5, 67. [Google Scholar] [CrossRef]
- Rathore, N.; Panwar, N.L.; Yettou, F.; Gama, A. A comprehensive review of different types of solar photovoltaic cells and their applications. Int. J. Ambient Energy 2021, 42, 1200–1217. [Google Scholar] [CrossRef]
- Iqbal, M.A.; Malik, M.; Shahid, W.; Din, S.Z.U.; Anwar, N.; Ikram, M.; Idrees, F. Materials for Photovoltaics: Overview, Generations, Recent Advancements and Future Prospects. In Thin Films Photovoltaics; Zaidi, B., Shekhar, C., Eds.; IntechOpen: London, UK, 2022; pp. 1–112. [Google Scholar]
- Best Research-Cell Efficiency Chart. NREL Transforming ENERGY. 2022. Available online: https://www.nrel.gov/pv/cell-efficiency.html (accessed on 21 November 2022).
- Čulík, P.; Brooks, K.; Momblona, C.; Adams, M.; Kinge, S.; Maréchal, F.; Dyson, P.J.; Nazeeruddin, M.K. Design and Cost Analysis of 100 MW Perovskite Solar Panel Manufacturing Process in Different Locations. ACS Energy Lett. 2022, 7, 3039–3044. [Google Scholar] [CrossRef]
- Muteri, V.; Cellura; Curto, D.; Franzitta; Longo, S.; Mistretta; Parisi, M.L. Review on Life Cycle Assessment of Solar Photovoltaic Panels. Energies 2020, 13, 252. [Google Scholar] [CrossRef] [Green Version]
- Fthenakis, V.M.; Kim, H.C. Photovoltaics: Life-cycle analyses. Sol. Energy 2011, 85, 1609–1628. [Google Scholar] [CrossRef]
- Sopian, K.; Cheow, S.L.; Zaidi, S.H. An overview of crystalline silicon solar cell technology: Past, present, and future. AIP Conf. Proc. 2017, 1877, 020004. [Google Scholar] [CrossRef]
- Jones, C.; Gilbert, P. Determining the consequential life cycle greenhouse gas emissions of increased rooftop photovoltaic deployment. J. Clean. Prod. 2018, 184, 211–219. [Google Scholar] [CrossRef]
- Fathi, M.; Mefoued, A.; Messaoud, A.; Boukennous, Y. Cost-effective photovoltaics with silicon material. Phys. Procedia 2009, 2, 751–757. [Google Scholar] [CrossRef] [Green Version]
- Hengevoss, D.; Baumgartner, C.; Nisato, G.; Hugi, C. Life Cycle Assessment and eco-efficiency of prospective, flexible, tandem organic photovoltaic module. Sol. Energy 2016, 137, 317–327. [Google Scholar] [CrossRef]
- Louwen, A.; Van-Sark, W.; Schropp, R.; Faaij, A. A cost roadmap for silicon heterojunction solar cells. Sol. Energy Mater. Sol. Cells 2016, 147, 295–314. [Google Scholar] [CrossRef] [Green Version]
- Tian, X.; Stranks, S.D.; You, F. Life cycle energy use and environmental implications of high-performance perovskite tandem solar cells. Sci. Adv. 2020, 6, 1–10. [Google Scholar] [CrossRef] [PubMed]
- Jean, J.; Brown, P.R.; Jaffe, R.L.; Buonassisi, T.; Bulović, V. Pathways for solar photovoltaics. Energy Environ. Sci. 2015, 8, 1200–1219. [Google Scholar] [CrossRef]
- Resalati, S.; Okoroafor, T.; Maalouf, A.; Saucedo, E.; Placidi, M. Life cycle assessment of different chalcogenide thin-film solar cells. Appl. Energy 2022, 313, 118888. [Google Scholar] [CrossRef]
- Horowitz, K.A.W.; Woodhouse, M. Cost and potential of monolithic CIGS photovoltaic modules. In Proceedings of the 2015 IEEE 42nd Photovoltaic Specialist Conference (PVSC), New Orleans, LA, USA, 14–19 June 2015; p. 15664730. [Google Scholar]
- Rix, A.; Steyl, J.; Rudman, J.; Terblanche, U.; Van-Niekerk, J. First Solar’s CdTe Module Technology—Performance, Life Cycle, Health and Safety Impact Assessment; Centre for Renewable and Sustainable Energy Studies, Stellenbosch University: Stellenbosch, South Africa, 2015. [Google Scholar]
- Kim, H.C.; Fthenakis, V.; Choi, J.-K.; Turney, D.E. Life Cycle Greenhouse Gas Emissions of Thin-film Photovoltaic Electricity Generation. J. Ind. Ecol. 2012, 16, S110–S121. [Google Scholar] [CrossRef]
- Águas, H.; Ram, S.K.; Araújo, A.J.; Gaspar, D.; Vicente, A.M.T.; Filonovich, S.; Fortunato, E.; Martins, R.F.; Ferreira, I. Silicon thin film solar cells on commercial tiles. Energy Environ. Sci. 2011, 4, 4620–4632. [Google Scholar] [CrossRef]
- Rao, V.T.; Sekhar, Y.R.; Mahesh, H.; Muraleedharan, A.K.; Charles, D.; Aljuraide, N.I.; Ibrahim, A.M.M.; Helal, M.; Galal, A.M.; Sami, R.; et al. Life Cycle Analysis of Thin-Film Photovoltaic Thermal Systems for Different Tropical Regions. Sustainability 2022, 14, 14209. [Google Scholar] [CrossRef]
- Chen, Y.; Altermatt, P.P.; Chen, D.; Zhang, X.; Xu, G.; Yang, Y.; Wang, Y.; Feng, Z.; Shen, H.; Verlinden, P.J. From Laboratory to Production: Learning Models of Efficiency and Manufacturing Cost of Industrial Crystalline Silicon and Thin-Film Photovoltaic Technologies. IEEE J. Photovoltaics 2018, 8, 1531–1538. [Google Scholar] [CrossRef]
- Horowitz, K.A.; Remo, T.W.; Smith, B.; Ptak, A.J. A Techno-Economic Analysis and Cost Reduction Roadmap for III-V Solar Cells; National Renewable Energy Lab. (NREL): Golden, CO, USA, 2018. [Google Scholar]
- Lee, K.; Lee, J.; Mazor, B.A.; Forrest, S.R. Transforming the cost of solar-to-electrical energy conversion: Integrating thin-film GaAs solar cells with non-tracking mini-concentrators. Light Sci. Appl. 2015, 4, e288. [Google Scholar] [CrossRef] [Green Version]
- Kalowekamo, J.; Baker, E. Estimating the manufacturing cost of purely organic solar cells. Sol. Energy 2009, 83, 1224–1231. [Google Scholar] [CrossRef]
- Tsang, M.P.; Sonnemann, G.W.; Bassani, D.M. Life-cycle assessment of cradle-to-grave opportunities and environmental impacts of organic photovoltaic solar panels compared to conventional technologies. Sol. Energy Mater. Sol. Cells 2016, 156, 37–48. [Google Scholar] [CrossRef]
- Espinosa, N.; Krebs, F.C. Life cycle analysis of organic tandem solar cells: When are they warranted? Sol. Energy Mater. Sol. Cells 2014, 120, 692–700. [Google Scholar] [CrossRef]
- Jean, J.; Xiao, J.; Nick, R.; Moody, N.; Nasilowski, M.; Bawendi, M.; Bulović, V. Synthesis cost dictates the commercial viability of lead sulfide and perovskite quantum dot photovoltaics. Energy Environ. Sci. 2018, 11, 2295–2305. [Google Scholar] [CrossRef]
- Schoden, F.; Schnatmann, A.K.; Blachowicz, T.; Manz-Schumacher, H.; Schwenzfeier-Hellkamp, E. Circular Design Principles Applied on Dye-Sensitized Solar Cells. Sustainability 2022, 14, 15280. [Google Scholar] [CrossRef]
- Li, Z.; Zhao, Y.; Wang, X.; Sun, Y.; Zhao, Z.; Li, Y.; Zhou, H.; Chen, Q. Cost Analysis of Perovskite Tandem Photovoltaics. Joule 2018, 2, 1559–1572. [Google Scholar] [CrossRef] [Green Version]
- Ahangharnejhad, R.H.; Phillips, A.B.; Song, Z.; Celik, I.; Ghimire, K.; Koirala, P.; Ellingson, R.J.; Collins, R.W.; Podraza, N.J.; Yan, Y.; et al. Impact of lifetime on the levelized cost of electricity from perovskite single junction and tandem solar cells. Sustain. Energy Fuels 2022, 6, 2718–2726. [Google Scholar] [CrossRef]
- Syed, T.H.; Wei, W. Technoeconomic Analysis of Dye Sensitized Solar Cells (DSSCs) with WS2/Carbon Composite as Counter Electrode Material. Inorganics 2022, 10, 191. [Google Scholar] [CrossRef]
- Zendehdel, M.; Nia, N.Y.; Yaghoubinia, M. Emerging Thin Film Solar Panels. In Reliability and Ecological Aspects of Photovoltaic Modules; InTechOpen: London, UK, 2019; pp. 1–26. [Google Scholar] [CrossRef] [Green Version]
- Baiju, A.; Yarema, M. Status and challenges of multi-junction solar cell technology. Front. Energy Res. 2022, 10, 1–17. [Google Scholar] [CrossRef]
- Itten, R.; Stucki, M. Highly Efficient 3rd Generation Multi-Junction Solar Cells Using Silicon Heterojunction and Perovskite Tandem: Prospective Life Cycle Environmental Impacts. Energies 2017, 10, 841. [Google Scholar] [CrossRef] [Green Version]
- Horowitz, K.; Woodhouse, M.; Lee, H.; Smestad, G. A Bottom-Up Cost Analysis of a High Concentration PV Module. AIP Conf. Proc. 2015, 1679, 100001. [Google Scholar] [CrossRef] [Green Version]
- Gao, Q.; Yan, J.; Wan, L.; Zhang, C.; Wen, Z.; Zhou, X.; Li, H.; Li, F.; Chen, J.; Guo, J.; et al. High-Efficiency Graphene-Oxide/Silicon Solar Cells with an Organic-Passivated Interface. Adv. Mater. Interfaces 2022, 9, 2201221. [Google Scholar] [CrossRef]
- Jang, C.W.; Shin, D.H.; Choi, S.-H. Porous silicon solar cells with 13.66% efficiency achieved by employing graphene-quantum-dots interfacial layer, doped-graphene electrode, and bathocuproine back-surface passivation layer. J. Alloys Compd. 2021, 877, 160311. [Google Scholar] [CrossRef]
- Hong, J.A.; Jung, E.D.; Yu, J.C.; Kim, D.W.; Nam, Y.S.; Oh, I.; Lee, E.; Yoo, J.-W.; Cho, S.; Song, M.H. Improved Efficiency of Perovskite Solar Cells Using a Nitrogen-Doped Graphene-Oxide-Treated Tin Oxide Layer. ACS Appl. Mater. Interfaces 2020, 12, 2417–2423. [Google Scholar] [CrossRef]
- Zhang, S.; Guo, R.; Zeng, H.; Zhao, Y.; Liu, X.; You, S.; Li, M.; Luo, L.; Lira-Cantu, M.; Li, L.; et al. Improved performance and stability of perovskite solar modules by interface modulating with graphene oxide crosslinked CsPbBr3 quantum dots. Energy Environ. Sci. 2022, 15, 244–253. [Google Scholar] [CrossRef]
- Nagaraj, G.; Mohammed, M.K.A.; Shekargoftar, M.; Sasikumar, P.; Sakthivel, P.; Ravi, G.; Dehghanipour, M.; Akin, S.; Shalan, A.E. High-performance perovskite solar cells using the graphene quantum dot–modified SnO2/ZnO photoelectrode. Mater. Today Energy 2021, 22, 100853. [Google Scholar] [CrossRef]
- Mahalingam, S.; Low, F.W.; Omar, A.; Manap, A.; Rahim, N.A.; Tan, C.H.; Abdullah, H.; Voon, C.H.; Rokhmat, M.; Wibowo, E.; et al. Zinc oxide/graphene nanocomposite as efficient photoelectrode in dye-sensitized solar cells: Recent advances and future outlook. Int. J. Energy Res. 2022, 46, 7082–7100. [Google Scholar] [CrossRef]
- Huang, X.; Hara, E.; Sugime, H.; Noda, S. Carbon nanotube/silicon heterojunction solar cell with an active area of 4 cm2 realized using a multifunctional molybdenum oxide layer. Carbon N. Y. 2021, 185, 215–223. [Google Scholar] [CrossRef]
- Tazawa, Y.; Habisreutinger, S.N.; Zhang, N.; Gregory, D.A.F.; Nagamine, G.; Kesava, S.V.; Mazzotta, G.; Assender, H.E.; Riede, M.; Padilha, L.A.; et al. Carbon Nanotubes for Quantum Dot Photovoltaics with Enhanced Light Management and Charge Transport. ACS Photonics 2018, 5, 4854–4863. [Google Scholar] [CrossRef]
- Mfon, R.E.; Labulo, A.H.; Al Amri, Z.; Esaduwha, S.; Labaran, J. Effect of Carbon Nanotubes on the performance of Perovskite Solar Cells. Eur. J. Energy Res. 2022, 2, 62–68. [Google Scholar] [CrossRef]
- Shao, W.; Wu, W. High-Efficiency (Over 10%) Parallel Tandem Dye-Sensitized Solar Cells Based on Tri-Carbon Electrodes. Trans. Tianjin Univ. 2022, 28, 414–422. [Google Scholar] [CrossRef]
- Hu, X.-G.; Wei, Q.; Zhao, Y.-M.; Hou, P.-X.; Ren, W.; Liu, C.; Cheng, H.-M. FeCl3-functionalized graphene oxide/single-wall carbon nanotube/silicon heterojunction solar cells with an efficiency of 17.5%. J. Mater. Chem. A 2022, 10, 4644–4652. [Google Scholar] [CrossRef]
- Gopi, C.V.V.M.; Singh, S.; Reddy, A.E.; Kim, H.-J. CNT@rGO@MoCuSe Composite as an Efficient Counter Electrode for Quantum Dot-Sensitized Solar Cells. ACS Appl. Mater. Interfaces 2018, 10, 10036–10042. [Google Scholar] [CrossRef] [PubMed]
- Zhao, X.; Wu, Y.; Xia, Z.; Chang, S.; Shang, Y.; Cao, A. A GQD-based composite film as photon down-converter in CNT/Si solar cells. Nano Res. 2021, 14, 3893–3899. [Google Scholar] [CrossRef]
- Li, X.; Tong, T.; Wu, Q.; Guo, S.; Song, Q.; Han, J.; Huang, Z. Unique Seamlessly Bonded CNT@Graphene Hybrid Nanostructure Introduced in an Interlayer for Efficient and Stable Perovskite Solar Cells. Adv. Funct. Mater. 2018, 28, 1800475. [Google Scholar] [CrossRef]
- Kladkaew, M.; Lin, J.-Y.; Chanlek, N.; Vailikhit, V.; Hasin, P. Well-Dispersive Polypyrrole and MoSe2 Embedded in Multiwalled Carbon Nanotube@Reduced Graphene Oxide Nanoribbon Electrocatalysts as the Efficient Counter Electrodes in Rigid and Plastic Dye-Sensitized Solar Cells. ACS Appl. Energy Mater. 2022. [Google Scholar] [CrossRef]
- Mohammed, K.A.; Alebadi, S.N.; Ziadan, K.; Al-kabbi, A.S.; Alrubaie, A.J.; Hussein, H.M. Organic-inorganic hybrid material: Synthesis, characterization for solar cell application. J. Ovonic Res. 2022, 18, 75–82. [Google Scholar] [CrossRef]
- Liu, R. Hybrid Organic/Inorganic Nanocomposites for Photovoltaic Cells. Materials 2014, 7, 2747–2771. [Google Scholar] [CrossRef] [PubMed]
- Tala-Ighil, R. Nanomaterials in Solar Cells. In Handbook of Nanoelectrochemistry; Aliofkhazraei, M., Makhlouf, A., Eds.; Springer: Cham, Switzerland, 2015; pp. 1–18. [Google Scholar]
- Wu, Y.; Wu, X.; Guan, Y.; Xu, Y.; Shi, F.; Liang, J. Carbon-based flexible electrodes for electrochemical potassium storage. New Carbon Mater. 2022, 37, 852–874. [Google Scholar] [CrossRef]
- Khanna, V.K. Nano-Structured Photovoltaics: Solar Cells in the Nanotechnology Era; CRC Press: Boca Rton, FL, USA, 2022. [Google Scholar]
- IRENA; IEA-PVPS. End-of-Life Management: Solar Photovoltaic Panels; International Renewable Energy Agency (IRENA): Bonn, Germany; International Energy Agency Photovoltaic Power Systems Programme (IEA-PVPS): Washington, DC, USA, 2016. [Google Scholar]
- Cheng, T.-H.; Liu, C.-J.; Tsai, T.-Y.; Shen, Y.-H. A Process for the Recovery of Gallium from Gallium Arsenide Scrap. Processes 2019, 7, 921. [Google Scholar] [CrossRef] [Green Version]
- Walzberg, J.; Carpenter, A.; Heath, G.A. Role of the social factors in success of solar photovoltaic reuse and recycle programmes. Nat. Energy 2021, 6, 913–924. [Google Scholar] [CrossRef]
- Zhang, X.; Xu, W.; Wang, S.; Liu, D.; Deng, P.; Deng, J.; Jiang, W. Research Status of Recovery of Tellurium from Cadmium Telluride Photovoltaic Modules. IOP Conf. Ser. Mater. Sci. Eng. 2020, 782, 022024. [Google Scholar] [CrossRef]
- Liu, F.-W.; Cheng, T.-M.; Chen, Y.-J.; Yueh, K.-C.; Tang, S.-Y.; Wang, K.; Wu, C.-L.; Tsai, H.-S.; Yu, Y.-J.; Lai, C.-H.; et al. High-yield recycling and recovery of copper, indium, and gallium from waste copper indium gallium selenide thin-film solar panels. Sol. Energy Mater. Sol. Cells 2022, 241, 111691. [Google Scholar] [CrossRef]
- Sharma, R.; Gupta, A.; Nandan, G.; Dwivedi, G.; Kumar, S. Life span and overall performance enhancement of Solar Photovoltaic cell using water as coolant: A recent review. Mater. Today Proc. 2018, 5, 18202–18210. [Google Scholar] [CrossRef]
- Smith, S.E.; Stanislawski, B.J.; Eng, B.K.; Ali, N.; Silverman, T.J.; Calaf, M.; Cal, R.B. Viewing convection as a solar farm phenomenon broadens modern power predictions for solar photovoltaics. J. Renew. Sustain. Energy 2022, 14, 063502. [Google Scholar] [CrossRef]
- Muchuweni, E.; Mombeshora, E.T.; Martincigh, B.S.; Nyamori, V.O. Recent Applications of Carbon Nanotubes in Organic Solar Cells. Front. Chem. 2021, 9, 733552. [Google Scholar] [CrossRef]
- Khan, D.; Ali, Z.; Asif, D.; Kumar-Panjwani, M.; Khan, I. Incorporation of carbon nanotubes in photoactive layer of organic solar cells. Ain Shams Eng. J. 2021, 12, 897–900. [Google Scholar] [CrossRef]
- Jagadeesh, K.; Chengaiah, C. A comprehensive review—Partial shading issues in PV system. AIP Conf. Proc. 2022, 2640, 020030. [Google Scholar] [CrossRef]
- Aicha, D.; Bessous, N.; Rezaoui, M.M.; Merzouk, I. Study of the Effects of Partial Shading on PV Array. In Proceedings of the 2018 International Conference on Communications and Electrical Engineering (ICCEE), El Oued, Algeria, 17–18 December 2018. [Google Scholar]
- Teo, J.C.; Tan, R.H.G.; Mok, V.H.; Ramachandaramurthy, V.K.; Tan, C. Impact of Partial Shading on the P-V Characteristics and the Maximum Power of a Photovoltaic String. Energies 2018, 11, 1860. [Google Scholar] [CrossRef] [Green Version]
- Pendem, S.R.; Mikkili, S. Modeling, simulation, and performance analysis of PV array configurations (Series, Series-Parallel, Bridge-Linked, and Honey-Comb) to harvest maximum power under various Partial Shading Conditions. Int. J. Green Energy 2018, 15, 795–812. [Google Scholar] [CrossRef]
- Bonthagorla, P.K.; Mikkili, S. Performance analysis of PV array configurations (SP, BL, HC and TT) to enhance maximum power under non-uniform shading conditions. Eng. Rep. 2020, 2, e12214. [Google Scholar] [CrossRef]
- Tey, K.S.; Mekhilef, S.; Member, S.; Seyedmahmoudian, M. Improved Differential Evolution-based MPPT Algorithm using SEPIC for PV Systems under Partial Shading Conditions and Load Variation. IEEE Trans. Ind. Inform. 2018, 14, 4322–4333. [Google Scholar] [CrossRef]
- Kabra, D.; Agarwal, V. A Review on: IoT based solar charge controller. Int. J. Mech. Eng. 2022, 7, 24–29. [Google Scholar]
- Joshi, A.S.; Dincer, I.; Reddy, B.V. Performance analysis of photovoltaic systems: A review. Renew. Sustain. Energy Rev. 2009, 13, 1884–1897. [Google Scholar] [CrossRef]
- Kamran, M.; Mudassar, M.; Fazal, M.R.; Asghar, M.U.; Bilal, M.; Asghar, R. Implementation of improved Perturb & Observe MPPT technique with confined search space for standalone photovoltaic system. J. King Saud Univ. Eng. Sci. 2020, 32, 432–441. [Google Scholar] [CrossRef]
- Shang, L.; Guo, H.; Zhu, W. An improved MPPT control strategy based on incremental conductance algorithm. Prot. Control Mod. Power Syst. 2020, 5, 14. [Google Scholar] [CrossRef]
- Ricco, M.; Hammami, M.; Mandrioli, R.; Grandi, G. Ripple Correlation Control MPPT Scheme Applied to a Three-Phase Flying Capacitor PV System. In ELECTRIMACS 2019; Springer: Cham, Switzerland, 2020; Volume 697, pp. 13–24. [Google Scholar]
- Chen, L.; Wang, X. Enhanced MPPT method based on ANN-assisted sequential Monte–Carlo and quickest change detection. IET Smart Grid 2019, 2, 635–644. [Google Scholar] [CrossRef]
- Cui, Y.; Yi, Z.; Duan, J.; Shi, D.; Wang, Z. A Rprop-Neural-Network-Based PV Maximum Power Point Tracking Algorithm with Short-Circuit Current Limitation. In Proceedings of the 2019 IEEE Power & Energy Society Innovative Smart Grid Technologies Conference (ISGT), Washington, DC, USA, 18–21 February 2019; p. 18902561. [Google Scholar]
- Abdulridha, H.M.; Shaker, M.; Jaafar, H.F. Tracking of Maximum Power Point for PV Solar System Based on Adaptive Quantum Neural Controller. Int. J. Intell. Eng. Syst. 2022, 15, 382–396. [Google Scholar] [CrossRef]
- Aly, M.; Rezk, H. An improved fuzzy logic control-based MPPT method to enhance the performance of PEM fuel cell system. Neural Comput. Appl. 2022, 34, 4555–4566. [Google Scholar] [CrossRef]
- Li, D.; Li, J.; Wang, N. A Novel Technique Based on Peafowl Optimization Algorithm for Maximum Power Point Tracking of PV Systems Under Partial Shading Condition. Front. Energy Res. 2021, 9, 801571. [Google Scholar] [CrossRef]
- Mo, S.; Ye, Q.; Jiang, K.; Mo, X.; Shen, G. An improved MPPT method for photovoltaic systems based on mayfly optimization algorithm. Energy Reports 2022, 8, 141–150. [Google Scholar] [CrossRef]
- Alanazi, A.; Alanazi, M.; Arabi, S.; Sarker, S. A New Maximum Power Point Tracking Framework for Photovoltaic Energy Systems Based on Remora Optimization Algorithm in Partial Shading Conditions. Appl. Sci. 2022, 12, 3828. [Google Scholar] [CrossRef]
- Eltamaly, A.M. An Improved Cuckoo Search Algorithm for Maximum Power Point Tracking of Photovoltaic Systems under Partial Shading Conditions. Energies 2021, 14, 953. [Google Scholar] [CrossRef]
- Tan, W.-H.; Mohamad-Saleh, J. Modified normative fish swarm algorithm for optimizing power extraction in photovoltaic systems. Evol. Intell. 2022, 1–20. [Google Scholar] [CrossRef]
- Subramaniana, A.; Ramanb, J. Modified Seagull Optimization Algorithm based MPPT for augmented performance of Photovoltaic solar energy systems. Automatika 2022, 63, 1–15. [Google Scholar] [CrossRef]
- Chao, K.-H.; Rizal, M.N. A Hybrid MPPT Controller Based on the Genetic Algorithm and Ant Colony Optimization for Photovoltaic Systems under Partially Shaded Conditions. Energies 2021, 14, 2902. [Google Scholar] [CrossRef]
- Dagal, I.; Akın, B.; Akboy, E. MPPT mechanism based on novel hybrid particle swarm optimization and salp swarm optimization algorithm for battery charging through simulink. Sci. Rep. 2022, 12, 2664. [Google Scholar] [CrossRef]
- Padmanaban, S.; Priyadarshi, N.; Bhaskar, M.S.; Holm-Nielsen, J.B.; Ramachandaramurthy, V.K.; Hossain, E. A Hybrid ANFIS-ABC Based MPPT Controller for PV System With Anti-Islanding Grid Protection: Experimental Realization. IEEE Access 2019, 7, 103377–103389. [Google Scholar] [CrossRef]
- Rahman, M.M.; Islam, M.S. PSO and ANN Based Hybrid MPPT Algorithm for Photovoltaic Array under Partial Shading Condition. Eng. Int. 2020, 8, 9–24. [Google Scholar] [CrossRef]
- Priyadarshi, N.; Padmanaban, S.; Holm-Nielsen, J.B.; Blaabjerg, F.; Bhaskar, M.S. An Experimental Estimation of Hybrid ANFIS–PSO-Based MPPT for PV Grid Integration Under Fluctuating Sun Irradiance. IEEE Syst. J. 2020, 14, 1218–1229. [Google Scholar] [CrossRef]
- Ali, M.N.; Mahmoud, K.; Lehtonen, M.; Darwish, M.M.F. Promising MPPT Methods Combining Metaheuristic, Fuzzy-Logic and ANN Techniques for Grid-Connected Photovoltaic. Sensors 2021, 21, 1244. [Google Scholar] [CrossRef] [PubMed]
- Farzaneh, J. A hybrid modified FA-ANFIS-P&O approach for MPPT in photovoltaic systems under PSCs. Int. J. Electron. 2020, 107, 703–718. [Google Scholar] [CrossRef]
- Panimalar, S.A. Nature Inspired Metaheuristic Algorithms. Int. Res. J. Eng. Technol. 2017, 4, 306–309. [Google Scholar]
- Abdollahzadeh, B.; Gharehchopogh, F.S.; Khodadadi, N.; Mirjalili, S. Mountain Gazelle Optimizer: A new Nature-inspired Metaheuristic Algorithm for Global Optimization Problems. Adv. Eng. Softw. 2022, 174, 103282. [Google Scholar] [CrossRef]
- Wang, L.; Cao, Q.; Zhang, Z.; Mirjalili, S.; Zhao, W. Artificial rabbits optimization: A new bio-inspired meta-heuristic algorithm for solving engineering optimization problems. Eng. Appl. Artif. Intell. 2022, 114, 105082. [Google Scholar] [CrossRef]
- Zhao, S.; Zhang, T.; Ma, S.; Chen, M. Dandelion Optimizer: A nature-inspired metaheuristic algorithm for engineering applications. Eng. Appl. Artif. Intell. 2022, 114, 105075. [Google Scholar] [CrossRef]
- Agushakaa, J.O.; Ezugwua, A.E.; Abualigah, L. Dwarf Mongoose Optimization Algorithm. Comput. Methods Appl. Mech. Eng. 2022, 391, 114570. [Google Scholar] [CrossRef]
- Trojovský, P.; Dehghani, M. Pelican Optimization Algorithm: A Novel Nature-Inspired Algorithm for Engineering Applications. Sensors 2022, 22, 855. [Google Scholar] [CrossRef] [PubMed]
- Peraza-Vázquez, H.; Peña-Delgado, A.F.; Echavarría-Castillo, G.; Morales-Cepeda, A.B.; Velasco-Álvarez, J.; Ruiz-Perez, F. A Bio-Inspired Method for Engineering Design Optimization Inspired by Dingoes Hunting Strategies. Math. Probl. Eng. 2021, 2021, 9107547. [Google Scholar] [CrossRef]
- Abdollahzadeh, B.; Gharehchopogh, F.S.; Mirjalili, S. African vultures optimization algorithm: A new nature-inspired metaheuristic algorithm for global optimization problems. Comput. Ind. Eng. 2021, 158, 107408. [Google Scholar] [CrossRef]
- Hayyolalam, V.; Kazem, A.A.P. Black Widow Optimization Algorithm: A novel meta-heuristic approach for solving engineering optimization problems. Eng. Appl. Artif. Intell. 2020, 87, 103249. [Google Scholar] [CrossRef]
- Zervoudakis, K.; Tsafarakis, S. A mayfly optimization algorithm. Comput. Ind. Eng. 2020, 145, 106559. [Google Scholar] [CrossRef]
- Harifi, S.; Khalilian, M.; Mohammadzadeh, J.; Ebrahimnejad, S. Emperor Penguins Colony: A new metaheuristic algorithm for optimization. Evol. Intell. 2019, 12, 211–226. [Google Scholar] [CrossRef]
- Heidari, A.A.; Mirjalili, S.; Faris, H.; Aljarah, I.; Mafarja, M.; Chen, H. Harris hawks optimization: Algorithm and applications. Futur. Gener. Comput. Syst. 2019, 97, 849–872. [Google Scholar] [CrossRef]
- Kaveh, A.; Kooshkebaghi, M. Artificial coronary circulation system: A new bio-inspired metaheuristic algorithm. Sci. Iran. Int. J. Sci. Technol. 2019, 26, 2731–2747. [Google Scholar] [CrossRef] [Green Version]
- Mahmood, M.; Al-Khateeb, B. The blue monkey: A new nature inspired metaheuristic optimization algorithm. Period. Eng. Nat. Sci. 2019, 7, 1054–1066. [Google Scholar] [CrossRef] [Green Version]
- Gomes, G.F.; Cunha, S.S.; Ancelotti, A. A sunflower optimization (SFO) algorithm applied to damage identification on laminated composite plates. Eng. Comput. 2019, 35, 619–626. [Google Scholar] [CrossRef]
- Mhawesh, M.A.; Neda, O.M. A Review of the Photovoltaic System Converters and Algorithms. J. Glob. Sci. Res. 2021, 6, 1297–1308. [Google Scholar]
- Baharudin, N.H.; Mansur, T.M.N.T.; Hamid, F.A.; Ali, R.; Irwanto, M. Topologies of DC-DC Converter in Solar PV Applications. Indones. J. Electr. Eng. Comput. Sci. 2017, 8, 368–374. [Google Scholar] [CrossRef]
- Sutikno, T.; Purnama, H.S.; Widodo, N.S.; Padmanaban, S.; Sahid, M.R. A review on non-isolated low-power DC–DC converter topologies with high output gain for solar photovoltaic system applications. Clean Energy 2022, 6, 557–572. [Google Scholar] [CrossRef]
- Sri-Revathi, B.; Prabhakar, M. Non isolated high gain DC-DC converter topologies for PV applications—A comprehensive review. Renew. Sustain. Energy Rev. 2016, 66, 920–933. [Google Scholar] [CrossRef]
- Radhika, S.; Margaret, V. A Review on DC-DC Converters with Photovoltaic System in DC Micro Grid. J. Phys. Conf. Ser. 2021, 1804, 012155. [Google Scholar] [CrossRef]
- Kiran, S.U.; Kumar, P.M.; Kumar, Y.V.P. Comprehensive Analysis on Critical Factors for the Operation of Advanced High Gain DC-DC Converters Used in Renewable Energy Applications. Int. J. Renew. Energy Res. 2021, 11, 1448–1459. [Google Scholar]
- Sarangi, S.; Verma, H.K. Step up DC-DC converters for PV applications: A Review. J. Controll. Convert. 2018, 3, 1–7. [Google Scholar]
- Erdiwansyah; Mahidin; Husin, H.; Nasaruddin; Zaki, M.; Muhibbuddin. A critical review of the integration of renewable energy sources with various technologies. Prot. Control Mod. Power Syst. 2021, 6, 3. [Google Scholar] [CrossRef]
- Sivakumar, S.; Sathik, M.J.; Manoj, P.S.; Sundararajan, G. An assessment on performance of DC–DC converters for renewable energy applications. Renew. Sustain. Energy Rev. 2016, 58, 1475–1485. [Google Scholar] [CrossRef]
- Babaa, S.E.; El Murr, G.; Mohamed, F.; Pamuri, S. Overview of Boost Converters for Photovoltaic Systems. J. Power Energy Eng. 2018, 6, 16–31. [Google Scholar] [CrossRef] [Green Version]
- Fulmali, V.; Gupta, S.; Khan, M.F. Modeling and simulation of boost converter for solar-PV energy system to enhance its output. In Proceedings of the 2015 International Conference on Computer, Communication and Control (IC4), Indore, India, 10–12 September 2015; p. 15700301. [Google Scholar]
- Srikanth, M.; Upadhyay, P.; Kalyani, S.T. Design and Development of Buck/Boost Converter for Maintaining the Constant DC Supply to Meet the Load Requirement. Int. J. Eng. Technol. 2018, 7, 215–220. [Google Scholar] [CrossRef]
- Supraptono, E.; Abiyasa, B.P.; Putri, R.D.M.; Andrasto, T. The effect of the performance of using a boost converter on the voltage of the solar panel. IOP Conf. Ser. Earth Environ. Sci. 2022, 969, 012028. [Google Scholar] [CrossRef]
- Pauldoss, S.P.; Sekar, K.; Pattanaik, B.; Nayagam, V.S. PV system with high voltage gain based DC-DC boost converter for grid applications. AIP Conf. Proc. 2022, 2519, 050007. [Google Scholar] [CrossRef]
- Chandramouli, A.; Sivachiadambaranathan, V. Design and Analysis of a Photovoltaic System with a DC-DC Boost Converter. In Proceedings of the 2019 3rd International Conference on Computing Methodologies and Communication (ICCMC, Erode, India, 27–29 March 2019; p. 18958390. [Google Scholar]
- Mohamed, H.A.; Khattab, H.A.; Mobarka, A.; Morsy, G.A. Design, control and performance analysis of DC-DC boost converter for stand-alone PV system. In Proceedings of the 2016 Eighteenth International Middle East Power Systems Conference (MEPCON, Cairo, Egypt, 27–29 December 2016; p. 16640325. [Google Scholar]
- Omar, M.A.; Mahmoud, M.M. Design and Simulation of DC/DC Boost Converter with Maximum Power Point Tracking for Grid Connected PV Inverter Considering the Nonlinearity of the PV Generator. Int. J. Energy Convers. 2019, 7, 241–252. [Google Scholar] [CrossRef]
- Raj, A.; Praveen, R.P. Highly efficient DC-DC boost converter implemented with improved MPPT algorithm for utility level photovoltaic applications. Ain Shams Eng. J. 2022, 13, 101617. [Google Scholar] [CrossRef]
- Hashim, N.; Salam, Z.; Johari, D.; Ismail, N.F.N. DC-DC Boost Converter Design for Fast and Accurate MPPT Algorithms in Stand-Alone Photovoltaic System. Int. J. Power Electron. Drive Syst. 2018, 9, 1038–1050. [Google Scholar] [CrossRef]
- Saravanan, S.; Babu, N.R. A modified high step-up non-isolated DC-DC converter for PV application. J. Appl. Res. Technol. 2017, 15, 242–249. [Google Scholar] [CrossRef] [Green Version]
- Veerabhadra; Rao, S.N. Assessment of high-gain quadratic boost converter with hybrid-based maximum power point tracking technique for solar photovoltaic systems. Clean Energy 2022, 6, 632–645. [Google Scholar] [CrossRef]
- Esfahani, F.N.; Darwish, A.; Williams, B.W. Power Converter Topologies for Grid-Tied Solar Photovoltaic (PV) Powered Electric Vehicles (EVs)—A Comprehensive Review. Energies 2022, 15, 4648. [Google Scholar] [CrossRef]
- Supriya, J.; Rajashekar, J.S. A Comprehensive Review of Various Isolated DC-DC Converters Topologies Associated with Photovoltaic Applications. Recent Adv. Electr. Electron. Eng. (Former. Recent Pat. Electr. Electron. Eng.) 2022, 15, 595–606. [Google Scholar] [CrossRef]
- Reshma-Gopi, R.; Sreejith, S. Converter topologies in photovoltaic applications—A review. Renew. Sustain. Energy Rev. 2018, 94, 1–14. [Google Scholar] [CrossRef]
- Salehi, N.; Martínez-García, H.; Velasco-Quesada, G. Modified Cascaded Z-Source High Step-Up Boost Converter. Electronics 2020, 9, 1932. [Google Scholar] [CrossRef]
- Dahono, P.A. Simplified cascade multiphase DC-DC boost power converters for high voltage-gain and low-ripple applications. Int. J. Power Electron. Drive Syst. 2021, 12, 273–285. [Google Scholar] [CrossRef]
- Krishnaveni, S.; Rajini, V.; Krishnaveni, S.; Rajini, V. Cascaded boost converter-based high-voltage pulse generator for pulsed electric field applications. Arch. Electr. Eng. 2021, 70, 631–641. [Google Scholar] [CrossRef]
- Pal, N.; Fish, A.; McIntyre, W.; Griesert, N.; Winter, G.; Eichhorn, T.; Pilawa-Podgurski, R.; Hanumolu, P.K. A 91.15% Efficient 2.3–5-V Input 10–35-V Output Hybrid Boost Converter for LED-Driver Applications. IEEE J. Solid-State Circuits 2021, 56, 3499–3510. [Google Scholar] [CrossRef]
- Kumari, R.; Pyakurel, P.; Rai, B.; Pandit, M.; Sherpa, K.S.; Bhattacharya, D. Design of Smart Autonomous Solar Panel with Cascaded Sepic-Boost Converter for High Voltage Renewable Applications. 2022, pp. 1–18. Available online: https://www.researchsquare.com/article/rs-1880316/v1 (accessed on 18 December 2022).
- Zhang, H.; Park, S.-J. Efficiency Optimization Method for Cascaded Two-Stage Boost Converter. IEEE Access 2022, 10, 53443–53453. [Google Scholar] [CrossRef]
- Alghaythi, M.L.; O’Connell, R.M.; Islam, N.E.; Khan, M.M.S.; Guerrero, J.M. A High Step-Up Interleaved DC-DC Converter With Voltage Multiplier and Coupled Inductors for Renewable Energy Systems. IEEE Access 2020, 8, 2169–3536. [Google Scholar] [CrossRef]
- Yaseen, M.; Farooq, A.; Malik, M.Z.; Usman, M.; Hafeez, G.; Ali, M. Design of a High Step-Up DC-DC Converter with Voltage Doubler and Tripler Circuits for Photovoltaic Systems. Int. J. Photoenergy 2021, 2021, 8993598. [Google Scholar] [CrossRef]
- Rahimi, T.; Ding, L.; Gholizadeh, H.; Shahrivar, R.S.; Faraji, R. An Ultra High Step-Up DC–DC Converter Based on the Boost, Luo, and Voltage Doubler Structure: Mathematical Expression, Simulation, and Experimental. IEEE Access 2021, 9, 132011–132024. [Google Scholar] [CrossRef]
- Jarin, T.; Akkara, S.; Mole, S.S.S.; Manivannan, A.; Immanuel-Selvakumar, A. Fuel vehicle improvement using high voltage gain in DC-DC boost converter. Renew. Energy Focus 2022, 43, 228–238. [Google Scholar] [CrossRef]
- Alkhaldi, A.; Akbar, F.; Elkhateb, A.; Laverty, D. N-stage quadratic boost converter based on voltage lift technique and voltage multiplier. In Proceedings of the 11th International Conference on Power Electronics, Machines and Drives (PEMD 2022), IET, Hybrid Conference, Newcastle, UK, 21–23 June 2022. [Google Scholar]
- Mohseni, P.; Mohammadsalehian, S.; Islam, M.R.; Muttaqi, K.M.; Sutanto, D.; Alavi, P. Ultrahigh Voltage Gain DC–DC Boost Converter With ZVS Switching Realization and Coupled Inductor Extendable Voltage Multiplier Cell Techniques. IEEE Trans. Ind. Electron. 2022, 69, 323–335. [Google Scholar] [CrossRef]
- Rashmi, R.; Kumar, T.S. DC Booster with Voltage Multiplier for Renewable Energy Sources. J. Res. Appl. Sci. Eng. Technol. 2022, 10, 2460–2466. [Google Scholar] [CrossRef]
- Rosas, I.P.; Agostini, E.; Nascimento, C.B. Single-Switch High-Step-Up DC-DC Converter Employing Coupled Inductor and Voltage Multiplier Cell. IEEE Access 2022, 10, 82626–82635. [Google Scholar] [CrossRef]
- Photong, C.; Piansangsan, L. High Efficiency High Voltage Gain Boost Converter using Zero Crossing Switching Multi-stage Voltage-Lift Cells. Prz. Elektrotechniczny 2020, 1, 71–75. [Google Scholar] [CrossRef]
- Khan, S.; Mahmood, A.; Zaid, M.; Tariq, M.; Lin, C.-H.; Ahmad, J.; Alamri, B.; Alahmadi, A. A High Step-up DC-DC Converter Based on the Voltage Lift Technique for Renewable Energy Applications. Sustainability 2021, 13, 11059. [Google Scholar] [CrossRef]
- Jana, A.S.; Lin, C.-H.; Kao, T.-H.; Chang, C.-H. A High Gain Modified Quadratic Boost DC-DC Converter with Voltage Stress Half of Output Voltage. Appl. Sci. 2022, 12, 4914. [Google Scholar] [CrossRef]
- Khan, S.; Zaid, M.; Siddique, M.D.; Iqbal, A. Ultra high gain step up DC/DC converter based on switched inductor and improved voltage lift technique for high-voltage applications. IET Power Electron. 2022, 15, 1–21. [Google Scholar] [CrossRef]
- Fares, O.S.; Hussen, J.F. High gain multiphase boost converter based-on capacitor clamping structure. Indones. J. Electr. Eng. Comput. Sci. 2021, 24, 689–696. [Google Scholar] [CrossRef]
- Alsolami, M. A multi-input, multi-stage step-up DC-DC converter for PV applications. Alexandria Eng. J. 2021, 60, 2315–2324. [Google Scholar] [CrossRef]
- Saravanakumar, T.; Kumar, R.S. Design, Validation, and Economic Behavior of a Three-Phase Interleaved Step-Up DC–DC Converter for Electric Vehicle Application. Front. Energy Res. 2022, 10, 813081. [Google Scholar] [CrossRef]
- Sampath, S.; Rahiman, Z.; Chenniappan, S.; Sundaram, E.; Subramaniam, U.; Padmanaban, S. Efficient Multi-Phase Converter for E-Mobility. World Electr. Veh. J. 2022, 13, 67. [Google Scholar] [CrossRef]
- Billy, I.J.; Hussein, J.F. Non-isolated high voltage gain DC to DC converter based on the diode a capacitor switches. Indones. J. Electr. Eng. Comput. Sci. 2022, 28, 67–75. [Google Scholar] [CrossRef]
- Hu, D.; Yin, A.; Ghaderi, D. A transformer-less single-switch boost converter with high-voltage gain and mitigated-voltage stress applicable for photovoltaic utilizations. Int. Trans. Electr. Energy Syst. 2020, 30, e12569. [Google Scholar] [CrossRef]
- Abdel-Rahim, O.; Abdelhameed, E.H. Ultimate Transformerless Boost DC-DC Converter for Renewable Energy Applications. SVU-Int. J. Eng. Sci. Appl. 2021, 2, 63–69. [Google Scholar] [CrossRef]
- Sadaf, S.; Bhaskar, M.S.; Meraj, M.; Iqbal, A.; Al-Emadi, N. Transformer-Less Boost Converter With Reduced Voltage Stress for High Voltage Step-Up Applications. IEEE Trans. Ind. Electron. 2021, 69, 1498–1508. [Google Scholar] [CrossRef]
- Babaei, E.; Maheri, H.M.; Sabahi, M. A transformer-less DC–DC converter with high voltage conversion ratio adopting inverting voltage lift cell. IET Circuits Devices Syst. 2021, 16, 257–271. [Google Scholar] [CrossRef]
- Zhao, J.; Chen, D.; Jiang, J. Transformerless High Step-Up DC-DC Converter with Low Voltage Stress for Fuel Cells. IEEE Access 2021, 9, 10228–10238. [Google Scholar] [CrossRef]
- Saravanan, S.; Rani, P.U.; Thakre, M.P. Evaluation and Improvement of a Transformerless High-Efficiency DC–DC Converter for Renewable Energy Applications Employing a Fuzzy Logic Controller. MAPAN—J. Metrol. Soc. India 2022, 37, 291–310. [Google Scholar] [CrossRef]
- Ahmed, H.Y.; Abdel-Rahim, O.; Ali, Z.M. New High-Gain Transformerless DC/DC Boost Converter System. Electronics 2022, 11, 734. [Google Scholar] [CrossRef]
- Revathi, B.S.; Mahalingam, P. Non-isolated high gain DC–DC converter with low device stress and input current ripple. IET Power Electron. 2018, 11, 2553–2562. [Google Scholar] [CrossRef]
- Zhang, N.; Sutanto, D.; Muttaqi, K.M. A review of topologies of three-port DC–DC converters for the integration of renewable energy and energy storage system. Renew. Sustain. Energy Rev. 2016, 56, 388–401. [Google Scholar] [CrossRef]


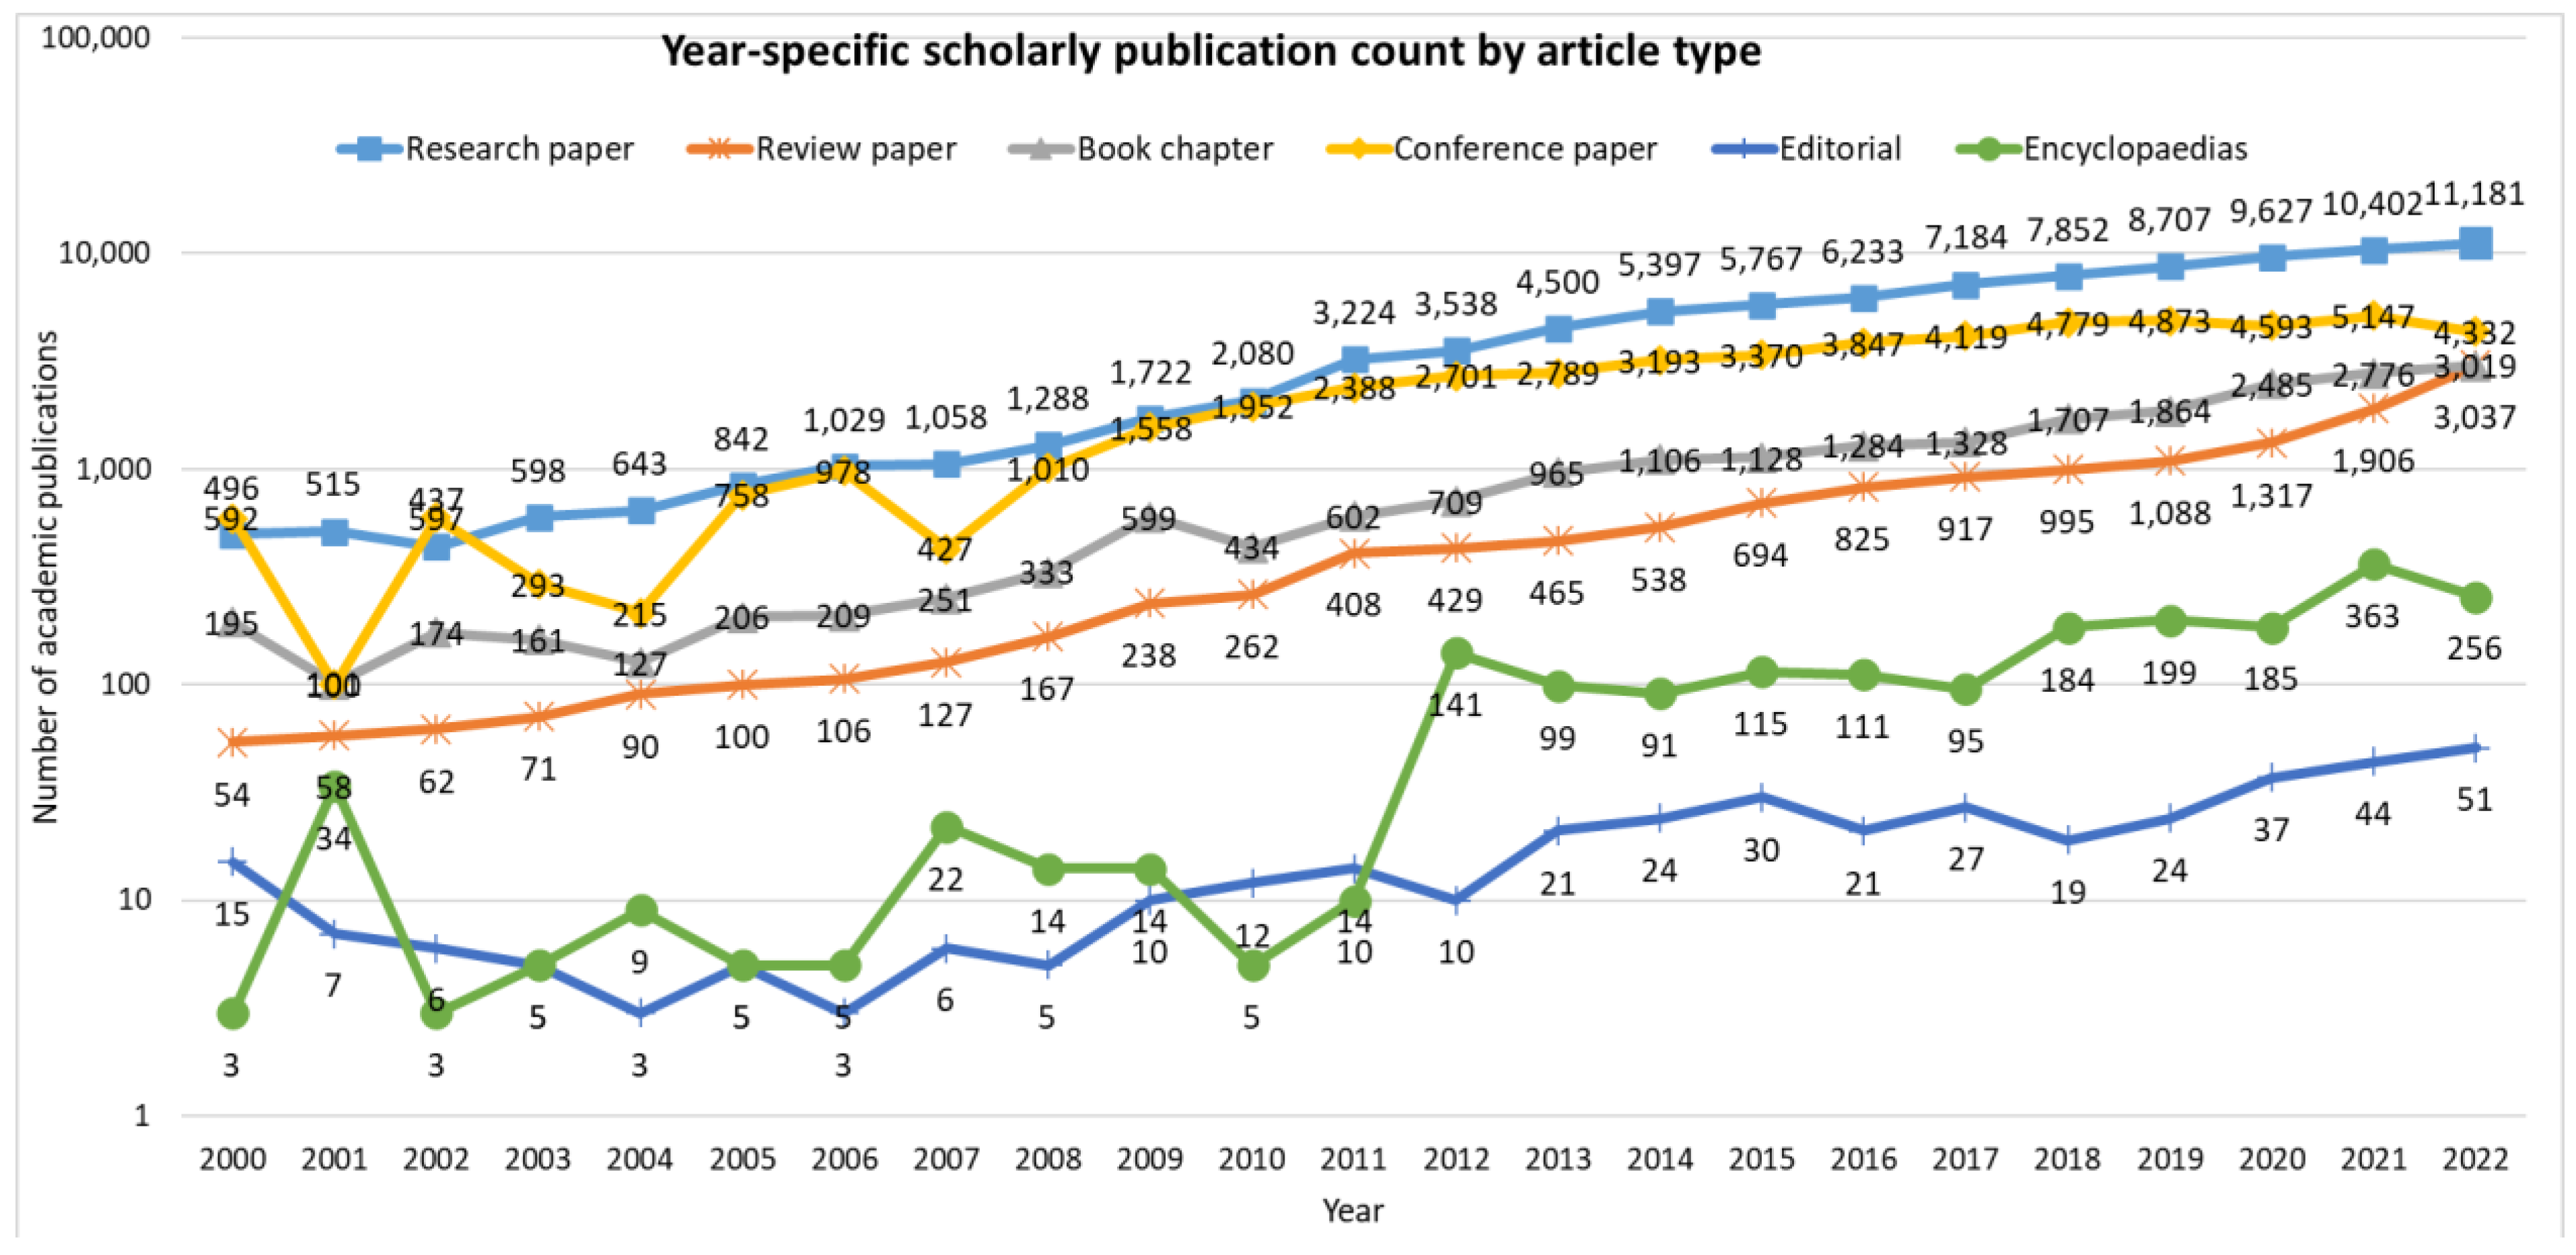
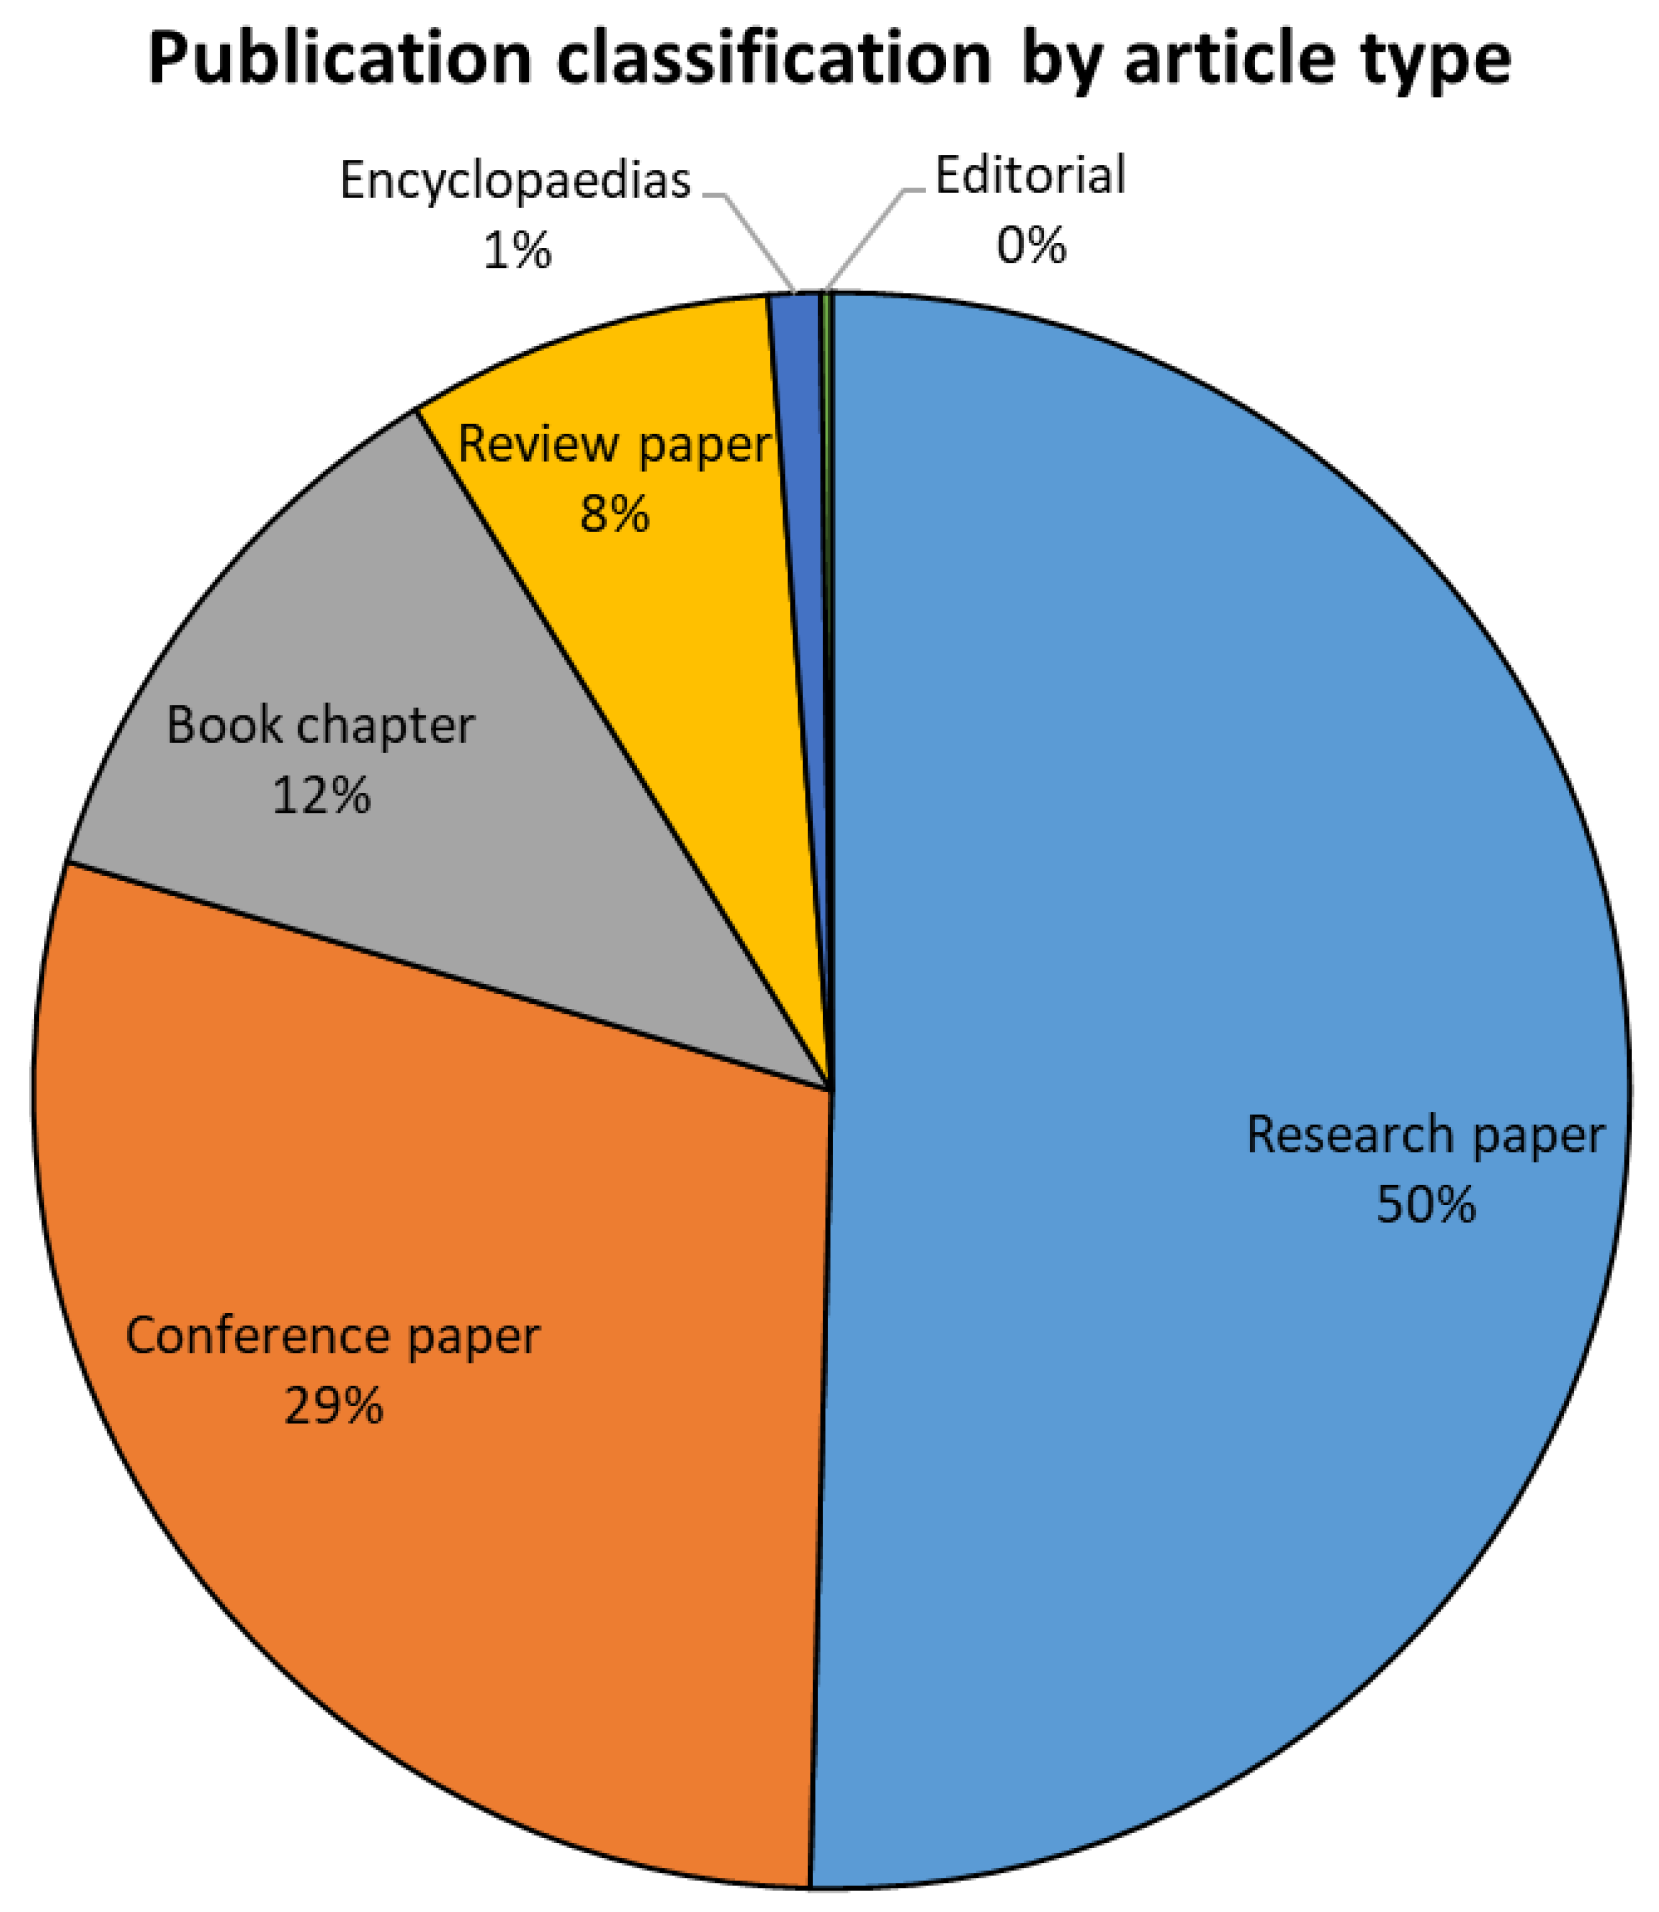
| Publication Count by Article Type | ||||||||||||||||||||||||
|---|---|---|---|---|---|---|---|---|---|---|---|---|---|---|---|---|---|---|---|---|---|---|---|---|
| Article Type | 2000 | 2001 | 2002 | 2003 | 2004 | 2005 | 2006 | 2007 | 2008 | 2009 | 2010 | 2011 | 2012 | 2013 | 2014 | 2015 | 2016 | 2017 | 2018 | 2019 | 2020 | 2021 | 2022 | Cumulative |
| Research paper | 496 | 515 | 437 | 598 | 643 | 842 | 1029 | 1058 | 1288 | 1722 | 2080 | 3224 | 3538 | 4500 | 5397 | 5767 | 6233 | 7184 | 7852 | 8707 | 9627 | 10,402 | 11,181 | 94,320 |
| Conference paper | 592 | 100 | 597 | 293 | 215 | 758 | 978 | 427 | 1010 | 1558 | 1952 | 2388 | 2701 | 2789 | 3193 | 3370 | 3847 | 4119 | 4779 | 4873 | 4593 | 5147 | 4332 | 54,611 |
| Book chapter | 195 | 101 | 174 | 161 | 127 | 206 | 209 | 251 | 333 | 599 | 434 | 602 | 709 | 965 | 1106 | 1128 | 1284 | 1328 | 1707 | 1864 | 2485 | 2776 | 3019 | 21,763 |
| Review paper | 54 | 58 | 62 | 71 | 90 | 100 | 106 | 127 | 167 | 238 | 262 | 408 | 429 | 465 | 538 | 694 | 825 | 917 | 995 | 1088 | 1317 | 1906 | 3037 | 13,954 |
| Encyclopaedias | 3 | 34 | 3 | 5 | 9 | 5 | 5 | 22 | 14 | 14 | 5 | 10 | 141 | 99 | 91 | 115 | 111 | 95 | 184 | 199 | 185 | 363 | 256 | 1968 |
| Editorial | 15 | 7 | 6 | 5 | 3 | 5 | 3 | 6 | 5 | 10 | 12 | 14 | 10 | 21 | 24 | 30 | 21 | 27 | 19 | 24 | 37 | 44 | 51 | 399 |
| Total | 1355 | 815 | 1279 | 1133 | 1087 | 1916 | 2330 | 1891 | 2817 | 4141 | 4745 | 6646 | 7528 | 8839 | 10,349 | 11,104 | 12,321 | 13,670 | 15,536 | 16,755 | 18,244 | 20,638 | 21,876 | 187,015 |
| Publisher | Scholarly Publication Count | ||||||
|---|---|---|---|---|---|---|---|
| Article Type | Cumulative | ||||||
| Research Paper | Review Paper | Book Chapter | Conference Paper | Editorial | Encyclopaedias | ||
| Springer | 22,769 | 9890 | 19,465 | 6866 | 0 | 1720 | 60,710 |
| IEEE | 8124 | 202 | 74 | 43,463 | 250 | 4 | 52,117 |
| Elsevier | 34,724 | 2547 | 1229 | 172 | 55 | 182 | 38,909 |
| MDPI | 6050 | 609 | 9 | 87 | 34 | 7 | 6796 |
| ACS Publications | 6474 | 102 | 19 | 132 | 0 | 0 | 6727 |
| Wiley | 5834 | 78 | 710 | 42 | 0 | 46 | 6710 |
| AIP Publishing | 3257 | 127 | 33 | 1316 | 47 | 7 | 4787 |
| IOP Publishing | 1702 | 123 | 1 | 1825 | 0 | 0 | 3651 |
| Taylor & Francis | 2214 | 78 | 0 | 0 | 1 | 0 | 2293 |
| IET | 984 | 19 | 82 | 608 | 0 | 0 | 1693 |
| Hindawi | 1304 | 65 | 0 | 6 | 12 | 0 | 1387 |
| Inderscience | 486 | 28 | 0 | 0 | 0 | 0 | 514 |
| SAGE | 351 | 20 | 1 | 94 | 0 | 0 | 466 |
| MIT Press | 47 | 66 | 140 | 0 | 0 | 2 | 255 |
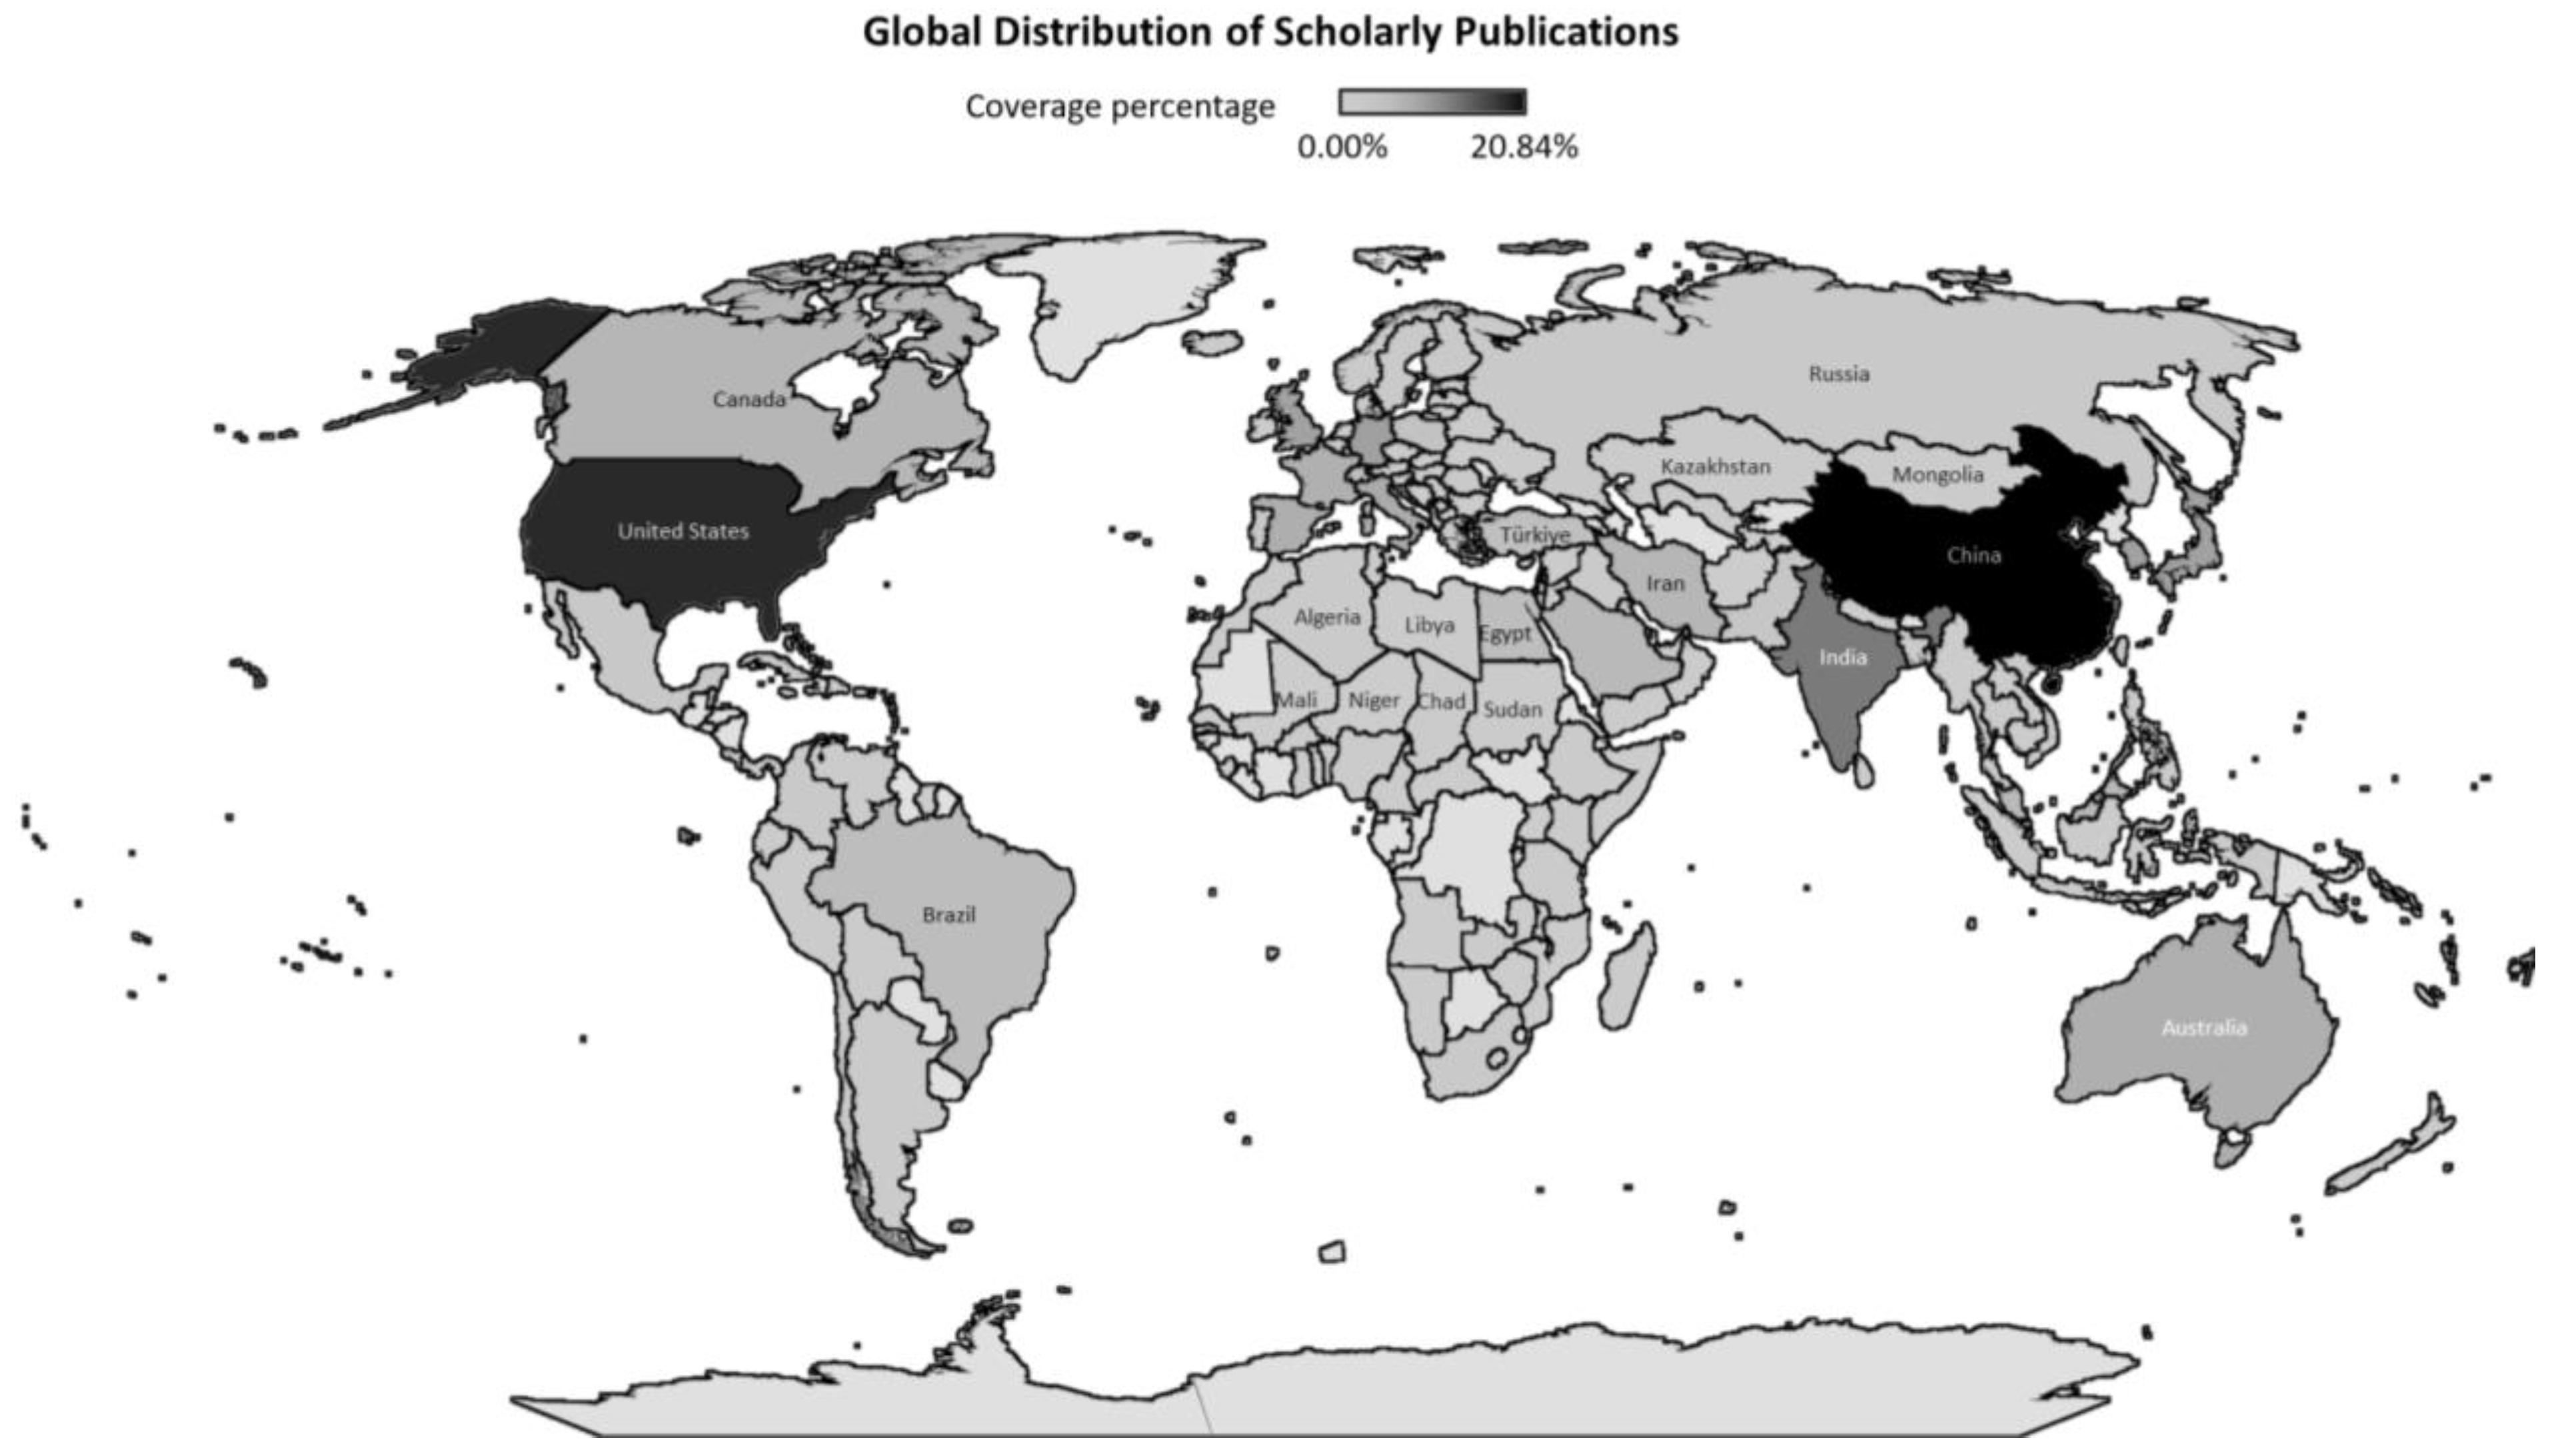
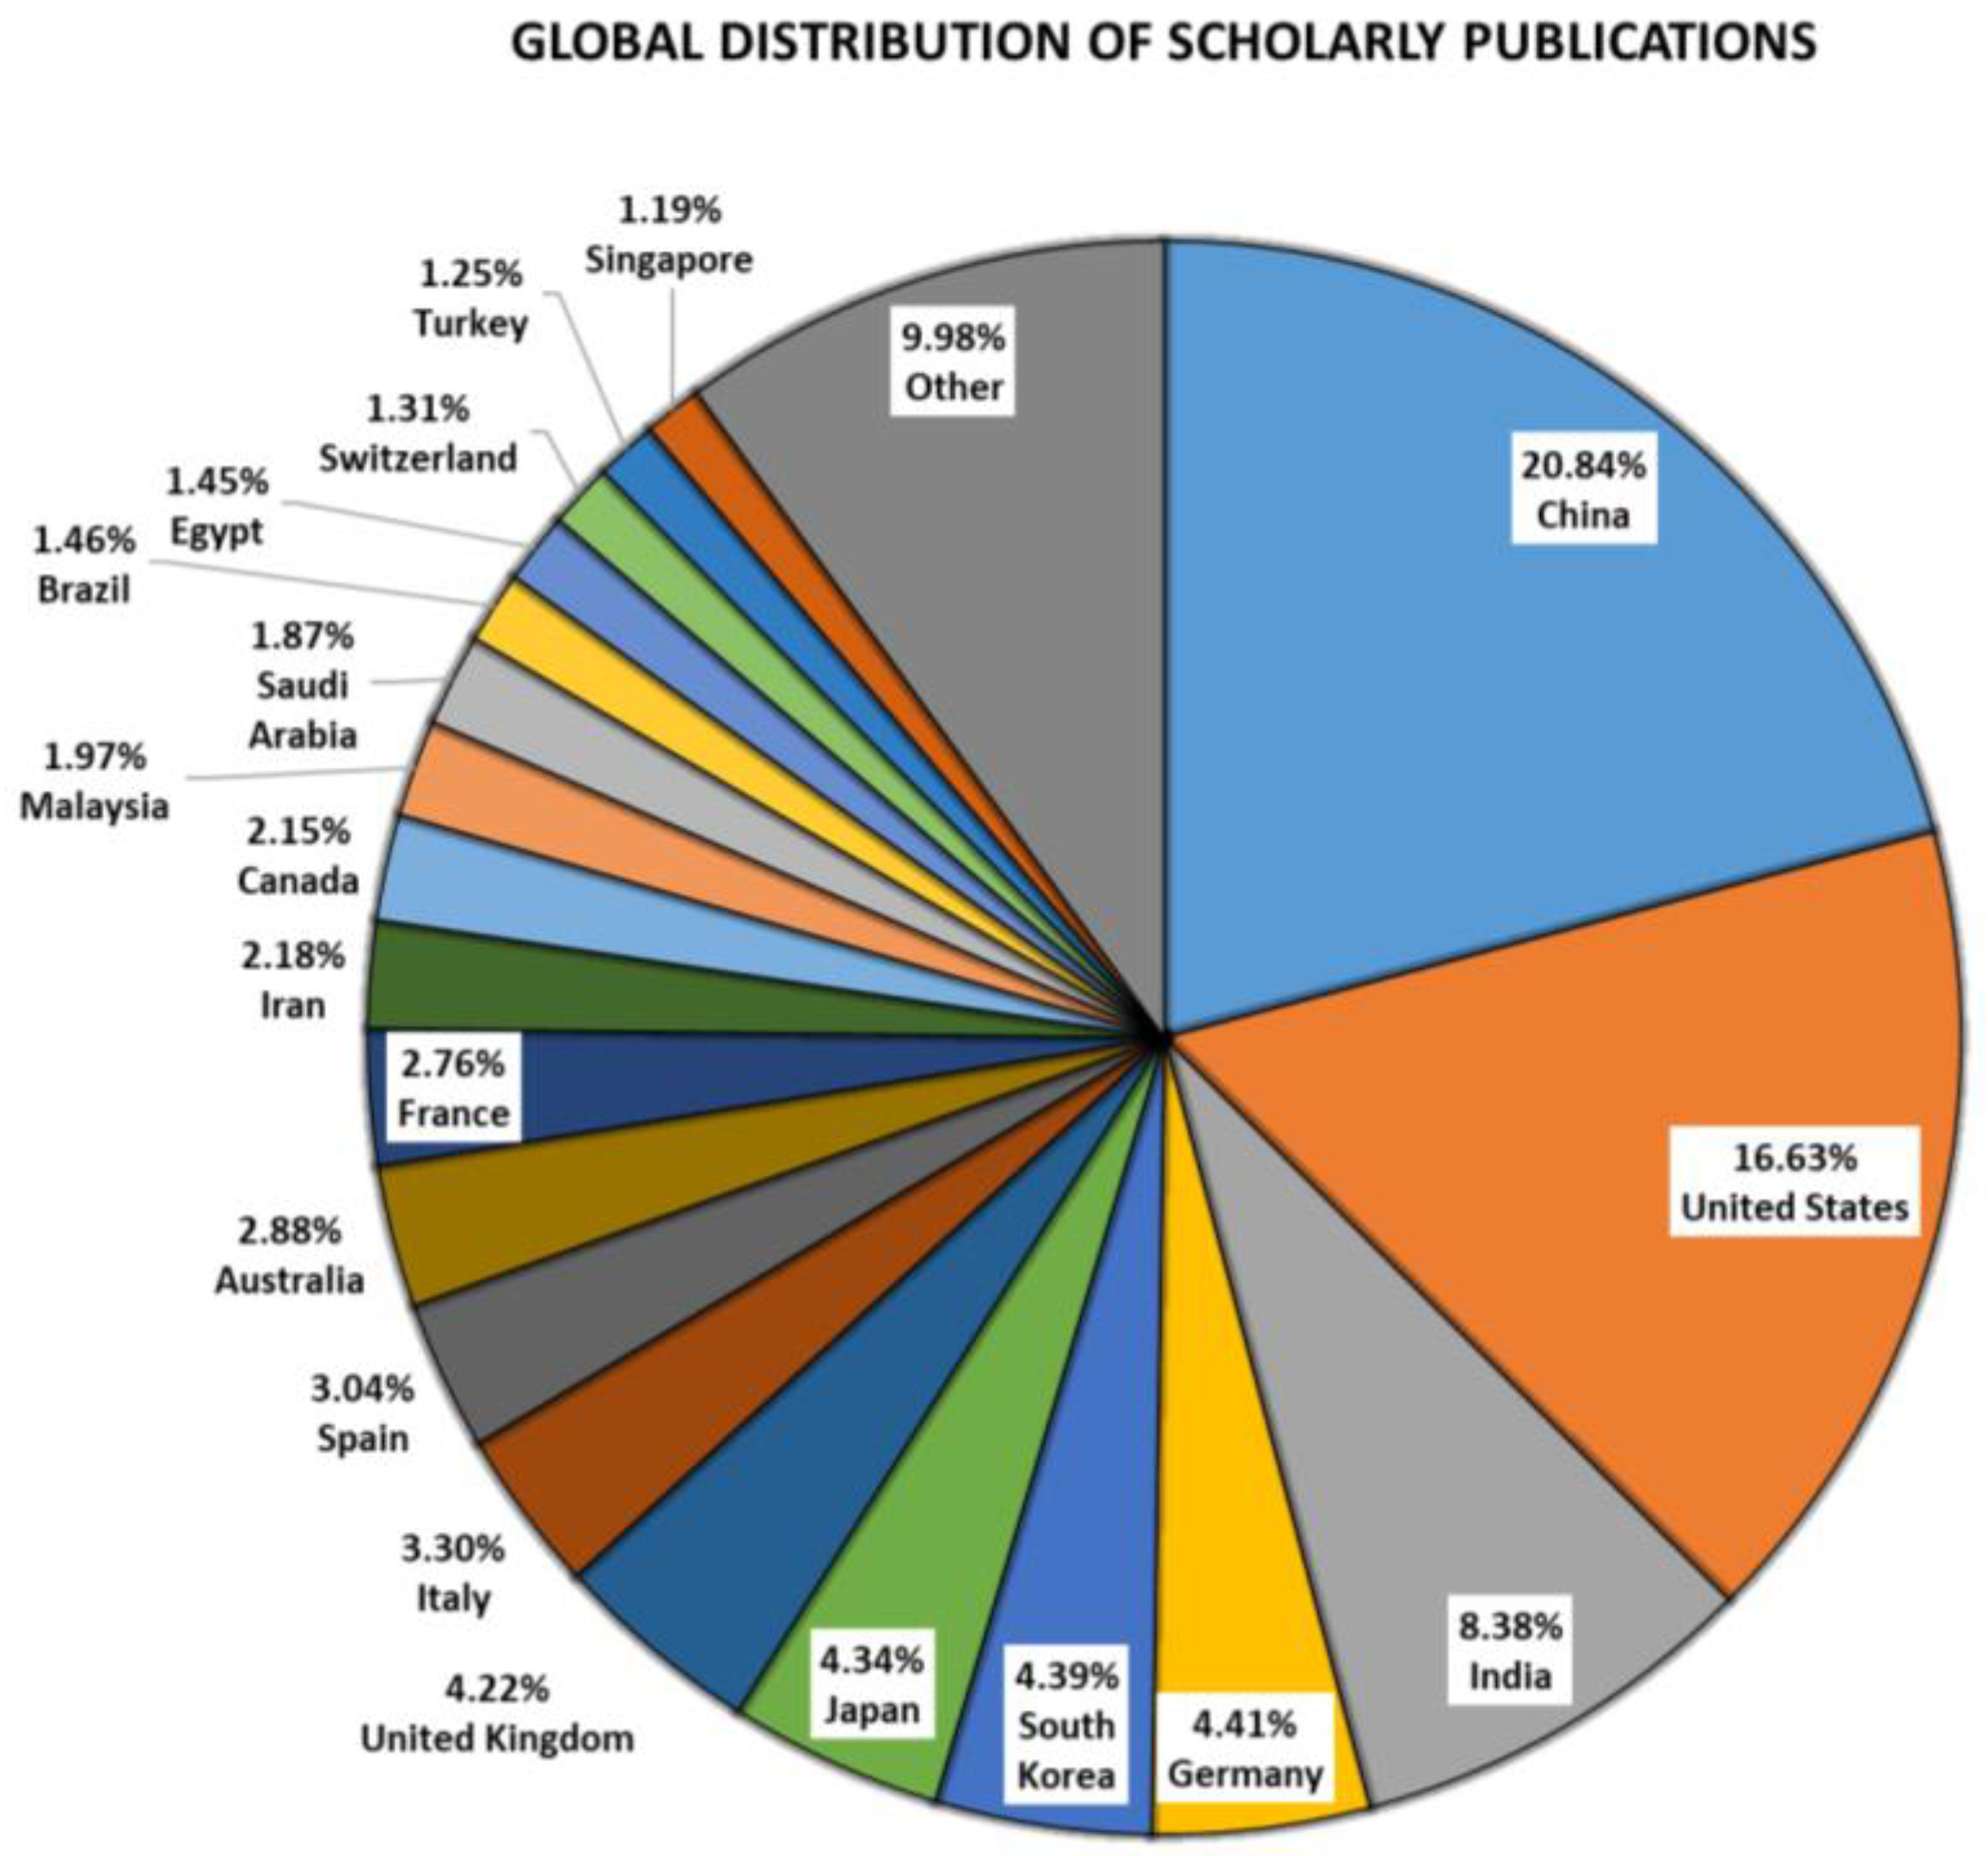
| Country | Distribution Percentage of Scholarly Publications |
|---|---|
| China | 20.84% |
| United States | 16.63% |
| India | 8.38% |
| Germany | 4.41% |
| South Korea | 4.39% |
| Japan | 4.34% |
| United Kingdom | 4.22% |
| Italy | 3.30% |
| Spain | 3.04% |
| Australia | 2.88% |
| France | 2.76% |
| Iran | 2.18% |
| Canada | 2.15% |
| Malaysia | 1.97% |
| Saudi Arabia | 1.87% |
| Brazil | 1.46% |
| Egypt | 1.45% |
| Switzerland | 1.31% |
| Turkey | 1.25% |
| Singapore | 1.19% |
| Other | 9.98% |
| Material(s)-Based | Maximum Conversion Efficiency by the End of 2022 (%) | Estimated Lifespan (Years) | Manufacturing Cost | Environmental Indices | |
| GHG (gCO2/kWh) | CED (MJ/m2) | ||||
| First-generation: crystalline silicon | |||||
| Mono-crystalline silicon | 27.6% [55] | 25–40 | $0.34–0.54/W [56] | 60.1–87.3 [57] | 4200 [58] |
| Mono-crystalline silicon (concentrator) | 26.1% [55] | 25–50 | $0.30/W [59] | 62–109 [60] | 380–8700 [57] |
| Poly-crystalline silicon | 23.3% [55] | 14–35 | $1–2/W [61] | 12.3–58.8 [57] | 2544–3482 [62] |
| Heterostructure silicon | 26.7% [55] | 25–30 | $0.48–0.56/W [63] | 47.5 [57] | 3500 [64] |
| Second-generation: thin-film | |||||
| Copper indium gallium selenide (CIGS) | 23.4% [55] | 12–25 | $41–52/m2 [56] | 27 [65] | 3005 [66] |
| CIGS (concentrator) | 23.3% [55] | 12–25 | $0.59/W [67] | NA | NA |
| Cadmium telluride (CdTe) | 22.1% [55] | 25–30 | $0.46/W [68] | 14 [69] | 81 |
| Amorphous silicon (a-Si) | 14.0% [55] | 15–25 | $0.73/W [70] | 20 [65] | 989 [71] |
| Thin-film silicon | 21.2% [55] | 10–20 | $0.20/W [72] | 36.9 [71] | NA |
| Mono-crystalline gallium arsenide (GaAs) | 27.8% [55] | 15–20 | $0.40/W [73] | NA | NA |
| GaAs (concentrator) | 30.8% [55] | 20–25 | NA | NA | NA |
| Thin-film GaAs | 29.1% [55] | 10–15 | $0.50/W [74] | NA | NA |
| Third-generation: emerging photovoltaic | |||||
| Organic solar cells | 18.2% [55] | 10–20 | $48.80–138.90/m2 [75] | 37.8–56.7 [57] | 96.7–125.0 [76] |
| Organic tandem solar cells | 14.2% [55] | 5–20 | NA | 5700–6000 [57] | 43.9–51.3 [77] |
| Quantum dot solar cells | 18.1% [55] | 10–25 | $0.15–0.84/W [78] | 5 [57] | 1029.6 [57] |
| Perovskite solar cells | 25.7% [55] | 20–30 | $0.25–0.69/W [56] | 147 [79] | 504 [79] |
| Perovskite/Si tandem solar cells | 31.3% [55] | 15–29 | $121.18/m2 [80] | 46.4 [64] | NA |
| Perovskite/CIGS tandem solar cells | 24.2% [55] | 15–25 | $56.05/m2 [81] | NA | NA |
| Dye-sensitized solar cells (DSSC) | 13.0% [55] | 5–7 | $22.40/m2 [82] | 22.4 [79] | 277–365 [83] |
| Multi-junction solar cells | 47.1% [55] | 20–24 | $8.24/W [84] | 40 [85] | 860 [57] |
| Multi-junction solar cells (concentrator) | 30.5% [55] | 25–30 | $0.59/W [86] | NA | NA |
| Fourth-generation: nano photovoltaic | |||||
| Graphene–silicon | 18.8% [87] | 0–1 | TBD | TBD | TBD |
| Graphene–quantum dot | 13.7% [88] | ||||
| Graphene–perovskite | 16.1% [89] | ||||
| Graphene/perovskite–quantum dot | 17.9% [90] | ||||
| Graphene/quantum dot–perovskite | 19.8% [91] | ||||
| Graphene–DSSC | 11.5% [92] | ||||
| Carbon nanotubes–silicon | 20.1% [93] | ||||
| Carbon nanotubes–quantum dot | 6.00% [94] | ||||
| Carbon nanotubes–perovskite | 37.4% [95] | ||||
| Carbon nanotubes–DSSC | 10.3% [96] | ||||
| Graphene/carbon nanotubes–silicon | 17.5% [97] | ||||
| Carbon nanotubes/graphene–quantum dot | 8.28% [98] | ||||
| Carbon nanotubes/silicon/graphene–quantum dot | 14.9% [99] | ||||
| Graphene/carbon nanotubes–perovskite | 19.6% [100] | ||||
| Carbon nanotubes/graphene–DSSC | 8.34% [101] | ||||
| Solar Generation | Pros | Cons |
|---|---|---|
| First-generation: crystalline silicon | (1) Abundant mineral deposits in the Earth’s crust ensure material availability (2) Non-toxic determination of pollution and durable retention (3) High compatibility | (1) Can be a bit expensive for large scale operations (2) Since silicon is an indirect bandgap semiconductor, it interacts weakly with light (3) Less tolerance for surface fouling as it causes significant power loss |
| Second-generation: thin-film | (1) Cheaper because less material is used to form micron-thick layers (2) Possess maximum absorption coefficient (3) Less production steps through direct integration into high-voltage modules | (1) Lower energy conversion efficiency (2) Rapid degradation to ambient light and therefore not preferable for outdoor applications (3) Limited availability of some materials |
| Third-generation: emerging photovoltaic | (1) Solution processable (2) Conducive to commercial production due to high efficiency at high temperature (3) Mechanically tough | (1) Solar power and manufacturing costs are high |
| Fourth-generation: nano photovoltaic | (1) Low cost (2) High flexibility, thus reducing industrial constraints (3) Very high toughness and hardness (4) High stability and durability (5) Lightweight and thin (6) Green initiatives (7) Physically transparent with minimal blocking of sunlight exposure (8) High electrical and thermal conductivity (9) Ease of preparation as materials are readily available | (1) Very short lifespan (2) Incomplete research resources lead to insufficient practical integrity (3) Commercialization is speculative due to insufficient evidence of commercial validity |
| Generation | Solar Cell | Recyclable Material | Recovery Rate (%) |
|---|---|---|---|
| First | Silicon-based | Aluminum | 100 |
| Glass | 95 | ||
| Silicon | 85 | ||
| Second | GICS-based | Aluminum | 100 |
| Glass | 95 | ||
| Indium | 90 | ||
| Gallium | 90 | ||
| Copper | 90 | ||
| CdTe-based | Aluminum | 100 | |
| Glass | 90 | ||
| Cadmium telluride semiconductor | 95 | ||
| GaAs-based | Aluminum | 100 | |
| Glass | 95 | ||
| Gallium | 98 | ||
| Arsenic | 98 |
| PV Array Configuration | Efficiency in Different Shading Patterns | P-V Output Characteristic | ||||
|---|---|---|---|---|---|---|
| Center | Bottom | L-Shaped | Random | Diagonal | ||
| Series | 64.16% | 63.98% | 64.30% | 40.00% | 64.30% |  |
| Series-Parallel (SP) | 59.53% | 60.00% | 68.91% | 40.42% | 60.30% |  |
| Honeycomb (HC) | 58.99% | 60.00% | 65.96% | 42.09% | 66.91% | 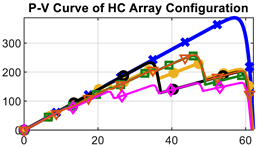 |
| Bridge-Link (BL) | 58.60% | 60.00% | 66.24% | 43.39% | 66.94% | 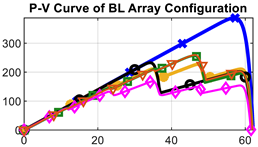 |
| Triple-Tied (TT) | 58.21% | 60.00% | 67.13% | 46.23% | 69.63% | 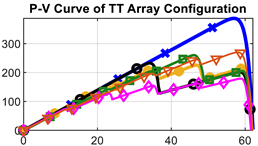 |
 ; .
; .| PV Array Configuration | Merits | Demerits | Remark |
|---|---|---|---|
| Series | (1) Involves minimal cabling, thereby reducing cabling losses (2) Vulnerable to aging | (1) Very high mismatch power loss | It consists of the greatest number of series connected PV modules. Hence, it has the worst ability to achieve maximum power due to the highest numbers of power peaks produced under highly complex partial shading conditions. |
| Series-Parallel (SP) | (1) Ease of construction as there are no redundant connections (2) Economical (3) Vulnerable to aging | (1) High mismatch power losses due to long series connections in the strings | It consists of a larger number of series connected PV modules. Hence, it is relatively less capable of achieving maximum power due to the highest numbers of power peaks produced under highly complex partial shading conditions. |
| Honey-Comb (HC) | (1) Less susceptible to mismatch power losses than SP configurations since it consists of a smaller number of PV modules connected in series (2) Higher stability in response to environmental changes than SP configurations (3) Longer service life (4) Preferred for grid-connected central inverters and stand-alone PV systems | (1) High cabling costs and high cabling losses as extra cables are required in cross-connects (2) High redundancy | It consists of a moderate number of PV modules connected in series. As a result, it has modest maximum power-achievement capabilities due to a decent amount of power peaking under highly complex partial shading conditions. |
| Bridge-Link (BL) | (1) Less susceptible to mismatch power losses than HC configurations since it consists of a smaller number of PV modules connected in series (2) Higher stability in response to environmental changes than HC configurations (3) Longer service life | (1) High cabling costs and high cabling losses as extra cables are required in cross-connects (2) High redundancy | It consists of a smaller number of PV modules connected in series. Therefore, it has a relatively good ability to achieve maximum power due to fewer power peaks generated under highly complex partial shading conditions. |
| Triple-Tied (TT) | (1) Least susceptible to mismatch power losses as it consists of the least number of PV modules connected in series (2) Has the most superior and powerful performance than other PV array configurations (3) Longest service life | (1) Very high wiring cost and very high wiring losses, as there are more complex cross-connects, so more cables are required (2) Very high redundancy | It consists of the least number of PV modules connected in series. Hence, it has the best ability to achieve maximum power due to the least number of power peaks produced under highly complex partial shading conditions. |
| MPPT Classification | Sub-Genre | MPPT Technique Based on: | Ref. | Year |
|---|---|---|---|---|
| Classical | NA | Perturb and observe (P&O) | [124] | 2020 |
| Incremental conductance | [125] | 2020 | ||
| Ripple correlation | [126] | 2020 | ||
| Intelligence | NA | Artificial neural network-assisted sequential Monte Carlo (ANN–SMC) | [127] | 2019 |
| Resilient backpropagation–neural network (Rprop-NN) | [128] | 2019 | ||
| Quantum neural network (QNN) | [129] | 2022 | ||
| Fuzzy logic control (FLC) | [130] | 2022 | ||
| Optimization | Basic optimization | Peafowl optimization algorithm (POA) | [131] | 2021 |
| Mayfly algorithm (MA) | [132] | 2022 | ||
| Remora optimization algorithm (ROA) | [133] | 2022 | ||
| Modified or improved optimization | Improved cuckoo search (ICS) algorithm | [134] | 2021 | |
| Modified normative fish swarm algorithm (mNFSA) | [135] | 2022 | ||
| Modified seagull optimization algorithm (MSOA) | [136] | 2022 | ||
| Hybrid optimization | Genetic algorithm (GA) and ant colony optimization (ACO) | [137] | 2021 | |
| Particle swarm optimization (PSO) and salp swarm optimization (SSO) algorithms | [138] | 2022 | ||
| Hybrid | Classical–Intelligence | NA | ||
| Classical–Optimization | NA | |||
| Intelligence–Optimization | Adaptive neuro-fuzzy inference system and artificial bee colony (ANFIS–ABC) | [139] | 2019 | |
| Artificial neural network and particle swarm optimization (ANN–PSO) | [140] | 2020 | ||
| Adaptive neuro-fuzzy inference system and particle swarm optimization (ANFIS–PSO) | [141] | 2020 | ||
| Genetic algorithm and artificial neural network (GA–ANN) with genetic algorithm/particle swarm optimization and fuzzy logic control (GA/PSO–FLC) | [142] | 2021 | ||
| Classical–Intelligence–Optimization | Modified firefly algorithm, adaptive neuro-fuzzy inference system, and perturbation and observation (MFA–ANFIS–P&O) | [143] | 2020 | |
| Topology | Ref. | Year of Proposal | Tested Frequency (kHz) | Voltage Gain (×) | Peak Efficiency (%) |
|---|---|---|---|---|---|
| Cascading techniques | [183] | 2020 | 50 | 12.00 | 93.00 |
| [184] | 2021 | 10 | 10.00 | NA | |
| [185] | 2021 | 20 | 10.42 | 87.00 | |
| [186] | 2021 | 100 | 7.00 | 91.15 | |
| [187] | 2022 | 22 | 1.90 | 90.00 | |
| [188] | 2022 | 50 | 7.92 | 95.23 | |
| Voltage multiplier cells (VMC) or voltage doubler | [189] | 2020 | 118 | 25.00 | 96.70 |
| [190] | 2021 | 10 | 13.33 | NA | |
| [191] | 2021 | NA | 10.00 | 90.00 | |
| [192] | 2022 | 20 | 10.00 | 90.00 | |
| [193] | 2022 | 100 | 11.52 | 91.60 | |
| [194] | 2022 | 100 | 9.50 | 97.23 | |
| [195] | 2022 | 40 | 10.00 | 97.44 | |
| [196] | 2022 | 90 | 16.67 | 97.50 | |
| Voltage lift techniques | [197] | 2020 | 50 | 12.00 | 96.00 |
| [198] | 2021 | 50 | 7.10 | 95.70 | |
| [193] | 2022 | 100 | 11.52 | 91.60 | |
| [199] | 2022 | 50 | 16.67 | 94.50 | |
| [200] | 2022 | 50 | 14.95 | 95.80 | |
| Multi-phase boost converter | [197] | 2020 | 50 | 12.00 | 96.00 |
| [201] | 2021 | 25 | 15.00 | 93.00 | |
| [202] | 2021 | 350 | 4.00 | 98.30 | |
| [203] | 2022 | 50 | 2.23 | 94.00 | |
| [204] | 2022 | 5 | 2.19 | 95.74 | |
| [205] | 2022 | 30 | 10.00 | 98.68 | |
| Transformer-less boost converter | [206] | 2020 | 50 | 10.00 | 95.30 |
| [207] | 2021 | 10 | 11.25 | 90.00 | |
| [208] | 2021 | 100 | 10.00 | 92.43 | |
| [209] | 2021 | 20 | 10.00 | 95.00 | |
| [210] | 2021 | 50 | 6.67 | 95.44 | |
| [211] | 2022 | 40 | 2.47 | 97.40 | |
| [212] | 2022 | 30 | 10.00 | 88.00 |
Disclaimer/Publisher’s Note: The statements, opinions and data contained in all publications are solely those of the individual author(s) and contributor(s) and not of MDPI and/or the editor(s). MDPI and/or the editor(s) disclaim responsibility for any injury to people or property resulting from any ideas, methods, instructions or products referred to in the content. |
© 2023 by the authors. Licensee MDPI, Basel, Switzerland. This article is an open access article distributed under the terms and conditions of the Creative Commons Attribution (CC BY) license (https://creativecommons.org/licenses/by/4.0/).
Share and Cite
Tan, W.-H.; Mohamad-Saleh, J. Critical Review on Interrelationship of Electro-Devices in PV Solar Systems with Their Evolution and Future Prospects for MPPT Applications. Energies 2023, 16, 850. https://doi.org/10.3390/en16020850
Tan W-H, Mohamad-Saleh J. Critical Review on Interrelationship of Electro-Devices in PV Solar Systems with Their Evolution and Future Prospects for MPPT Applications. Energies. 2023; 16(2):850. https://doi.org/10.3390/en16020850
Chicago/Turabian StyleTan, Weng-Hooi, and Junita Mohamad-Saleh. 2023. "Critical Review on Interrelationship of Electro-Devices in PV Solar Systems with Their Evolution and Future Prospects for MPPT Applications" Energies 16, no. 2: 850. https://doi.org/10.3390/en16020850
APA StyleTan, W.-H., & Mohamad-Saleh, J. (2023). Critical Review on Interrelationship of Electro-Devices in PV Solar Systems with Their Evolution and Future Prospects for MPPT Applications. Energies, 16(2), 850. https://doi.org/10.3390/en16020850