Article

Compositional Analysis of SiOC(H) Powders: A Comparison of X-ray Photoelectron Spectroscopy (XPS) and Combustion Analysis

1
School of Molecular Sciences, Arizona State University, Tempe, AZ 85287, USA
2
Navrotsky Eyring Center for Materials of the Universe, School of Molecular Sciences, Arizona State University, Tempe, AZ 85287, USA
3
Eyring Materials Center, Arizona State University, Tempe, AZ 85287, USA
4
Mechanical and Nuclear Engineering Department, Kansas State University, 3002 Rathbone Hall, Manhattan, KS 66506, USA
*
Author to whom correspondence should be addressed.
Ceramics 2023, 6(1), 74-85; https://doi.org/10.3390/ceramics6010006
Submission received: 16 December 2022 / Revised: 5 January 2023 / Accepted: 5 January 2023 / Published: 8 January 2023

Abstract

:
Accurate chemical analysis of small samples of fine powders in the Si–O–C–H system is challenging. We present a comparison of analysis by X-ray photoelectron spectroscopy (XPS) and combustion analysis, validating XPS as an accurate and simple methodology for Si, C, and O analysis to give bulk and not just surface compositions. The XPS analyses are supported by showing consistency in thermochemical calculations of heats of formation based on high temperature oxide melt solution calorimetry. However, because XPS is not suitable for quantitation of hydrogen, it must be combined with other techniques for samples with substantial H content.

Graphical Abstract

1. Introduction

Identification of efficient elemental analysis techniques is important for the investigation of new materials, especially as the synthesis of novel materials accelerates [1,2,3]. X-ray fluorescence (XRF), atomic absorption spectroscopy (AAS), combustion analysis (CA), and X-ray photoelectron spectroscopy (XPS) are among the most widely used techniques for chemical analysis of materials. Typically, non-destructive techniques are preferred, and the choice of analytical technique is highly dependent on the material [4,5,6,7].
In the last five decades, the synthesis of polymer derived ceramics (PDCs) has increased in popularity [8,9,10]. PDCs have current and potential application in harsh environments as result of their superior thermal stability, resistance to high temperature creep, and ease of processing compared to traditional oxide ceramics [11,12,13]. The macroscopic properties of PDCs are directly related to their composition and microstructure [14,15,16]. Recent reports highlight the superior ultra-high temperature stability of PDCs containing hafnium (Hf), especially compared to simpler SiOC and SiCN ceramic systems [17,18]. Previous studies have stressed the application of carbon-rich PDCs as high capacity electrode materials in battery systems [19,20]. This shows the versatility of PDCs with tailorable compositions and microstructures.
PDCs are derived from preceramic polymers (a completely different class of materials) and they are X-ray amorphous in nature, which makes assessment of structure-property relation in PDCs challenging. Most PDC studies and applications emphasize the electrochemical, thermal, and mechanical properties of ceramics derived from different polymeric precursors [21]. Thermochemical analyses require accurate chemical compositions [22]. Typically, elemental analysis of PDCs can be accomplished by XPS and combustion analysis [22,23,24,25,26]. There is a lingering question of whether XPS provides bulk or surface compositions, and some studies suggest that elemental analysis by a combustion technique provides better approximation of bulk composition in PDCs and similar materials [27,28]. Similarly, previous reports suggest that XPS can obtain compositions near the surface of materials, including PDCs [29,30,31].
In general, combustion analysis may provide a more complete analysis of the composition of PDCs synthesized at lower temperatures, when residual hydrogen from organic groups is significant, especially since XPS cannot detect hydrogen [23,26,32]. However, combustion analysis generally provides C, H, and O content, with Si calculated indirectly by difference. Furthermore, much larger samples are required for combustion analysis, and the samples are often sent to commercial laboratories, with their analytical uncertainty seldomly reported and being hard to judge.
As the application of PDCs in various industries increases in popularity, fundamental understanding of the interconnectivity among composition, microstructure, and thermodynamic stability becomes important [33,34]. Experimental thermodynamic analysis of materials like PDCs requires accurate chemical analysis of the overall composition of a sample as well as its homogeneity [22,35]. Previous studies have not investigated differences and/or similarities in the compositions obtained by XPS and other methods like combustion analysis. Such understanding would permit identification of the most efficient technique for chemical characterization of PDCs. It should be highlighted that XPS also permits imaging of the surface of materials as well as assessment of the distribution of atomic environments in samples. These capabilities make XPS a versatile technique for the characterization of PDCs and other materials.
In this work we explore elemental compositions obtained by two techniques, XPS and combustion analysis. Based on compositions obtained by both analytical techniques, we compare thermodynamic analyses of six SiOC powders derived from polymeric precursors. This work permits the assessment of the best method(s) for chemical analysis of fine ceramic SiOC powders and similar materials.

2. Experimental Methods

2.1. Materials

The materials investigated in this study were synthesized by high temperature pyrolysis of three polymeric precursors (see Figure 1): SRP-2012 (SRP) from Starfire Systems, 1,3,5,7-tetravinyl-1,3,5,7-tetramethylcyclotetrasiloxane (TTCS), and polyhydromethylsiloxane (PHMS) plus 40 wt % 1,3,5-trivinyl-1,1,3,5,5-pentamethyltrisiloxane (TPTS), from Gelest, Inc. The preceramic polymers were crosslinked, then pyrolyzed at 1200 or 1500 °C, in a flowing argon atmosphere. This resulted in the formation of SRP-1200, TTCS-1200, PHMS-1200, SRP-1500, TTCS-1500, and PHMS-1500 SiOCs, which were then ground into fine powders. More details on the synthesis and characterization of the PDCs will be presented in a separate study focused on the systematic investigation of thermodynamic stabilization in these SiOCs.

2.2. Characterization

Carbon (C), oxygen (O), and hydrogen (H) combustion analyses experiments were conducted by a commercial vendor, LECO. Quantification of O content used a LECO ONH836 instrument with a ramped power setting and flowing helium (He) as carrier gas. A similar procedure was employed for determination of H and C content.
XPS analyses were performed using a Kratos AXIS Supra+ with a monochromatic Al Kα+ ion beam (beam energy = 1486.6 eV). XPS survey scans can detect Si, O, and C in the specimen and their relative amounts. For XPS experiments, the fine PDC powders are loaded into the sample stage and analyzed under vacuum. Chemical analyses of the samples are performed by surveying Si 2p, C 1s, and O 1s bonds at binding energies ranging from 1500–0 eV. In this work, we do not perform depth profiling in the samples. For validation, the XPS composition was surveyed over multiple (at least two) analysis locations in each sample. Thermodynamic analyses of the specimen employed enthalpies of dissolution obtained by high temperature (HT) oxide melt solution calorimetry, described in detail previously [36,37,38].

3. Results and Discussion

Combustion analysis can detect O, C, and H content in the samples; Si is determined from the difference. Typically, the H content from residual organics is higher in PDCs pyrolyzed at lower temperatures [23,39,40]. It is expected that in samples pyrolyzed at higher temperatures, the H content (if any) is small. Results from combustion analyses and the reported standard error (from vendor) are summarized in Table 1. They confirm significant amounts of Si, O, and C in the specimens. In contrast, the H content in the samples is small and decreases with pyrolysis temperature, which is expected. Overall, the O content appears to increase slightly with higher pyrolysis temperatures. This is unexpected, as SiOCs and other PDCs pyrolyzed at higher temperatures (>~1200 °C) typically undergo carbothermal reduction or loss of residual structural water, which is characterized by loss of O, and is consistent with results from XPS (see Table 2) [11,18,26]. These observations may indicate systematic error in the measurements from the combustion analysis, and likely point to XPS as a better analytical technique, as shown in the section that follows. We cannot identify other specific reasons for the results.
The XPS survey scans confirm compositions with considerable amounts of Si, C, and O, which is typical for SiOC structures. The results from elemental analysis (including error as standard deviation) by XPS are summarized in Table 2. The compositions from XPS show a decrease in oxygen content in samples pyrolyzed at higher temperature (1500 °C). This is consistent with previous works, and may indicate carbothermal reduction or evolution of O bonded to residual H as structural water [11,36,41,42]. During carbothermal reduction in SiOCs, SiO2 and C react with O to form SiC and CO. Typically, if carbothermal reduction produces SiC without excess gaseous SiO intermediate species, the Si content should not change significantly [43,44]. The reaction mechanism is demonstrated in previous studies [43,44]. This may explain the almost constant Si content observed in SiOCs derived from PHMS between 1200 and 1500 °C.
Optical microscopic images are shown in Figure 2A–C. Surface imaging suggests spherical morphology of agglomerates in all the SiOC powders. In this work, we also employ XPS parallel imaging to determine the spatial distributions of Si, C, and O in the samples. All samples show spatial distribution similar to SRP-1200 (see Figure 2D–G). Figure 2D shows superimposed chemical state images of C 1s and O 1s; as expected, the (atomic) distribution is not completely homogeneous, as some C and O rich regions are observed. Similarly, Figure 2G suggests that some regions may be richer in Si-content as well, which is typical in PDCs, since the local distribution of atoms corresponds to the spatial distribution of different domains, which vary in composition. Other elemental mapping techniques like SEM-EDS can be used to further verify and quantitate the spatial distribution of atoms in PDCs.

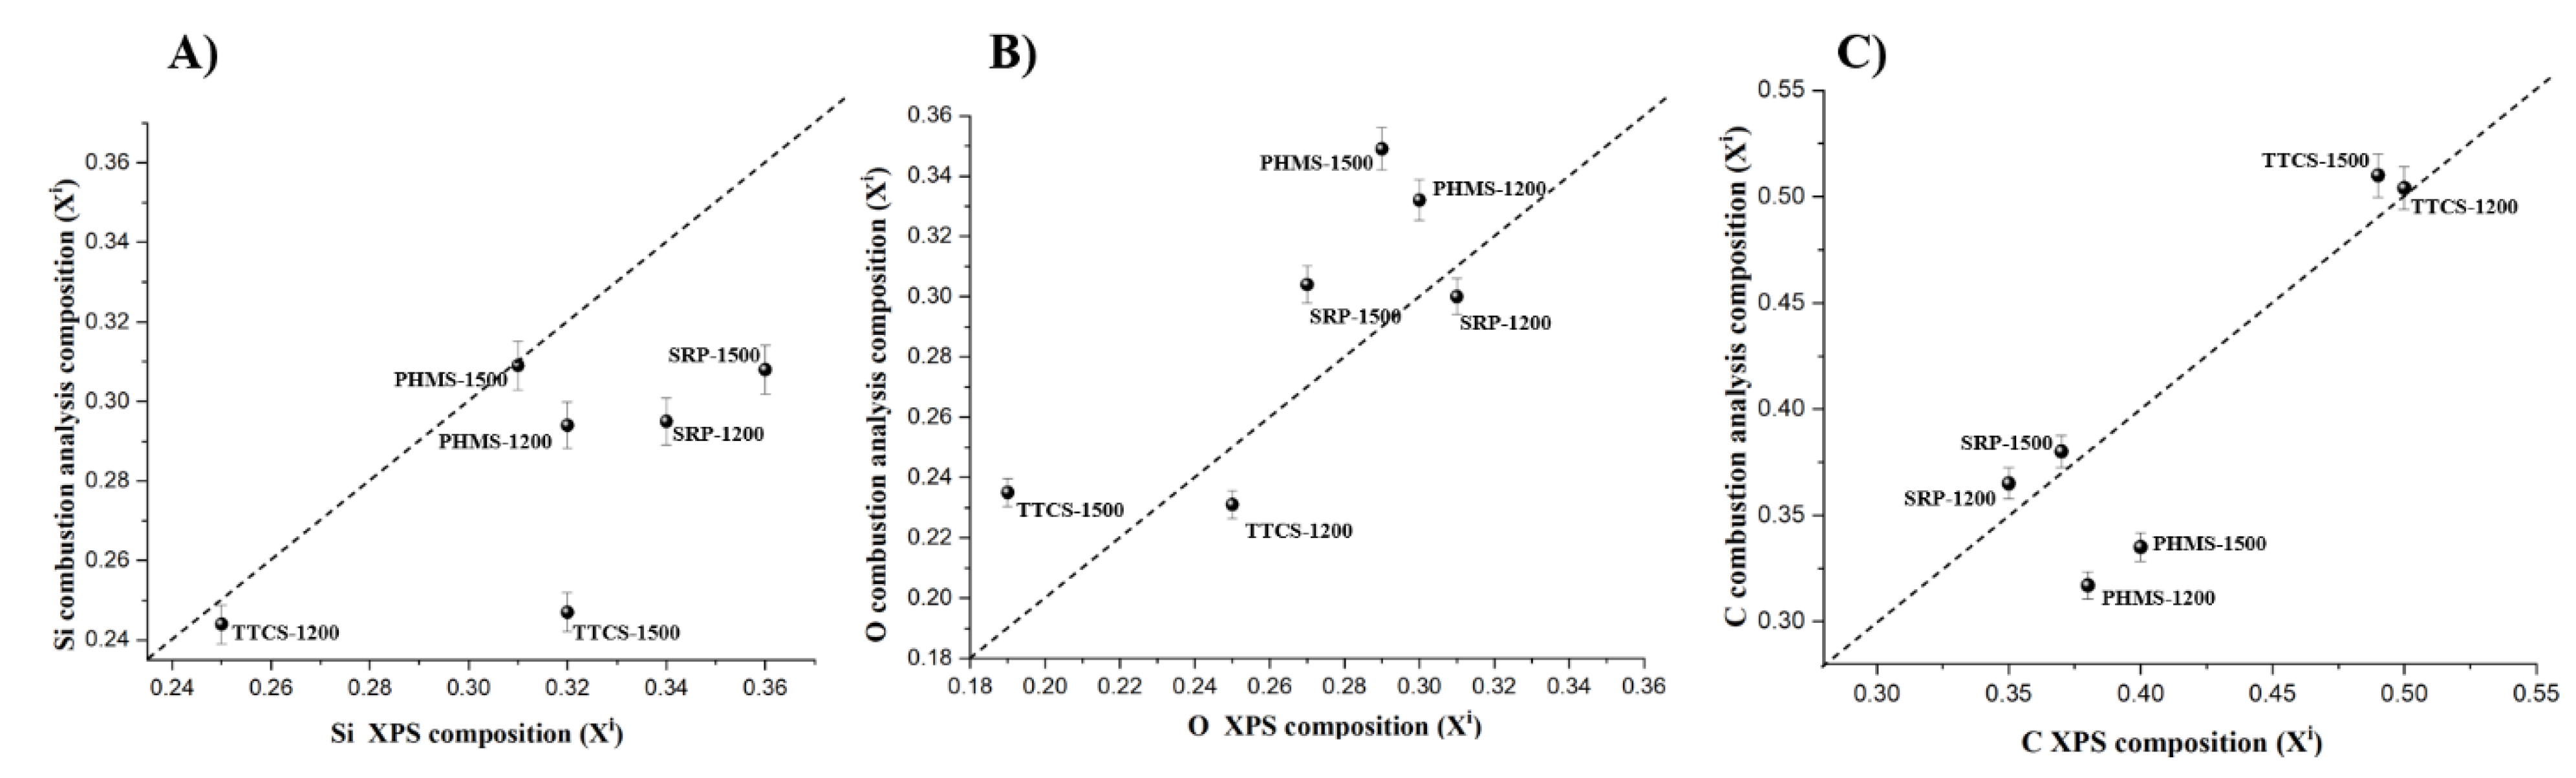
3.1. Comparison of Chemical Analysis by XPS and Combustion

Chemical analysis by XPS and combustion technique can directly quantify the C and O content in samples. The agreement between content detected by both methods can be compared by plotting C or O content detected by XPS versus that found by combustion analysis. The results are summarized in Figure 3B,C. Since the X and Y axes are the same, a 45° line from the origin would correspond to perfect agreement. Overall, Figure 3B,C show reasonable agreement in the C and O content; minor differences can probably be attributed to experimental error. In contrast, a significant difference is observed in Si content from XPS and combustion analysis (Figure 3A) and values from XPS are consistently higher, hence highlighting systematic deviation in values from the combustion analysis. We suggest that these differences result from the cumulative uncertainty in silicon analysis from combustion analysis, as this value is not obtained directly but taken by difference, subtracting the O, C, and H contents from 100%. The uncertainty in silicon content may become even more significant if other contaminants not detected by the combustion technique are present in the specimen. This suggests that XPS is more reliable than combustion analysis for quantification of Si and can be used to correct the Si content derived by combustion analysis. In the discussion that follows, we further validate the corrected compositions by showing consistency in the thermochemical calculations for the heats of formation.
Thus, we conclude that XPS as a suitable technique for determining the bulk composition of PDC fine powders and similar samples. This method may be limited to samples with uniform compositions from bulk to surface (without a different surface layer), as in PDCs, or to well ground fine powders, as grinding may expose bulk compositions (if different from the surface). Another limitation of elemental analysis by XPS is the need for vacuum, which makes analysis of porous materials with adsorbates (including water) challenging.

3.2. Thermochemical Calculations Using Differently Analyzed Chemical Compositions

Details of calorimetric experiments are given elsewhere [22,23]. Here we summarize and discuss the effect of different combinations of XPS and combustion analyses on measured enthalpies of drop solution, enthalpies of formation from elements, and enthalpies of formation from components (SiO2, SiC, C, and H2O). The measured enthalpy of drop solution refers to the actual high temperature calorimetric experiment, in which a sample pellet is dropped from room temperature into a molten solvent in the hot calorimeter. The reaction associated with this process is:
SiaObCcHd (s, 25 °C) + (((2(a + c) + (d/2)) − b)/2) O2 (g, 800 °C) →
a SiO2 (s, 800 °C) + c CO2 (g, 800 °C) + (d/2) H2O (g, 800 °C) ∆Hdis, SiOC
Although the enthalpy of drop solution per gram of material is measured directly, the enthalpy per mole needs further calculations and depends on the molecular weight used. Similarly, the calculated enthalpy of formation (from elements or binary components) also depends on the stoichiometry used. Thus, oxide melt solution calorimetry requires accurate knowledge of chemical composition. Conversely, we can use the variation of measured enthalpies as a function of composition, calculated using different combinations of data from XPS and combustion analyses, to identify uncertainties and inconsistencies in the analytical data. This second approach is followed below, leading to a recommendation of the best mode of analysis.
Thermodynamic analysis based on compositions obtained by XPS and combustion technique are summarized in Table 3 and Table 4 and Figure 4A. Overall, the results point to increasing stability with increasing synthesis temperature. The thermochemical analysis from compositions obtained by the combustion technique points to a decrease in the stability of PDCs derived from SPR-212 with pyrolysis temperature. Enthalpies of formation from elements include the heat for forming stoichiometric crystalline binary compounds (SiC and SiO2) from Si, C, and O2, rendering them to be highly exothermic and masking small variations in energetic trends. Therefore, for assessment of consistency in results from thermochemical calculations, we employ enthalpy of formation from components, which are much lower in magnitude than from elements. This facilitates identification of significant differences based on stoichiometry and structure.
There are significant differences in enthalpies of formation calculated using compositions from XPS and combustion analysis. These observations stress the high sensitivity of thermodynamic analysis to compositional variations. Thus, the values in Table 3 and Table 4 highlight the propagation of errors in the Si content from combustion analysis into enthalpies of formation. However, direct quantitation of Si by XPS permits correction of the Si-content calculated by difference in combustion analysis. Hence, the compositions in Table 4 can be corrected for Si as measured by XPS. Such correction results in the stoichiometries presented in Table 5. The compositions and thermodynamic analyses in Table 5 omit H, since it is low in the samples and may be close to zero within experimental error. Generally, the Si-corrected combustion analyses for C and O are consistent with those from XPS. The consistency in the results can be evaluated by comparison of thermochemical analysis using compositions from XPS and corrected combustion analyses, as shown in Figure 4B, where the dashed line corresponds to 1:1 perfect agreement. Overall, the results suggest good agreement between the datasets.
Although there is reasonably good agreement in the C and O content as obtained by both techniques, further improvement is possible by taking the C and O content as the average of the values detected by XPS and combustion analysis. The average values minimize any systematic errors in the measurements by either of the two analytical methods. The corrected compositions and thermodynamic analyses are shown in Table 6 and are in good agreement with results in Table 3. The comparison of the results with enthalpies of formation obtained using XPS compositions is shown in Figure 4C, which points to much better agreement in the enthalpies of formation. This combined approach provides the greatest improvement in consistency of the data. However, it is unlikely that routine analyses will provide both XPS and combustion data, and the consistency of the results suggests that XPS data for Si, C, and O can be used to reliably measure the bulk (and not just surface) compositions of SiOC powders.
The data above permit quantitative assessment of the effect of small amounts of hydrogen in the thermochemical analysis. Compositions in Table 6 can be corrected through addition of hydrogen content as detected in combustion analysis. The corrected stoichiometries and enthalpies are summarized in Table 7 and Figure 3D. In general, these also indicate good correlation with thermodynamic analysis using XPS compositions. As expected, the effect of including small amounts of hydrogen on enthalpies of formation from components is minor and generally within experimental error. The small change in enthalpy of formation from components when H2O is included suggests that the water present in the samples is not interacting strongly with the PDC and may in fact be loosely bound surface water. We note that thermogravimetric analysis, especially when coupled with mass spectrometry or infrared analysis, is a generally accessible way of determining H2O content.
In this study, the XPS data have a reported error comparable to the standard deviation in compositions obtained by combustion analysis (see Table 1 and Table 2). Some of the combustion analyses agree reasonably well with XPS but two do not, and we cannot identify obvious reasons for the difference. In general, there is good agreement between composition and thermochemical calculation of enthalpies of formation using XPS compositions and Si-corrected combustion analyses. Overall, corrected combustion analyses appear to validate that elemental composition from XPS is representative of the bulk of the PDC powder specimens and that the elemental composition does not represent a distinctly different surface layer. This shows that XPS is a reliable technique for measuring PDC elemental composition and for HT calorimetry/thermodynamic investigation of similar materials. XPS is a more accessible and perhaps also more accurate method for determining the overall elemental composition of PDCs than a commercial combustion analysis-based technique.

4. Conclusions

This investigation explored the chemical characterization of SiOC fine powders by XPS and combustion analysis. Overall, the results suggest that compositions obtained by XPS are accurate and representative of the bulk. Thus, XPS is a suitable technique for the elemental analysis of ceramic powders of SiOC and related materials. It is possible that the findings in this work could be expanded to other materials.

Author Contributions

Resources, X.G. and G.S.; Writing—original draft, G.J.L.; Writing—review & editing, A.N.; Supervision, A.N. All authors have read and agreed to the published version of the manuscript.

Funding

Financial support from National Science Foundation (NSF) Partnerships for International Research and Education (PIRE) grant 1743701 is gratefully acknowledged. The industrial polymeric precursor (SPR-212) was provided by PIRE partner, Zlatomir Apostolov.

Institutional Review Board Statement

Not applicable.

Informed Consent Statement

Not applicable.

Data Availability Statement

The data in this article will be shared on reasonable request from the corresponding author.

Conflicts of Interest

The authors declare no conflict of interest.

References

  1. Bozeman, T.B.; Lemon, R.R.; Eleazer, P.D. Elemental analysis of crystal precipitate from gray and white MTA. J. Endod. 2006, 32, 425–428. [Google Scholar] [CrossRef]
  2. Ninomiya, K.; Kubo, M.K.; Nagatomo, T.; Higemoto, W.; Ito, T.U.; Kawamura, N.; Strasser, P.; Shimomura, K.; Miyake, Y.; Suzuki, T.; et al. Nondestructive elemental depth-profiling analysis by muonic X-Ray measurement. Anal. Chem. 2015, 87, 4597–4600. [Google Scholar] [CrossRef] [PubMed]
  3. Nowak, S.; Winter, M. Elemental analysis of lithium ion batteries. J. Anal. At. Spectrom. 2017, 32, 1833–1847. [Google Scholar] [CrossRef]
  4. Atzei, D.; Fantauzzi, M.; Rossi, A.; Fermo, P.; Piazzalunga, A.; Valli, G.; Vecchi, R. Surface chemical characterization of PM10 samples by XPS. Appl. Surf. Sci. 2014, 307, 120–128. [Google Scholar] [CrossRef]
  5. Aquisman, A.E.; Assim, Z.B.; Wahi, R.B.; Kwabena, D.E.; Festus, W. Validation of the atomic absorption spectroscopy (AAS) for heavy metal analysis and geochemical exploration of sediment samples from the Sebangan river. Adv. Anal. Chem. 2019, 9, 23–33. [Google Scholar]
  6. Faubel, W.; Staub, S.; Simon, R.; Heissler, S.; Pataki, A.; Banik, G. Non-destructive analysis for the investigation of decomposition phenomena of historical manuscripts and prints. Spectrochim. Acta Part B At. Spectrosc. 2007, 62, 669–676. [Google Scholar] [CrossRef]
  7. Millett, E.J. Progress in the Analysis of Crystalline Solids. J. Cryst. Growth 1980, 48, 666–682. [Google Scholar] [CrossRef]
  8. Sujith, R.; Jothi, S.; Zimmermann, A.; Aldinger, F.; Kumar, R. Mechanical behaviour of polymer derived ceramics—A Review. Int. Mater. Rev. 2021, 66, 426–449. [Google Scholar] [CrossRef]
  9. Ma, B.; Cao, Y.; Gao, Y.; Wang, Y. Fabrication of a thin double-layer thermistor based on DVB-modified polymer-derived SiCN ceramics. J. Alloys Compd. 2018, 732, 491–497. [Google Scholar] [CrossRef]
  10. Ionescu, E.; Mera, G.; Riedel, R. Polymer-derived ceramics (PDCs): Materials design towards applications at ultrahigh-temperatures and in extreme environments. In Nanotechnology: Concepts, Methodologies, Tools, and Applications; Information Resources Management Association; Technische Universität Darmstadt: Darmstadt, Germany, 2014; pp. 1108–1139. [Google Scholar]
  11. Colombo, P.; Mera, G.; Riedel, R.; Sorarù, G.D. Polymer-derived ceramics: 40 years of research and innovation in advanced ceramics. J. Am. Ceram. Soc. 2010, 93, 1805–1837. [Google Scholar] [CrossRef]
  12. Terauds, K.; Sanchez-Jimenez, P.E.; Raj, R.; Vakifahmetoglu, C.; Colombo, P. Giant Piezoresistivity of polymer-derived ceramics at high temperatures. J. Eur. Ceram. Soc. 2010, 30, 2203–2207. [Google Scholar] [CrossRef]
  13. Riedel, R.; Mera, G.; Hauser, R.; Klonczynski, A. Silicon-Based Ceramics Derived from Polymers-Review on Synthesis, Properties and Applications. J. Ceram. Soc. Jpn. 2006, 114, 425–444. [Google Scholar] [CrossRef] [Green Version]
  14. Duan, W.; Yin, X.; Li, Q.; Schlier, L.; Greil, P.; Travitzky, N. A Review of absorption properties in silicon-based polymer derived ceramics. J. Eur. Ceram. Soc. 2016, 36, 3681–3689. [Google Scholar] [CrossRef]
  15. Wen, Q.; Yu, Z.; Riedel, R. The fate and role of in situ formed carbon in polymer-derived ceramics. Prog. Mater. Sci. 2020, 109, 100623. [Google Scholar] [CrossRef]
  16. Ionescu, E.; Kleebe, H.-J.; Riedel, R. Silicon-containing polymer-derived ceramic nanocomposites (PDC-NCs): Preparative approaches and properties. Chem. Soc. Rev. 2012, 41, 5032–5052. [Google Scholar] [CrossRef]
  17. Ushakov, S.V.; Maram, P.S.; Kapush, D.; Pavlik, A.J.; Fyhrie, M.; Gallington, L.C.; Benmore, C.J.; Weber, R.; Neuefeind, J.C.; McMurray, J.W.; et al. Phase transformations in oxides above 2000 °C: Experimental technique development. Adv. Appl. Ceram. 2018, 117, s82–s89. [Google Scholar] [CrossRef]
  18. Ionescu, E.; Bernard, S.; Lucas, R.; Kroll, P.; Ushakov, S.; Navrotsky, A.; Riedel, R. Polymer-derived ultra-high temperature ceramics (UHTCs) and related materials. In Ceramics, Glass and Glass-Ceramics: From Early Manufacturing Steps Towards Modern Frontiers; Baino, F., Tomalino, M., Tulyaganov, D., Eds.; PoliTO Springer Series; Springer International Publishing: Cham, Switzerland, 2021; pp. 281–323. [Google Scholar]
  19. David, L.; Bhandavat, R.; Barrera, U.; Singh, G. Silicon oxycarbide glass-graphene composite paper electrode for long-cycle lithium-ion batteries. Nat. Commun. 2016, 7, 10998. [Google Scholar] [CrossRef] [Green Version]
  20. Bhandavat, R.; Singh, G. Stable and efficient Li-ion battery anodes prepared from polymer-derived silicon oxycarbide–carbon nanotube shell/core composites. J. Phys. Chem. C 2013, 117, 11899–11905. [Google Scholar] [CrossRef] [Green Version]
  21. Vakifahmetoglu, C.; Zeydanli, D.; Colombo, P. Porous polymer derived ceramics. Mater. Sci. Eng. R. Rep. 2016, 106, 1–30. [Google Scholar] [CrossRef]
  22. Leonel, G.J.; Mujib, S.B.; Singh, G.; Navrotsky, A. Thermodynamic stabilization of crystalline silicon carbide polymer-derived ceramic fibers. Int. J. Ceram. Eng. Sci. 2022, 4, 315–326. [Google Scholar] [CrossRef]
  23. Sugie, C.; Navrotsky, A.; Lauterbach, S.; Kleebe, H.-J.; Mera, G. Structure and thermodynamics of silicon oxycarbide polymer-derived ceramics with and without mixed-bonding. Materials 2021, 14, 4075. [Google Scholar] [CrossRef] [PubMed]
  24. Wen, Q.; Yu, Z.; Riedel, R.; Ionescu, E. Single-source-precursor synthesis and high-temperature evolution of a boron-containing SiC/HfC ceramic nano/micro composite. J. Eur. Ceram. Soc. 2021, 41, 3002–3012. [Google Scholar] [CrossRef]
  25. Reinold, L.M.; Graczyk-Zajac, M.; Gao, Y.; Mera, G.; Riedel, R. Carbon-rich SiCN ceramics as high capacity/high stability anode material for lithium-ion batteries. J. Power Sources 2013, 236, 224–229. [Google Scholar] [CrossRef]
  26. Widgeon, S.; Mera, G.; Gao, Y.; Sen, S.; Navrotsky, A.; Riedel, R. Effect of precursor on speciation and nanostructure of SiBCN polymer-derived ceramics. J. Am. Ceram. Soc. 2013, 96, 1651–1659. [Google Scholar] [CrossRef]
  27. Bhandavat, R.; Singh, G. Synthesis, Characterization, and high temperature stability of Si(B)CN-coated carbon nanotubes using a boron-modified poly(ureamethylvinyl)silazane chemistry. J. Am. Ceram. Soc. 2012, 95, 1536–1543. [Google Scholar] [CrossRef]
  28. Poerschke, D.L.; Braithwaite, A.; Park, D.; Lauten, F. Crystallization behavior of polymer-derived Si-O-C for ceramic matrix composite processing. Acta Mater. 2018, 147, 329–341. [Google Scholar] [CrossRef]
  29. Daccà, A.; Gemme, G.; Mattera, L.; Parodi, R. XPS Analysis of the Surface composition of niobium for superconducting RF cavities. Appl. Surf. Sci. 1998, 126, 219–230. [Google Scholar] [CrossRef]
  30. Hooshmand, T.; Daw, R.; van Noort, R.; Short, R.D. XPS Analysis of the surface of leucite-reinforced feldspathic ceramics. Dent. Mater. 2001, 17, 1–6. [Google Scholar] [CrossRef]
  31. Sarkar, S.; Chunder, A.; Fei, W.; An, L.; Zhai, L. Superhydrophobic mats of polymer-derived ceramic fibers. J. Am. Ceram. Soc. 2008, 91, 2751–2755. [Google Scholar] [CrossRef]
  32. Stojilovic, N. Why can’t we see hydrogen in X-ray photoelectron spectroscopy? J. Chem. Educ. 2012, 89, 1331–1332. [Google Scholar] [CrossRef]
  33. Guo, X.; Szenknect, S.; Mesbah, A.; Labs, S.; Clavier, N.; Poinssot, C.; Ushakov, S.V.; Curtius, H.; Bosbach, D.; Ewing, R.C.; et al. Thermodynamics of formation of coffinite, USiO4. Proc. Natl. Acad. Sci. USA 2015, 112, 6551–6555. [Google Scholar] [CrossRef] [PubMed] [Green Version]
  34. Tavakoli, A.H.; Armentrout, M.M.; Narisawa, M.; Sen, S.; Navrotsky, A. White Si–O–C ceramic: Structure and thermodynamic stability. J. Am. Ceram. Soc. 2015, 98, 242–246. [Google Scholar] [CrossRef]
  35. Tavakoli, A.H.; Golczewski, J.A.; Bill, J.; Navrotsky, A. Effect of boron on the thermodynamic stability of amorphous polymer-derived Si(B)CN ceramics. Acta Mater. 2012, 60, 4514–4522. [Google Scholar] [CrossRef]
  36. Niu, M.; Wang, H.; Chen, J.; Su, L.; Wu, D.; Navrotsky, A. Structure and energetics of SiOC and SiOC-modified carbon-bonded carbon fiber composites. J. Am. Ceram. Soc. 2017, 100, 3693–3702. [Google Scholar] [CrossRef]
  37. Tavakoli, A.H.; Campostrini, R.; Gervais, C.; Babonneau, F.; Bill, J.; Sorarù, G.D.; Navrotsky, A. Energetics and structure of polymer-derived Si–(B–)O–C glasses: Effect of the boron content and pyrolysis temperature. J. Am. Ceram. Soc. 2014, 97, 303–309. [Google Scholar] [CrossRef]
  38. Navrotsky, A. Progress and new directions in calorimetry: A 2014 perspective. J. Am. Ceram. Soc. 2014, 97, 3349–3359. [Google Scholar] [CrossRef]
  39. Widgeon, S.; Mera, G.; Gao, Y.; Stoyanov, E.; Sen, S.; Navrotsky, A.; Riedel, R. Nanostructure and energetics of carbon-rich SiCN ceramics derived from polysilylcarbodiimides: Role of the nanodomain interfaces. Chem. Mater. 2012, 24, 1181–1191. [Google Scholar] [CrossRef]
  40. Shen, C.; Barrios, E.; Zhai, L. Bulk polymer-derived ceramic composites of graphene oxide. ACS Omega 2018, 3, 4006–4016. [Google Scholar] [CrossRef]
  41. Sreeja, R.; Jayalatha, T.; Devapal, D. Silicon oxycarbide (SiOC) foam from methylphenylpoly(silsesquioxane)(PS) by direct foaming technique. J. Porous Mater. 2022. [Google Scholar] [CrossRef]
  42. Sun, X.; Yang, G.; Tian, Z.; Zhu, W.; Su, D. In-Situ Formation of titanium carbide in carbon-rich silicon oxycarbide ceramic for enhanced thermal stability. J. Eur. Ceram. Soc. 2022, 42, 6935–6941. [Google Scholar] [CrossRef]
  43. Seo, W.-S.; Koumoto, K. Stacking Faults in β-SiC Formed during Carbothermal Reduction of SiO2. J. Am. Ceram. Soc. 1996, 79, 1777–1782. [Google Scholar] [CrossRef]
  44. Berger, L.-M.; Gruner, W.; Langholf, E.; Stolle, S. On the mechanism of carbothermal reduction processes of TiO2 and ZrO2. Int. J. Refract. Met. Hard Mater. 1999, 17, 235–243. [Google Scholar] [CrossRef]
Figure 1. Structure of oligomers used for synthesis of the ceramic powders.
Ceramics 06 00006 g001
Figure 2. (AC) Optical microscopic images with a field of view 800 × 800 μm on SRP-1200, TTCS-1200, and PHMS-1200 fine powders. (D) Superimposed XPS micrographs of C 1s and O 1s. (E) Spatial distribution of C 1s in SRP-1200. (F) Spatial distribution of O 1s in SRP-1200. (G) Spatial distribution of Si 2p in SRP-1200. (The field of view for the XPS micrographs is 400 × 400 μm).
Ceramics 06 00006 g002
Figure 3. Comparison of composition by XPS and combustion analysis. (A) Silicon, (B) Oxygen and (C) Carbon.
Ceramics 06 00006 g003
Figure 4. Comparisons of enthalpies from compositions obtained by (A) XPS and combustion analysis (including hydrogen), (B) XPS and Si-corrected combustion analysis (excluding hydrogen), (C) XPS and combustion analysis (excluding hydrogen) corrected for Si, plus O and C as average of value detected by XPS and combustion technique, (D) XPS and combustion analysis (including hydrogen) corrected for Si, plus O and C as average of value detected by XPS and combustion technique, and (E) enthalpy of formation calculated from corrected combustion analysis including hydrogen (x-axis) versus excluding hydrogen (y-axis). The 1:1 dashed line corresponds to perfect agreement.
Ceramics 06 00006 g004
Table 1. Elemental analysis of SiOC samples by combustion technique.
Elemental Composition by Combustion Analysis
Elements (at.%)
SiOC SampleCOSiH
SRP-120036.54 ± 0.3530.0 ± 0.1729.523.94 ± 0.02
SRP-150037.96 ± 0.34 30.40 ± 0.3030.790.85 ± 0.01
TTCS-120050.45 ± 0.4823.09 ± 0.15524.452.01 ± 0.02
TTCS-150050.97 ± 0.4923.47 ± 0.1824.750.81 ± 0.08
PHMS-120031.75 ± 0.3033.24 ± 0.3029.375.68 + 0.05
PHMS-150033.54 ± 0.3434.88 ± 0.3430.940.67 ± 0.07
Table 2. Elemental analysis of SiOC samples from XPS.
Elemental Composition by XPS
Elements (at.%)
SiOC SampleC1sO1sSi2p
SRP-120035.47 ± 0.5530.56 ± 0.6033.97 ± 0.05
SRP-150037.12 ± 0.0227.32 ± 0.7435.56 ± 0.71
TTCS-120050.28 ± 0.2225.29 ± 0.6224.43 ± 0.39
TTCS-150048.76 ± 0.5219.37 ± 0.0531.87 ± 0.47
PHMS-120038.16 ± 0.3030.25 ± 1.0031.62 ± 0.70
PHMS-150040.35 ± 1.0928.57 ± 0.0331.15 ± 0.09
Table 3. Summary of enthalpies of formation from elements ∆H°f, elem and components ∆H°f, comp using composition from XPS.
SampleComposition
SixOyCz (x + y + z = 1)
∆Hdis (kJ.mol−1)∆H°f, elem (kJ.mol−1)∆H°f, comp (kJ.mol−1)
SRP-1200Si0.34O0.31C0.35−275.41 ± 2.40−154.40 ± 3.19−0.31 ± 3.23
TTCS-1200Si0.25O0.25C0.50−291.94 ± 2.77−116.35 ± 3.48+6.16 ± 3.51
PHMS-1200Si0.32O0.30C0.38−226.92 ± 2.21−197.55 ± 3.05−48.34 ± 3.09
SRP-1500Si0.36O0.27C0.37−284.91 ± 2.78−170.12 ± 3.50−31.88 ± 3.52
TTCS-1500Si0.32O0.19C0.49−299.76 ± 2.60−167.29 ± 3.35−64.80 ± 3.38
PHMS-1500Si0.31O0.29C0.40−210.21 ± 1.70−212.43 ± 2.71−68.87 ± 2.74
Table 4. Summary of enthalpies of formation from elements ∆H°f, elem and components ∆H°f, comp using composition from combustion analysis.
SampleComposition
SiwOxCyHz (w + x + y + z = 1)
∆Hdis (kJ.mol−1)∆H°f, elem (kJ.mol−1)∆H°f, comp (kJ.mol−1)
SRP-1200Si0.295O0.300C0.365H0.04−256.23 ± 2.23−144.18 ± 3.07−0.173 ± 3.10
TTCS-1200Si0.244O0.231C0.504H0.021−283.70 ± 2.70−123.43 ± 3.42−11.65 ± 3.45
PHMS-1200Si0.294O0.332C0.317H0.057−214.20 ± 2.09−168.54 ± 2.97−12.16 ± 3.0
SRP-1500Si0.308O0.304C0.380H0.008−271.47 ± 2.65−142.50 ± 3.50+5.9828 ± 3.42
TTCS-1500Si0.247O0.235C0.510H0.008−280.33 ± 2.43−130.23 ± 2.62−15.14 ± 3.24
PHMS-1500Si0.309O0.349C0.335H0.007−210.51 ± 1.70−186.51 ± 2.70−18.61 ± 2.74
Table 5. Results for thermodynamic analysis using Si-corrected compositions from combustion analysis (ignoring low H concentration).
SampleComposition
SixOyCz (x + y + z = 1)
∆Hdis (kJ.mol−1)∆H°f, elem (kJ.mol−1)∆H°f, comp (kJ.mol−1)
SRP-1200Si0.34O0.30C0.36−274.82 ± 2.39−158.93 ± 3.18−9.03 ± 3.22
TTCS-1200Si0.25O0.24C0.51−291.31 ± 2.76−120.95 ± 3.47−2.59 ± 3.50
PHMS-1200Si0.32O0.35C0.33−229.37 ± 2.23−174.64 ± 3.07−5.29 ± 3.1
SRP-1500Si0.36O0.28C0.36−285.43 ± 2.78−167.31 ± 3.49−23.25 ± 3.51
TTCS-1500Si0.32O0.20C0.48−300.37 ± 2.60−162.74 ± 3.35−56.07 ± 3.37
PHMS-1500Si0.31O0.31C0.34−205.57 ± 1.66−193.93 ± 2.68−42.02 ± 2.72
Table 6. Summary of thermodynamic analysis using Si-corrected (ignoring H) compositions from combustion analysis, plus C and O content as average of values from XPS and combustion technique.
SampleComposition
SixOyCz (x + y + z = 1)
∆Hdis (kJ.mol−1)∆H°f, elem (kJ.mol−1)∆H°f, comp (kJ.mol−1)
SRP-1200Si0.34O0.30C0.36−274.82 ± 2.39−158.93 ± 3.18−9.03 ± 3.22
TTCS-1200Si0.25O0.24C0.51−291.31 ± 2.76−120.95 ± 3.47−2.59 ± 3.50
PHMS-1200Si0.32O0.31C0.37−227.39 ± 2.22−192.38 ± 3.06−39.78 ± 3.07
SRP-1500Si0.36O0.28C0.36−285.43 ± 2.78−166.23 ± 3.49−23.25 ± 3.51
TTCS-1500Si0.32O0.21C0.47−301.05 ± 2.61−158.12 ± 3.35−46.82 ± 3.36
PHMS-1500Si0.31O0.32C0.37−211.59 ± 1.71−247.58 ± 2.71−43.13 ± 2.73
Table 7. Summary of thermodynamic analysis using Si-corrected (H included) compositions from combustion analysis, plus C and O content as average of XPS and combustion techniques.
SampleComposition
SixOyCz (x + y + z = 1)
∆Hdis (kJ.mol−1)∆H°f, elem (kJ.mol−1)∆H°f, comp (kJ.mol−1)
SRP-1200Si0.34O0.305C0.315H0.04−270.97 ± 4.06−149.61 ± 4.57−0.70 ± 4.60
TTCS-1200Si0.25O0.240C0.489H0.021−286.0 ± 2.76−120.59 ± 3.47−3.64 ± 3.50
PHMS-1200Si0.32O0.316C0.307H0.057−219.61 ± 2.13−182.78 ± 3.0−31.09 ± 3.03
SRP-1500Si0.36O0.287C0.345H0.008−283.17 ± 2.76−163.59 ± 3.47−18.16 ± 3.50
TTCS-1500Si0.32O0.212C0.46H0.008−298.54 ± 2.59−157.72 ± 3.34−46.54 ± 3.37
PHMS-1500Si0.31O0.319C0.364H0.007−209.388 ± 1.67−182.78 ± 2.69−44.73 ± 2.73
Disclaimer/Publisher’s Note: The statements, opinions and data contained in all publications are solely those of the individual author(s) and contributor(s) and not of MDPI and/or the editor(s). MDPI and/or the editor(s) disclaim responsibility for any injury to people or property resulting from any ideas, methods, instructions or products referred to in the content.

