Article

UPLC-Q-TOF/MS-Based Metabolomics Approach Reveals Osthole Intervention in Breast Cancer 4T1 Cells

1
School of Pharmacy, The Center for Drug Research and Development, Guangdong Pharmaceutical University, Guangzhou 510006, China
2
School of Chinese Medicine, Guangdong Pharmaceutical University, Guangzhou 510006, China
3
School of Health, Guangdong Light and Health Engineering R&D Center, Guangdong Pharmaceutical University, Guangzhou 510006, China
4
School of Chinese Medicine, Guangdong Provincial Key Laboratory of Advanced Drug Delivery, Guangdong Provincial Engineering Center of Topical Precise Drug Delivery System, Guangdong Pharmaceutical University, Guangzhou 510006, China
*
Authors to whom correspondence should be addressed.
Int. J. Mol. Sci. 2023, 24(2), 1168; https://doi.org/10.3390/ijms24021168
Submission received: 2 November 2022 / Revised: 1 December 2022 / Accepted: 29 December 2022 / Published: 6 January 2023
(This article belongs to the Section Molecular Endocrinology and Metabolism)

Abstract

:
Osthole (OST) is a simple coumarin derivative with pharmacological effects in many types of cancer cells. However, its role and its mechanism of action in breast cancer 4T1 cells remain unclear. In this study, we explored the effects and potential mechanisms of action of OST in 4T1 cells. The MTT, PI, and Annexin V-FITC/PI methods were used to evaluate the effects of OST-treated and untreated 4T1 cells on viability, cell cycle, and apoptosis, respectively. UPLC-Q-TOF/MS combined with multivariate data analysis was used to screen potential biomarkers relevant to the therapeutic mechanisms of OST. Additionally, mTOR, SREBP1, and FASN protein levels were detected using western blotting in OST-treated and untreated 4T1 cells. OST inhibited 4T1 cell proliferation, blocked the cells from remaining in S-phase, and induced apoptosis. In 4T1 cells, OST mainly affected the phospholipid biosynthesis, methyl histidine metabolism, pyrimidine metabolism, and β-oxidation of very long chain fatty acid pathways, suggesting that metabolic changes related to lipid metabolism-mediated signaling systems were the most influential pathways, possibly via inhibition of mTOR/SREBP1/FASN signaling. Our findings reveal biomarkers with potential therapeutic effects in breast cancer and provide insight into the therapeutic and metabolic mechanisms of OST in 4T1 cells.

1. Introduction

Globally, breast cancer is the most common and prevalent malignant tumor in women [1,2] and threatens human health and lives. An estimated 2.3 million new cases were diagnosed in women in 2020, accounting for 11.7% of all cancer cases and leading to 685,000 deaths. Breast cancer has surpassed lung cancer as one of the most common causes of cancer-related deaths [3]. Breast cancer is a metastatic cancer that can typically metastasize from its original site to other tissues and organs, such as the bones, liver, lungs, and brain [4,5], and it is often diagnosed at a late stage because symptoms rarely occur in the early stages of disease [6]. Although great progress has been made in the development of diagnostic tools and treatment strategies, current treatment strategies exhibit limitations such as tumor recurrence and metastasis, drug side effects, and drug resistance [7,8,9]. Breast cancer results from the joint action of multiple risk factors in the body, making it extremely difficult to treat [10]. Therefore, novel anticancer drugs are urgently needed. Notably, traditional Chinese medicine has received increased attention because of its unique advantages, such as its effects on multiple pathways and targets and its less toxic side effects [11].
Osthole (OST), also known as methoxyparsleyol, was the first coumarin derivative obtained from medicinal plant Cnidium monnieri (L.) Cusson (Figure 1) [12,13]. OST has anti-cancer effects against many types of cancer such as breast cancer, hepatocellular carcinoma, and kidney cancer [14]. The derivative exerts anti-tumor activity through various mechanisms, such as by inhibiting the STAT3 and TGF-β/Smad signaling pathways, inducing PI3K/Akt, and activating the AMPK/Akt/ERK signaling pathway, which includes cell proliferation and the cell cycle, apoptosis, and cell migration [15]. As a process by which tumor cells can meet their energy requirements for survival and proliferation, metabolic reprogramming is considered a hallmark of cancer [16]. A wide range of other metabolic pathways can also sustain cancer cell growth and migration, including amino acid/lipid metabolism, pentose phosphate pathway, and macromolecular biosynthesis [17]. Abnormalities in lipid metabolism have been described in tumor progression [18], particularly fatty acid synthesis (FAS) and fatty acid oxidation (also known as β-oxidation), which play important roles in the malignant transformation of cancer cells [19]. Fatty acid synthase (FASN), a key enzyme in endogenous fatty acid synthesis, is involved in de novo synthesis of long chain fatty acids, which are subsequently esterified to phospholipids and incorporated into cell membranes for cell proliferation [20]. FASN overexpression is related to poor cancer prognosis; therefore, FASN is considered to be a potential drug target for cancer therapy [21]. Sterol regulatory element binding protein 1 (SREBP1), a regulator of FASN transcription, is involved in regulating FASN expression in the nucleus [22]. Additionally, mTOR is major regulator of cellular metabolism via its ability to regulate SREBP1 [23,24]. However, the molecular mechanism of OST in breast cancer 4T1 cells is unclear.
In recent years, ultra high performance liquid chromatography–quadruple–time-of-flight mass spectrometry (UPLC-Q-TOF/MS) based metabolomics techniques have been applied to characterize changes in small molecular weight metabolites (<1.5 kDa) in cells, tissues, and biofluids under specific conditions because of their high sensitivity and resolution and to identify biomarkers useful as therapeutic targets to reveal the metabolic processes and potential mechanisms of various diseases [25]. These results provide a scientific basis for analyzing the pathophysiological pathways in breast cancer [26]. Metabolic composition analysis has suggested that linoleic acid metabolism [27], amino acid, methionine, and purine metabolism [28] are associated with breast cancer progression. Therefore, metabolomic analysis using UPLC-Q-TOF/MS can help reveal the potential antitumor mechanism of OST in 4T1 cells.
In this study, we employed a cellular metabolomic approach using UPLC-Q-TOF/MS to identify promising functional metabolites associated with 4T1 cells and to reveal the metabolic mechanism of OST against 4T1 cells. First, the viability, cycle, and apoptosis of both OST-treated and untreated 4T1 cells were assessed. Next, UPLC-Q-TOF/MS-based methods were used to screen potential metabolic markers associated with OST-treated 4T1 cells. Functional biomarkers were identified, and the therapeutic mechanisms of OST were examined. Finally, mTOR, SREBP1, and FASN protein expression levels were assessed. This study provides insight into the therapeutic mechanisms of OST.

2. Results

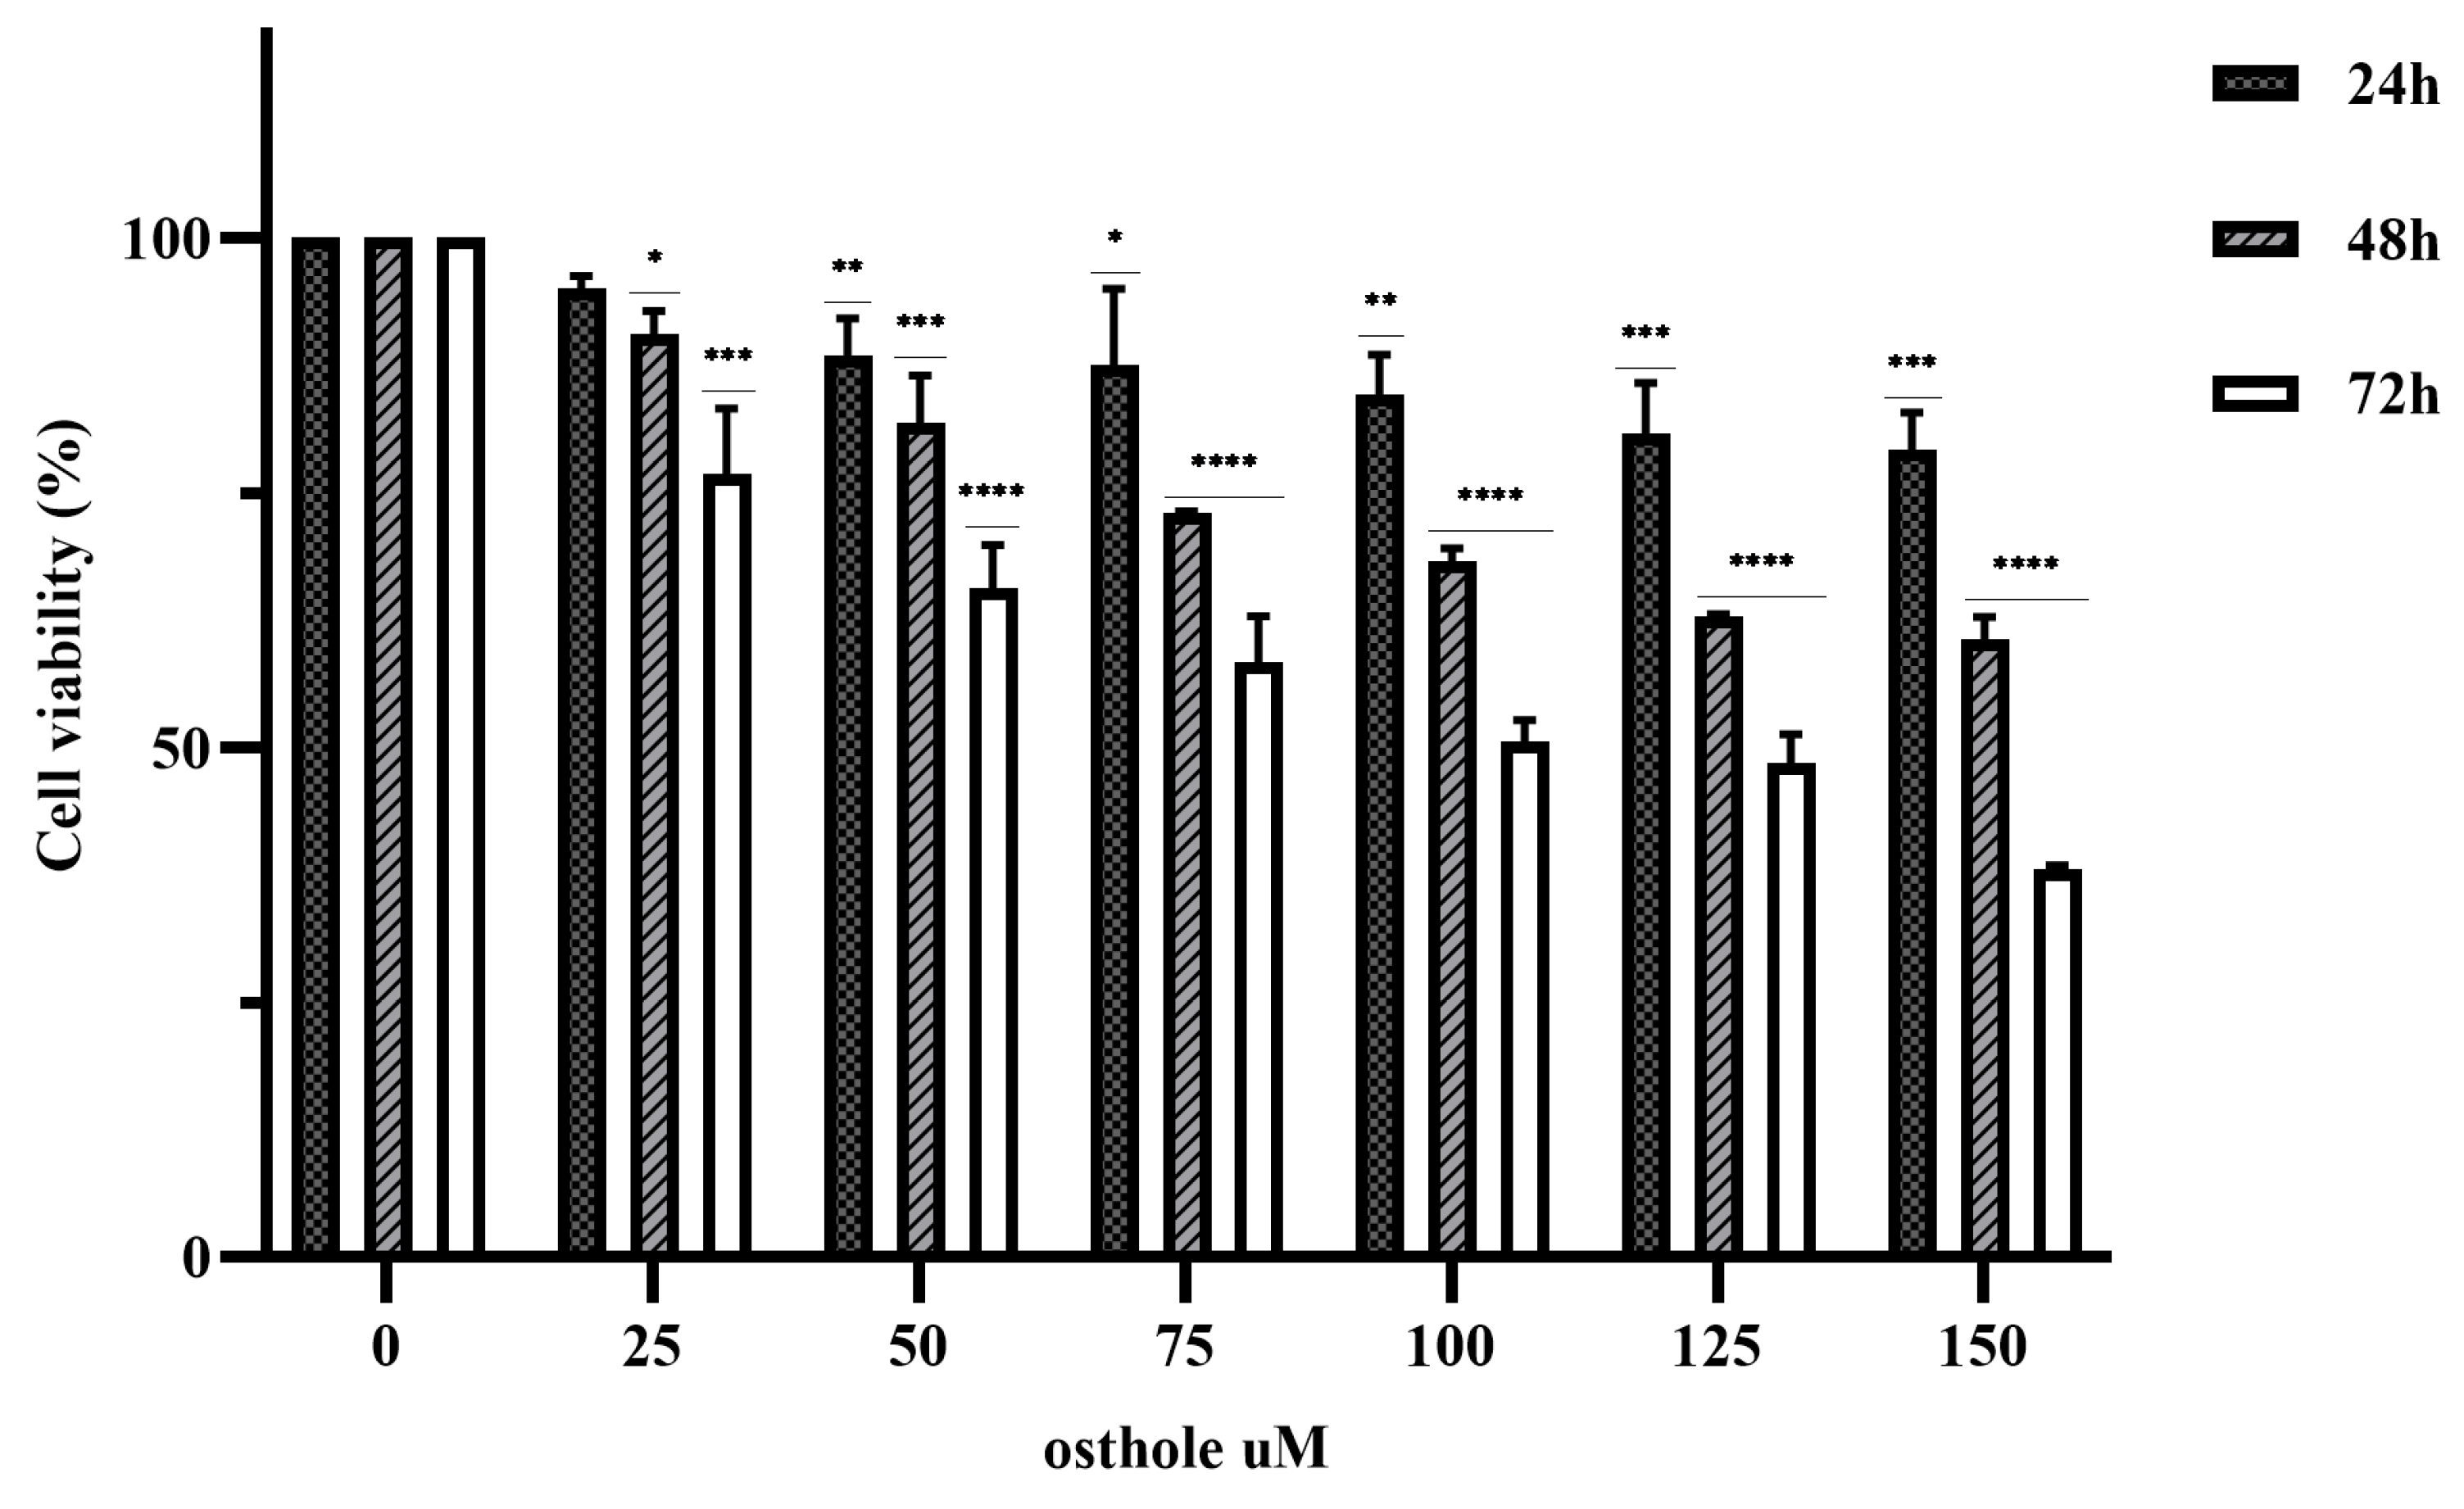
2.1. Effect of OST on Breast Cancer 4T1 Cell Activity

The anticancer effects of various concentrations of OST (0, 25, 50, 75, 100, 125, and 150 μM) on 4T1 cells was investigated in an MTT assay for 24, 48, and 72 h. The results showed that OST inhibited the proliferation of 4T1 cells in a time- and dose-dependent manner compared to the control group (0 μM) (Figure 2). The 50% inhibitory concentrations (IC50) of OST treatment for 24, 48, and 72 h were 525.4, 178.4, and 70.7 μM, respectively, for 4T1 cells. Therefore, 50, 75, and 100 μM (as low (L), medium (M), high (H) concentrations) OST were used to treat 4T1 cells for 24 or 48 h in subsequent experiments.

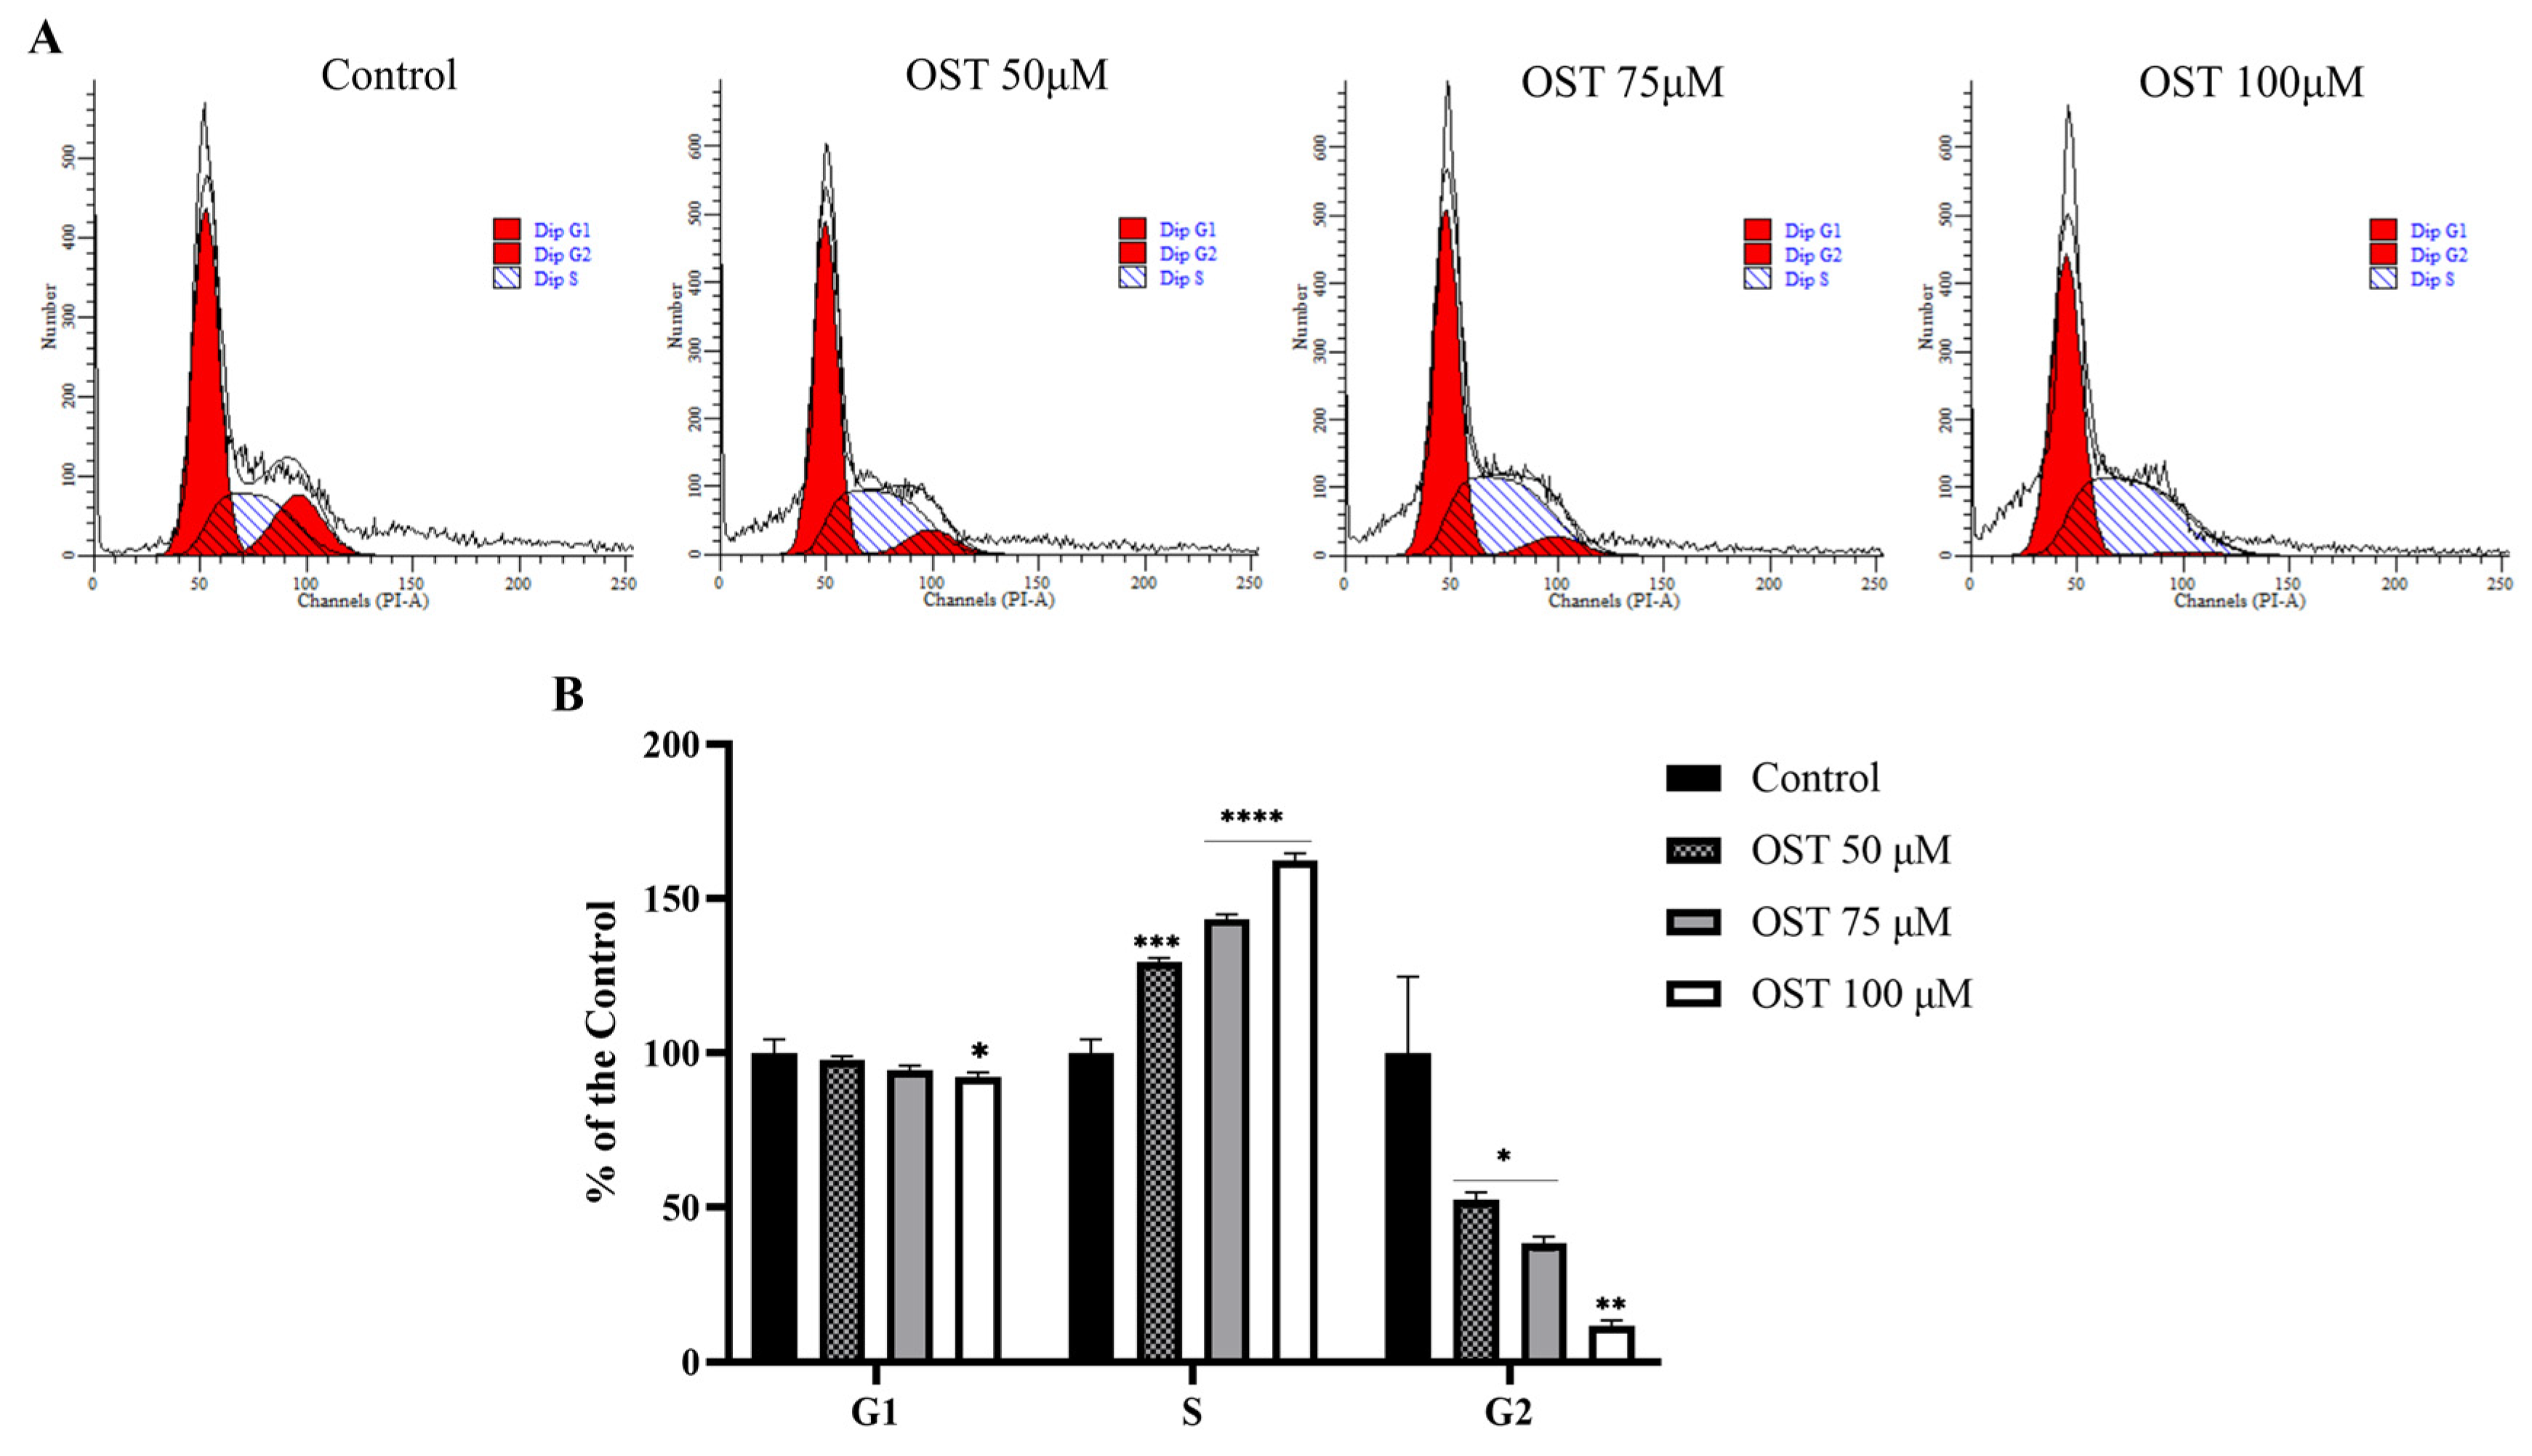
2.2. Effect of OST on Cell Cycle of Breast Cancer 4T1 Cells

Based on the MTT assay results, flow cytometry was used to explore the effect of OST on the cell cycle of 4T1 cells. As the dose of OST increased, the percentage of G1-phase cells decreased slightly compared to that in the control group. In addition, the percentage of S-phase cells increased in an OST dose-dependent manner, whereas the percentage of G2-phase cells decreased significantly (Figure 3A,B). This result indicates that OST dramatically induced S-phase cell cycle arrest in 4T1 cells, thereby inhibiting cell growth (Figure 3).

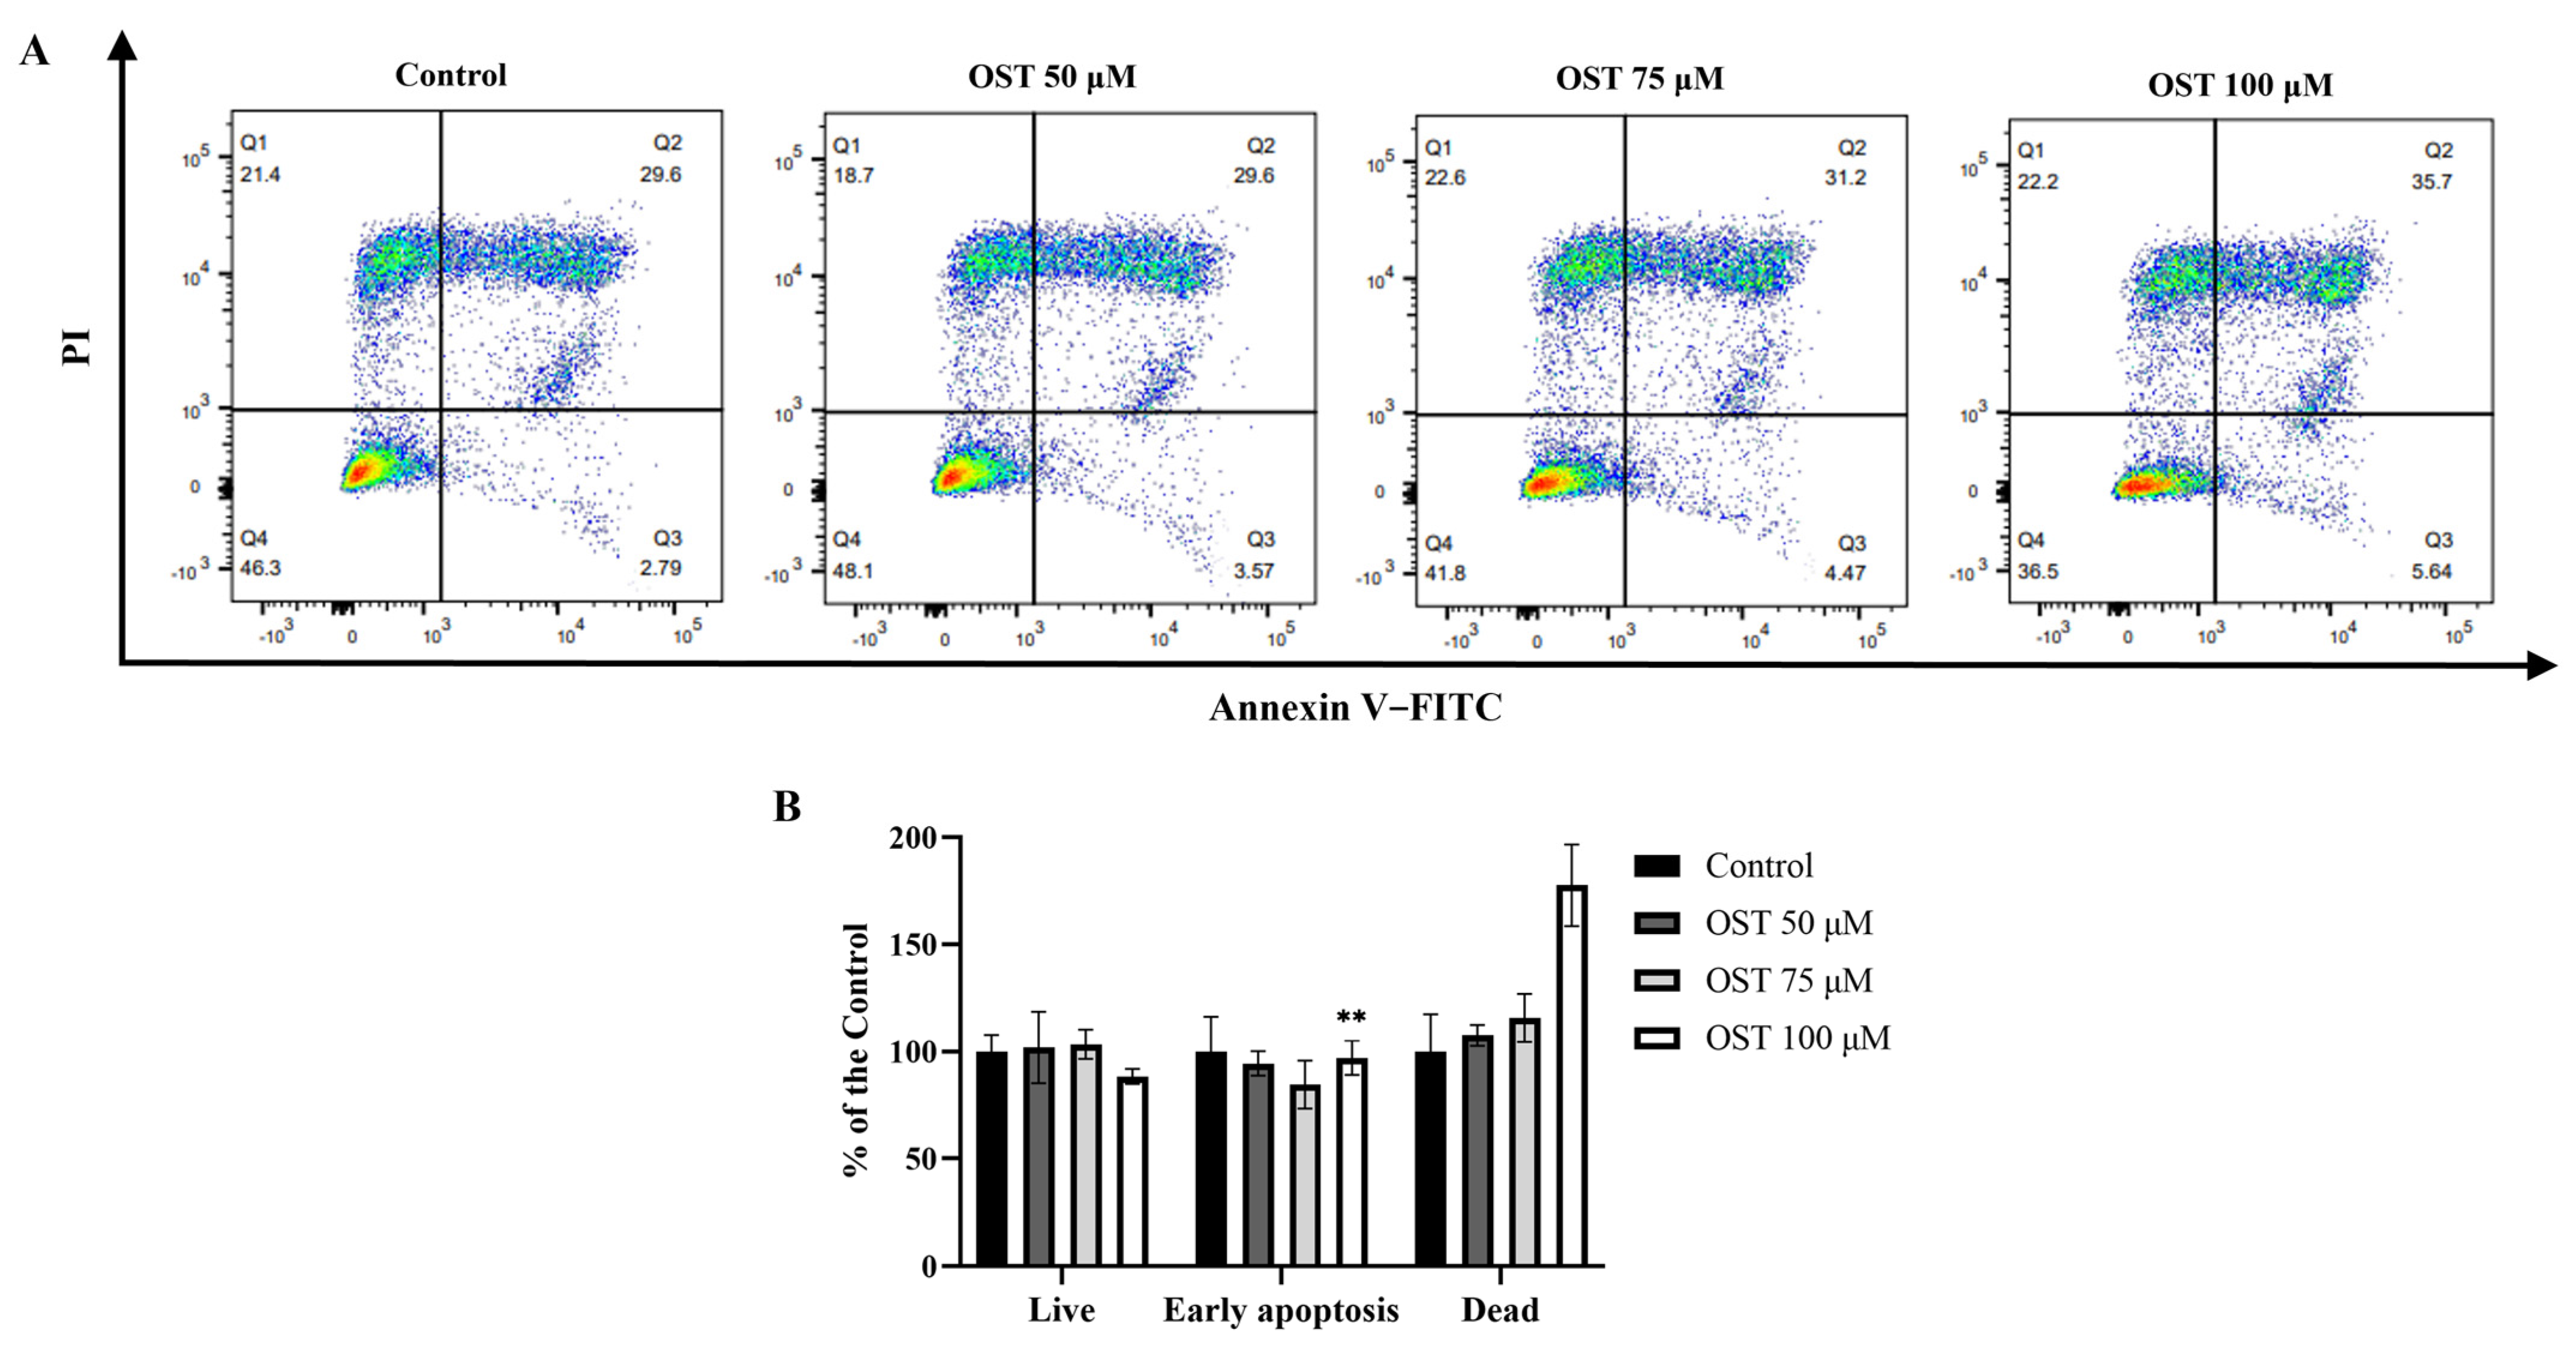
2.3. Effect of OST on Apoptosis of Breast Cancer 4T1 Cells

To investigate whether OST induces apoptosis in 4T1 cells, flow cytometry was performed using Annexin V-FITC/PI staining. After treatment with OST for 24 h, the early apoptosis rates of 4T1 cells were 3.57%, 4.47%, and 5.54%, whereas the late apoptosis rates were 29.6%, 31.2%, and 35.7%, respectively (Figure 4A). The percentage of late apoptotic 4T1 cells clearly increased with increasing concentrations of OST compared to that in the control group (0 μM) (Figure 4B). These results demonstrate that OST induced apoptosis of 4T1 cells in dose-dependent manner.

2.4. Metabolomics Analysis

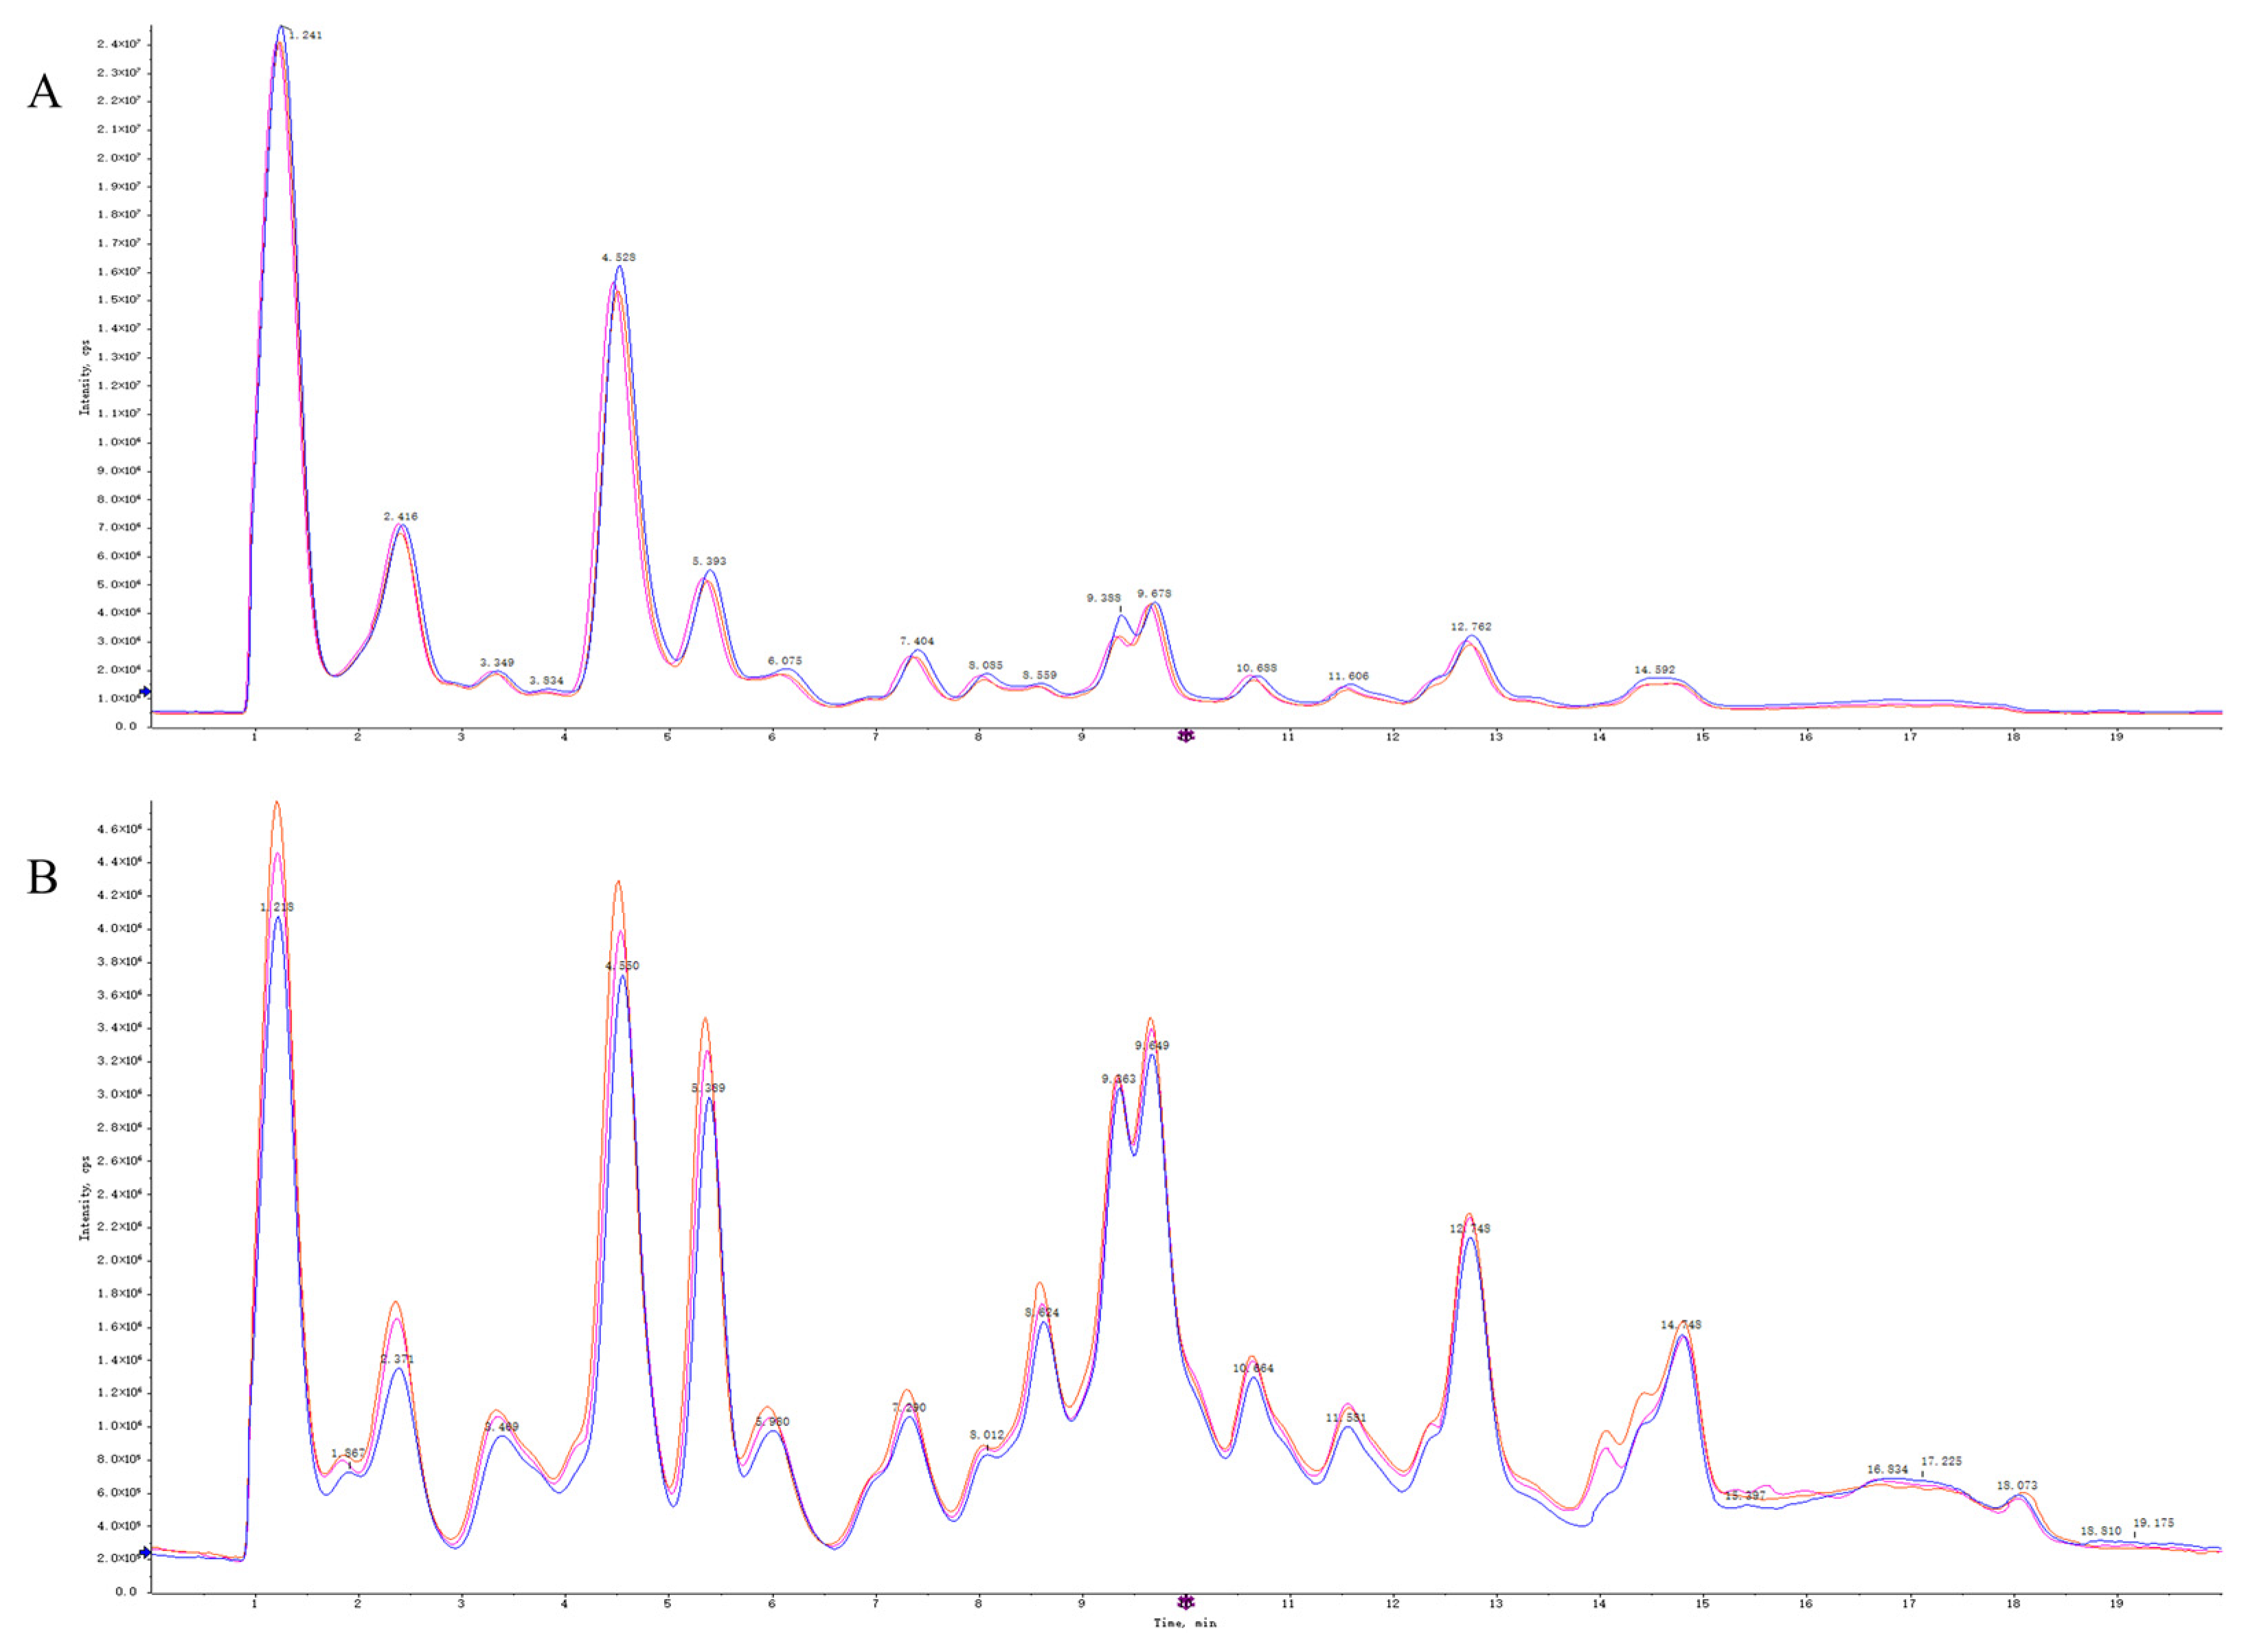
2.4.1. Quality Control Sample Detection and System Stability Analysis

Quality control (QC) samples were used to evaluate the repeatability and stability of the system. The total ion flow diagrams of the QC samples were compared by overlapping the spectra (Figure 5). The retention times and peak intensities of the various peaks detected in the QC samples in both electrospray ionization-positive (ESI+) and ESI modes largely overlapped, indicating that the methods were acceptable.

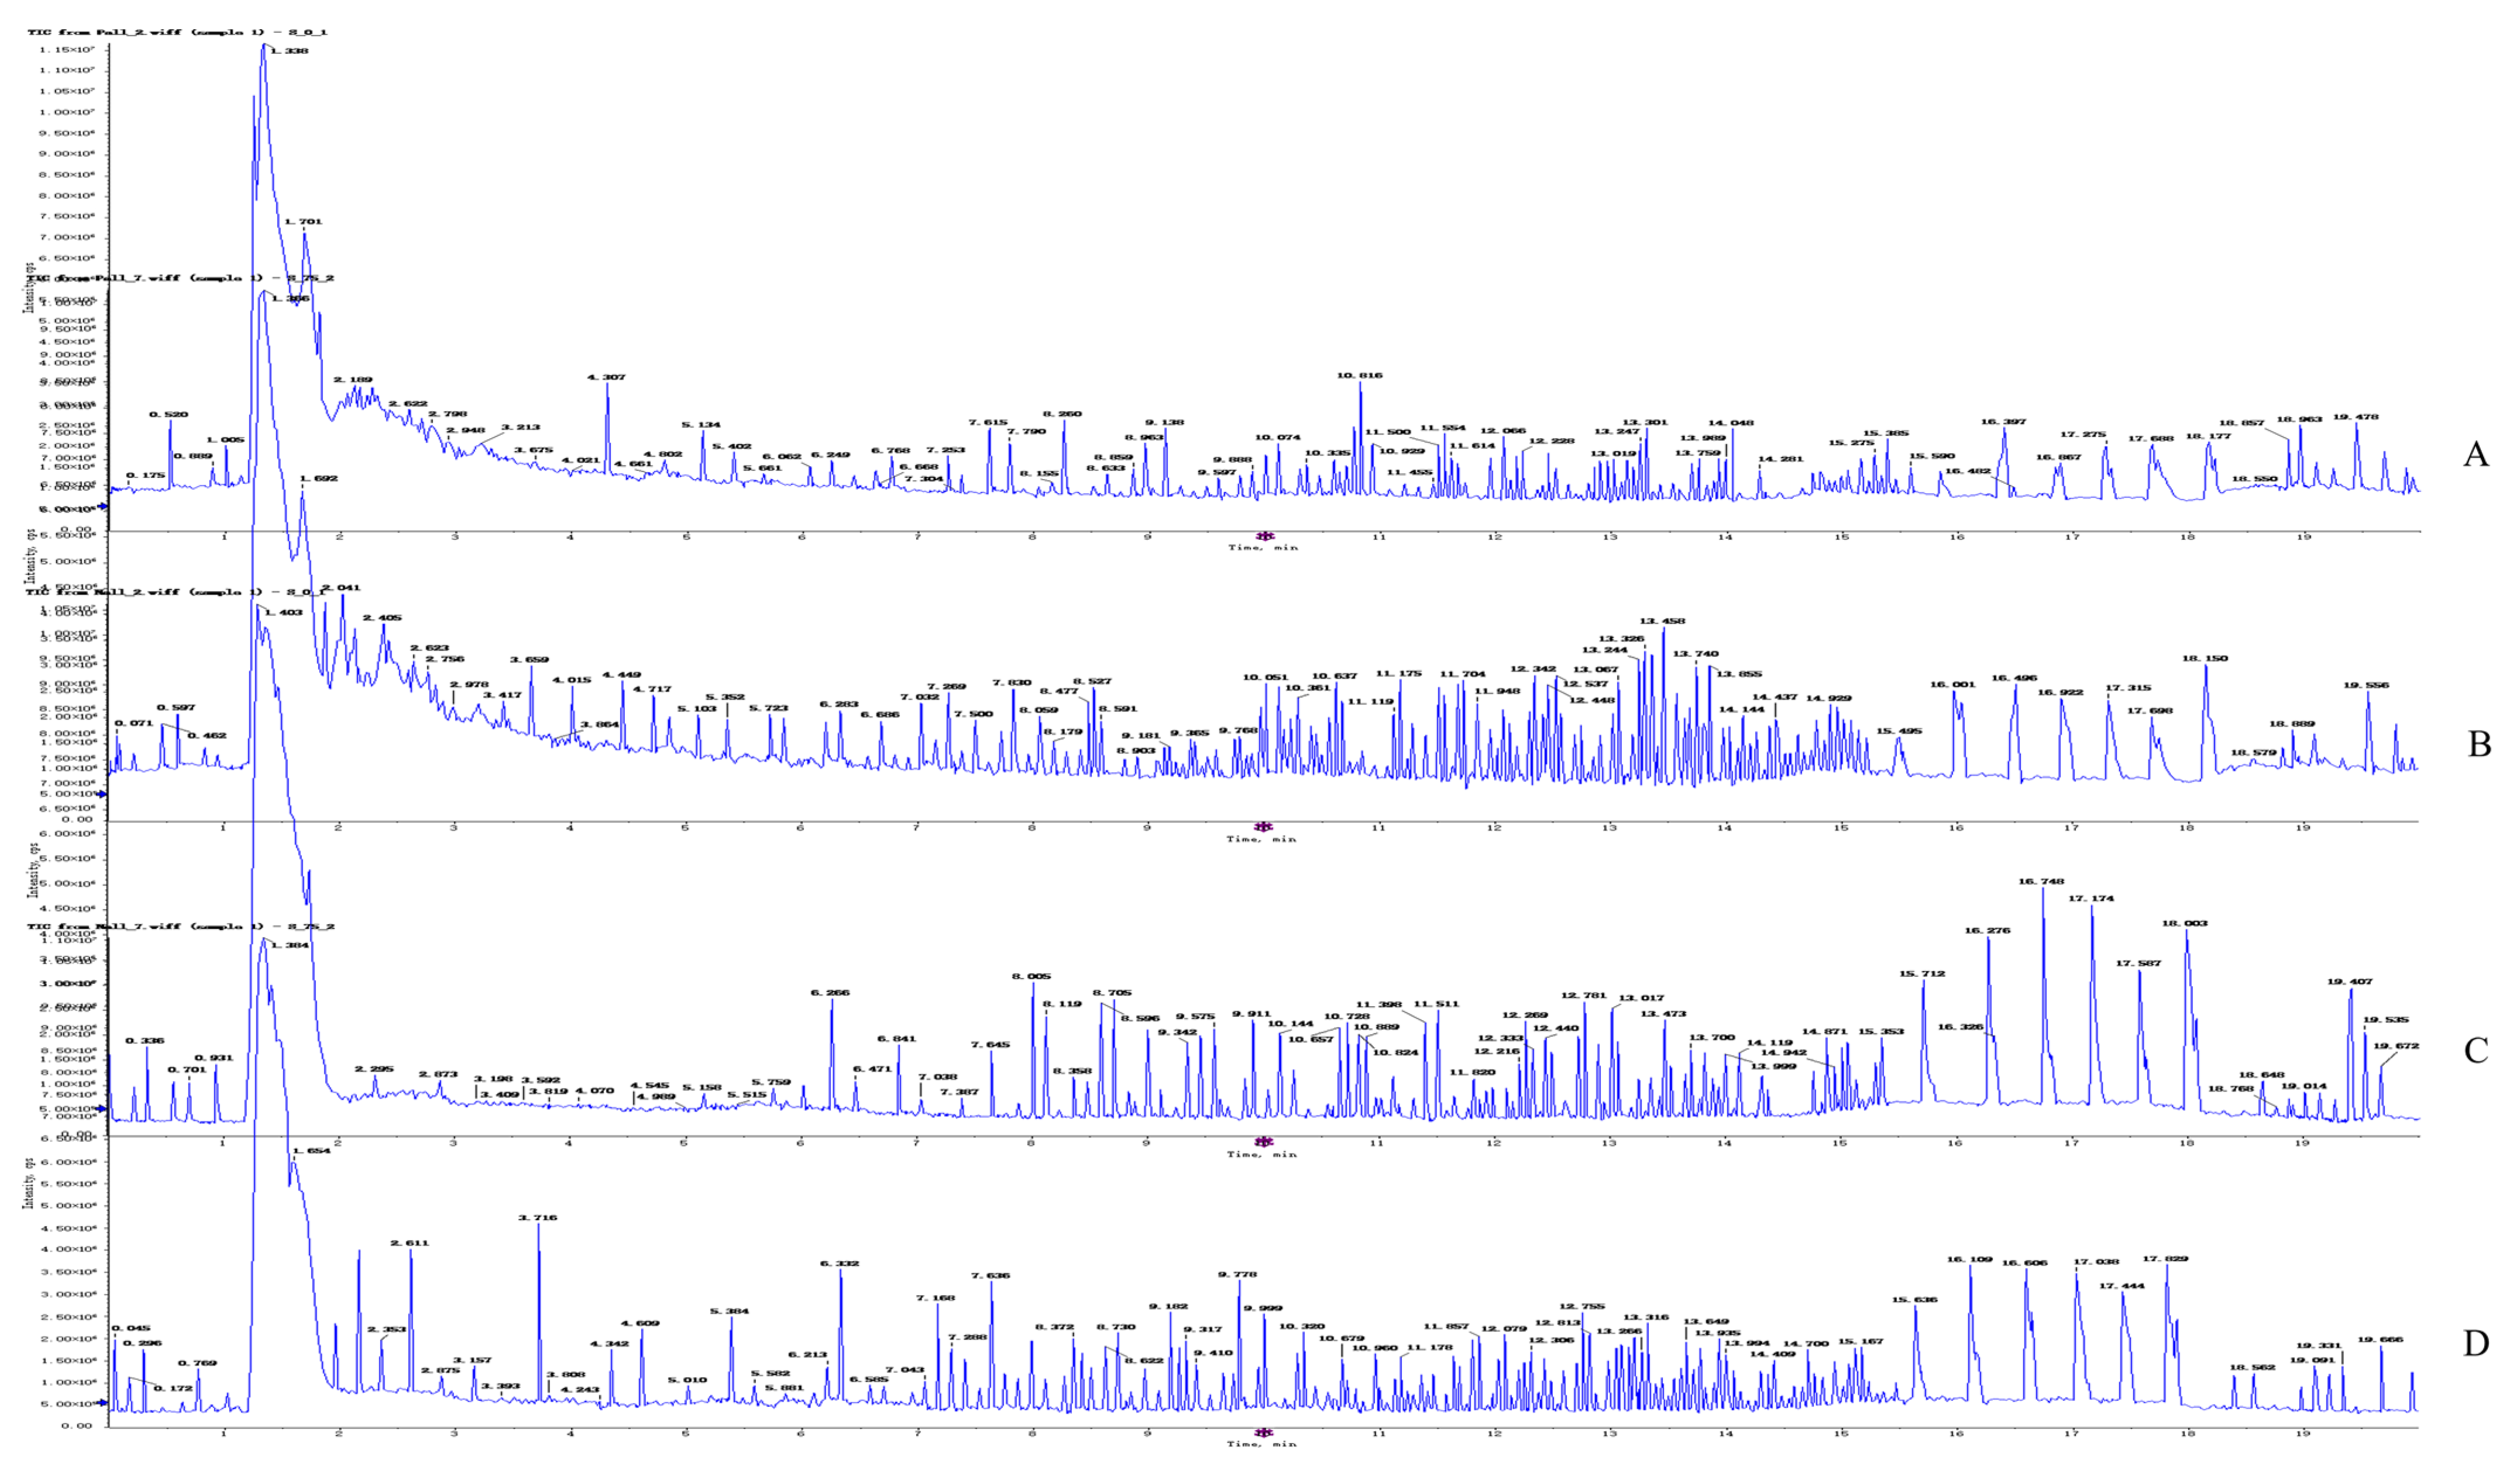
2.4.2. Metabolite Profiling of 4T1 Cells after OST Treatment

After treating 4T1 cells with OST (0 or 75 μM) for 48 h, UPLC-Q-TOF/MS was performed in both ESI+ and ESI modes. Representative total ion chromatograms of endogenous cellular metabolites were obtained, as shown in Figure 6, which revealed significant differences between groups. The extracted data were subjected to substance resolution in the public mass spectrometry database to confirm the identities and chemical structures of the labeled metabolites. In this untargeted metabolomics study, 215 and 214 metabolites were identified from the ESI+ and ESI data, respectively.

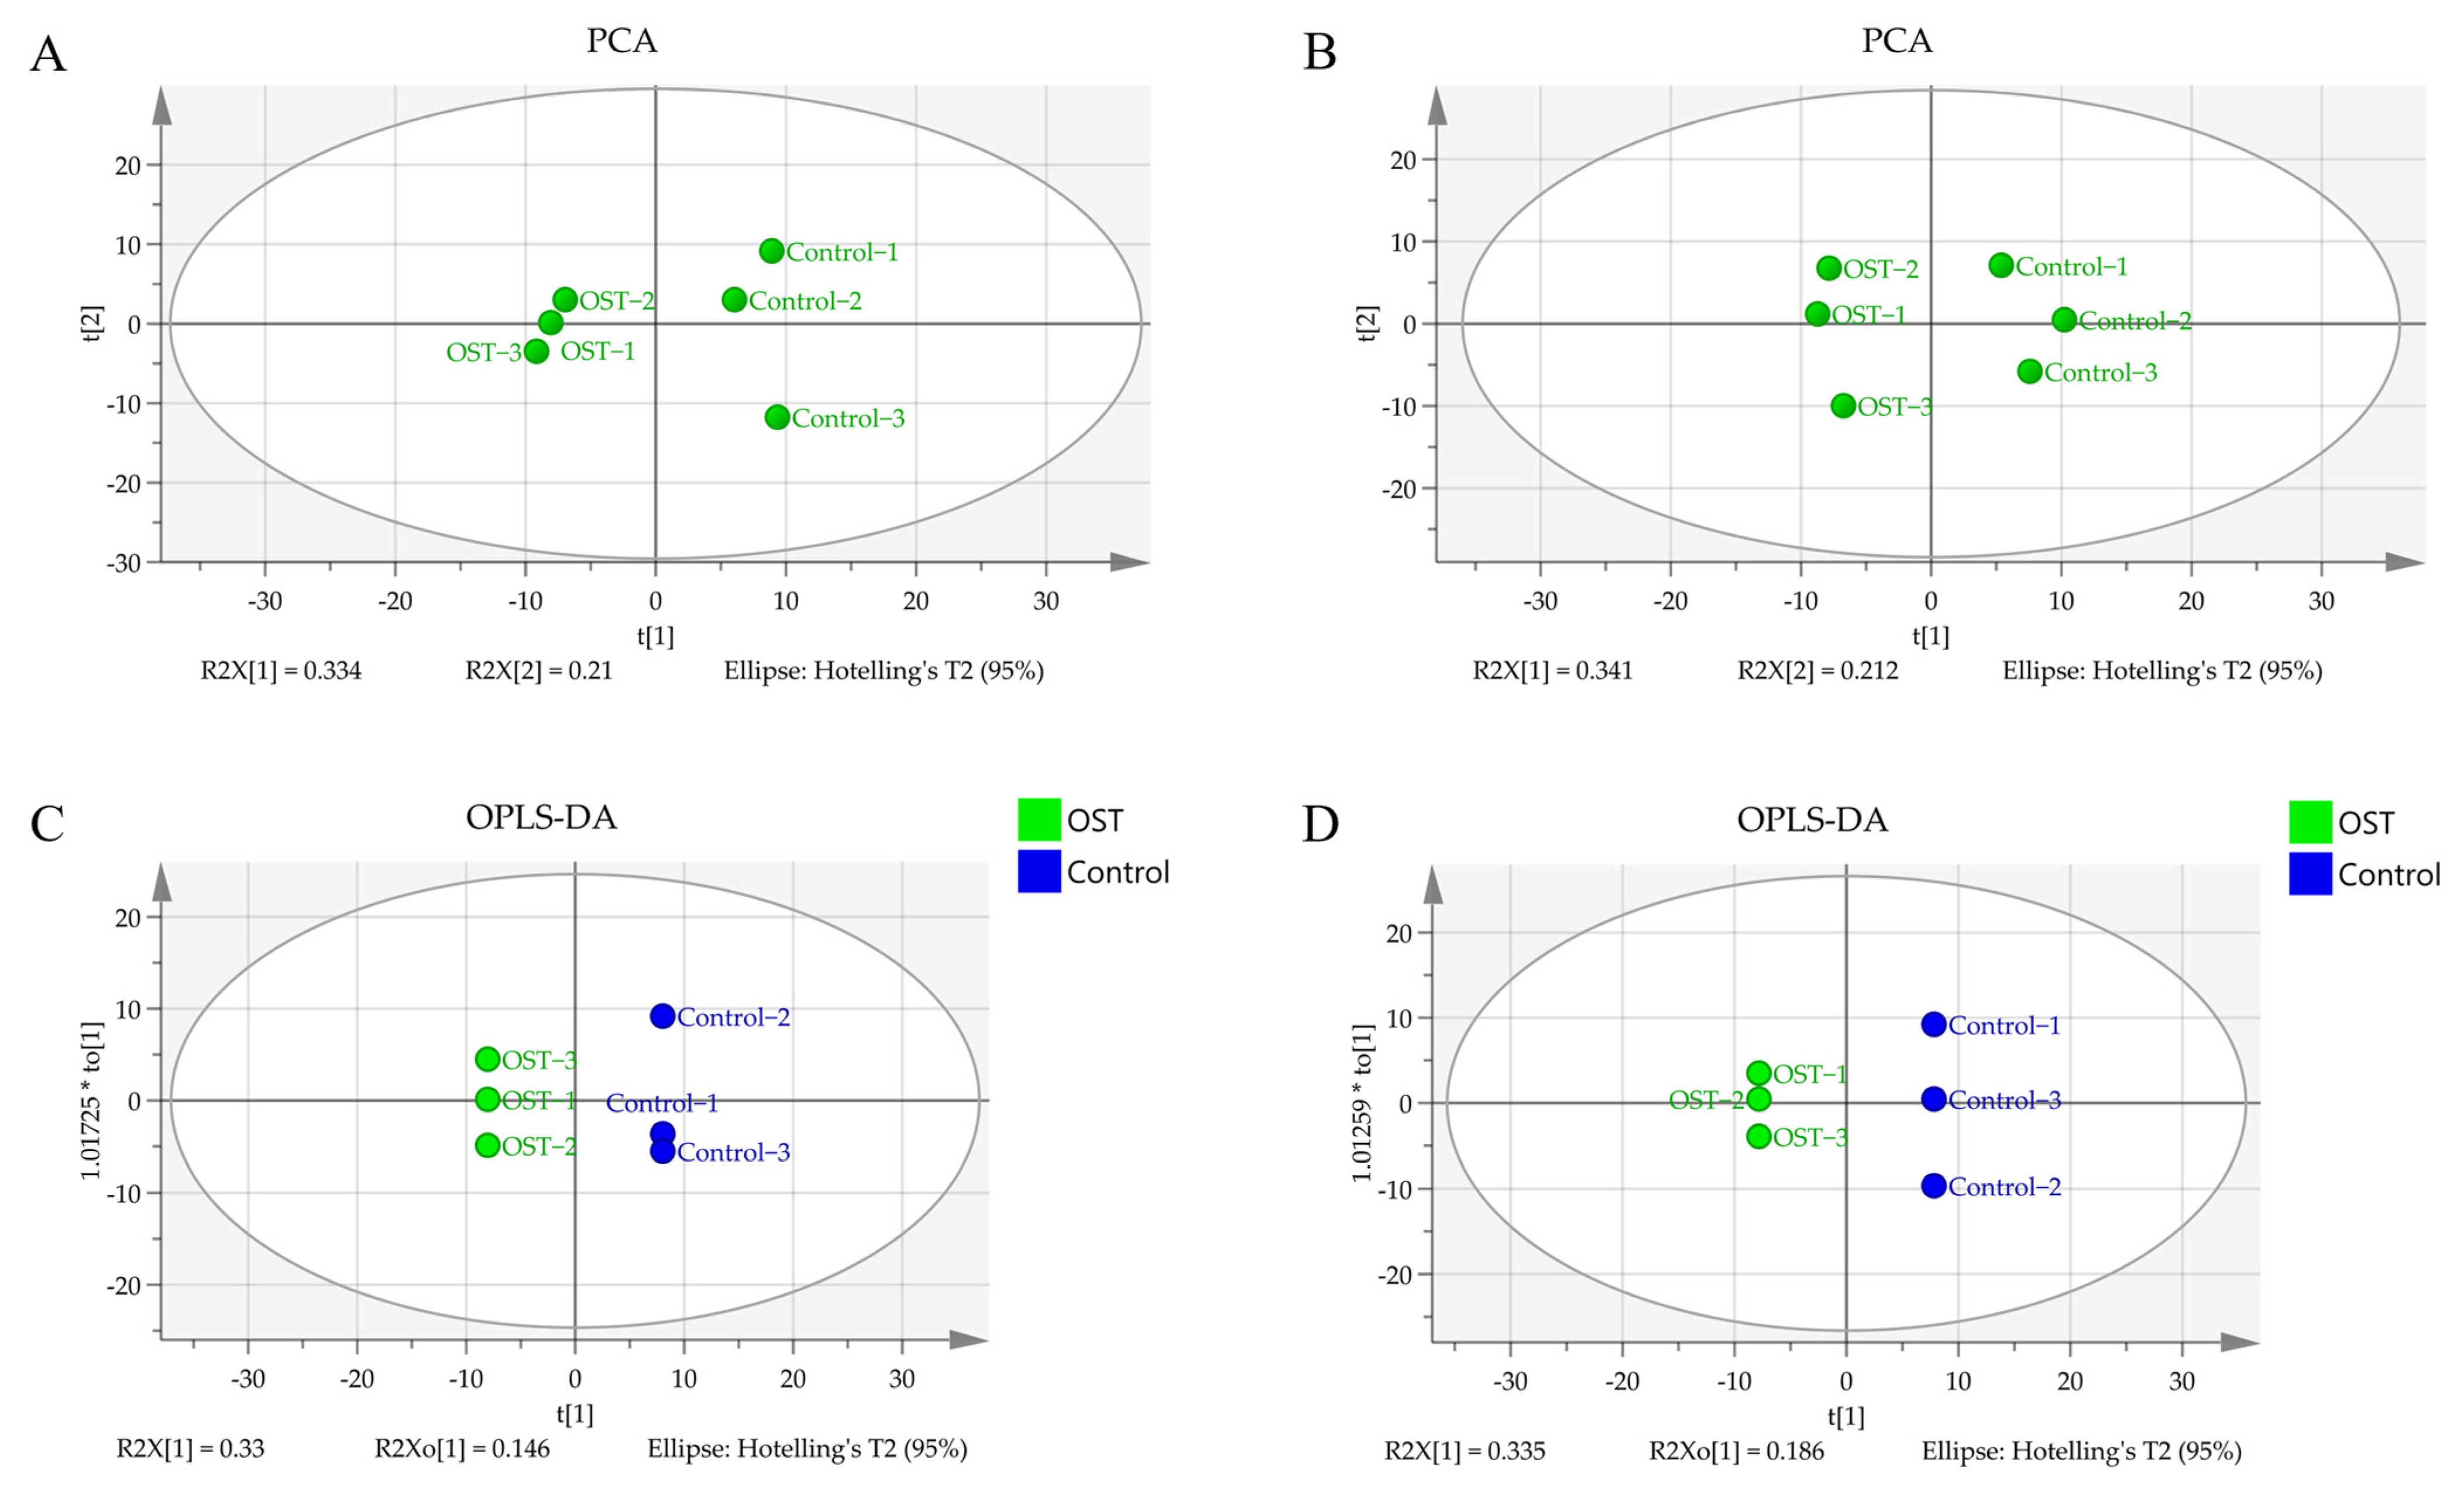
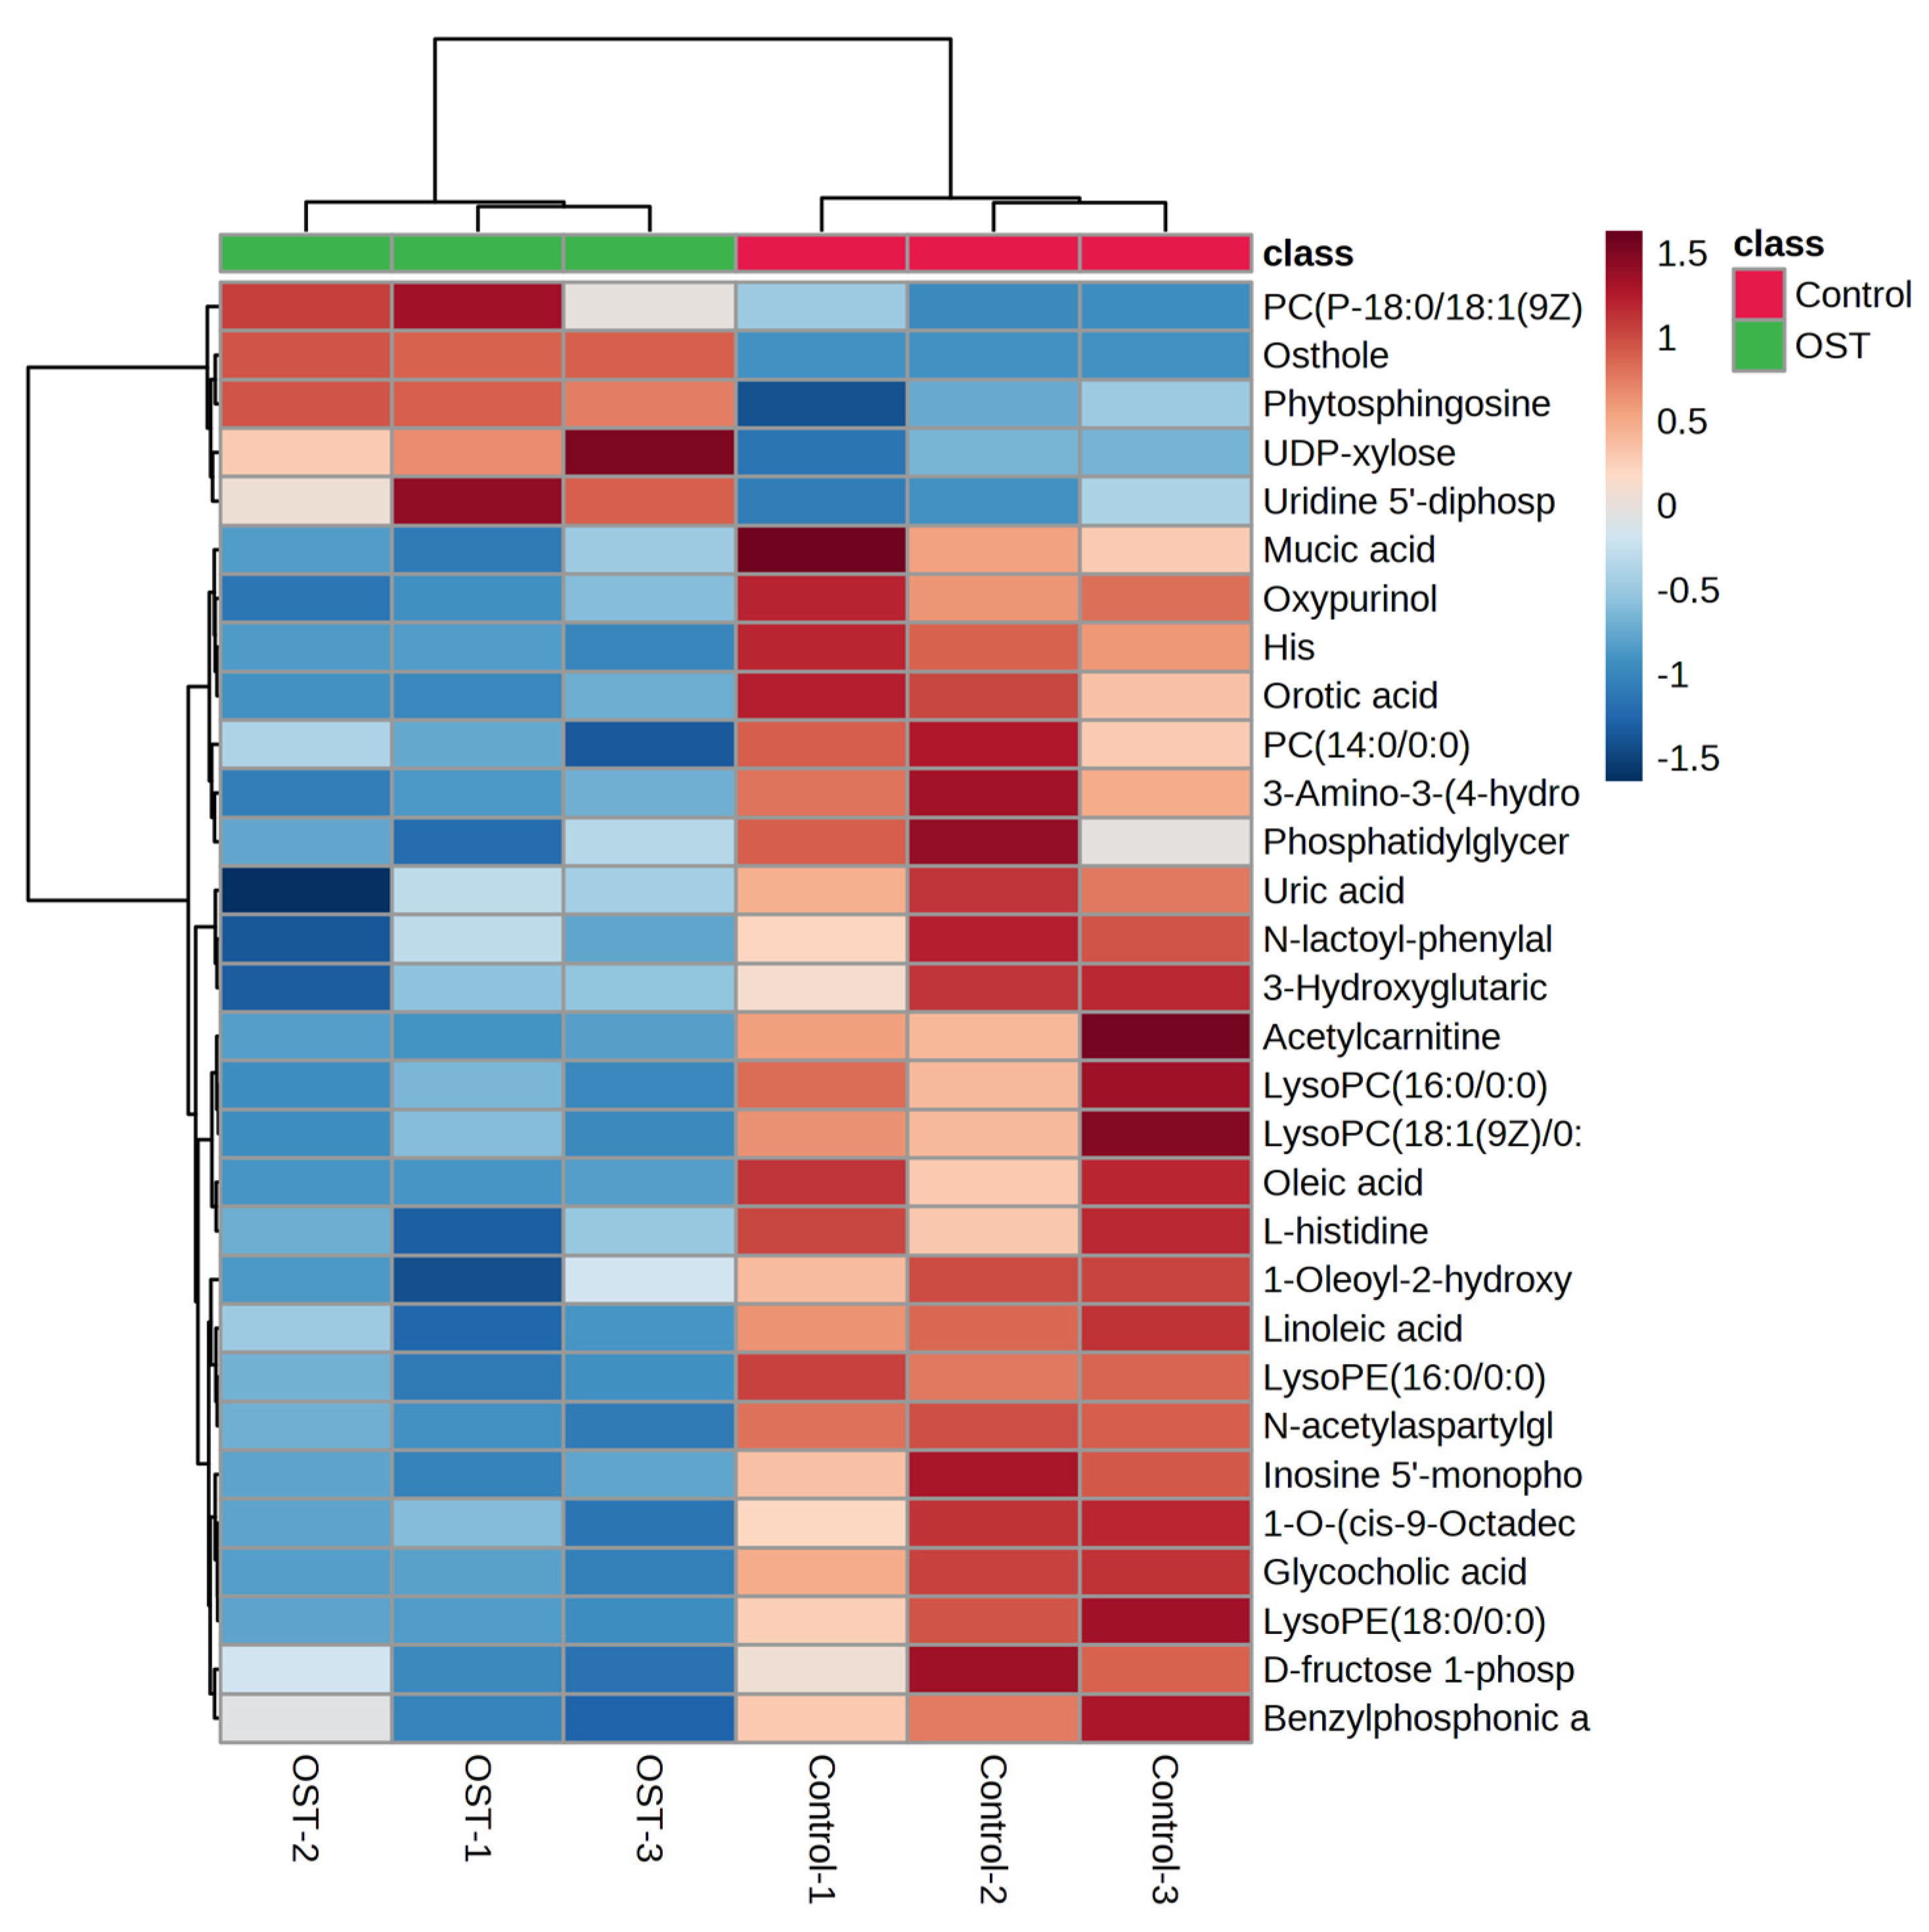
2.5. Multivariate Statistical Analysis and Screening to Identify Potential Marker Metabolites

Metabolic differences between the control and OST-treated groups were analyzed using multivariate statistics. The UPLC-Q-TOF/MS data were summarized using principal component analysis (PCA) to identify outliers. PCA (Figure 7A,B) and orthogonal projections to latent structures discriminant analysis (OPLS-DA) (Figure 7C,D) scoring plots revealed good separation between the two groups in both ESI+ and ESI modes, suggesting that OST treatment caused metabolic disturbances in 4T1 cells. The data were examined by t-test to filter potential marker metabolites with p ≤ 0.05 and variable importance in projection (VIP) ≥ 1.0. The resulting data were subjected to t-tests, and 32 potential marker metabolites were screened according to p ≤ 0.05 and VIP ≥ 1.0 (Table 1). In addition, log2fold-change ≥ 1.0 and p ≤ 0.05 were used to detect metabolites showing significant differences in metabolism. OST and PC(18:0/18:1(9Z)) were significantly upregulated (fold-change > 1), whereas linoleic acid, glycocholic acid, PC (14:0/0:0), LysoPC(16:0/0:0), 1-O-(cis-9-octadecenyl)-2-O-acetyl-sn-glycero-3-phosphocholine, LysoPC(18:1(9Z)/0:0), oleic acid, acetylcarnitine, LysoPE(16:0/0:0), orotic acid, mucic acid, N-acetylaspartylglutamate, 3-hydroxyglutaric acid, benzylphosphonic acid, 3-amino-3-(4-hydroxyphenyl) propionic acid, and phosphatidylglyceride18:2–18:2 were significantly downregulated (fold-change < 1). Among these, LysoPC(16:0/0:0), LysoPC(18:1(9Z)/0:0), PC(P-18:0/18:1(9Z)), linoleic acid, PC(14:0/0:0), 1-oleoyl-2-hydroxy-sn-glycero-3-PG (sodium salt), oleic acid, LysoPE(18:0/0:0), LysoPE(16:0/0:0), and phosphatidylglyceride 18:2–18:2 are involved in lipid metabolism. To visually identify potential changes in marker metabolites between groups, we clustered 32 marker metabolites for thermal analysis (Figure 8). Each small square represents a potential metabolite, and its color indicates its expression level. Higher expression levels are indicated as a deeper color (red for upregulation, blue for downregulation). Compared to those in the control groups, the relative levels of five marker metabolites were increased and the levels of 27 marker metabolites were decreased after OST treatment.

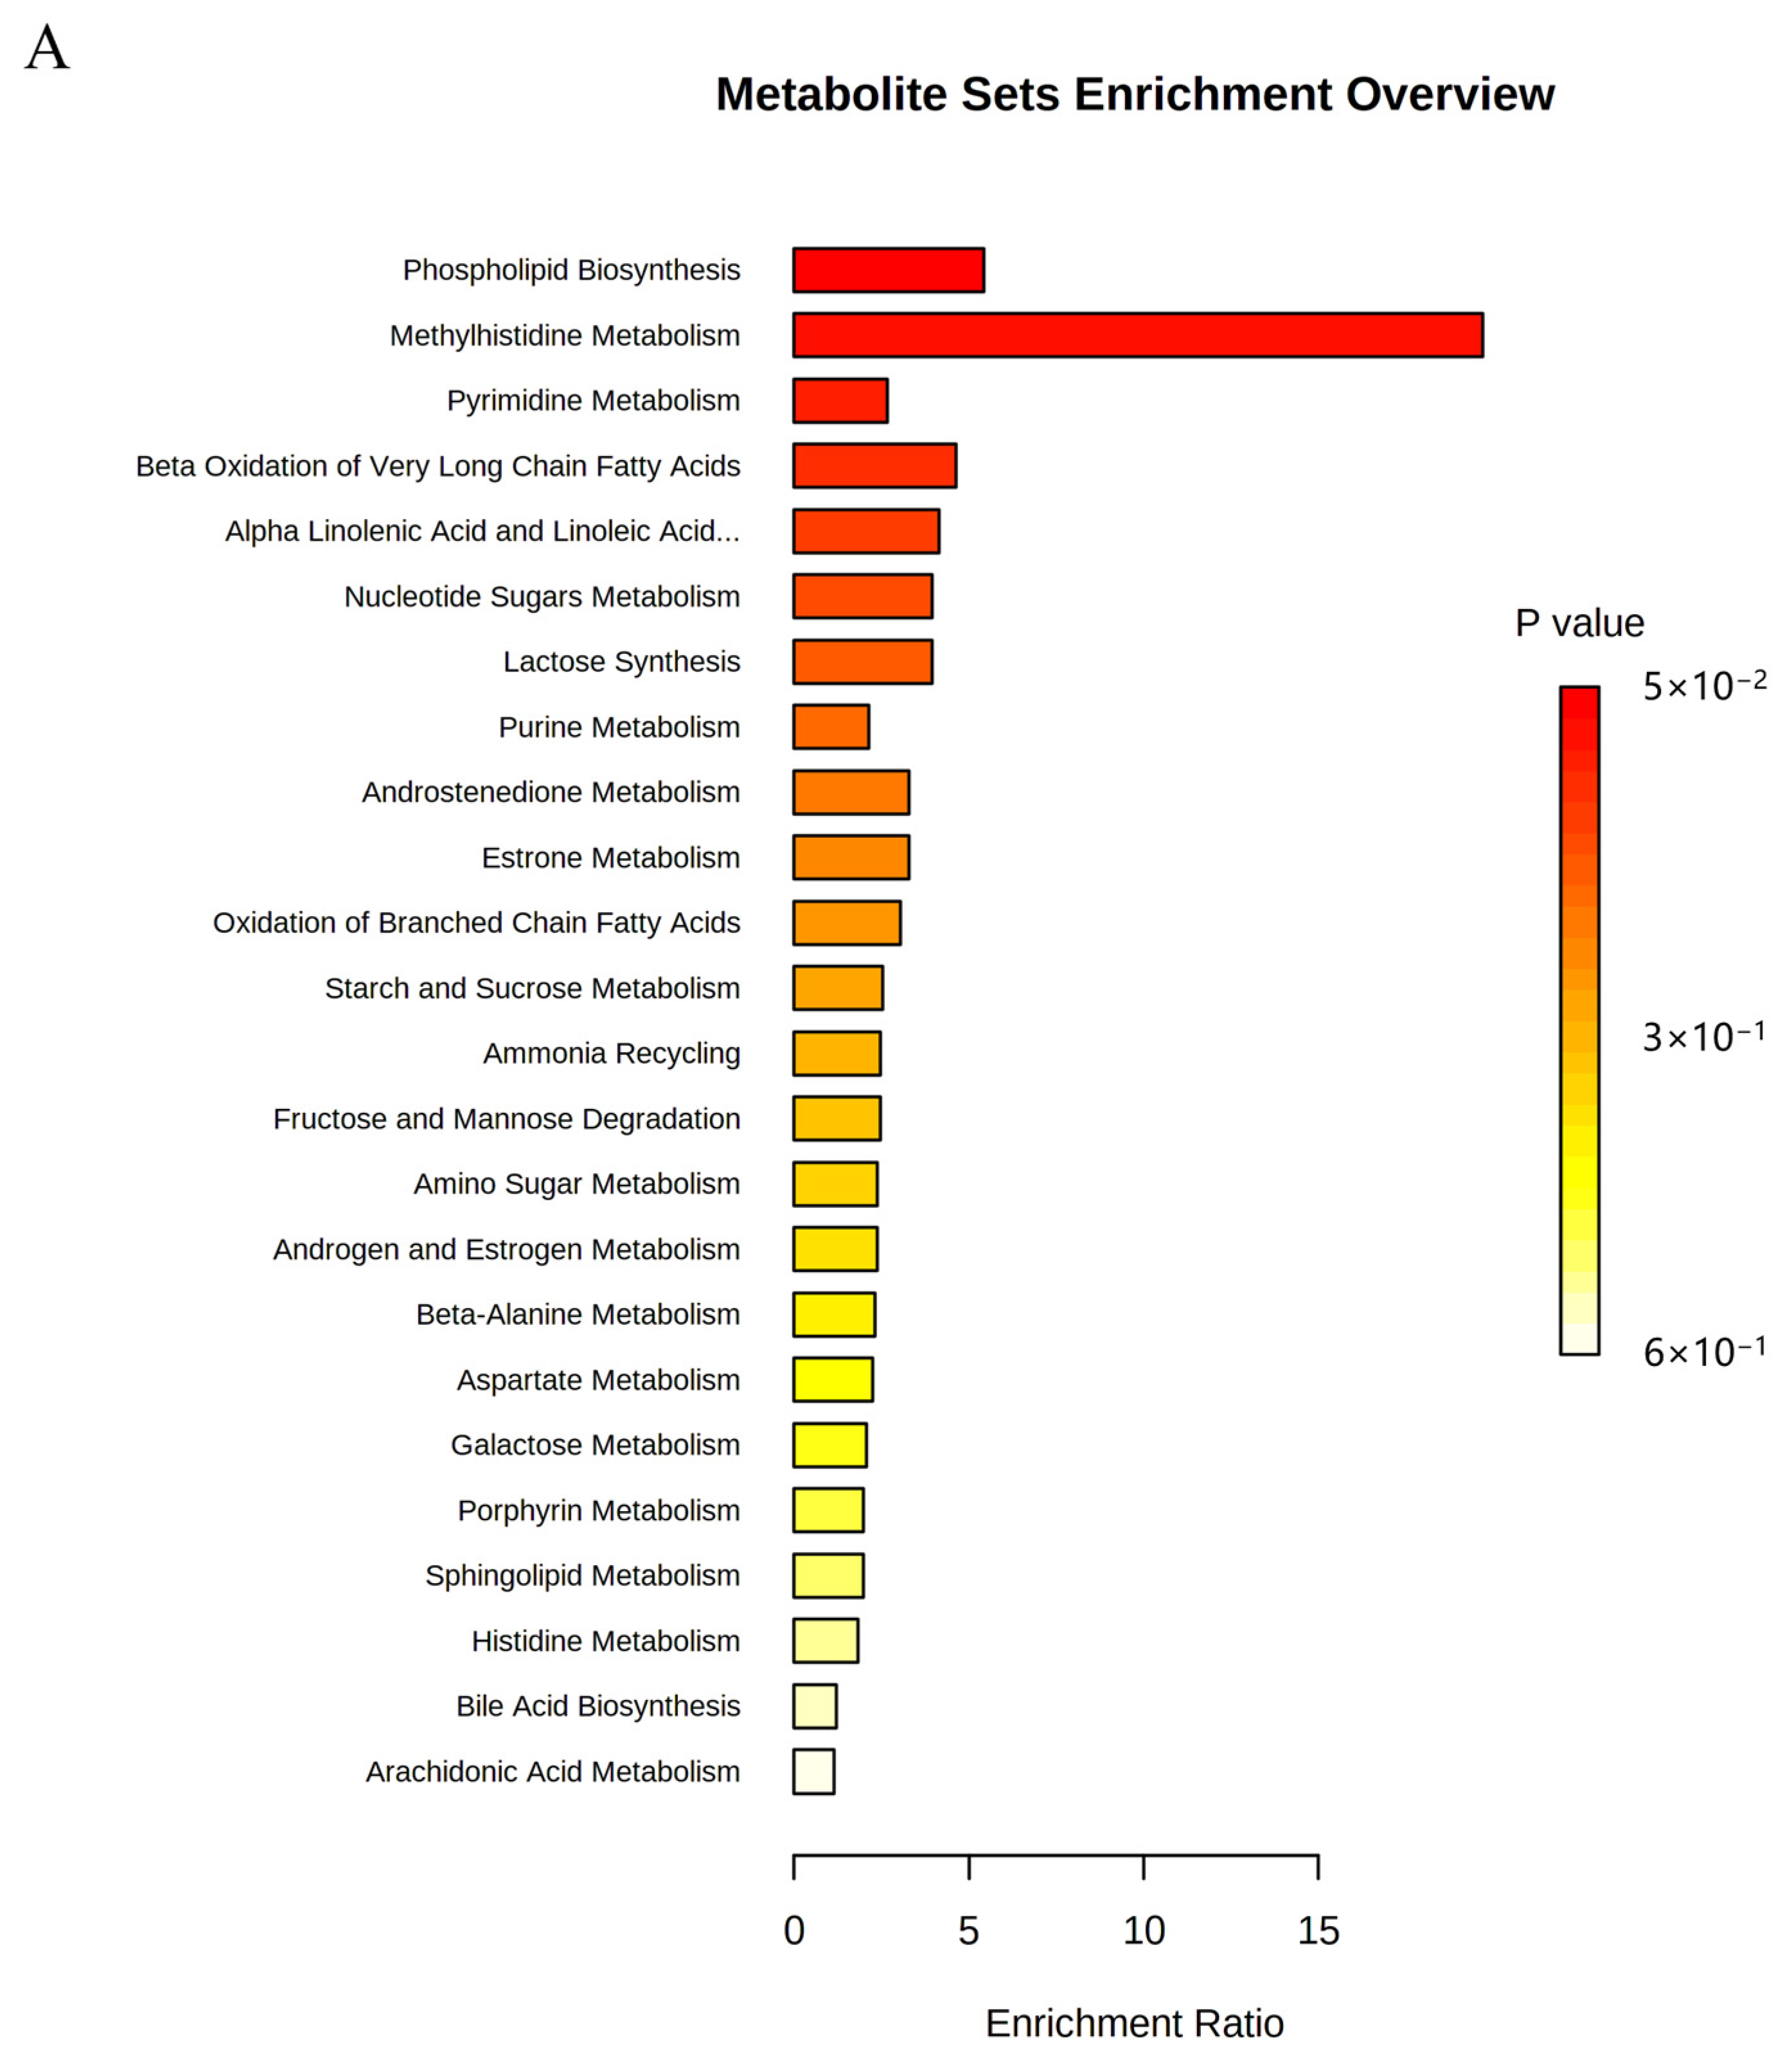
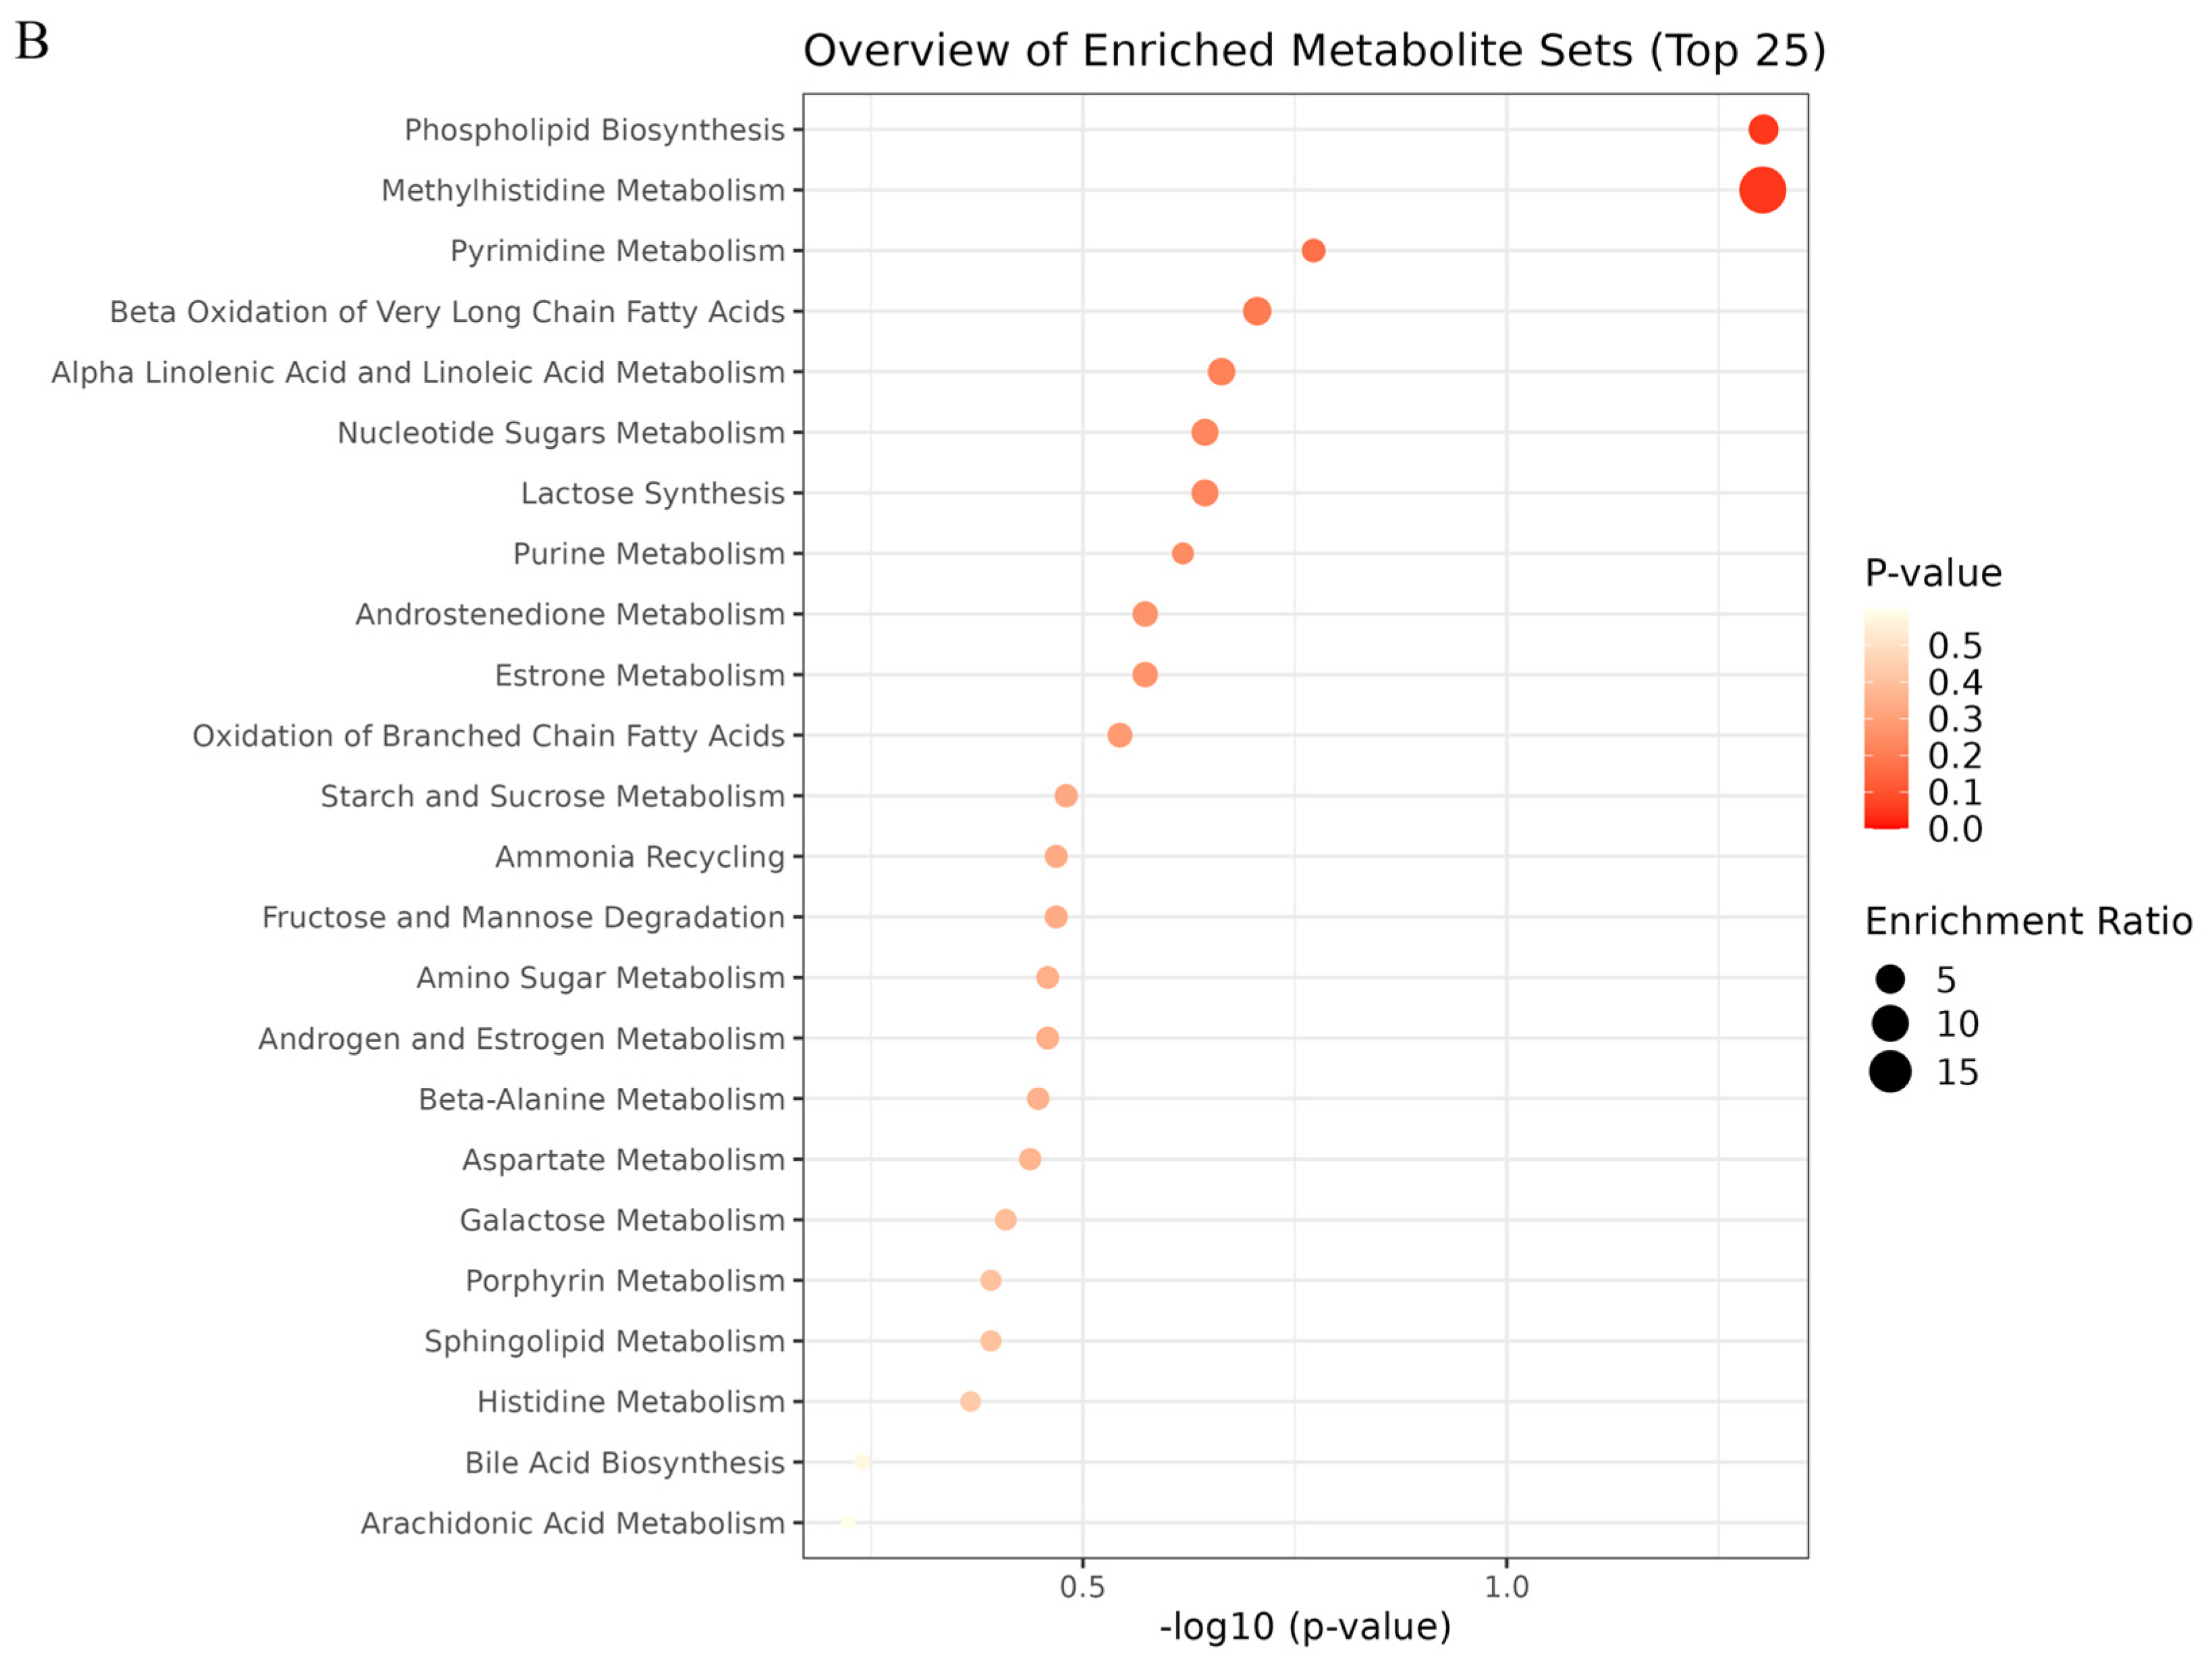
2.6. Metabolic Pathway Analysis

To evaluate the effect of OST on 4T1 cell metabolism, the MetaboAnalyst5.0 database was used for metabolic pathway analysis of the prominent metabolites listed in Table 1. Metabolic pathways with effect values of p < 0.2 were selected as potential critical pathways. The regulation of 4T1 cell metabolism by OST involved 24 metabolic pathways (Figure 9A,B). Among them, phospholipid biosynthesis, methyl histidine metabolism, pyrimidine metabolism, and beta-oxidation of very long chain fatty acids were considered as key metabolic pathways through which OST affected 4T1 cells. The 20 metabolic pathways with p > 0.2, including α-linolenic and linoleic acid metabolism, purine metabolism, and oxidation of branched chain fatty acids, are summarized in Table 2.

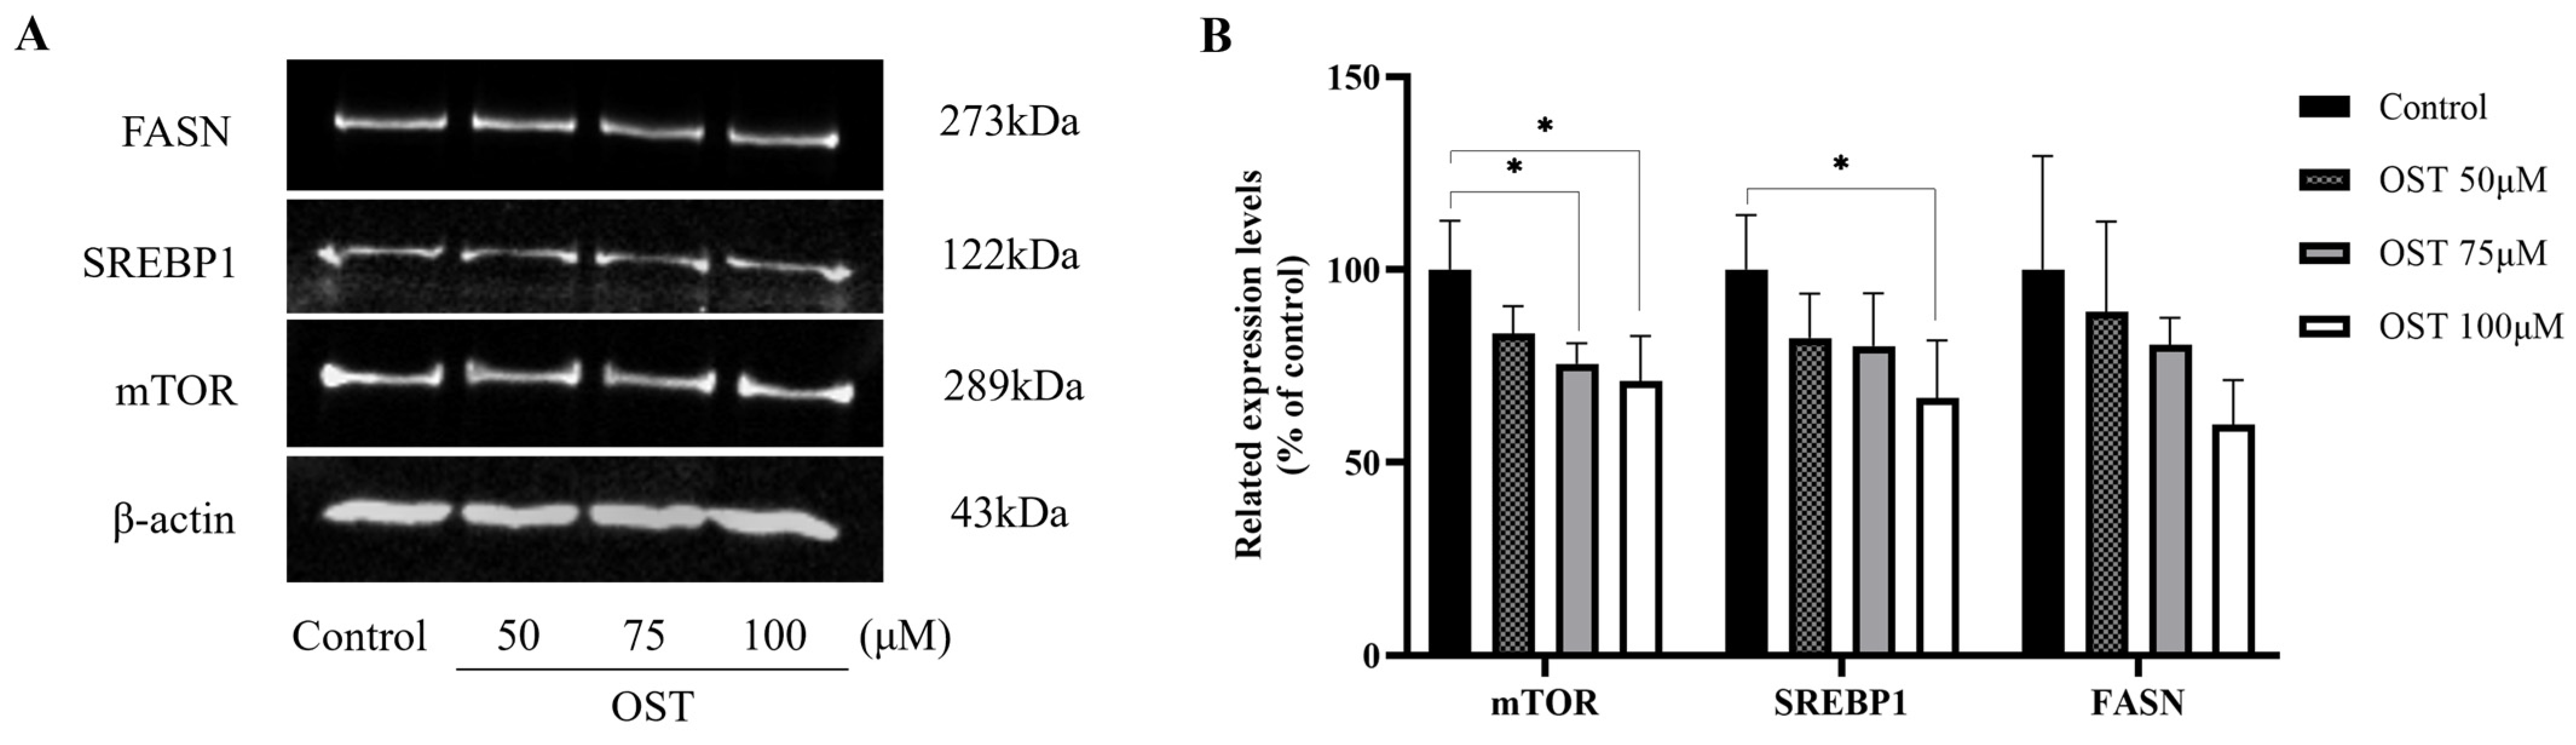
2.7. Effect of OST on mTOR/SREBP1/FASN Pathway Proteins in Breast Cancer 4T1 Cells

We examined the expression of mTOR, SREBP1, and FASN in 4T1 cells. The results of western blotting performed to detect protein expression levels are shown in Figure 10. As expected, mTOR, SREBP1, and FASN protein expression was downregulated after OST treatment of 4T1 cells compared to that in the control (0 μM) (Figure 10A). Furthermore, the protein expression of mTOR, SREBP1, and FASN was downregulated in a concentration-dependent manner as the concentrations of OST increased (Figure 10B). OST may induce downregulation of SREBP1 by inhibiting the expression of mTOR, leading to inhibition of FASN expression, thereby inhibiting fatty acid synthesis and esterification to phospholipids (LysoPC, LysoPE or L-acetylcarnitine), and ultimately promoting apoptosis. These results indicate that OST reduced 4T1 cell viability and S-phase cell block, as well as apoptosis, which may be related to inhibition of the mTOR/SREBP1/FASN pathway.

3. Discussion

OST is a simple coumarin derivative that exerts anti-tumor activity against many types of tumors through various mechanisms, including inhibition of tumor cell proliferation, induction of tumor cell cycle arrest, and mediation of tumor cell apoptosis [6,14]. OST also inhibits breast cancer cell lines. However, the pathogenesis of breast cancer is more complicated, and the anti-tumor mechanisms of OST treatment in breast cancer are not well understood. In this study, we investigated the anti-tumor effects and mechanisms of OST on breast cancer 4T1 cells and the possible underlying mechanisms. First, we investigated the inhibitory effect of OST on 4T1 cells. The results showed that OST inhibited the proliferation of 4T1 cells in dose- and time-dependent manners. Additionally, OST blocked the 4T1 cells cycle in S-phase and induced apoptosis. Interestingly, phospholipid biosynthesis, methyl histidine metabolism, beta-oxidation of extra long chain fatty acids and pyrimidine metabolism were the most relevant pathways for the antitumor effects of OST on 4T1 cells. Because phospholipid biosynthesis and β-oxidation of very long chain fatty acids are involved in lipid metabolism via esterification and β-oxidation of fatty acids, respectively [20], our data indicate that OST can regulate lipid metabolism.
Lipid metabolism is the most important pathway in cancer, as it generates substances for cancer cell growth and can regulate cellular signaling pathways through downstream products [29]. In addition, the malignant proliferation of cancer cells requires large amounts of energy and macromolecules, inducing carbohydrates, proteins, lipids, and nucleic acids. Particularly, mTOR is a major regulator of cellular metabolism that promotes cellular anabolism to produce various macromolecules such as lipids, proteins, and nucleic acids [23]. OST inhibits FASN expression in HER2-overexpressing breast cancer cells by regulating the Akt/mTOR pathway [30]. Furthermore, FASN promotes breast cancer metastasis by mediating changes in specific fatty acids [21]. These results suggest that mTOR and FASN can be used as drug targets for breast cancer treatment. Furthermore, SREBP1, a transcription factor, is a transcriptional regulator that controls fatty acid and cholesterol biosynthesis and is associated with cell cycle regulation and apoptosis in cancer cells [21,31]. Inhibiting FASN signaling induces cell cycle arrest and reduced proliferation of breast cancer cells [32]. In this study, we explored the effect of OST on breast cancer 4T1 cells in the mTOR/SREBP1/FASN signaling pathway. Our results suggest that OST induces downregulation of SREBP1 by inhibiting the expression of mTOR, thereby leading to inhibition of FASN expression, which reduces fatty acid synthesis and esterification to phospholipids (LysoPC, LysoPE, or L-acetylcarnitine) and ultimately promotes apoptosis.
Malignant cells have greatly increased levels of total fatty acids during proliferation, migration, and invasion [21]. We examined OST metabolites in 4T1 cells to identify potential biomarkers. We screened 32 potential biomarkers, including osthole, linoleic acid, glycocholic acid, PC (14:0/0:0), LysoPC (16:0/0:0), L-histidine, LysoPC (18:1(9Z)/0:0), oleic acid, D-fructose-1-phosphate, L-acetylcarnitine, PC(P-18:0/18:1(9Z)), LysoPE (16:0/0:0), oxypurinol, glutathione, galactonic acid, orotic acid, inosine 5′-monophosphate (IMP), LysoPE (18:0/0:0), UDP-xylose, uridine 5′-diphosphate, phosphatidylglyceride18:2–18:2, and uric acid. Of these, LysoPC (16:0/0:0) and LysoPE (16:0/0:0) are produced via phospholipid biosynthesis. L-acetylcarnitine is a product of beta-oxidation of very long chain fatty acids and oxidation of branched chain fatty acids; IMP and uric acid are products of purine metabolism, and L-histidine is a product of methyl histidine metabolism. Lysophosphatidylcholines (LysoPCs) are a class of compounds with a constant polar head and are distinguished by their fatty acyl groups [33], which can be formed through oxidation of fatty acids [34] or hydrolysis of phosphatidylcholine by phospholipase A2. They can be used as biomarkers for clinical diagnosis, therapy, and pathophysiological studies [35]. Consequently, LysoPC (16:0/0:0), LysoPE (16:0/0:0), and L-acetylcarnitine may be biomarkers for the diagnosis of breast cancer. As a component of cell membranes, phospholipids are produced by esterification, followed by the involvement of FASN in fatty acid synthesis [20], which affects cell proliferation. In this study, we found that phospholipid (LysoPC and LysoPE) levels decreased significantly after OST treatment, suggesting that OST blocked phospholipid synthesis in 4T1 cells by inhibiting mTOR activation and modulating SREBP1 to inhibit FASN activity, which resulted in inhibition of cell proliferation and cell cycle arrest. Consistent with previous studies [32], the levels of unsaturated fatty acids were reduced when we inhibited the mTOR/SREBP1/FASN pathway, resulting in inhibition of 4T1 cell proliferation and arrest of the cell cycle. FASN may inhibit the development and progression of breast cancer by altering the levels of specific fatty acids (LysoPC (16:0/0:0), LysoPE (16:0/0:0), or L-acetylcarnitine). Some studies reported that linoleic acid and oleic acid promote the growth, metastasis, and invasion of breast cancer cells [21]. In contrast, the levels of linoleic and oleic acids decreased after OST treatment in this study, confirming that OST inhibits the growth of 4T1 cells. These results suggest that OST mediates the esterification of intracellular fatty acids into phospholipids for incorporation into cell membranes through the mTOR/SREBP1/FASN signaling pathway to inhibit cell proliferation, cell cycle arrest, and apoptosis induction.
Nucleotides are composed of a nitrogenous base (purine or pyrimidine), a pentose, and one or more phosphate groups and are involved in cell metabolism and physiological regulation [36]. Notably, IMP is an intracellular precursor of adenosine monophosphate and guanosine monophosphate and acts as an extracellular signaling molecule and plays an important role in intracellular purine metabolism [37]. IMP can be catalyzed by a series of enzymatic reactions that result in the production of uric acid [38]. Orotic acid is a precursor of pyrimidine nucleotide biosynthesis [39] and is related to nucleotide metabolism. In the current study, OST blocked 4T1 cells in S-phase (Figure 3), during which cells mainly undergo DNA replication. Orotic acid levels were significantly downregulated, suggesting a reduction in the nucleotide feedstock and inhibition of S-phase DNA replication. In addition, both IMP and uric acid levels were reduced, and catabolism of purine nucleotides may have occurred in 4T1 cells after OST treatment. Thus, the cycle-blocking effect of OST on 4T1 cells may be related to pyrimidine metabolism and purine nucleotide catabolism. These data suggest that OST diminishes nucleotide synthesis and blocks the growth of 4T1 cells to prevent the development and progression of breast cancer.

4. Materials and Methods

4.1. Materials

Osthole (>98% purity) was purchased from Shanghai Yuanye Biotechnology Co., Ltd. (Shanghai, China). Dulbecco’s Modified Eagle Medium (DMEM) and phosphate-buffered saline (PBS) were purchased from Gibco (Grand Island, NY, USA). Fetal bovine serum was obtained from Biological Industries (Beit Haemek, Israel). Penicillin streptomycin (100×) was purchased from Moocow Biotechology (Guangzhou, China). Trypsin-EDTA (1×, 0.25%) was purchased from Suzhou New Saimei Biotechnology Co., Ltd. (Suzhou, China). 3-(4,5-Dimethylthiazol-2)-2,5-diphenyltetrazolium bromide salt was purchased from Macklin (Shanghai, China). The Cell Cycle Staining Kit and Annexin V-FITC/PI Apoptosis Kit were purchased from Multi Sciences (Hangzhou, China). Acetonitrile was purchased from Thermo Fisher Scientific (Waltham, MA, USA). Methanol was obtained from Honeywell (Charlotte, NC, USA). Ammonium acetate was purchased from Sigma (St. Louis, MO, USA). RIPA lysis buffer, phenylmethylsulfonyl fluoride, and Fickert Ultrasensitive Enhanced Chemiluminescence luminol solution were purchased from Meilunbio Co., Ltd. (Dalian, China). The standard protein bovine serum albumin, BCA kit, sodium dodecyl sulfate polyacrylamide gel electrophoresis (SDS-PAGE) protein loading buffer (5×), and color pre-stained protein molecular weight standard (10–180 kDa) were purchased from Beyotime (Shanghai, China). High molecular weight pre-stained protein markers were purchased from Biomed (Beijing, China). The anti-mTOR antibody was purchased from Servicebio (Wuhan, China). SREBP1 antibody and goat anti-rabbit immunoglobulin horseradish peroxidase were purchased from Affinity (Jiangsu, China). The Fatty Acid Synthase (C20G5) Rabbit mAb was purchased from Cell Signaling Technology (Danvers, MA, USA). Β-Actin antibody was purchased from Shanghai Po Wan Biotechnology Co., Ltd. (Shanghai, China).
The LK16-HF90 CO2 Incubator was purchased from Beijing Zhongxihuada Technology Co., Ltd. (Beijing, China). The SW-CF-2FD Ultra-clean table was purchased from Jiangsu Sujing Antai Co., Ltd. (Jiangsu, China). The Fresco17 high speed refrigerated centrifuge and pipettes (range: 1000, 200, 100, 10 μL) were obtained from Thermo Fisher Scientific. A DHP-9272 electronic analytical balance was purchased from Sartorius Scientific Instrument Co., Ltd. (Göttingen, Germany). A SpectraMax Plus384-plus microplate reader was obtained from Molecular Devices (Sunnyvale, CA, USA). A BD FACSCantoll flow cytometer was purchased from BD Biosciences (Franklin Lakes, NJ, USA). The QuickChemi5200+ Chemiluminescence Imaging System was purchased from Monad Biotechnology Co., Ltd. (Suzhou, China). The Q-TOF 5600 Mass Spectrometer was purchased from AB Sciex Corporation (Framingham, MA, USA). The Nexera Ultra-Performance Liquid Chromatograph was purchased from Shimadzu Corporation (Kyoto, Japan).

4.2. Cell Culture

Mouse breast cancer 4T1 cells were provided by the Guangdong Provincial Key Laboratory of New Drug Models. 4T1 cells were cultured in DMEM containing 10% fetal bovine serum, 100 U/mL penicillin, and 100 μg/mL streptomycin, in a constant temperature cell culture incubator at 37 °C with 5% CO2. The cells were digested and passaged with 0.25% trypsin (without EDTA) after 2–3 days of adherent culture. Cells in the exponential growth phase were used in all experiments.

4.3. Cell Viability Assay

We performed an MTT assay to examine the viability of 4T1 cells treated with OST. Briefly, 4T1 cells (4000 cells/well) were seeded into 96-well plates to culture for 24 h, followed by treatment of the cells with different concentrations of OST (0, 25, 50, 75, 100, 125, and 150 μM). After treatment for 24, 48, and 72 h, 100 μL DMEM basal culture and 15 μL MTT solution (5 mg/mL in PBS) were added to each well and incubated for 4 h at 37 °C. Finally, the culture supernatant in the wells was aspirated, and 150 μL of dimethyl sulfoxide was added to each well and shaken for 10 min at room temperature to melt the crystals. Absorbance was measured at 490 nm using a multifunctional enzyme marker. The percentage of cell viability was calculated from the mean optical density (OD) values of the wells using the following formula: cell viability (%) = (OD Test /OD Control) × 100.

4.4. Cell Cycle Assay

To analyze the effect of OST on the 4T1 cell cycle, the DNA content of 4T1 cells was measured using flow cytometry. 4T1 cells (3 × 10⁵ cells/mL, 2 mL/well) were seeded into 6-well plates and incubated for 24 h. The cells were collected after treatment with complete medium or different concentrations of OST (0, 50, 75, and 100 μM) for 24 h. The cells were washed with pre-cold PBS and incubated with 1mL of DNA staining solution and 10 μL of permeabilization solution for 30 min at room temperature in the dark. The cell cycle was analyzed using flow cytometry. The data were analyzed using ModFit LT software.

4.5. Cell Apoptosis Assay

Apoptosis was detected using flow cytometry. 4T1 cells (3 × 10⁵ cells/mL, 2 mL/well) were added to 6-well plates and cultured for 24 h. After treatment with different concentrations of OST (0, 50, 75, and 100 μM) for 24 h, the cells were collected, washed with pre-cold PBS, and resuspended in 500 μL of 1× binding buffer. Next, 5 μL of Annexin V-FITC and 10 μL of PI were added to the cell buffer and incubated for 5 min in the dark. Cell apoptosis was analyzed using flow cytometry. The data were analyzed using FlowJo software (TreeStar, Ashland, OR, USA).

4.6. Sample Preparation for Metabolomics

4T1 cells were cultured in 6-well plates (5 × 10⁵/mL, 2 mL/well) for 24 h and treated with OST (0 or 75 μM) for 48 h. The OST treated group (75 μM) and control group (0 μM) were subjected to three repeated experiments. 4T1 cells were washed with pre-cold PBS and saline (0.9% NaCl), scraped with 1 mL of pre-cold ultrapure water, transferred to 2.0 mL tubes, and stored at −80 °C until use (approximately 107 cells per sample). For the experiment, the samples were defrosted on ice; 100 μL of this sample was added to a new tube, to which 1000 μL of extraction solution (methanol: acetonitrile: water = 2:2:1, v/v) was mixed and vortexed for 15 s. The samples were ultrasonicated in an ice-water bath for 10 min and snap-frozen in liquid nitrogen for 1 min; these steps were repeated three times. The samples were incubated at −20 °C for 1 h, followed by centrifugation at 13,000 rpm for 15 min at 4 °C. The supernatant was extracted, transferred to new tubes, and dried under a nitrogen stream. The dried samples were dissolved and shaken vigorously for 30 s in 100 μL acetonitrile: water = 1:1 (v/v) solution before sonication in an ice-cold water bath for 10 min and centrifugation at 13,000 rpm for 15 min at 4 °C. The supernatants were carefully removed and prepared for the assay. QC samples were prepared in parallel by mixing 20 μL of each sample supernatant to verify the stability of the LC-MS/MS system. The QC samples were injected three consecutive times prior to the study.

4.7. UPLC-Q-TOF/MS Conditions

Metabolomic analysis was performed using an UPLC system coupled with a mass spectrometer. A UPLC BEH Amide column (1.7 μm, 2.1 × 100 mm, Waters, Milford, MA, USA) was used for separation. The column was maintained at 55 °C at a flow rate of 0.3 mL·min−1. The gradient eluents consisted of 100% H2O, 25 mM CH3COONH4 + 25 mM NH4OH (A) and 100% acetonitrile (B). The ion-mode gradient elution conditions were as follows: 85% B at 0–1 min; 65% B at 1–12 min; 40% B at 12–12.1 min; 40% B at 12.1–15 min; 85% B at 15–15.1 min; 85% B at 15.1–20 min. The sample injection volume was 5 μL. The automatic samplers were maintained at 4 °C.
An ESI source was used for mass spectrometry analysis. The ESI source operation parameters were as follows: source temperature, 600 °C; ion source voltage, 5500 V or −4500 V; air curtain gas, 20 psi; atomization gas and auxiliary gas, 60 psi. Scanning was performed by multiple reaction monitoring.

4.8. Metabolomics Data Analysis

Spectral data were collected using UPLC-Q-TOF/MS technology and compared in both XCMS and VGDB for peak alignment, peak retention time, peak area selection, and quality (mass-to-charge ratio). The resultant data were imported into SIMCA14.1, and the clustering information and significant variables were captured using PCA and OPLS-DA. The OPLS-DA model was used to calculate the VIP values for each variable in the cell samples, and differential metabolites between the groups at various time points were screened based on VIP ≥ 1.0. Data were normalized and log-transformed, and p-values were calculated using t-tests. Metabolites with VIP ≥ 1 and p ≤ 0.05 were selected as final differential metabolites, which were validated using the Human Metabolome Databases (http://www.hmdb.ca/) (accessed on 15 June 2022), METLIN (https://metlin.scripps.edu/) (accessed on 15 June 2022), and Massbank (https://massbank.eu/) (accessed on 15 June 2022), as well as other database models. The validated differential metabolites were entered into the MetaboAnalyst5.0 database (https://www.metaboanalyst.ca/) (accessed on 16 July 2022) for metabolic pathway analysis.

4.9. Western Blot Analysis

After treatment with various OST concentrations (0, 50, 75, and 100 μM) for 48 h, the 4T1 cells were washed with cold PBS. The cells were lysed with RIPA lysis buffer on ice for 30 min and then scraped. The cell lysates were centrifuged at 13,000 rpm at 4 °C for 20 min to collect the supernatant. The protein concentration in the supernatant was determined using a BCA protein assay kit. Proteins were heated at 95 °C for 5 min in SDS-PAGE protein loading buffer for denaturation. Equal amounts of protein were separated by SDS-PAGE at 6–12%, which were transferred to PVDF membranes and blocked with Tris-buffered saline containing Tween 20 and 5% skimmed milk for 1 h. The blots were washed with 1× Tris-buffered saline containing Tween 20 and incubated with mTOR (1:1000), SREBP1 (1:1000), FASN (1:1000), and β-actin at 4 °C overnight. The next day, the blots were washed and exposed to goat anti-rabbit immunoglobulin horseradish for 2 h at room temperature. The blots were washed and activated with enhanced chemiluminescence solution. The data were quantified using a chemiluminescent imaging system. The gray scale values of the blots were analyzed using ImageJ software (NIH, Bethesda, MD, USA).

4.10. Statistical Analysis

Data analysis was performed using GraphPad Prism 9.0 (GraphPad, Inc., La Jolla, CA, USA). All data are expressed as the mean ± standard deviation and were obtained from at least three independent experiments. Differences between experimental groups were analyzed using Student’s t-test. Statistical significance was set at p < 0.05.

5. Conclusions

OST exhibits antitumor effects in breast cancer 4T1 cells. We showed that OST inhibits fatty acid and nucleotide levels, thereby inhibiting 4T1 cell proliferation, blocking the cell cycle and inducing apoptosis. The inhibitory effects of OST on 4T1 cells mainly involved phospholipid biosynthesis, methylhistidine metabolism, pyrimidine metabolism, and beta-oxidation of ultra long chain fatty acids. Of these, OST may modulate the activities of mTOR, SREBP1, and FASN. Because lipid metabolism is a key feature of cancer-specific metabolism, enzymes associated with this process were further evaluated. These results suggest that OST induces downregulation of SREBP1 through inhibition of mTOR expression, leading to inhibition of FASN expression to interfere with lipid metabolic pathways such as phospholipid biosynthesis, beta oxidation of very long chain fatty acids, and oxidation of branched chain fatty acids in 4T1 cells, inhibiting the de novo synthesis and esterification of long chain fatty acids into phospholipids (LysoPC, LysoPE, or L-acetylcarnitine) into the cell membrane, thereby inhibiting 4T1 cell proliferation, blocking the cell cycle and promoting apoptosis. OST shows potential as a drug for treating breast cancer, acting through a variety of metabolic pathways that regulate amino acid, fatty acid, and nucleotide synthesis. Our findings reveal potential biomarkers that can contribute to a more comprehensive understanding of the anti-tumor mechanisms of OST in 4T1 cells.

Author Contributions

Conceptualization, Z.S., X.D. and X.L.; methodology, X.L., C.Z. and E.W.; software, X.L.; validation, X.L., C.Z., E.W. and L.H.; formal analysis, X.L. and C.Z., and E.W.; investigation, X.L., C.Z. and E.W.; resources, X.D., Z.S. and L.H.; data curation, X.L. and E.W.; writing—original draft preparation, X.L.; writing—review and editing, Z.S. and X.D.; visualization, X.L., C.Z. and E.W.; supervision, Z.S. and X.D.; project administration, X.D. and Z.S.; funding acquisition, Z.S. and X.D. All authors have read and agreed to the published version of the manuscript.

Funding

This work was supported by the Key Discipline Construction Project of Traditional Chinese Medicine of Guangdong Pharmaceutical University (Research Team Project of School of Chinese Medicine), NO. ZY2021T03.

Institutional Review Board Statement

Not applicable.

Informed Consent Statement

Not applicable.

Data Availability Statement

The data presented in this study are available within the article.

Conflicts of Interest

The authors declare no conflict of interest.

References

  1. Siegel, R.L.; Miller, K.D.; Jemal, A. Cancer statistics, 2019. CA Cancer J. Clin. 2019, 69, 7–34. [Google Scholar] [CrossRef] [PubMed] [Green Version]
  2. Li, N.; Deng, Y.; Zhou, L.; Tian, T.; Yang, S.; Wu, Y.; Zheng, Y.; Zhai, Z.; Hao, Q.; Song, D.; et al. Global burden of breast cancer and attributable risk factors in 195 countries and territories, from 1990 to 2017: Results from the Global Burden of Disease Study 2017. J. Hematol. Oncol. 2019, 12, 140. [Google Scholar] [CrossRef] [PubMed] [Green Version]
  3. Sung, H.; Ferlay, J.; Siegel, R.L.; Laversanne, M.; Soerjomataram, I.; Jemal, A.; Bray, F. Global Cancer Statistics 2020: GLOBOCAN Estimates of Incidence and Mortality Worldwide for 36 Cancers in 185 Countries. CA Cancer J. Clin. 2021, 71, 209–249. [Google Scholar] [CrossRef] [PubMed]
  4. Siegel, R.L.; Miller, K.D.; Jemal, A. Cancer Statistics, 2017. CA Cancer J. Clin. 2017, 67, 7–30. [Google Scholar] [CrossRef] [PubMed] [Green Version]
  5. Liang, Y.; Zhang, H.; Song, X.; Yang, Q. Metastatic heterogeneity of breast cancer: Molecular mechanism and potential therapeutic targets. Semin. Cancer Biol. 2020, 60, 14–27. [Google Scholar] [CrossRef]
  6. Park, W.; Park, S.; Song, G.; Lim, W. Inhibitory Effects of Osthole on Human Breast Cancer Cell Progression via Induction of Cell Cycle Arrest, Mitochondrial Dysfunction, and ER Stress. Nutrients 2019, 11, 2777. [Google Scholar] [CrossRef] [PubMed] [Green Version]
  7. Wang, Y.; Ye, F.; Liang, Y.; Yang, Q. Breast cancer brain metastasis: Insight into molecular mechanisms and therapeutic strategies. Br. J. Cancer 2021, 125, 1056–1067. [Google Scholar] [CrossRef]
  8. Ataseven, B.; Frindte, J.; Harter, P.; Gebers, G.; Vogt, C.; Traut, A.; Breit, E.; Bluni, V.; Reinisch, M.; Heitz, F.; et al. Perception of side effects associated with anticancer treatment in women with breast or ovarian cancer (KEM-GO-1): A prospective trial. Support. Care Cancer 2020, 28, 3605–3615. [Google Scholar] [CrossRef]
  9. Zhang, Y. The root cause of drug resistance in HER2-positive breast cancer and the therapeutic approaches to overcoming the resistance. Pharmacol. Ther. 2021, 218, 107677. [Google Scholar] [CrossRef]
  10. Emens, L.A.; Esteva, F.J.; Beresford, M.; Saura, C.; De Laurentiis, M.; Kim, S.B.; Im, S.A.; Wang, Y.; Salgado, R.; Mani, A.; et al. Trastuzumab emtansine plus atezolizumab versus trastuzumab emtansine plus placebo in previously treated, HER2-positive advanced breast cancer (KATE2): A phase 2, multicentre, randomised, double-blind trial. Lancet Oncol. 2020, 21, 1283–1295. [Google Scholar] [CrossRef]
  11. Yang, Z.; Zhang, Q.; Yu, L.; Zhu, J.; Cao, Y.; Gao, X. The signaling pathways and targets of traditional Chinese medicine and natural medicine in triple-negative breast cancer. J. Ethnopharmacol. 2021, 264, 113249. [Google Scholar] [CrossRef] [PubMed]
  12. Lu, K.; Lin, J.; Jiang, J. Osthole inhibited cell proliferation and induced cell apoptosis through decreasing CPEB2 expression via up-regulating miR-424 in endometrial carcinoma. J. Recept. Signal. Transduct. Res. 2020, 40, 89–96. [Google Scholar] [CrossRef] [PubMed]
  13. Zhang, Q.Y.; Tao, S.Y.; Lu, C.; Li, J.J.; Li, X.M.; Jiang, Q.; Yan, B. Osthole: A Traditional Chinese Medicine for Ocular Anti-Angiogenic Therapy. Ophthalmic Res. 2020, 63, 483–490. [Google Scholar] [CrossRef] [PubMed]
  14. Shokoohinia, Y.; Jafari, F.; Mohammadi, Z.; Bazvandi, L.; Hosseinzadeh, L.; Chow, N.; Bhattacharyya, P.; Farzaei, M.H.; Farooqi, A.A.; Nabavi, S.M.; et al. Potential Anticancer Properties of Osthol: A Comprehensive Mechanistic Review. Nutrients 2018, 10, 36. [Google Scholar] [CrossRef] [PubMed] [Green Version]
  15. Ashrafizadeh, M.; Mohammadinejad, R.; Samarghandian, S.; Yaribeygi, H.; Johnston, T.P.; Sahebkar, A. Anti-Tumor Effects of Osthole on Different Malignant Tissues: A Review of Molecular Mechanisms. Anti-Cancer Agents Med. Chem. 2020, 20, 918–931. [Google Scholar] [CrossRef]
  16. Raggi, C.; Taddei, M.L.; Rae, C.; Braconi, C.; Marra, F. Metabolic reprogramming in cholangiocarcinoma. J. Hepatol. 2022, 77, 849–864. [Google Scholar] [CrossRef] [PubMed]
  17. Pham, D.V.; Tilija Pun, N.; Park, P.H. Autophagy activation and SREBP-1 induction contribute to fatty acid metabolic reprogramming by leptin in breast cancer cells. Mol. Oncol. 2021, 15, 657–678. [Google Scholar] [CrossRef]
  18. Wright, H.J.; Hou, J.; Xu, B.; Cortez, M.; Potma, E.O.; Tromberg, B.J.; Razorenova, O.V. CDCP1 drives triple-negative breast cancer metastasis through reduction of lipid-droplet abundance and stimulation of fatty acid oxidation. Proc. Natl. Acad. Sci. USA 2017, 114, E6556–E6565. [Google Scholar] [CrossRef] [Green Version]
  19. Tsachaki, M.; Strauss, P.; Dunkel, A.; Navrátilová, H.; Mladenovic, N.; Odermatt, A. Impact of 17β-HSD12, the 3-ketoacyl-CoA reductase of long-chain fatty acid synthesis, on breast cancer cell proliferation and migration. Cell. Mol. Life Sci. 2020, 77, 1153–1175. [Google Scholar] [CrossRef] [Green Version]
  20. Huang, L.H.; Chung, H.Y.; Su, H.M. Docosahexaenoic acid reduces sterol regulatory element binding protein-1 and fatty acid synthase expression and inhibits cell proliferation by inhibiting pAkt signaling in a human breast cancer MCF-7 cell line. BMC Cancer 2017, 17, 890. [Google Scholar] [CrossRef]
  21. Xu, S.; Chen, T.; Dong, L.; Li, T.; Xue, H.; Gao, B.; Ding, X.; Wang, H.; Li, H. Fatty acid synthase promotes breast cancer metastasis by mediating changes in fatty acid metabolism. Oncol. Lett. 2021, 21, 27. [Google Scholar] [CrossRef] [PubMed]
  22. Kim, Y.; Jee, W.; An, E.J.; Ko, H.M.; Jung, J.H.; Na, Y.C.; Jang, H.J. Timosaponin A3 Inhibits Palmitate and Stearate through Suppression of SREBP-1 in Pancreatic Cancer. Pharmaceutics 2022, 14, 945. [Google Scholar] [CrossRef] [PubMed]
  23. Murugan, A.K. mTOR: Role in cancer, metastasis and drug resistance. Semin. Cancer Biol. 2019, 59, 92–111. [Google Scholar] [CrossRef] [PubMed]
  24. Chen, H.; Qi, Q.; Wu, N.; Wang, Y.; Feng, Q.; Jin, R.; Jiang, L. Aspirin promotes RSL3-induced ferroptosis by suppressing mTOR/SREBP-1/SCD1-mediated lipogenesis in PIK3CA-mutatnt colorectal cancer. Redox Biol. 2022, 55, 102426. [Google Scholar] [CrossRef]
  25. Jiang, X.; Xu, Q.; Zhang, A.; Liu, Y.; Li, Z.; Tang, H.; Cao, D.; Zhang, D. Revealing the Hypoglycemic Effects and Mechanism of GABA-Rich Germinated Adzuki Beans on T2DM Mice by Untargeted Serum Metabolomics. Front. Nutr. 2021, 8, 791191. [Google Scholar] [CrossRef]
  26. Duan, X.; Pan, L.; Bao, Q.; Peng, D. UPLC-Q-TOF-MS Study of the Mechanism of THSWD for Breast Cancer Treatment. Front. Pharmacol. 2020, 10, 1625. [Google Scholar] [CrossRef] [Green Version]
  27. Kozar, N.; Kruusmaa, K.; Bitenc, M.; Argamasilla, R.; Adsuar, A.; Takač, I.; Arko, D. Identification of Novel Diagnostic Biomarkers in Breast Cancer Using Targeted Metabolomic Profiling. Clin. Breast Cancer 2021, 21, e204–e211. [Google Scholar] [CrossRef]
  28. Ma, S.; Wang, F.; Zhang, C.; Wang, X.; Wang, X.; Yu, Z. Cell metabolomics to study the function mechanism of Cyperus rotundus L. on triple-negative breast cancer cells. BMC Complement. Med. Ther. 2020, 20, 262. [Google Scholar] [CrossRef]
  29. Butler, L.M.; Perone, Y.; Dehairs, J.; Lupien, L.E.; de Laat, V.; Talebi, A.; Loda, M.; Kinlaw, W.B.; Swinnen, J.V. Lipids and cancer: Emerging roles in pathogenesis, diagnosis and therapeutic intervention. Adv. Drug Deliv. Rev. 2020, 159, 245–293. [Google Scholar] [CrossRef]
  30. Lin, V.C.; Chou, C.H.; Lin, Y.C.; Lin, J.N.; Yu, C.C.; Tang, C.H.; Lin, H.Y.; Way, T.D. Osthole suppresses fatty acid synthase expression in HER2-overexpressing breast cancer cells through modulating Akt/mTOR pathway. J. Agric. Food Chem. 2010, 58, 4786–4793. [Google Scholar] [CrossRef]
  31. Sunami, Y.; Rebelo, A.; Kleeff, J. Lipid Metabolism and Lipid Droplets in Pancreatic Cancer and Stellate Cells. Cancers 2017, 10, 3. [Google Scholar] [CrossRef] [PubMed] [Green Version]
  32. Khan, A.; Aljarbou, A.N.; Aldebasi, Y.H.; Faisal, S.M.; Khan, M.A. Resveratrol suppresses the proliferation of breast cancer cells by inhibiting fatty acid synthase signaling pathway. Cancer Epidemiol. 2014, 38, 765–772. [Google Scholar] [CrossRef]
  33. Liu, X.; Zhang, S.; Lu, X.; Zheng, S.; Li, F.; Xiong, Z. Metabonomic study on the anti-osteoporosis effect of Rhizoma Drynariae and its action mechanism using ultra-performance liquid chromatography-tandem mass spectrometry. J. Ethnopharmacol. 2012, 139, 311–317. [Google Scholar] [CrossRef] [PubMed]
  34. Catalá, A. Lipid peroxidation of membrane phospholipids generates hydroxy-alkenals and oxidized phospholipids active in physiological and/or pathological conditions. Chem. Phys. Lipids 2009, 157, 1–11. [Google Scholar] [CrossRef]
  35. Gao, D.; Wang, Y.; Xie, W.; Yang, T.; Jiang, Y.; Guo, Y.; Guan, J.; Liu, H. Metabolomics study on the antitumor effect of marine natural compound flexibilide in HCT-116 colon cancer cell line. J. Chromatogr. B Analyt. Technol. Biomed. Life Sci. 2016, 1014, 17–23. [Google Scholar] [CrossRef] [PubMed]
  36. Rudolph, F.B. The biochemistry and physiology of nucleotides. J. Nutr. 1994, 124, 124S–127S. [Google Scholar] [CrossRef]
  37. Lovászi, M.; Németh, Z.H.; Gause, W.C.; Beesley, J.; Pacher, P.; Haskó, G. Inosine monophosphate and inosine differentially regulate endotoxemia and bacterial sepsis. FASEB J. 2021, 35, e21935. [Google Scholar] [CrossRef]
  38. Maiuolo, J.; Oppedisano, F.; Gratteri, S.; Muscoli, C.; Mollace, V. Regulation of uric acid metabolism and excretion. Int. J. Cardiol. 2016, 213, 8–14. [Google Scholar] [CrossRef] [Green Version]
  39. Löffler, M.; Carrey, E.A.; Zameitat, E. Orotate (orotic acid): An essential and versatile molecule. Nucleosides Nucleotides Nucleic Acids 2016, 35, 566–577. [Google Scholar] [CrossRef]
Figure 1. Chemical structure of Osthole [7-Methoxy-8-(3-methyl-2-butenyl) coumarin].
Ijms 24 01168 g001
Figure 2. Osthole (OST) inhibits the proliferation of 4T1 cells. 4T1 cells were incubated with OST (0, 25, 50,75, 100, 125, and 150 μM) for 24, 48, and 72 h. Cell viability was determined in an MTT assay. Compared to that in the control group, Mean ± SD, N = 3, * p < 0.05, ** p < 0.01, *** p < 0.001, **** p < 0.0001.
Ijms 24 01168 g002
Figure 3. Effect of osthole (OST) on 4T1 cell cycle distribution. (A) 4T1 cells were treated with (0, 50, 75, and 100 μM) OST for 24 h. DNA content was analyzed using flow cytometry with propidium iodide (PI) staining. (B) DNA content in each phase of the cell cycle (G1, S, G2) after OST treatment. Compared to that in the control group, Mean ± SD, N = 3, * p < 0.05, ** p < 0.01, *** p < 0.001, **** p < 0.0001.
Ijms 24 01168 g003
Figure 4. Effect of osthole (OST) on apoptosis of 4T1 cells. (A) 4T1 cells were treated with OST (0, 50, 75, and 100 μM) for 24 h. Apoptosis and cell death induction were detected in an Annexin VFITC /PI double staining assay. (B) Mean percentage of cells in each quadrant of 4T1 cells after OST treatment. Viable cells were considered as FITC Annexin V/PI; early apoptosis cells were considered as FITC Annexin V+/PI; and late apoptosis/dead cells were identified as FITC Annexin V+/PI+. Compared to that in the control group, Mean ± SD, N = 3, ** p < 0.01.
Ijms 24 01168 g004
Figure 5. The TIC overlaps of QC samples of in ESI+ mode (A) and ESI mode (B).
Ijms 24 01168 g005
Figure 6. Representative total ion chromatogram obtained for metabolite profiles in 4T1 cells after osthole (OST) treatment. ESI+ mode: (A) control group; (B) 75 μM OST; ESI mode: (C) control group; (D) 75 μM OST.
Ijms 24 01168 g006
Figure 7. Principal component analysis scoring plots for endogenous metabolites of 4T1 cells in electrospray ionization-positive (ESI+) mode (A) and ESI mode (B), orthogonal projections to latent structures discriminant analysis (OPLS-DA) scoring plots for ESI+ mode (C) and ESI mode (D).
Ijms 24 01168 g007
Figure 8. Changes in relative content of potential biomarker 4T1 cells after osthole (OST) treatment.
Ijms 24 01168 g008
Figure 9. Metabolic pathway enrichment analysis of differential metabolites conducted based on the Kyoto Encyclopedia of Genes and Genomes (KEGG) database. (A) Bar chart and (B) Bubble chart.
Ijms 24 01168 g009aIjms 24 01168 g009b
Figure 10. Effect of osthole (OST) on the expression of mTOR, SREBP1, and FASN in 4T1 cells. (A) 4T1 cells were treated with OST (0, 50, 75, and 100 μM) for 48 h. The expression levels of mTOR, SREBP1, and FASN in the cells were detected using western blotting. (B) Quantitative analysis using ImageJ software of western blot signal intensity expression relative to β-actin loading. Data show the mean ± SD (three independent experiments) compared to that in the control group (0 μM). * p < 0.05.
Ijms 24 01168 g010
Table 1. Altered metabolites of 4T1 cells after osthole (OST) treatment in both electrospray ionization-positive (ESI+) and ESI mode.
NOM/ZCompound NameChemical Formulap-ValueTrend
1245.1170 OstholeC15H16O30.0001
2521.3430 Linoleic acidC18H32O20.0048
3466.3285 Glycocholic acidC26H43NO60.0061
4468.3065 PC (14:0/0:0)C22H46NO7P0.0151
5496.3388 LysoPC (16:0/0:0)C24H50NO7P0.0151
6318.2995 PhytosphingosineC18H39NO30.0195
7550.3854 1-O-(cis-9-octadecenyl)-2-O-acetyl-sn-glycero-3-phosphocholineC28H57NO7P+0.0203
8522.3544 LysoPC (18:1(9Z)/0:0)C26H52NO7P0.0246
9521.3430 Oleic acidC18H34O20.0254
10283.0186 D-fructose-1-phosphateC6H13O9P0.0361
11204.1222 L-acetylcarnitineC9H18NO40.0407
12772.6059 PC (P-18:0/18:1(9Z))C44H86NO7P0.0445
13452.2755 LysoPE (16:0/0:0)C21H44NO7P0.0005
14303.2319 N-acetylaspartylglutamate (NAAG)C11H16N2O80.0011
15151.0257 OxypurinolC5H4N4O20.0017
16154.0617 HisC6H9N3O20.0049
17306.0765 GlutathioneC10H17N3O6S0.0071
18195.0508 Galactonic acidC6H12O70.0083
19180.0660 3-amino-3-(4-hydroxyphenyl) propionic acidC9H11NO30.0092
20154.0617 L-histidineC6H9N3O20.0098
21155.0097 Orotic acidC5H4N2O40.0156
22347.1826 Inosine 5′-monophosphate (IMP)C10H13N4O8P0.0173
23236.0922 N-lactoyl-phenylalanineC12H15NO40.0210
24147.0295 3-hydroxyglutaric acidC5H8O50.0236
25509.2864 1-oleoyl-2-hydroxy-sn-glycero-3-PG (sodium salt)C24H47NaO9P0.0254
26480.3070 LysoPE (18:0/0:0)C23H48NO7P0.0298
27535.0338 UDP-xyloseC14H22N2O16P20.0302
28171.0260 Benzylphosphonic acidC7H9O3P0.0315
29209.0300 Mucic acidC6H10O80.0372
30402.9918 Uridine 5′-diphosphateC9H14N2O12P20.0390
31771.5151 Phosphatidylglyceride18:2–18:2C42H75O10P0.0459
32167.0204 Uric acidC5H4N4O30.0491
Table 2. Statistical analysis results of the main metabolites in 4T1 cells.
NOPathway NameTotalExpectedHitsRaw p
1Phospholipid Biosynthesis290.368 20.0498
2Methyl Histidine Metabolism40.051 10.0499
3Pyrimidine Metabolism590.749 20.169
4Beta Oxidation of Very Long Chain Fatty Acids170.216 10.197
5Alpha Linolenic Acid and Linoleic Acid Metabolism190.241 10.217
6Nucleotide Sugar Metabolism200.254 10.227
7Lactose Synthesis200.254 10.227
8Purine Metabolism740.939 20.241
9Androstenedione Metabolism240.305 10.267
10Estrone Metabolism240.305 10.267
11Oxidation of Branched Chain Fatty Acids260.330 10.286
12Starch and Sucrose Metabolism310.394 10.331
13Ammonia Recycling320.406 10.340
14Fructose and Mannose Degradation320.406 10.340
15Amino Sugar Metabolism330.419 10.348
16Androgen and Estrogen Metabolism330.419 10.348
17Beta-Alanine Metabolism340.432 10.357
18Aspartate Metabolism350.444 10.365
19Galactose Metabolism380.482 10.390
20Porphyrin Metabolism400.508 10.406
21Sphingolipid Metabolism400.508 10.406
22Histidine Metabolism430.546 10.429
23Bile Acid Biosynthesis650.825 10.576
24Arachidonic Acid Metabolism690.876 10.598
Disclaimer/Publisher’s Note: The statements, opinions and data contained in all publications are solely those of the individual author(s) and contributor(s) and not of MDPI and/or the editor(s). MDPI and/or the editor(s) disclaim responsibility for any injury to people or property resulting from any ideas, methods, instructions or products referred to in the content.

