Article

Assessment of the Spatial Variation in the Occurrence and Intensity of Major Hurricanes in the Western Hemisphere

1
Faculty of Sciences, UMDI Sisal, National Autonomous University of Mexico, Sisal 97356, Mexico
2
National School of Superior Studies—Merida, National Autonomous University of Mexico, Ucu 97357, Mexico
3
Center for Geophysical Research, School of Physics and Center for Research in Marine Sciences and Limnology, University of Costa Rica, San Jose 11501, Costa Rica
*
Author to whom correspondence should be addressed.
Climate 2023, 11(1), 15; https://doi.org/10.3390/cli11010015
Submission received: 5 December 2022 / Revised: 28 December 2022 / Accepted: 30 December 2022 / Published: 4 January 2023
(This article belongs to the Special Issue New Perspectives in Climate Modelling and Forecasting)

Abstract

:
Major hurricanes are a critical hazard for North and Central America. The present study investigated the trends of occurrence, affectation, and intensity of major hurricanes in the North Atlantic and Northeast Pacific Oceans using GIS applications to the IBTrACS database. The study period ranged from 1970 to 2021. Tropical cyclones were sampled using a grid composed of 3.5° hexagonal cells; in addition, trends were obtained to assess the effect of long-term variability from natural phenomena and climate change. Critical factors influencing these trends at the oceanic scale and for each hexagon were determined using multivariate and multiscale analysis by the application of stepwise analysis and the related ANOVA. The integrated variables related to atmospheric and oceanographic oscillations and patterns, i.e., spatial variables resampled with the same analysis unit and climate indices. Our results indicated marked spatial areas with significant trends in occurrence and intensity. Additionally, there was evidence of linear changes in the number of major hurricanes and an increase in the maximum annual speed of +1.61 m s−1 in the North Atlantic basin and +1.75 m·s−1 in the Northeast Pacific, reported for a 10-year period. In terms of occurrence, there were increases of 19% and 5%, respectively, which may be related to ocean warming and natural variability associated with oceanic and atmospheric circulation.

1. Introduction

The cost of natural disasters has grown continuously worldwide [1,2]. Among these, tropical cyclones have the greatest socio-economic impact in North and Central America and in the Caribbean, with 53.9% of total damage costs (adjusted USD) recorded in the EM-DAT database for the period 1980–2022 [1]. The impacts of these phenomena depend on several factors: the location of economic activities, the total production and capital of these activities, the number and intensity of tropical cyclones, population exposure and vulnerability, and the geographic characteristics of the affected areas [3]. For example, from 1980 to 2019, NOAA issued annual estimates of the economic impacts of tropical cyclones in the United States: in 2013, total damages were up to US$417.9bn; two years later (2015), the total impact was about US$530bn; and in 2019, total damages amounted to US$945.9bn. The destruction caused by hurricanes is evident, and on the rise, particularly with regard to damages related to major hurricanes (MH) (categories 3–5 on the Saffir–Simpson scale, i.e., sustained winds ≥ 50 m·s−1). Cost estimations for MH in the North Atlantic revealed total losses amounting to US$2bn for Hurricane “Allen” in 1980, US$22.4bn for “Charley” in 2004, US$70.2bn for “Sandy” in 2012, US$90bn for “Maria” in 2017, and US$125bn for “Harvey” the same year [4]. Economic losses from hurricanes are much higher than even a few decades ago due to a greater presence of infrastructure in coastal areas [5] and higher exposure and vulnerability.
The detection and attribution of the potential effects of anthropogenic climate change on tropical cyclones are currently among the most controversial topics in science [6]. The challenge for research regarding the effects of climate change on tropical cyclones lies in determining whether an observed change in hurricane activity exceeds the variability expected from natural causes and linking significant changes with specific climate forcing [7]. Studies on this topic impute large increases in the incidence and intensity of hurricanes in tropical areas, which are already detectable in records [8], and the relationship between cyclones with rises in sea surface temperature (SST) in the formation regions [9,10] and increases in human-induced greenhouse gases [7]. Indeed, Frame et al. [11] estimated that US$21.3bn of the total damages caused by hurricane Harvey could be attributed to climate change. There are two fundamental elements in assessing a hurricane that pose potentially serious threats to humans: frequency of occurrence and intensity [12]. The first is defined as the number of times that a catastrophic hurricane occurs per unit of time; the second is a measure of the force with which the phenomenon occurs in a given location. Intensity is measured using the Saffir–Simpson scale; it considers that an event is an MH when it reaches a category of 3 or higher. MHs are characterized by sustained winds of 50 m·s−1 or stronger, up to the maximum wind speed of 95.7 m·s−1 recorded for hurricane “Patricia” in 2015.
Although the average annual number of storms and hurricanes may not have changed, their intensity has increased over time [7,13]. Specifically, tropical cyclone activity in the North Atlantic has intensified since 1970, as reported by the IPCC [14]. In addition, there is a spatial pattern in the trends linked to the occurrences of tropical cyclones on a global scale since 1980, highlighting increases in the North Atlantic and Central Pacific areas [15].
In the future, more intense hurricanes with higher wind speeds and precipitation are likely to occur as a result of climate change [16]. This trend is because tropical cyclones are factors of energy transfer [17] from warm seas to more temperate zones; thus, rising sea surface temperatures (SSTs) lead to greater energy transfer. However, at the oceanic scale, these trends can be subject to spatial variations, with patterns depending on the ocean; variability in these trends is also experienced at the local level [15].
Increases in hurricane activity in the Atlantic Ocean in past decades are believed to reflect mainly the recent increases in tropical Atlantic SST [18]. Changes in SST due to human activities and natural climate variations have brought attention to the observed trends of hurricane intensification [19]. Some studies [18,20] have attributed these increases to changes in the natural SST cycle known as the Atlantic Multidecadal Oscillation (AMO) [14,20]. Additionally, the AMO is related to the Sahel rainy season and faster thermohaline circulation, which contributes to MH activity [19]. Previous studies have shown that more MHs impact the northern Gulf of Mexico when the AMO is positive [19,21,22]. Several authors have investigated trends in each hurricane basins across the entire ocean [23,24,25]. However, we consider the basins to be too large; consequently, a basin-scale trend may not be representative of the spatially heterogeneous ocean activity of tropical cyclones. To address this issue, the present study carried out spatial analyses of the phenomena in more detail by considering multiple spatial scales.
This paper analyzed the temporal and spatial evolution in the frequency of occurrence and intensity of MHs in the Northeast Pacific (NEP) and North Atlantic (NA) basins at two spatial scales, basin scale and regional scale, using a zonal sampling method. It studied the spatiotemporal variability of the MH with spatial and multivariate analysis using the main related climate indices as well as local physical variables.

2. Materials and Methods

2.1. Tropical Cyclone Data

The study area was determined based on the historical trajectories of major hurricanes, which correspond to the NA and NEP basins, with specific coordinates ranging from 180° W to 7° E and 3° N to 75° N.
The database with information about tropical cyclones (TC) in NA and NEP was obtained from the International Best Track Archive for Climate Stewardship (IBTrACS) project [26,27] provided by NCEI, NOAA. For each ocean, the databases contain the following data: cyclone name, year, month, day, time, sustained wind speed, and distance to landfall. Measurements are reported every 6 h for WMO data and every 3 h for regional agencies monitoring tropical cyclones; the geographic location has a spatial resolution of 0.1°, and the maximum recorded sustained wind speed is given in knots as multiples of 5. The available data provide information from the year 1851 to 2022 for NA and from 1949 to 2022 for NEP. Data may also include central atmospheric pressure for storms after 1980 and a higher spatial resolution of 0.01°. The databases used correspond to polyline shapefiles; in this case, the sustained wind speed reported for each line corresponds to the value at the final vertex.
The data period from 1970 to 2021 was selected for the present analysis because tropical cyclones with no landfall or no ship encounter before the 1960s have a lower probability of having been detected or measured properly. Consequently, storm frequency records may contain non-physical positive trends since more storms have been detected during the satellite era [28], mainly for the NEP basin [29]. For NA, the time series is more reliable since the mid-1940s because of hurricane hunter airplanes [30,31]. The Television Infrared Observation Satellite started monitoring in 1960, and, as a result, tropical cyclones have been observed continuously ever since [32,33]. Additionally, the monitoring methodology has been homogeneous in both oceans since 1970 [29].
Therefore, to avoid bias in trend calculation, we limited the study period; however, bias may be observed associated with the absence of data and null probabilities in zones with scarce hurricane occurrence reports.

2.2. Oceanographic and Atmospheric Data

As this was a multi-scale study, we used two sets of variables to contrast with HM data: (a) spatially variable oceanographic and atmospheric data; and (b) climatic indices that mark the main oceanographic and atmospheric oscillations.
The spatially variable data used in this study were Sea Surface Temperature (SST), mean sea level pressure, relative humidity, and vertical wind shear. We obtained SST data from the Extended Reconstructed Sea Surface Temperature (ERSST) v5 [34] provided by NOAA. ERSSTv5 is a 2° grid of monthly SST from 1854 to 2021.
Atmospheric data were obtained from the NCEP-NCAR Reanalysis project that provides 80 different variables at 17 pressure level stacks on 2.5°’ 2.5° grids. This time series starts in 1948 [35]. From these data sets, we used the mean Sea Level Pressure (SLP) and Relative Humidity at 700 hPa (RH); also, we calculated 200–850 hPa Vertical Wind Shear (VWS) from u and v wind speed at both levels.
The climatic indices considered here were those that could influence cyclogenesis at a regional level. In addition to the AMO and PDO, for which there is documented influence on the occurrence of tropical cyclones [36], we explored the use of the following climatic indices: North Atlantic Oscillation (NAO) [37], Pacific North American Index (PNA) [38], Trans-Niño Index (TNI) [39], NIÑO-3.4 [39], and Tropical North Atlantic Index (TNA) [40]. Some of the indices used, like those related to the El Niño–Southern Oscillation (ENSO), do not represent the atmospheric or oceanographic variations in the study zone. However, the phenomena measured with these indices have a spatial influence [41] extending beyond the zone where they originated and can provide critical information about MH variations through atmosphere teleconnections.
Average yearly data were computed for each variable over the May–November season, and, for climate indices, annual time series were standardized to mean 0 and standard deviation 1.

2.3. Sampling for Spatial Analysis

From the line shapefile of the IBTrACS databases, we selected polylines with sustained wind speed ≥ 95 kt (48.87 m·s−1). The MH wind speed limit is 96 kt, and it is possible to downscale it to every hour; however, intensification and decay cannot be interpolated in the same way, particularly for landfilling hurricanes [42,43]. Consequently, since the sustained wind speed reported for each line corresponds to the value at the final vertex, we considered that the use of 95 kt results in lower bias than interpolation. This wind speed corresponds to the lower threshold level for MH (category 3+). We discarded using the lower threshold limit for very intense (4+) MHs of 58 m·s−1 [44] because it would lead to counting fewer occurrences, which would lead to a less robust analysis with a lower statistical confidence level.
Each MH was sampled using a grid of hexagonal cells—a shape considered suitable for counting the number of tropical cyclone trajectories [45]—with a cell size of 3.5°. The hexagonal tessellation was created automatically for the extent of the area of interest (0–180° W, 10–80° N) using the sf R-package [46] in R [47]. Subsequently, tracks and cell grids were intersected.
The spatial relationship between atmospheric and oceanographic data and the hexagonal grid were explored by transforming the raster to points with the raster R-package [48]. The data were previously interpolated to a 1° spatial resolution; the resulting points were finally intersected with the grid.
MH data were indexed according to the cells for the annual count of events (MH occurrence) per sample unit; this count was performed using the dplyr package [49]. Average annual values of atmospheric and oceanographic variables were computed over the May–November season.

2.4. Trend Analysis

Trends in the occurrence of MHs were calculated at two spatial scales. First, we applied generalized linear model (GLM) regressions using the R language and the “Poisson” family for the time series of annual tropical cyclone counts, as recommended by Elsner et al. [50], and the “Gaussian” family for the time series of maximum annual wind speed. Consequently, we converted the estimated GLM coefficient (slope) to a percent frequency per 10-year period or speed variation. This allows for comparing the trends observed in this study with the results reported by other authors [7,51,52]. Second, we calculated trends in the occurrence of MHs for each cell using the Mann–Kendall trend test using the Kendall package [53] in R. This [54,55] is a non-parametric test based on the correlation between the ranks of a time series and their temporal order; it requires no assumptions about the data to be tested. Consequently, it has been used particularly for determining trends related to tropical cyclones [56] or extreme weather [57].
To discard artificial trends, we calculated the 90% confidence interval with the NSM3 package [58] and evaluated the significance of trend-test coefficients by comparing their relative p-value [59]. Only trends with confidence intervals that do not cross 0 and with two-sided p-values < 0.1, indicating moderate evidence against the null hypothesis, were retained.
The most suitable grid cell size was selected from a geostatistical analysis of the results. First, we tessellated the study area with hexagons ranging from 0.5° to 6°. For every tessellation, we calculated Moran’s spatial autocorrelation index [60] using a squared inverse distance matrix between hexagon centroids for the Mann–Kendall trend value of every cell with a two-sided p-value < 0.1. The highest Moran’s index value (0.35), evidencing the optimum sampling size unit, was obtained for 3.5°.

2.5. Creation of the Maps

Maps were elaborated from the data of oceanographic and atmospheric variable and MH events sampling with the hexagonal tessellation. The same original grid has been used for every map. The extent represented in the maps is (20–180° W, 7–58° N), using a geographical projection with datum World Geodesic System 1984. All the non-null data were represented on the maps but insignificant trends resulting from temporal analysis were marked with white lines hatched.

2.6. Relation between MH and Physical Variables

Time series of MH occurrences as spatial values corresponding to the hexagonal grid were contrasted with the values of the physical variables and climatic indices using a stepwise logistic regression [61,62].
R-packages leaps [63] and mass [64] assisted the selection of the best model by the Akaike information criterion (AIC) [65]; this method identifies the optimal model with the most significant variables, removing those that are highly correlated with it or having a low information input.
Stepwise analyses were performed with GLM regressions using the “Poisson” family for the time series of tropical cyclone counts and the “Gaussian” family to explore the spatial relationship between significant tau values and physical variables. Multivariate analyses were completed by assessing the percentage of explained deviance (PED) for each explanatory variable using an analysis of variance (ANOVA) with a Chi-squared test [66].

3. Results

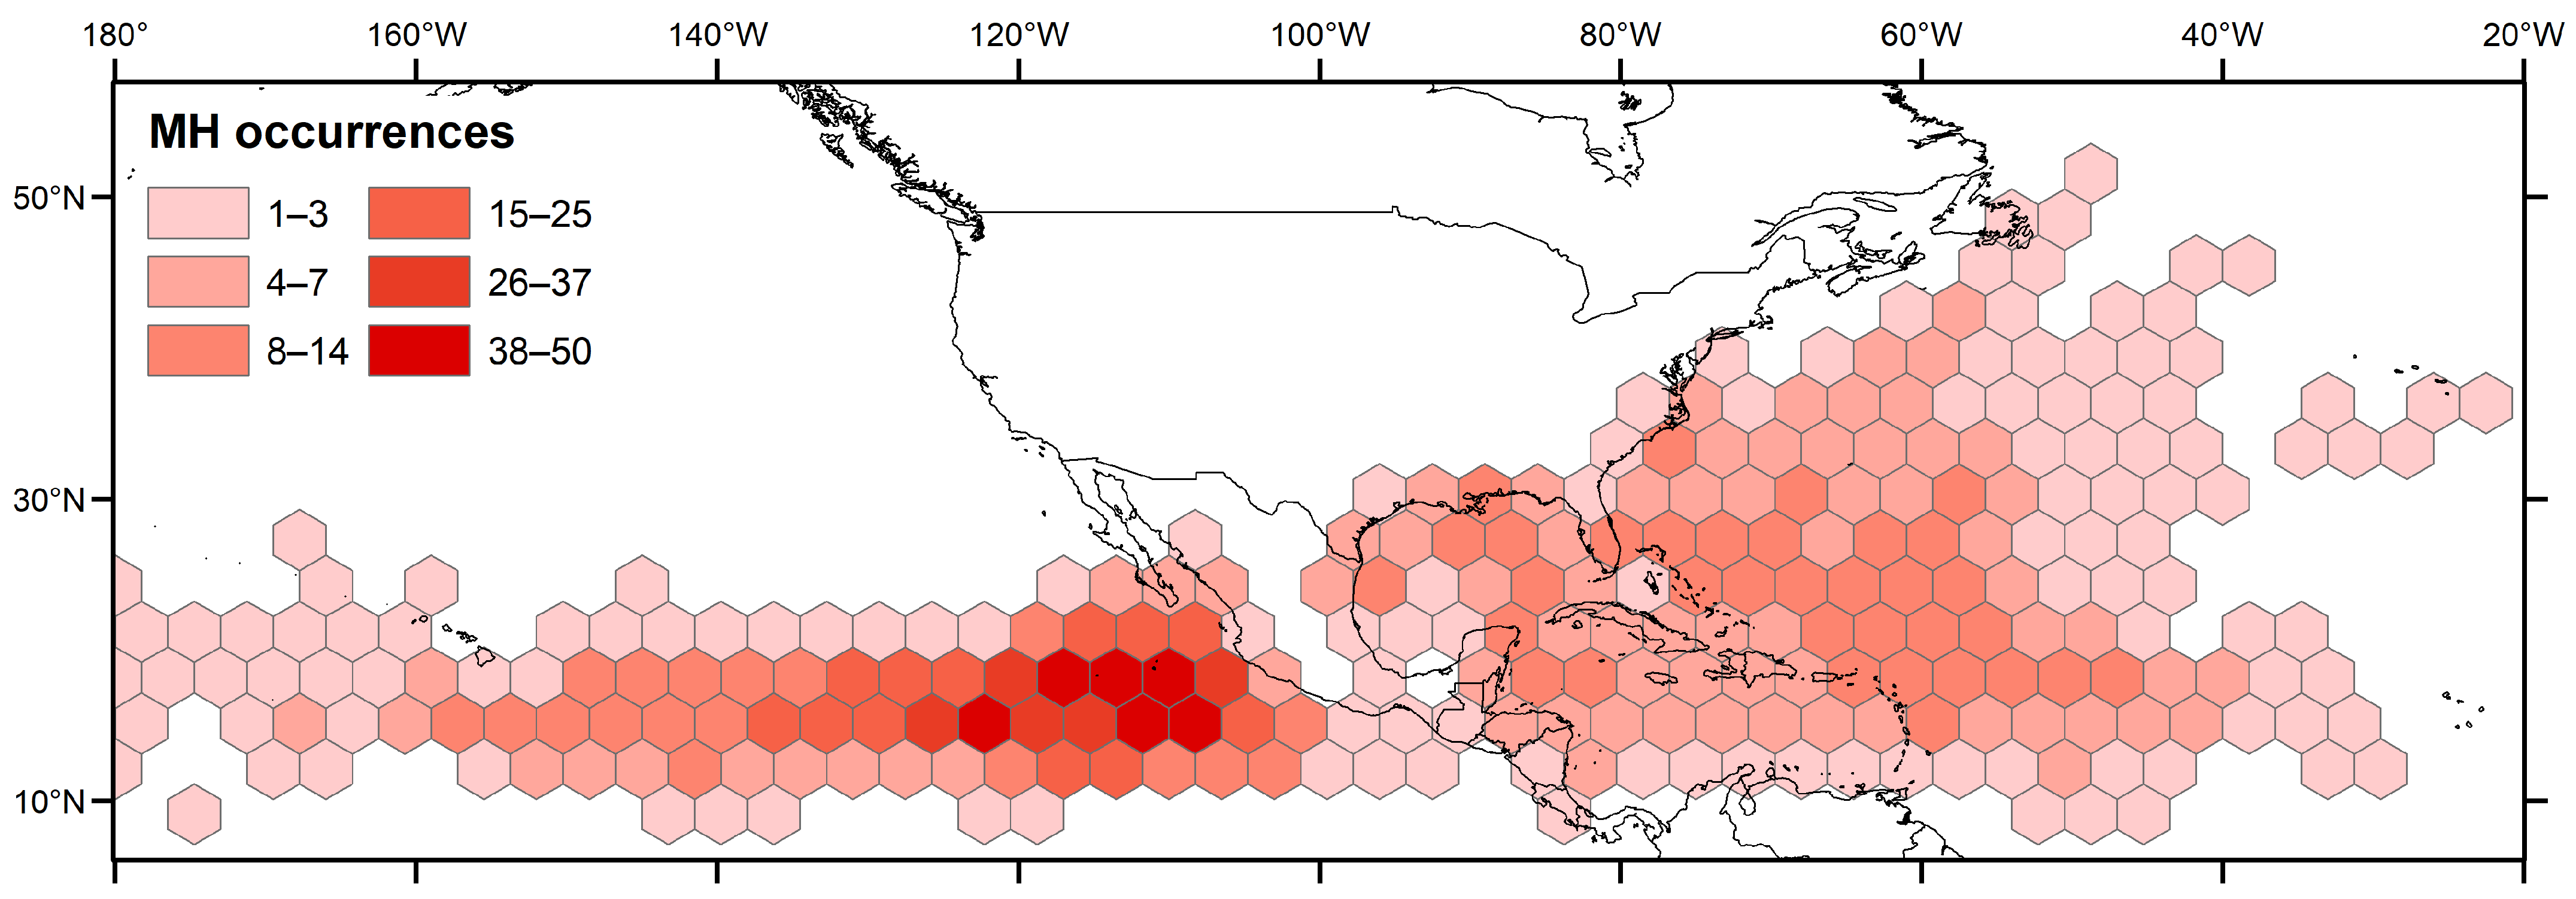
3.1. Occurrence of MHs

We found a marked difference in the number of MHs between the NA and NEP basins (139 and 239 events, respectively). Both areas showed a great spatial heterogeneity, but the Pacific basin showed an area with a higher concentration of MH events (Figure 1).
NA exhibited the greatest activity in the centre of the basin, on the Caribbean coasts, the Gulf Coast, i.e., the Yucatán channel, and the United States coasts (Louisiana, Mississippi, and Texas). On the other hand, in the NEP basin, the largest number of hurricanes was concentrated a few kilometres from the continent (approximately 200 km off the coast of Jalisco, Mexico) and decreased towards the coast.
To detect changes in spatial patterns, we calculated Moran’s index for the number of MHs per cell for the first and second halves of the time series (up to 1995 and since 1996). The results showed marked differences between the two oceans up to 1995, while from 1996 onwards there was greater similarity (Table 1). Therefore, for the first period, Moran’s index values were 0.42 and 0.08 for NEP and NA, respectively, confirming the significant difference previously postulated.
From 1996 to 2021, Moran’s index values changed; particularly, more similar values were recorded since 1996 than in the previous period. Moran’s index values for the Pacific and Atlantic basins were 0.31 and 0.28, respectively; Therefore, throughout the study period, the Pacific basin was more spatially concentrated (Figure 2).
The number of cells with records (n) was another index calculated in this study; these values were obtained considering the same period and with the same grid cells. The number of cells with MH events was larger for NA but increased in both basins. Changes in Moran’s index values and in the number of cells with no MH events indicated an increase in the area where MHs can strike in both oceans and, also, a relative spatial concentration of MHs in NA, in contrast with NEP, where MHs are spread despite of having been particularly clustered in the first period.
The number of annual MH events increased during the time series studied for NA and NEP (Figure 3). For NA (Figure 3a), annual occurrences varied between 0 and 7 MHs, with a median of two events per year. The GLM coefficient exhibited by the 1970–2021 time series (0.020) highlights an increasing occurrence of MHs (p < 0.01), i.e., +21.7% for a 10-year period.
For the NEP basin (Figure 3b), the annual occurrence ranged between 0 and 13 MHs, with a median of 4.5 events per year, and also displays marked variations over the selected period. The trend that emerges from the time series is also positive (0.004) (i.e., +4% for a 10-year period), but the p-value of 0.33 indicates low statistical significance.

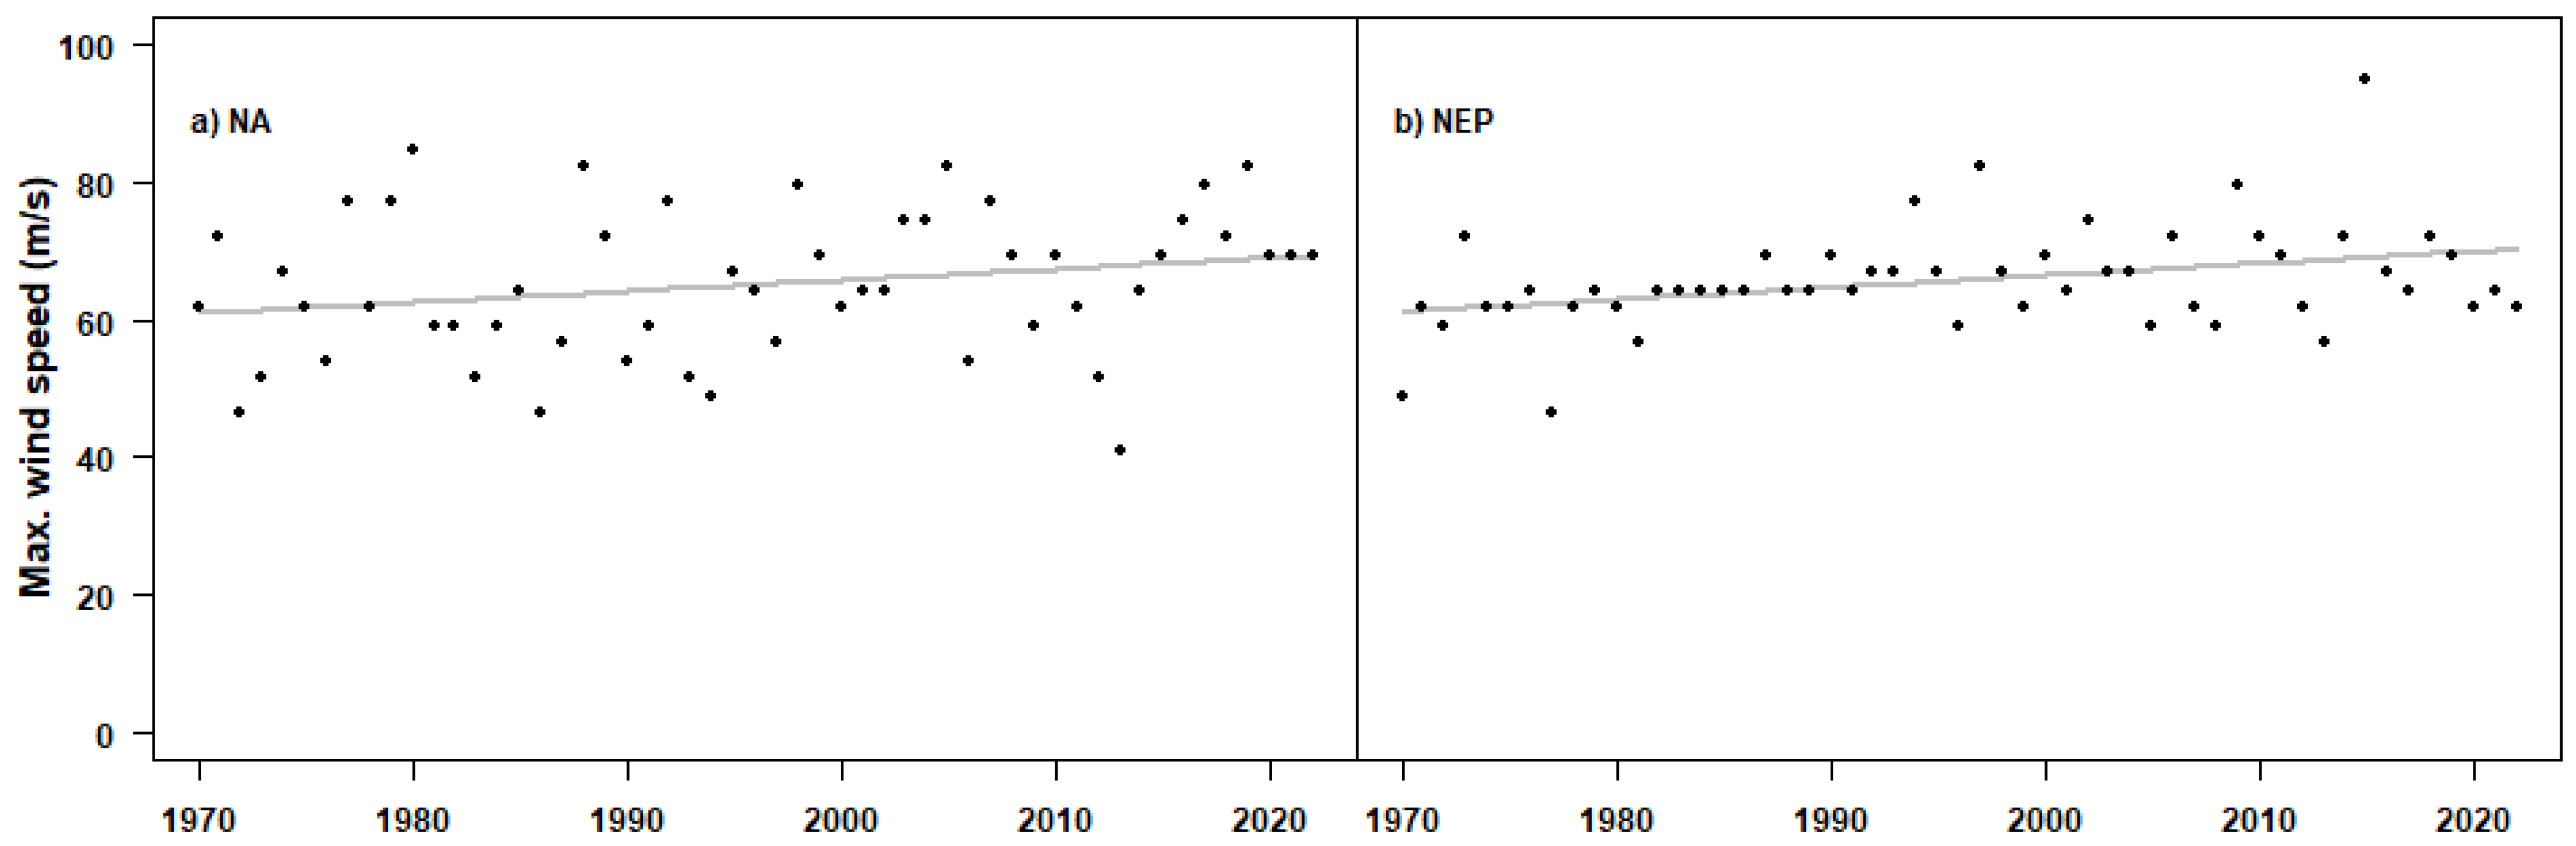
3.2. Intensity Trend

Not only has the number of MHs increased over time, but the maximum annual speed of MH events has also increased. This increment in MH speed in the NA basin is illustrated in Figure 4a. According to the trend lines, the increase in the maximum annual speed can also be observed over a 10-year interval. The NA basin shows an intensity trend value of +1.61 m·s−1 per 10 years (p = 0.09), while the NEP basin (Figure 4b) shows greater intensity increases amounting to +1.75 m·s−1 per 10 years (p < 0.01).

3.3. Trends in Local Occurrences

The trends of annual MH occurrences in NA showed a positive average of 0.07 in general and of 0.099 considering significant trends. On the other hand, the NEP also had consistent and positive trends of 0.055 and 0104, respectively.
Both basins (Figure 5) exhibit considerable spatial heterogeneity, and negative values (−0.25) are observed with absolute values close to the positive maxima (0.32). Particularly, the Atlantic Ocean basin shows a positive trend in the central region, in the areas surrounding the Bahamas and Puerto Rico, with positive values ranging from 0.1 to 0.32; the maximum value corresponds to the central part of the Atlantic MH zone, 10° east of the Bahamas. Indeed, the Atlantic Ocean exhibits a zone in the central Caribbean with high positive values that is more susceptible to hazards, particularly a large strip from north Florida to the central Atlantic passing through the Bahamas. However, in the Gulf of Mexico, trends are generally not significant, with either negative or low positive values.
In contrast, for the NEP basin, there is a medium-high positive trend in the central area, with values of up to 0.127, which decrease close to the Mexican coast; the exception is the Oaxaca and Nayarit coast, where tau remains high, with values of 0.13 and 0.22, respectively. Moreover, low negative and positive trends can be highlighted in areas surrounding the southern Gulf of California (with values between −0.15 and 0.13).

3.4. Relationship between MH Occurrences and Physical Variables

3.4.1. Multivariate Temporal Analysis

Stepwise analyses highlighted the main variables that have a statistically significant relationship with MH occurrences. At the basin scale, the GLM with the “Poisson” family suggests that occurrences in NA have a significant negative relationship with NINO34 (estimated coefficient = −0.309) and TNI (−0.151) and a positive relationship with TNA (0.346). The main factor is TNA (Table 2), with a PED of 24.3%, representative of the North Atlantic Tropical SST, highly correlated with AMO and Atlantic zone SST (Tables S1 and S2). Another important phenomenon is ENSO, with a PED of 18% for NINO34 plus TNI. Indeed, there is a known influence of ENSO on hurricane occurrence in the Caribbean zone [67]; moreover, this analysis confirmed that ENSO controls VWS in the zone [68,69,70]. In comparison, NEP MH occurrences are positively related with regional SST (estimated coefficient = 0.414; PED = 32.9%) and TNI (0.265) and negatively with TNA (−0.224) (p < 0.01 for the variable in the stepwise analysis). MH occurrence in the NEP is highly dependent of southern Pacific oscillations as local SST and SLP are correlated with NIÑO34. Although our results confirm the findings observed in previous studies, especially for NA, we found that the results with TNA indices also show atmospheric teleconnections in NEP, as does the NIÑO34 or TNI in NA. Besides confirming previous results, our study demonstrated the robustness of the methodology used.

3.4.2. Multivariate Spatial Analysis

The stepwise logistic regression results show a spatial correlation between the trends in annual MH occurrences and mean SST for the hurricane season (estimated coefficient = 0.023; PED = 24.8%) (Table 3). SST shows a positive trend in all study areas (Figure 6), particularly in the coldest zones (40° N) (Figure S1), SST tau is retained in the stepwise regression but rejected in the ANOVA analysis because of a high p-value that may be caused by the difference between NEP and NA. This can explain the expansion in the area of MH occurrence between the first period (to 1995) and the second period (since 1996). This is associated with the relationship between MHs and SST trend (estimated coefficient = −0.14), which demonstrates the expansion of the MH zone during the monitoring period (Figure 2), instead of the concentration of MHs in the areas that warm up at the fastest rate. This relationship should be interpreted with caution because SST tau is retained in the stepwise analysis (p < 0.05) but is rejected in the ANOVA with Chi-square test because of the high p-value that may have been caused by the difference between NEP and NA.
In addition, a slight spatial difference in SST was observed between the two basins (Figure 6). NA obtained higher values, except for the central Caribbean area, which showed moderate and low values (0.001–0.016). In the NEP, low values with positive trends predominated. Grid cells with intermediate values were observed in the central zone, which could also be related to the same significant cells in the occurrence trends.
SLP is a physical variable correlated with HM occurrences (Table 3). The increase in MH occurrences negatively correlated with SLP is physically consistent. In this case, both oceans showed a different distribution; neutral and negative values predominated throughout the NA basin, except near the equator (Figure 7a). NEP showed more significant hexagons, with positive trends near the coastal zone between Canada and Baja California, but the main MH zone had non-significant values.
Additionally, the trends in MH occurrence were related to VWS, a variable that was correlated with SST (−0.37) and SLP (0.55). Spatially, this relationship is particularly critical in areas near the southern Caribbean (15° N) with a high positive VWS. There, hexagons with lower VWS and SLP values (Figure 6b and Figure 7b) corresponded to grids with significant positive trends in MH occurrence (Figure 5). Similar to the SST trend, VWS has a high, significant, and positive spatial distribution in the coldest zone. However, these trends change for the NEP basin hexagons located near the equator, which had negative values. The data obtained for RH did not demonstrate a major role in the evolution of MH occurrences; for NA, RH tau had an estimated coefficient of 0.04 with a p-value of 0.06 and a PED value of 1.6%. Indeed, the trend in RH showed marked differences between the basins, with a decrease in the Caribbean Sea and the tropical Atlantic and the opposite trend, i.e., an increase, in the main Pacific MH zone; however, very few trends were significant.

4. Discussion

Although there may be a certain anthropogenic influence on MH occurrences, the drivers of tropical cyclones in these two basins are mostly natural [71]. The increase in MH occurrences is apparent at the oceanic scale and in some specific regions (Figure 5). However, the number of cells with records is much lower for the first half of the time series than for the second, indicating that many cells have had several recent occurrences. Therefore, it is not statistically possible to support the positive trend due to the low p-value. Indeed, MH occurrences seem mostly naturally driven, but the anthropogenic signal is likely more apparent (higher intensity at cat 4–5 s) over the past 15 years. It is important to consider that there is still a large uncertainty about it, so it is still an open topic for debate, as mentioned in the 2021 IPCC Group 1 Report [14].
Trend coefficients for annual maximum wind speeds were also calculated for each basin. A five-year period was used because it is useful for exploring trends in hurricane data, which could be masked by most ocean-atmosphere oscillations [72].
The results of MH occurrences in NA are consistent with those reported by Murakami et al. [15] and Amador et al. [41], i.e., an increasing trend in the occurrence of tropical cyclones from 1980 to 2021. To note, although there are differences in the periods and objects studied, the results are similar and indicate an increase in the overall trends. The 1970s corresponded to a cold phase of the Atlantic SST, which did not favour the formation of TCs [19,73] and may have influenced the trends calculated in the study. However, the p-values below 0.1 and the confidence intervals that do not intersect 0 eliminate the trends responding only to this variability.
In contrast, the observations from the NEP basin in the present study differ from those obtained by Murakami et al. [15]. These authors reported a decreasing trend, while in the present study, the results about the occurrence of MHs showed a positive trend with spatial heterogeneity and lacking statistical significance, consistent with Amador et al. (2016). This difference is mainly because the present analysis considered only MHs instead of all hurricanes. This approach allows us to emphasise the issue of the increasing intensity of tropical cyclones.
However, the time series is not sufficiently long to ensure that the trends observed are not biased by the presence of undetected cycles. In addition, any inaccurate estimates of the regional frequency of tropical cyclones with poor event detection and inaccurate tropical cyclone tracks may bias the annual mean number of hurricanes and affect the trend analysis [74]. This bias is minor and unlikely for MHs, particularly in these oceanic areas that were the first to have satellite tracking; nonetheless, the interval elapsed between IBTrACS records (3 h) may be too long for the accurate recording of the location of fast-moving cyclones at mid-latitudes.
According to Knutson et al. [75], increases between 2% and 21% in the average maximum speed of tropical cyclones worldwide are projected for the 21st century as a consequence of global warming. In NA, this study recorded a 4.5% increase in the average maximum hurricane speed, while the Northwest Pacific basin showed a 6% increase. In addition, there will probably be an increased intensity of category 4 and 5 tropical hurricanes, although it was estimated that this increase would be detectable until the second half of the 21st century, and it is unlikely that this growth will occur in the NA basin [75]. However, from the time series studied, MH frequency increased from 4% (non-significant) to 21.7% per decade. Regarding MH intensity, the NA basin showed that the average maximum speed increased by 161 m·s−1 over 10 years, while the NEP basin showed an increase of 1.75 m·s−1 over the same period. These particular data differ from the results reported by Knutson et al. [76], who reported a decrease in maximum wind speed in NEP between 1980 and 2010. This discrepancy demonstrates the high data variability and the need to consider longer time series to obtain robust results from the analysis.
The possible change in the intensity of MHs is exemplified by Hurricane Patricia, which hit the Pacific Ocean, reaching maximum winds of up to 95.7 m·s−1 in 2015 and still considered the most dangerous hurricane in this basin [77,78]. In addition, our results show similar changes in MH intensity in the two basins (Figure 4a,b).
As regards the trends in MHs, NA showed positive activity in the Mexican Caribbean, the Yucatan Channel, and the eastern coast of the United States. These are consistent with Elsner et al. [10], where a spatial assessment was carried out in 2005 for the same basin supported by 2° hexagonal grids. These authors reported greater activity in the central NA off the coast of the western Caribbean Sea, the eastern coast of the U.S., and towards the Gulf of Mexico.
Although there are differences in the study period, the scale of the hexagonal grid, and the categories of tropical cyclones, the dynamics observed in the present study match those reported by Elsner et al. [10] for the Mexican Pacific. The information for NEP is scarce; nonetheless, of the two basins, NEP is undoubtedly the one with the highest percentage of significant p-values, which makes it consistent and acceptable.
The Pacific Ocean showed a marked positive trend concentrated in the central area, whereas, in NA, weak positive and negative trends are more prevalent, with a clear spatial heterogeneity. This finding shows that the increasing trends in MHs are more evident in the western NEP area; for example, hurricanes Douglas, Genevieve, and Marie in 2020, all category 4, followed a similar trajectory and were of high impact.
On the other hand, the NA basin is correlated with oceanographic oscillations and physical variables like the TNA and ENSO, which may influence the occurrence of MHs. This assertion is supported by the NOAA report in 2019 that the atmospheric conditions that foster the AMO warm phase create the perfect storm and heighten hurricane activity and storm strength in the Atlantic. Indeed, changes in SST are particularly critical for NA as it warms faster than the southern oceans [79]. When La Niña appears, it is frequently associated with more active Atlantic hurricane seasons, and during El Niño, VWS increase in the Caribbean–TNA zone [80]. This suppresses the trend for tropical cyclone development in NA and decreases zonal wind shear in the eastern NEP, thus enhancing the trend of tropical cyclone development in this region. This inverse relationship is partly explained by the different effects of ENSO anomalies on tropospheric zonal wind shear in the NA and eastern NEP basins [81].
In the NEP basin, SST, TNI, and TNA are correlated with MH occurrence in this ocean. Ralph and Gough [82] concluded that SST plays a significant role in TC formation and intensity in NEP, although other factors are involved.
As for the trends in SST, our results indicated that the higher temperature rise in colder areas favours the homogenization of SST and, therefore, an increase in areas with SST above 26.5 °C—the threshold for the onset of cyclogenesis [83,84]. This is consistent with observations by Bang et al. [85], who reported increases between 0.7 °C and 1.5 °C in colder areas from 1981 to 2010. In 2019, NOAA also issued a global climate report detailing a mean 0.76 °C rise in SST in cold zones [86]. Scientists have established that this rise in ocean temperature in NA and NEP is fuelling the occurrence, intensity, and trajectory of TCs [87,88]. However, the zones with the greatest MH occurrence have low and intermediate SST values, and this physical variable does not drive the local increase in MH occurrences.
The trend in atmospheric VWS shows negative values near the equator and positive trends in the main MH development region and the coldest zones. This finding is similar to the report by Lau and Zhou [89], who detail negative trends along the equator while a marked reduction in VWS, favourable for enhanced tropical cyclone activity, occurs over the tropical Atlantic, particularly in the development region. However, this finding differs from our results because the trend in MH occurrence observed in the present study exhibits low values in that area. On the contrary, in the northeast Pacific, the VWS pattern shows both positive and negative trends [89].
Finally, SLP has negative values in the NA basin and is not significantly related to occurrence trends in NEP. These results agree with a previous study [85], which found negative trends in the entire Atlantic basin (Gulf of Mexico, Caribbean Sea, and Western Atlantic); therefore, SLP was generally below the average value, thereby enhancing cyclone activity.

5. Conclusions

This study evaluated the spatial variation in the occurrence of MHs and their annual trend in the NA and NEP basins during 1970–2021. From a multi-scale temporal analysis of MHs in the NA and NEP oceans, we observed a clear increase in MH occurrence and intensity. On a local scale, the NA basin shows changes in the number of cyclones per year over the 50-year study period, with this fluctuation being greater than two MHs. A 19% increase in MH frequency was observed every ten years, while for the maximum annual speed, an average increase of 1.61 m·s−1 was observed over ten years. A similar scenario was found for NEP, i.e., an increase of approximately 5% in the occurrence of MHs was observed along with an increase in speed of 1.75 m·s−1 every ten years. These increases in occurrence and intensity are critical because these imply a higher risk for coastal populations [90].
In terms of spatial variation and focusing on coastal areas, none of the two oceans has recorded many MHs, and the trend values in these areas are lower than the respective mean value for each basin. Murakami [15] used models and fingerprint detection/attribution techniques to explore the causes of the spatial pattern of changes observed (regional increases and decreases) in tropical storm frequency. The pattern of change in tropical storm frequency simulated by these authors since 1980 is similar to the one observed in the present study, suggesting a detectable influence of volcanic activity and external forcings like anthropogenic greenhouse gases and aerosols. However, human activities may have already caused other changes in tropical cyclone frequency and intensity not yet detectable due to the low magnitude of these changes compared to the estimated natural variability [91].
The relationship between climate change and the increase in the occurrence and intensity of tropical cyclones is evident, possibly due to changes in SST [92]. Our statistical analysis showed that most of the interannual variability could be attributed to physical variables in the NA basin, including VWS, AMO, and ENSO, particularly with La Niña phases, all of which influence hurricane occurrence. In the NEP basin, SST, RHU, and TNI are variables with a significant influence.

Supplementary Materials

The following supporting information can be downloaded at: https://www.mdpi.com/article/10.3390/cli11010015/s1, Figure S1: Average SST during the hurricane season; Table S1: Correlation matrix of climatic indices annual time series; Table S2: Correlation matrix of NA and NEP basin physical variable time series and climate indices.

Author Contributions

Conceptualization, D.R. and E.J.A.; methodology, D.R. and E.J.A.; software, L.-C.M. and D.R.; validation, L.-C.M. and D.R.; formal analysis, L.-C.M. and D.R.; investigation, L.-C.M.; resources, L.-C.M. and D.R.; data curation, L.-C.M.; writing—original draft preparation, L.-C.M. and D.R.; writing—review and editing, D.R. and E.J.A.; visualization, L.-C.M.; supervision, D.R.; project administration, D.R.; funding acquisition, D.R. All authors have read and agreed to the published version of the manuscript.

Funding

This research was funded by Programa de Apoyo a Proyectos de Investigación e Innovación Tecnológica (PAPIIT) of UNAM, grant number IA302220 and University of Costa Rica projects: C0-610 (Stimulus Fund), EC-497 (FEES-CONARE Outreach Fund), 805-C0-074, B0-810 (Supported by Cruz Roja Internacional), and 805-B9-454 (Groups Fund).

Data Availability Statement

Not applicable.

Conflicts of Interest

The authors declare no conflict of interest. The funders had no role in the design of the study; in the collection, analyses, or interpretation of data; in the writing of the manuscript; or in the decision to publish the results.

References

  1. CRED EM-DAT, The International Disaster Database. Available online: http://www.emdat.be/ (accessed on 10 April 2018).
  2. Sivakumar, M.V. Impacts of Natural Disasters in Agriculture, Rangeland and Forestry: An Overview. In Natural Disasters and Extreme Events in Agriculture; Springer: Berlin/Heidelberg, Germany, 2005; pp. 1–22. [Google Scholar]
  3. Nordhaus, W. The Economics of Hurricanes in the United States; National Bureau of Economic Research: Cambridge, MA, USA, 2006; p. w12813. [Google Scholar]
  4. Smith, A.B. U.S. Billion-Dollar Weather and Climate Disasters, 1980—Present (NCEI Accession 0209268); NOAA National Centers for Environmental Information Dataset: Washington, DC, USA, 2020. [CrossRef]
  5. Homewood, P. Tropical Hurricanes in the Age of Global Warming. GWPF Brief 2019, 37. [Google Scholar]
  6. Walsh, K.; Karoly, D.; Nicholls, N. Detection and Attribution of Climate Change Effects on Tropical Cyclones. In Hurricanes and Climate Change; Elsner, J.B., Jagger, T.H., Eds.; Springer: Boston, MA, USA, 2009; ISBN 978-0-387-09409-0. [Google Scholar]
  7. Knutson, T.R.; McBride, J.L.; Chan, J.; Emanuel, K.; Holland, G.; Landsea, C.; Held, I.; Kossin, J.P.; Srivastava, A.K.; Sugi, M. Tropical Cyclones and Climate Change. Nat. Geosci. 2010, 3, 157–163. [Google Scholar] [CrossRef] [Green Version]
  8. Walsh, K.; Lavender, S.; Murakami, H.; Scoccimarro, E.; Caron, L.-P.; Ghantous, M. The Tropical Cyclone Climate Model Intercomparison Project. In Hurricanes and Climate Change; Elsner, J.B., Hodges, R.E., Malmstadt, J.C., Scheitlin, K.N., Eds.; Springer: Dordrecht, The Netherlands, 2010; ISBN 978-90-481-9509-1. [Google Scholar]
  9. Kossin, J.P.; Camargo, S.J. Hurricane Track Variability and Secular Potential Intensity Trends. Clim. Change 2009, 97, 329–337. [Google Scholar] [CrossRef] [Green Version]
  10. Elsner, J.B.; Trepanier, J.C.; Strazzo, S.E.; Jagger, T.H. Sensitivity of Limiting Hurricane Intensity to Ocean Warmth: Sensitivity of the Strongest Hurricanes. Geophys. Res. Lett. 2012, 39, 1–6. [Google Scholar] [CrossRef] [Green Version]
  11. Frame, D.J.; Wehner, M.F.; Noy, I.; Rosier, S.M. The Economic Costs of Hurricane Harvey Attributable to Climate Change. Clim. Change 2020, 160, 271–281. [Google Scholar] [CrossRef] [Green Version]
  12. United Nations Office for Disaster Risk Reduction. 2009 UNISDR Terminology on Disaster Risk Reduction; United Nations Office for Disaster Risk Reduction: Geneva, Switzerland, 2009. [Google Scholar]
  13. Kossin, J.P.; Olander, T.L.; Knapp, K.R. Trend Analysis with a New Global Record of Tropical Cyclone Intensity. J. Clim. 2013, 26, 9960–9976. [Google Scholar] [CrossRef] [Green Version]
  14. Masson-Delmotte, V.; Zhai, P.; Pirani, A.; Connors, S.L.; Péan, C.; Berger, S.; Caud, N.; Chen, Y.; Goldfarb, L.; Gomis, M.; et al. Climate Change 2021: The Physical Science Basis; The Working Group I contribution to the Sixth Assessment Report; Intergovernmental Panel on Climate Change (IPCC): Geneva, Switzerland, 2021. [Google Scholar]
  15. Murakami, H.; Delworth, T.L.; Cooke, W.F.; Zhao, M.; Xiang, B.; Hsu, P.-C. Detected Climatic Change in Global Distribution of Tropical Cyclones. Proc. Natl. Acad. Sci. USA 2020, 117, 10706–10714. [Google Scholar] [CrossRef]
  16. Walsh, K.J.; McBride, J.L.; Klotzbach, P.J.; Balachandran, S.; Camargo, S.J.; Holland, G.; Knutson, T.R.; Kossin, J.P.; Lee, T.; Sobel, A.; et al. Tropical Cyclones and Climate Change. Wiley Interdiscip. Rev. Clim. Change 2016, 7, 65–89. [Google Scholar] [CrossRef]
  17. Niwa, Y.; Hibiya, T. Nonlinear Processes of Energy Transfer from Traveling Hurricanes to the Deep Ocean Internal Wave Field. J. Geophys. Res. Ocean. 1997, 102, 12469–12477. [Google Scholar] [CrossRef]
  18. Emanuel, K. Increasing Destructiveness of Tropical Cyclones over the Past 30 Years. Nature 2005, 436, 686–688. [Google Scholar] [CrossRef]
  19. Goldenberg, S.B. The Recent Increase in Atlantic Hurricane Activity: Causes and Implications. Science 2001, 293, 474–479. [Google Scholar] [CrossRef] [PubMed] [Green Version]
  20. Webster, P.J. Changes in Tropical Cyclone Number, Duration, and Intensity in a Warming Environment. Science 2005, 309, 1844–1846. [Google Scholar] [CrossRef] [PubMed] [Green Version]
  21. Wang, C.; Lee, S.-K.; Enfield, D.B. Atlantic Warm Pool Acting as a Link between Atlantic Multidecadal Oscillation and Atlantic Tropical Cyclone Activity. Geochem. Geophys. Geosystems 2008, 9, 1–17. [Google Scholar] [CrossRef] [Green Version]
  22. Poore, R.Z.; Brock, J. Evidence of Multidecadal Climate Variability in the Gulf of Mexico; Fact Sheet; U.S. Geological Survey: Reston, VA, USA, 2011; Volume 2011–3027, p. 2.
  23. Kossin, J.P.; Knapp, K.R.; Vimont, D.J.; Murnane, R.J.; Harper, B.A. A Globally Consistent Reanalysis of Hurricane Variability and Trends. Geophys. Res. Lett. 2007, 34, 1–6. [Google Scholar] [CrossRef] [Green Version]
  24. André, J.-C.; Royer, J.-F.; Chauvin, F. Les cyclones tropicaux et le changement climatique. Comptes Rendus Geosci. 2008, 340, 575–583. [Google Scholar] [CrossRef]
  25. Tennille, S.A.; Ellis, K.N. Spatial and Temporal Trends in the Location of the Lifetime Maximum Intensity of Tropical Cyclones. Atmosphere 2017, 8, 198. [Google Scholar] [CrossRef] [Green Version]
  26. Knapp, K.R.; Kruk, M.C.; Levinson, D.H.; Diamond, H.J.; Neumann, C.J. The International Best Track Archive for Climate Stewardship (IBTrACS): Unifying Tropical Cyclone Data. Bull. Am. Meteorol. Soc. 2010, 91, 363–376. [Google Scholar] [CrossRef] [Green Version]
  27. Knapp, K.R.; Diamond, H.J.; Kossin, J.P.; Kruk, M.C.; Schreck, C.J.I. International Best Track Archive for Climate Stewardship (IBTrACS) Project, Version 4. NOAA National Centers for Environmental Information. Available online: https://www.ncei.noaa.gov/data/international-best-track-archive-for-climate-stewardship-ibtracs/v04r00/access/ (accessed on 10 July 2022).
  28. Vecchi, G.A.; Knutson, T.R. Estimating Annual Numbers of Atlantic Hurricanes Missing from the HURDAT Database (1878–1965) Using Ship Track Density. J. Clim. 2011, 24, 1736–1746. [Google Scholar] [CrossRef]
  29. Farfán, L.M.; Alfaro, E.J.; Cavazos, T. Characteristics of Tropical Cyclones Making Landfall on the Pacific Coast of Mexico: 1970–2010. Atmósfera 2013, 26, 163–182. [Google Scholar] [CrossRef] [Green Version]
  30. Elms, J.D.; Neumann, C.J.; United States, National Environmental Satellite, Data, and Information Service; United States, National Weather Service; National Hurricane Center (U.S.); National Climatic Data Center (U.S.). Tropical Cyclones of the North Atlantic Ocean, 1871–1992; Historical Climatology Series; National Climatic Data Center: Asheville, NC, USA, 1993.
  31. Landsea, C.W. Atlantic Hurricane Database Uncertainty and Presentation of a New Database Format. Mon. Weather Rev. 2013, 141, 3576–3592. [Google Scholar] [CrossRef]
  32. Lee, H.S.; Yamashita, T.; Mishima, T. Multi-Decadal Variations of ENSO, the Pacific Decadal Oscillation and Tropical Cyclones in the Western North Pacific. Prog. Oceanogr. 2012, 105, 67–80. [Google Scholar] [CrossRef]
  33. Liu, K.S.; Chan, J.C.L. Inactive Period of Western North Pacific Tropical Cyclone Activity in 1998–2011. J. Clim. 2013, 26, 2614–2630. [Google Scholar] [CrossRef]
  34. Huang, B.; Thorne, P.W.; Banzon, V.F.; Boyer, T.; Chepurin, G.; Lawrimore, J.H.; Menne, M.J.; Smith, T.M.; Vose, R.S.; Zhang, H.-M. Extended Reconstructed Sea Surface Temperature, Version 5 (ERSSTv5): Upgrades, Validations, and Intercomparisons. J. Clim. 2017, 30, 8179–8205. [Google Scholar] [CrossRef]
  35. Kalnay, E.; Kanamitsu, M.; Kistler, R.; Collins, W.; Deaven, D.; Gandin, L.; Iredell, M.; Saha, S.; White, G.; Woollen, J.; et al. The NCEP/NCAR 40-Year Reanalysis Project. Bull. Am. Meteorol. Soc. 1996, 77, 437–472. [Google Scholar] [CrossRef]
  36. Moon, I.-J.; Kim, S.-H.; Klotzbach, P.; Chan, J.C.L. Roles of Interbasin Frequency Changes in the Poleward Shifts of the Maximum Intensity Location of Tropical Cyclones. Environ. Res. Lett. 2015, 10, 104004. [Google Scholar] [CrossRef] [Green Version]
  37. Jones, P.D.; Jonsson, T.; Wheeler, D. Extension to the North Atlantic Oscillation Using Early Instrumental Pressure Observations from Gibraltar and South-West Iceland. Int. J. Climatol. 1997, 17, 1433–1450. [Google Scholar] [CrossRef]
  38. Oliver, J.E. Pacific North American Oscillation (Pna). In Encyclopedia of World Climatology; Oliver, J.E., Ed.; Springer: Dordrecht, The Netherlands, 2005; pp. 563–564. ISBN 978-1-4020-3266-0. [Google Scholar]
  39. Trenberth, K.E.; Stepaniak, D.P. Indices of El Niño Evolution. J. Clim. 2001, 14, 1697–1701. [Google Scholar] [CrossRef]
  40. Enfield, D.B.; Mestas-Nuñez, A.M.; Mayer, D.A.; Cid-Serrano, L. How Ubiquitous Is the Dipole Relationship in Tropical Atlantic Sea Surface Temperatures? J. Geophys. Res. Ocean. 1999, 104, 7841–7848. [Google Scholar] [CrossRef]
  41. Amador, J.; Durán-quesada, A.; Rivera, E.; Mora, G.; Sáenz, F.; Calderon, B.; Mora, N. The Easternmost Tropical Pacific. Part II: Seasonal and Intraseasonal Modes of Atmospheric Variability. Rev. Biol. Trop. 2016, 64, 23–57. [Google Scholar] [CrossRef]
  42. Fraza, E.; Elsner, J.B. A Spatial Climatology of North Atlantic Hurricane Intensity Change: Spatial Climatology of North Atlantic TC Intensity Change. Int. J. Climatol. 2014, 34, 2918–2924. [Google Scholar] [CrossRef]
  43. Chen, J.; Chavas, D.R. Can Existing Theory Predict the Response of Tropical Cyclone Intensity to Idealized Landfall? J. Atmos. Sci. 2021, 78, 3281–3296. [Google Scholar] [CrossRef]
  44. Knutson, T.; Camargo, S.J.; Chan, J.C.L.; Emanuel, K.; Ho, C.-H.; Kossin, J.; Mohapatra, M.; Satoh, M.; Sugi, M.; Walsh, K.; et al. Tropical Cyclones and Climate Change Assessment: Part II: Projected Response to Anthropogenic Warming. Bull. Am. Meteorol. Soc. 2020, 101, 20. [Google Scholar] [CrossRef]
  45. Elsner, J.B.; Hodges, R.E.; Jagger, T.H. Spatial Grids for Hurricane Climate Research. Clim. Dyn. 2011, 39, 21–36. [Google Scholar] [CrossRef]
  46. Pebesma, E.J. Simple Features for R: Standardized Support for Spatial Vector Data. R J. 2018, 10, 439–446. [Google Scholar] [CrossRef] [Green Version]
  47. R Core Team. R: A Language and Environment for Statistical Computing; R Foundation for Statistical Computing: Vienna, Austria, 2020. [Google Scholar]
  48. Hijmans, R.J.; van Etten, J.; Mattiuzzi, M.; Sumner, M.; Greenberg, J.A.; Lamigueiro, O.P.; Bevan, A.; Racine, E.B.; Shortridge, A. Raster: Geographic Data Analysis and Modeling; CRAN: Vienna, Austria, 2015. [Google Scholar]
  49. Wickham, H.; François, R.; Henry, L.; Müller, K. Dplyr: A Grammar of Data Manipulation; RStudio: Boston, MA, USA, 2020. [Google Scholar]
  50. Elsner, J.; Jagger, T. Hurricane Climatology: A Modern Statistical Guide Using R; Oxford University Press: Oxford, UK, 2013; ISBN 978-0-19-982763-3. [Google Scholar]
  51. Bender, M.A.; Knutson, T.R.; Tuleya, R.E.; Sirutis, J.J.; Vecchi, G.A.; Garner, S.T.; Held, I.M. Modeled Impact of Anthropogenic Warming on the Frequency of Intense Atlantic Hurricanes. Science 2010, 327, 454–458. [Google Scholar] [CrossRef] [Green Version]
  52. Knutson, T.R.; Sirutis, J.J.; Vecchi, G.A.; Garner, S.; Zhao, M.; Kim, H.-S.; Bender, M.; Tuleya, R.E.; Held, I.M.; Villarini, G. Dynamical Downscaling Projections of Twenty-First-Century Atlantic Hurricane Activity: CMIP3 and CMIP5 Model-Based Scenarios. J. Clim. 2013, 26, 6591–6617. [Google Scholar] [CrossRef]
  53. McLeod, A.I. Kendall: Kendall Rank Correlation and Mann-Kendall Trend Test; CRAN: Vienna, Austria, 2022. [Google Scholar]
  54. Mann, H.B. Nonparametric Tests against Trend. Econom. J. Econom. Soc. 1945, 13, 245–259. [Google Scholar] [CrossRef]
  55. Kendall, M.G. Rank Correlation Methods; Griffin: London, UK, 1948. [Google Scholar]
  56. Huang, W.; Dong, S. Long-Term and Inter-Annual Variations of Tropical Cyclones Affecting Taiwan Region. Reg. Stud. Mar. Sci. 2019, 30, 100721. [Google Scholar] [CrossRef]
  57. Gu, X.; Zhang, Q.; Singh, V.P.; Liu, L.; Shi, P. Spatiotemporal Patterns of Annual and Seasonal Precipitation Extreme Distributions across China and Potential Impact of Tropical Cyclones. Int. J. Climatol. 2017, 37, 3949–3962. [Google Scholar] [CrossRef]
  58. Schneider, G.; Chicken, E.; Becvarik, R. NSM3: Functions and Datasets to Accompany Hollander, Wolfe, and Chicken—Nonparametric Statistical Methods, 3rd ed.; CRAN: Vienna, Austria, 2022. [Google Scholar]
  59. Murtaugh, P.A. In Defense of P Values. Ecology 2014, 95, 611–617. [Google Scholar] [CrossRef]
  60. Moran, P.A. Notes on Continuous Stochastic Phenomena. Biometrika 1950, 37, 17–23. [Google Scholar] [CrossRef] [PubMed]
  61. James, G.; Witten, D.; Hastie, T.; Tibshirani, R. An Introduction to Statistical Learning: With Applications in R; Springer Texts in Statistics; Springer: New York, NY, USA, 2013; ISBN 978-1-4614-7137-0. [Google Scholar]
  62. Bruce, P.; Bruce, A. Practical Statistics for Data Scientists: 50 Essential Concepts; O’Reilly Media, Inc.: Sebastopol, CA, USA, 2017; ISBN 978-1-4919-5293-1. [Google Scholar]
  63. Lumley, T. Based on Fortran Code by Miller A. Leaps: Regression Subset Selection. 2010. Available online: https://CRAN.R-project.org/package=leaps (accessed on 22 June 2022).
  64. Ripley, B.; Venables, B.; Bates, D.M.; Hornik, K.; Gebhardt, A.; Firth, D. MASS: Support Functions and Datasets for Venables and Ripley’s MASS; CRAN: Vienna, Austria, 2021. [Google Scholar]
  65. Akaike, H. A New Look at the Statistical Model Identification. IEEE Trans. Autom. Control. 1974, 19, 716–723. [Google Scholar] [CrossRef]
  66. Dunn, P.K.; Smyth, G.K. Generalized Linear Models with Examples in R; Springer: New York, NY, USA, 2018; Volume 53. [Google Scholar]
  67. Bell, G.D.; Chelliah, M. Leading Tropical Modes Associated with Interannual and Multidecadal Fluctuations in North Atlantic Hurricane Activity. J. Clim. 2006, 19, 590–612. [Google Scholar] [CrossRef] [Green Version]
  68. Goldenberg, S.B.; Shapiro, L.J. Physical Mechanisms for the Association of El Niño and West African Rainfall with Atlantic Major Hurricane Activity. J. Clim. 1996, 9, 1169–1187. [Google Scholar] [CrossRef]
  69. Zhu, X.; Saravanan, R.; Chang, P. Influence of Mean Flow on the ENSO–Vertical Wind Shear Relationship over the Northern Tropical Atlantic. J. Clim. 2012, 25, 858–864. [Google Scholar] [CrossRef]
  70. Shaman, J.; Maloney, E.D. Shortcomings in Climate Model Simulations of the ENSO-Atlantic Hurricane Teleconnection. Clim. Dyn. 2012, 38, 1973–1988. [Google Scholar] [CrossRef]
  71. Alfaro, E.J. Escenarios climáticos para temporadas con alto y bajo número de huracanes en el Atlántico. Rev. Climatol. 2007, 7, 14. [Google Scholar]
  72. Holland, G.; Bruyère, C.L. Recent Intense Hurricane Response to Global Climate Change. Clim. Dyn. 2014, 42, 617–627. [Google Scholar] [CrossRef] [Green Version]
  73. NOAA Atlantic High-Activity Eras: What Does It Mean for Hurricane Season?|National Oceanic and Atmospheric Administration. Available online: https://www.noaa.gov/stories/atlantic-high-activity-eras-what-does-it-mean-for-hurricane-season (accessed on 25 June 2021).
  74. Moon, I.-J.; Kim, S.-H.; Chan, J.C.L. Climate Change and Tropical Cyclone Trend. Nature 2019, 570, E3–E5. [Google Scholar] [CrossRef]
  75. Knutson, T.R.; Sirutis, J.J.; Zhao, M.; Tuleya, R.E.; Bender, M.; Vecchi, G.A.; Villarini, G.; Chavas, D. Global Projections of Intense Tropical Cyclone Activity for the Late Twenty-First Century from Dynamical Downscaling of CMIP5/RCP4.5 Scenarios. J. Clim. 2015, 28, 7203–7224. [Google Scholar] [CrossRef] [Green Version]
  76. Knutson, T.; Camargo, S.J.; Chan, J.C.L.; Emanuel, K.; Ho, C.-H.; Kossin, J.; Mohapatra, M.; Satoh, M.; Sugi, M.; Walsh, K.; et al. Tropical Cyclones and Climate Change Assessment: Part I: Detection and Attribution. Bull. Am. Meteorol. Soc. 2019, 100, 1987–2007. [Google Scholar] [CrossRef]
  77. Castro Lopez, J.; Zavala Trujillo, B.; Figueroa Lara, A. La física de los huracanes Paulina y Patricia en su paso por el pacífico mexicano. Rev. Mex. Física E 2020, 17, 33. [Google Scholar] [CrossRef] [Green Version]
  78. Nystrom, R.G.; Zhang, F. Practical Uncertainties in the Limited Predictability of the Record-Breaking Intensification of Hurricane Patricia (2015). Mon. Weather Rev. 2019, 147, 3535–3556. [Google Scholar] [CrossRef]
  79. Arora, K.; Dash, P. Towards Dependence of Tropical Cyclone Intensity on Sea Surface Temperature and Its Response in a Warming World. Climate 2016, 4, 30. [Google Scholar] [CrossRef]
  80. Klotzbach, P.J.; Schreck, C.J., III; Collins, J.M.; Bell, M.M.; Blake, E.S.; Roache, D. The Extremely Active 2017 North Atlantic Hurricane Season. Mon. Weather Rev. 2018, 146, 3425–3443. [Google Scholar] [CrossRef]
  81. Gutzler, D.S. Interannual Variability of Tropical Cyclone Activity along the Pacific Coast of North America. Atmósfera 2013, 26, 149–162. [Google Scholar] [CrossRef] [Green Version]
  82. Ralph, T.U.; Gough, W.A. The Influence of Sea-Surface Temperatures on Eastern North Pacific Tropical Cyclone Activity. Theor. Appl. Climatol. 2009, 95, 257–264. [Google Scholar] [CrossRef]
  83. Gray, W.M. Atlantic Seasonal Hurricane Frequency. Part I: El Niño and 30 Mb Quasi-Biennial Oscillation Influences. Mon. Weather Rev. 1984, 112, 1649–1668. [Google Scholar] [CrossRef]
  84. McTaggart-Cowan, R.; Davies, E.L.; Fairman, J.G.; Galarneau, T.J.; Schultz, D.M. Revisiting the 26.5 °C Sea Surface Temperature Threshold for Tropical Cyclone Development. Bull. Am. Meteorol. Soc. 2015, 96, 1929–1943. [Google Scholar] [CrossRef]
  85. Bang, H.N.; Miles, L.S.; Gordon, R.D. Hurricane Occurrence and Seasonal Activity: An Analysis of the 2017 Atlantic Hurricane Season. Am. J. Clim. Change 2019, 8, 454–481. [Google Scholar] [CrossRef] [Green Version]
  86. NOAA; National Centers for Environmental Information. State of the Climate—Global Analysis. Available online: https://www.ncei.noaa.gov/access/metadata/landing-page/bin/iso?id=gov.noaa.ncdc:C00672 (accessed on 28 June 2021).
  87. Kerry, E. Divine Wind: The History and Science of Hurricanes; Oxford University Press: Oxford, UK, 2005; ISBN 978-0-19-514941-8. [Google Scholar]
  88. Hall, T.; Tippett, M.K. Pacific Hurricane Landfalls on Mexico and SST. J. Appl. Meteorol. Climatol. 2017, 56, 667–676. [Google Scholar] [CrossRef] [PubMed]
  89. Lau, W.; Zhou, Y. Observed Recent Trends in Tropical Cyclone Rainfall over the North Atlantic and the North Pacific. J. Geophys. Res. Atmos. 2012, 117, 3104. [Google Scholar] [CrossRef]
  90. Mousavi, M.E.; Irish, J.L.; Frey, A.E.; Olivera, F.; Edge, B.L. Global Warming and Hurricanes: The Potential Impact of Hurricane Intensification and Sea Level Rise on Coastal Flooding. Clim. Change 2011, 104, 575–597. [Google Scholar] [CrossRef]
  91. Knutson, T. Global Warming and Hurricanes. Available online: https://www.gfdl.noaa.gov/global-warming-and-hurricanes/ (accessed on 30 June 2021).
  92. Hoyos, C.D.; Agudelo, P.A.; Webster, P.J.; Curry, J.A. Deconvolution of the Factors Contributing to the Increase in Global Hurricane Intensity. Science 2006, 312, 94–97. [Google Scholar] [CrossRef] [PubMed]
Figure 1. Occurrence of MHs in NEP and NA from 1970 to 2021 (hexagons are 3.5°).
Climate 11 00015 g001
Figure 2. Occurrence of MHs in the NEP and NA basins for: (a) 1970 to 1995; and (b) 1996 to 2021 (hexagons are 3.5°).
Climate 11 00015 g002
Figure 3. Annual number and trend of MHs in: (a) the NA basin (p < 0.01); and (b) the NEP basin (p > 0.1).
Climate 11 00015 g003
Figure 4. Annual maximum speed and relative trend in (a) the NA basin (p < 0.1), and (b) the NEP basin (p < 0.01).
Climate 11 00015 g004
Figure 5. Trends in MH occurrences from 1970 to 2021. Cells hatched with white lines have a non-significant trend (p > 0.05).
Climate 11 00015 g005
Figure 6. Spatial trends in: (a) SST; and (b) VWS calculated from 1970 to 2021. Cells hatched with white lines have a non-significant trend.
Climate 11 00015 g006
Figure 7. Spatial trends in: (a) sea level pressure; and (b) relative humidity calculated from 1970 to 2021. Cells hatched with white lines have a non-significant trend.
Climate 11 00015 g007
Table 1. Spatial autocorrelation and number of cells (n).
BasinPeriodnMoran’s Indexp-Value
NEP1970–1995770.41810
NEP1996–2021900.31370
NA1970–19951230.07610.0015
NA1996–20211510.27840
Table 2. Results from multivariate temporal analysis of MH occurrences.
BasinIndexEstimatep-ValuesPED
NANIÑO34−0.3090.00511.0%
TNI−0.1510.0257.0%
TNA0.346>0.00124.3%
NEPTNI0.2650.0593.4%
TNA−0.2240.1472.0%
SST0.4140.00032.9%
Table 3. Relationship between trends in MH variability and physical variables.
VariableEstimated Coefficientp-ValuesPED
SLP tau−0.0120.0091.3%
SST mean0.023>0.00124.8%
Disclaimer/Publisher’s Note: The statements, opinions and data contained in all publications are solely those of the individual author(s) and contributor(s) and not of MDPI and/or the editor(s). MDPI and/or the editor(s) disclaim responsibility for any injury to people or property resulting from any ideas, methods, instructions or products referred to in the content.

