Article

Apolipoprotein A-IV Has Bi-Functional Actions in Alcoholic Hepatitis by Regulating Hepatocyte Injury and Immune Cell Infiltration

1
Pharmaceutical Experiment Teaching Center, College of Pharmacy, Harbin Medical University, Harbin 150081, China
2
Pharmaceutical Analysis and Analytical Chemistry, College of Pharmacy, Harbin Medical University, Harbin 150081, China
*
Authors to whom correspondence should be addressed.
These authors contributed equally to this work.
Int. J. Mol. Sci. 2023, 24(1), 670; https://doi.org/10.3390/ijms24010670
Submission received: 4 October 2022 / Revised: 23 December 2022 / Accepted: 25 December 2022 / Published: 30 December 2022
(This article belongs to the Section Molecular Toxicology)

Abstract

:
Alcohol abuse can lead to alcoholic hepatitis (AH), a worldwide public health issue with high morbidity and mortality. Here, we identified apolipoprotein A-IV (APOA4) as a biomarker and potential therapeutic target for AH. APOA4 expression was detected by Gene Expression Omnibus (GEO) databases, Immunohistochemistry, and qRT-PCR in AH. Bioinformatics Methods (protein–protein interaction (PPI) network, Gene Ontology (GO) and Kyoto Encyclopedia of Genes and Genomes (KEGG) pathways and Gene Set Enrichment Analysis (GSEA) were used to show down-stream gene and pathways of APOA4 in AH. AML-12 cells were used to evaluate the biological function of APOA4 using an ELISA kit (AST, ALT, and IL-1β) and flow cytometry (ROS activity). Both in vivo and in vitro, APOA4 expression was significantly elevated in the AH model induced by alcohol (ETOH). AML-12 cell damage was specifically repaired by APOA4 deficiency, while AST, ALT, and IL-1β activity that was increased by ETOH (200 µmol, 12 h) were suppressed. APOA4 inhibition increased intracellular ROS induced by ETOH, which was detected by flow cytometry. Functional and PPI network analyses showed Fcgamma receptor (FCGR) and platelet activation signaling were potential downstream pathways. We identified CIDEC as a downstream gene of APOA4. The CIDEC AUC values for the ROC curves were 0.861. At the same time, APOA4 silencing downregulated the expression of CIDEC, whereas the knockdown of CIDEC did not influence the expression of APOA4 in AML-12 cells. Collectively, APOA4 regulates CIDEC expression and immune cell infiltration and may hold great potential as a biomarker and therapeutic target for AH.

1. Introduction

Alcohol abuse can lead to alcoholic liver disease (ALD), which is the main cause of liver-related morbidity and mortality worldwide and contributes to 0.9% of all fatalities worldwide [1,2,3]. About 35% of heavy alcohol users may develop alcoholic hepatitis (AH) associated with high mortality [4,5]. Currently, the diagnosis of AH depends mainly on pathologic examination and medical imaging. However, finding a reliable biomarker and therapeutic target for AH is necessary.
Patients with AH are highly predisposed to infection due to diminished antimicrobial responses in monocytes and neutrophils [6]. Immunotherapy is one of the most advanced therapies to date and has been widely used in the treatment of AH [7,8,9]. Recent investigations have linked the immune microenvironment and the invasion of immune cells to AH onset, progression, prognosis, and treatment response. Both immune cells and stroma cells play crucial roles in hepatic biology. Immune-associated molecules modulate the invasion of immune cells, a process associated with the response to immune therapy. Hence, we speculated that immune-associated factors might be used to estimate the prognosis and treatment for patients with AH.
APOA4, a plasma lipoprotein, modulates several metabolic processes, such as the metabolism of lipids and glucose [10]. It has been reported that APOA4 accelerates the secretion of triglycerides from the liver [11]. The content of APOA4 in plasma correlates positively with the level of high-density lipoproteins; APOA4 significantly promotes insulin secretion triggered by glucose and decreases the generation of products in the liver. By stimulating pancreatic insulin production, APOA4 improves glucose homeostasis, which contributes to the suppression of hepatic gluconeogenesis and the promotion of glucose uptake into adipose tissues in the absence of insulin [12]. APOA4 is markedly associated with obesity in mice, humans, and type 2 diabetes [13]. In addition, the level of circulating APOA4 has been used as a biomarker for the early diagnosis of liver fibrosis [14,15,16]. It has become increasingly clear that APOA4 is involved in various physiological functions, including inflammation reduction [17] and antioxidant activity [18]. Furthermore, many diverse transcription factors, including ERR-α, HNF-4α, CREB, SERBP1, CREBH, and PPARα, could influence APOA4 expression [19]. These factors slowed the progress of the AH [20,21,22]. However, the underlying molecular regulatory mechanisms and cascades of APOA4’s role in AH remain unclear.
In the current study, we demonstrated that APOA4, an immune-associated gene, has remarkable prognostic value and anti-AH effect. We also developed a model to estimate the response to therapy of people with AH.

2. Results

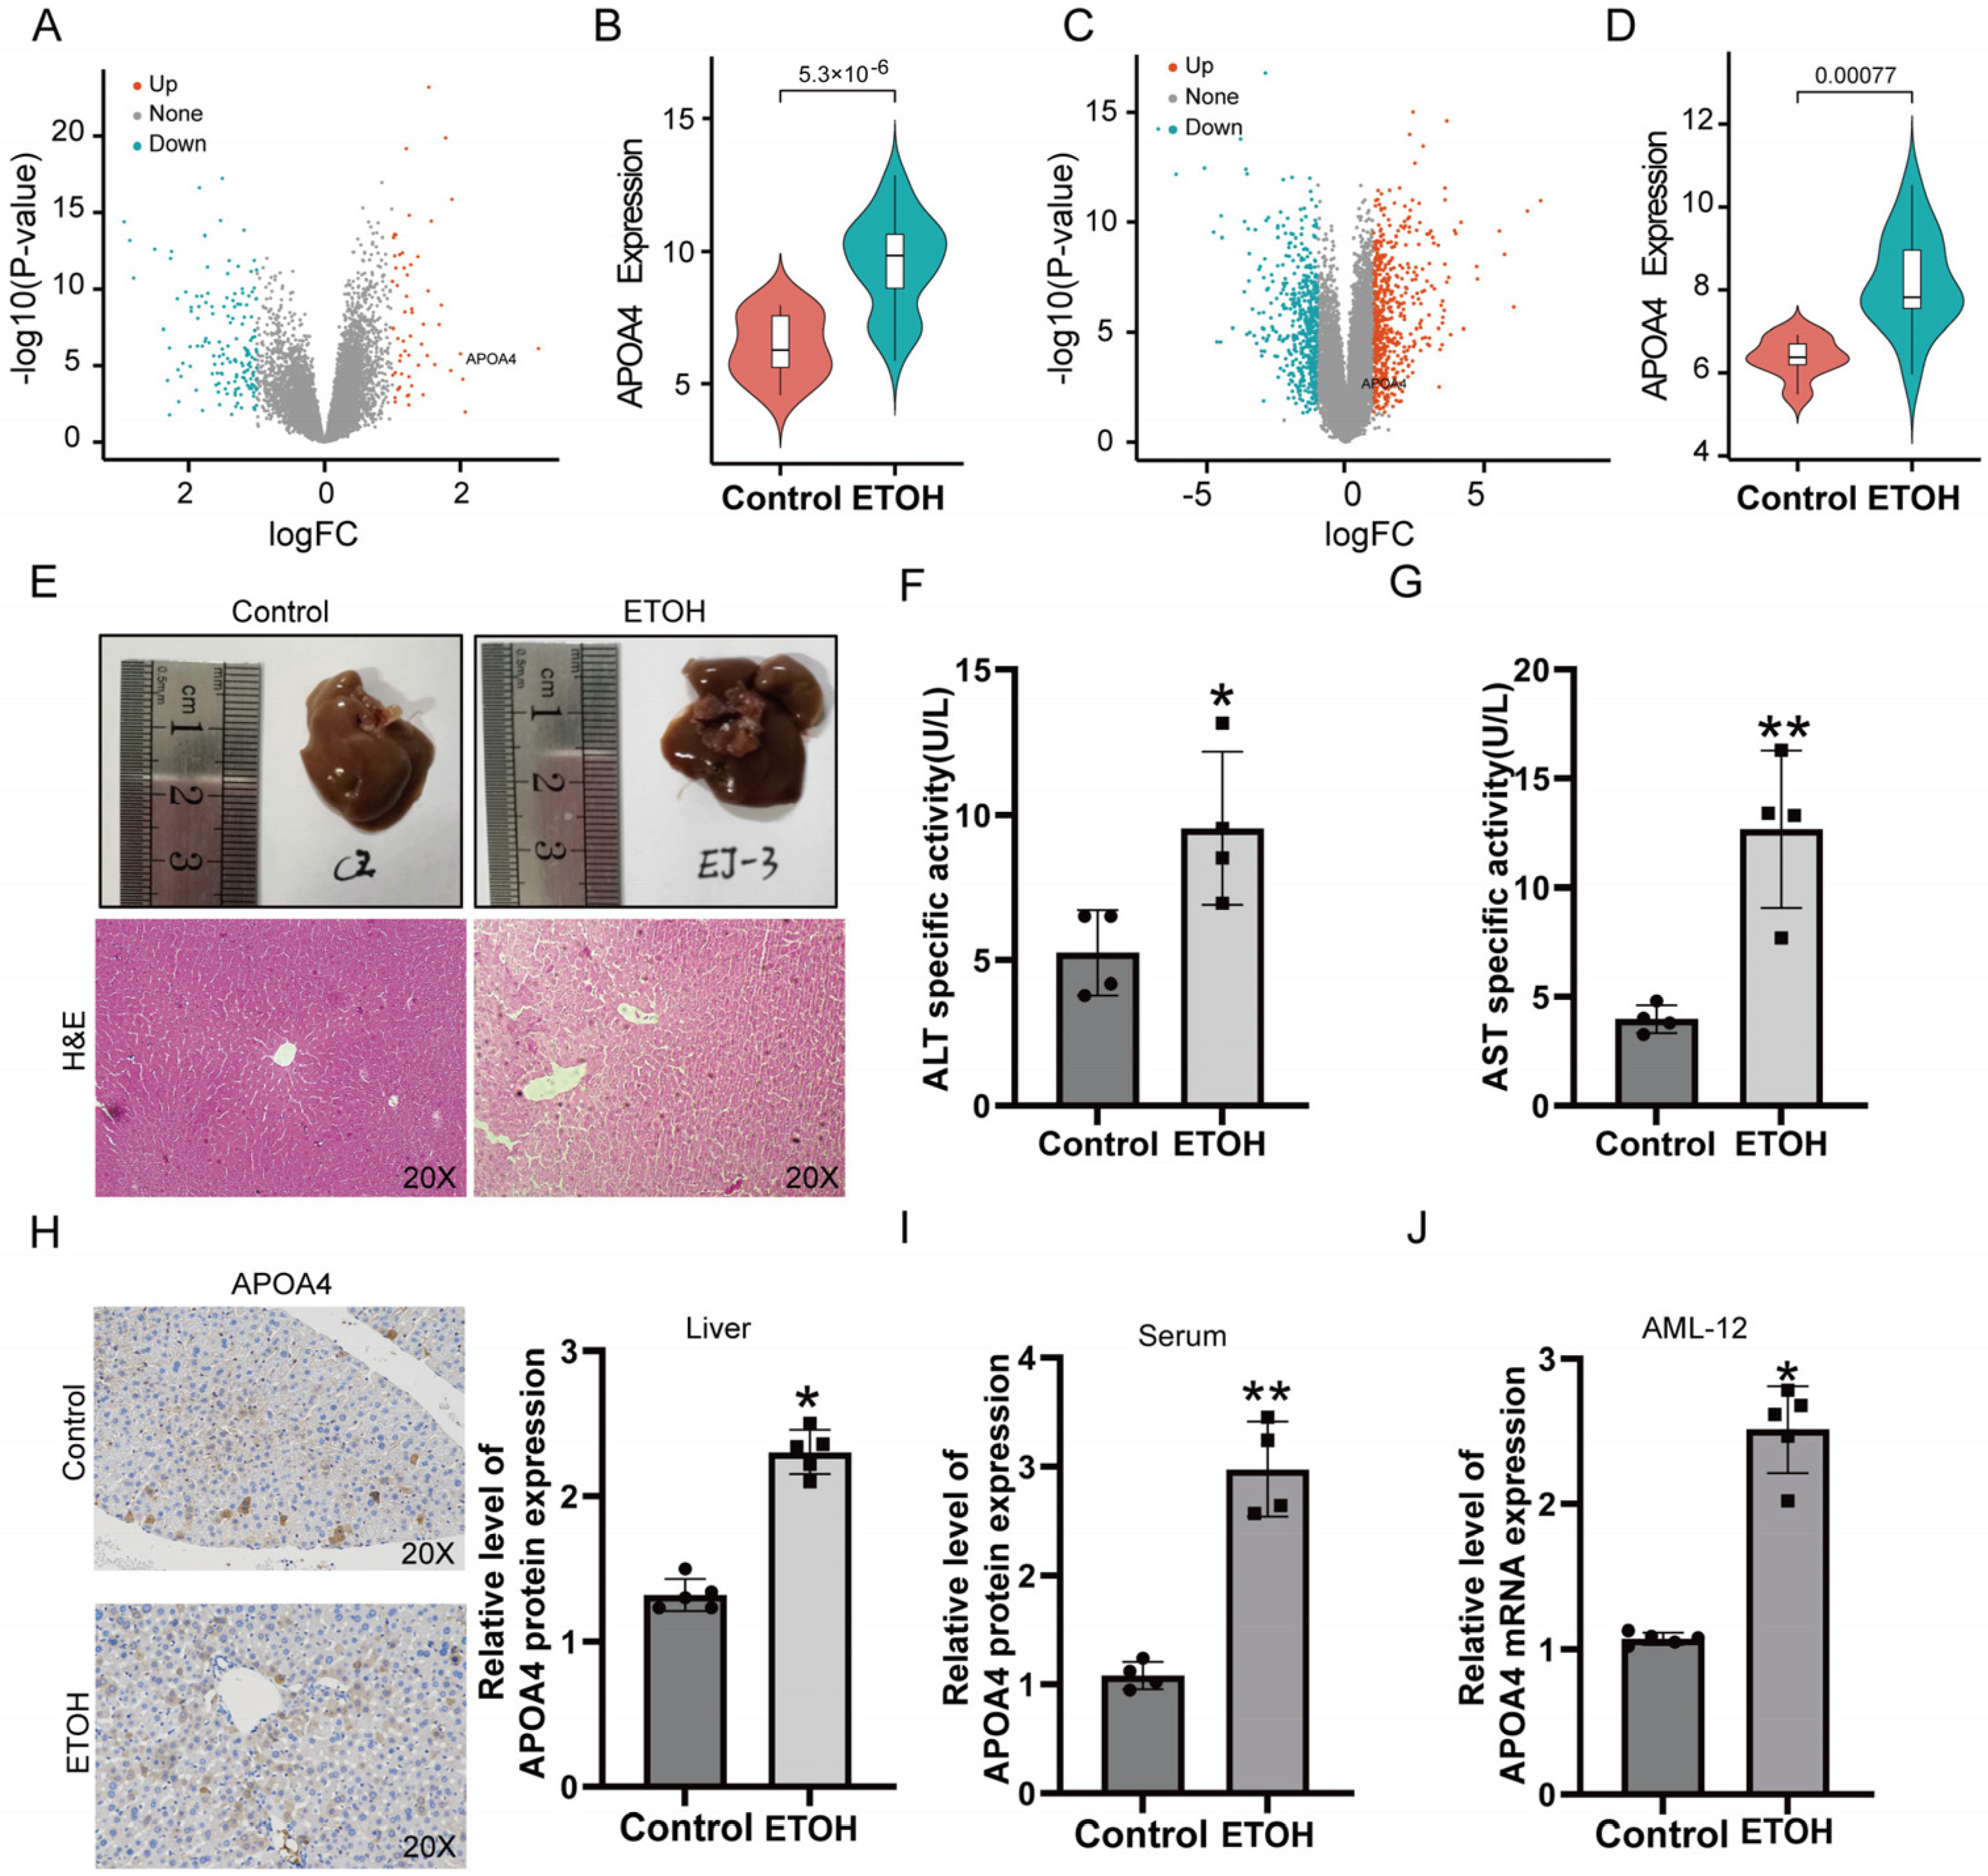
2.1. Validation of APOA4 Expression

Our analysis indicated differential expression of APOA4 in both the Array Express (logFC = 3.149, p < 0.0001) and GEO (logFC = 1.838, p = 0.0008) cohorts (Figure 1A,B). APOA4 expression was significantly higher in the patients with AH (Figure 1C,D). To further confirm the role of APOA4 in AH, we established a vivo model of AH (Figure 1E). Our data showed that the alanine aminotransferase (ALT)/aspartate aminotransferase (AST) in serum is significant elevation in the alcohol hepatocyte (ETOH) group (Figure 1F,G). While in both AH tissue and serum, after treatment with alcohol, the expression of APOA4 was increased (Figure 1H,I). In addition, in the vitro model [23], AML-12 cells were treated for 12 h with alcohol at a concentration of 200 μmol/L. The expression of APOA4 was significantly increased in the ETOH group (Figure 1J). These data indicated that APOA4 was elevated in AH.

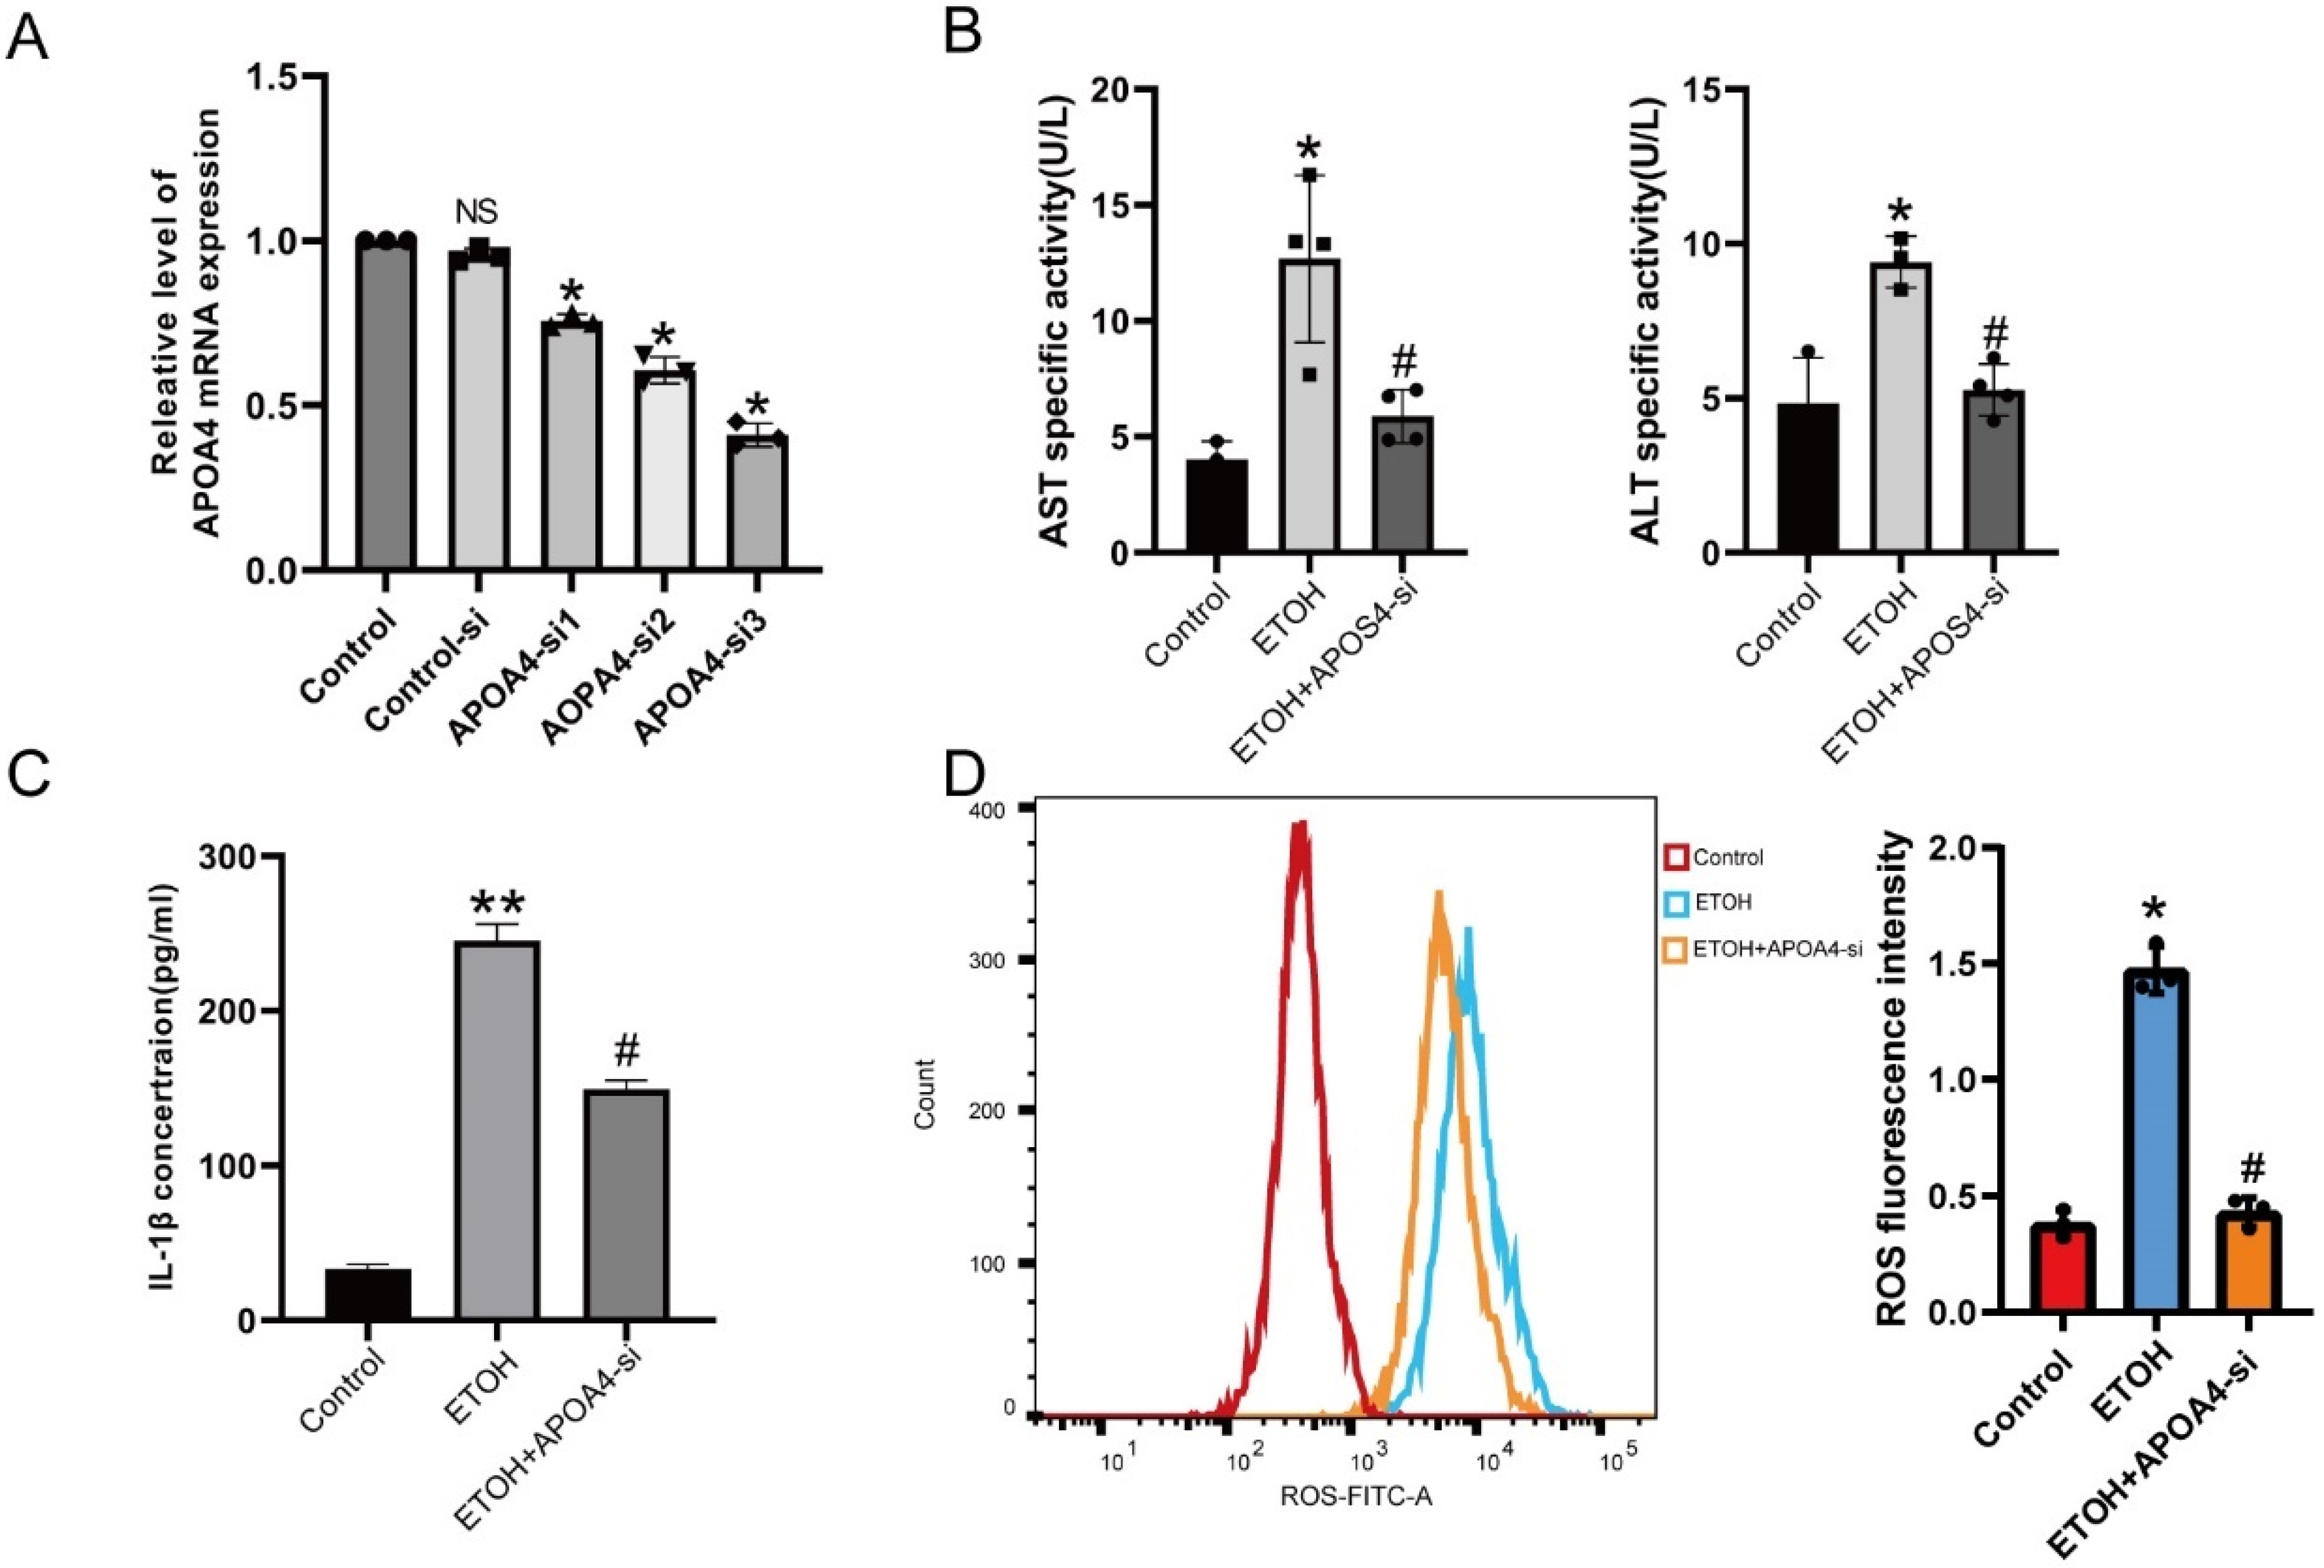
2.2. Alcohol-Induced AML-12 Cell Injury in the Presence of APOA4 Knockdown

To explore the role of APOA4 in AH, we knocked down the expression of APOA4 in AML-12 cells (Figure 2A). The ETOH treatment increased the activity of AST, ALT (Figure 2B), and IL-1β (Figure 2C), whereas APOA4 knockdown decreased AST, ALT, and IL-1β activity. DCFH-DA staining result also indicated increased intracellular ROS in the ETOH group. Silenced APOA4 notably inhibited ROS increasing induced by ETOH (Figure 2D). Therefore, our data showed that suppression of APOA4 could protect against ETOH-induced AML-12 injury.

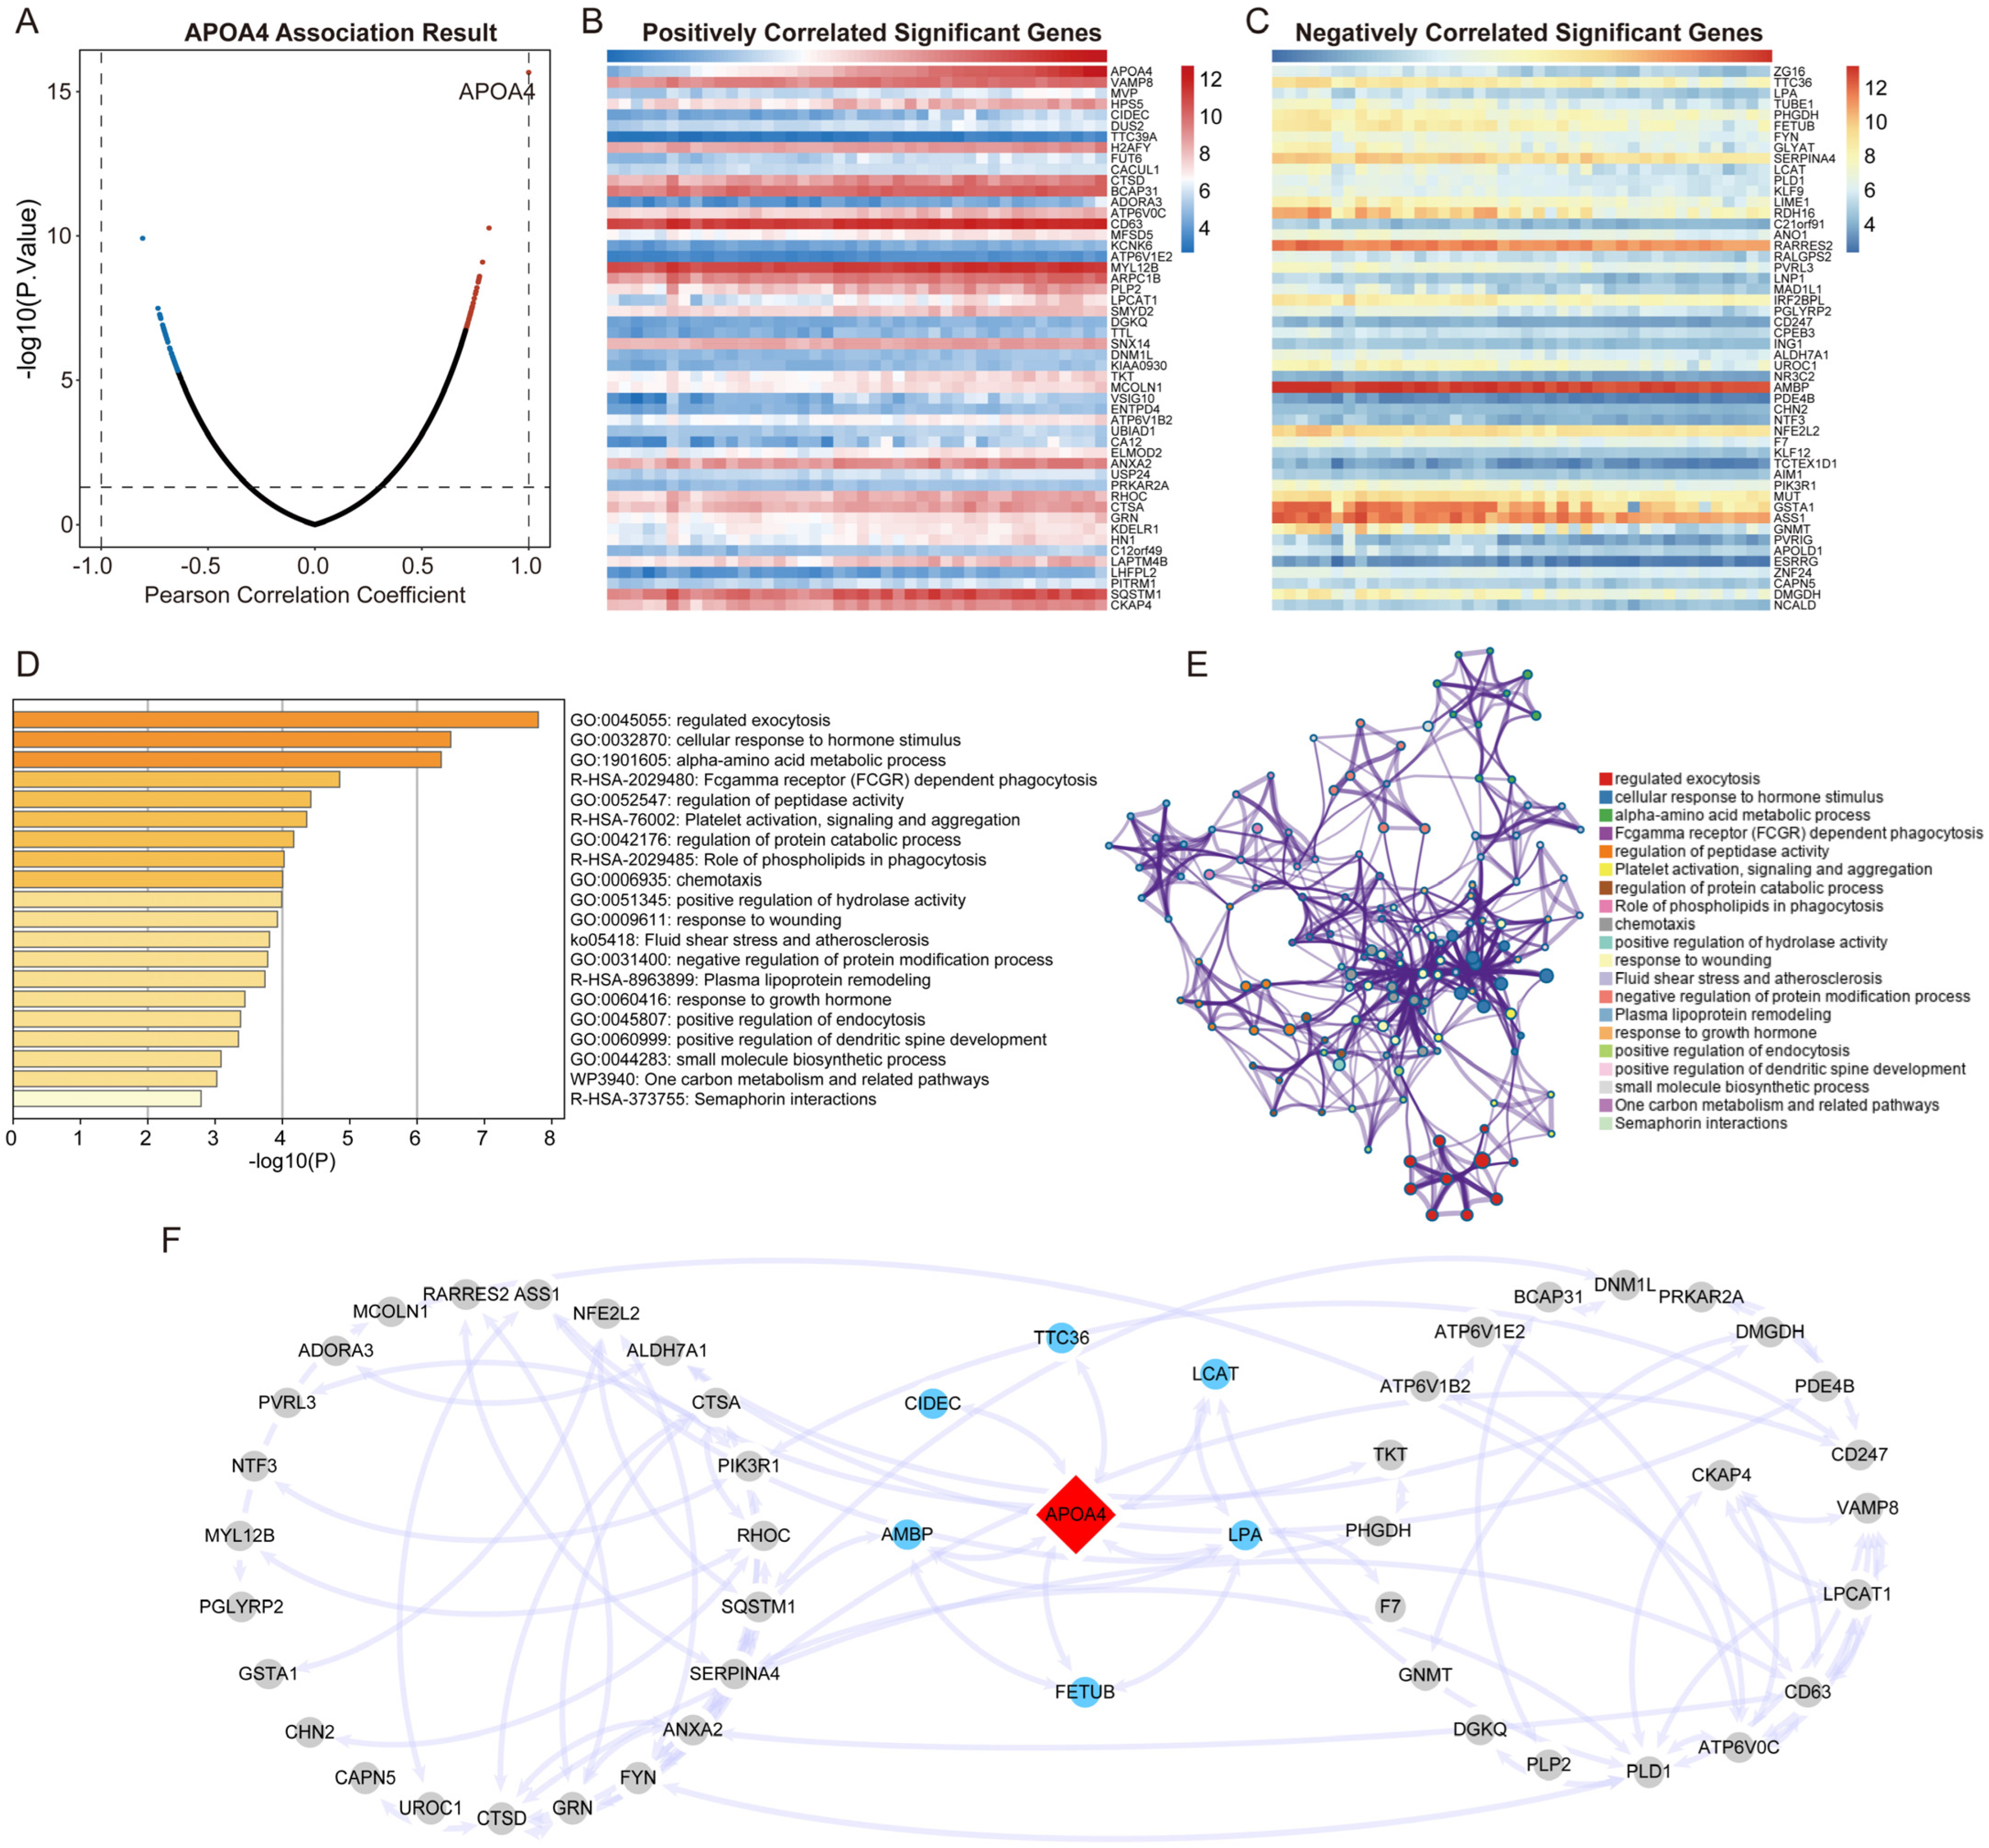
2.3. Identification of APOA4 Co-Expressed Genes

To investigate the biological significance of APOA4 in AH and the downstream pathways involved. We identified the protein-coding genes of APOA4 and its co-expression genes in AH. As shown in Figure 3A, Pearson’s correlation analysis was used to identify genes that showed a positive and negative correlation with APOA4 in AH tissues from the ArrayExpress cohort. The heatmap demonstrated the expression levels of the top 50 protein-coding genes that positively and negatively correlated with APOA4, respectively (Figure 3B,C).

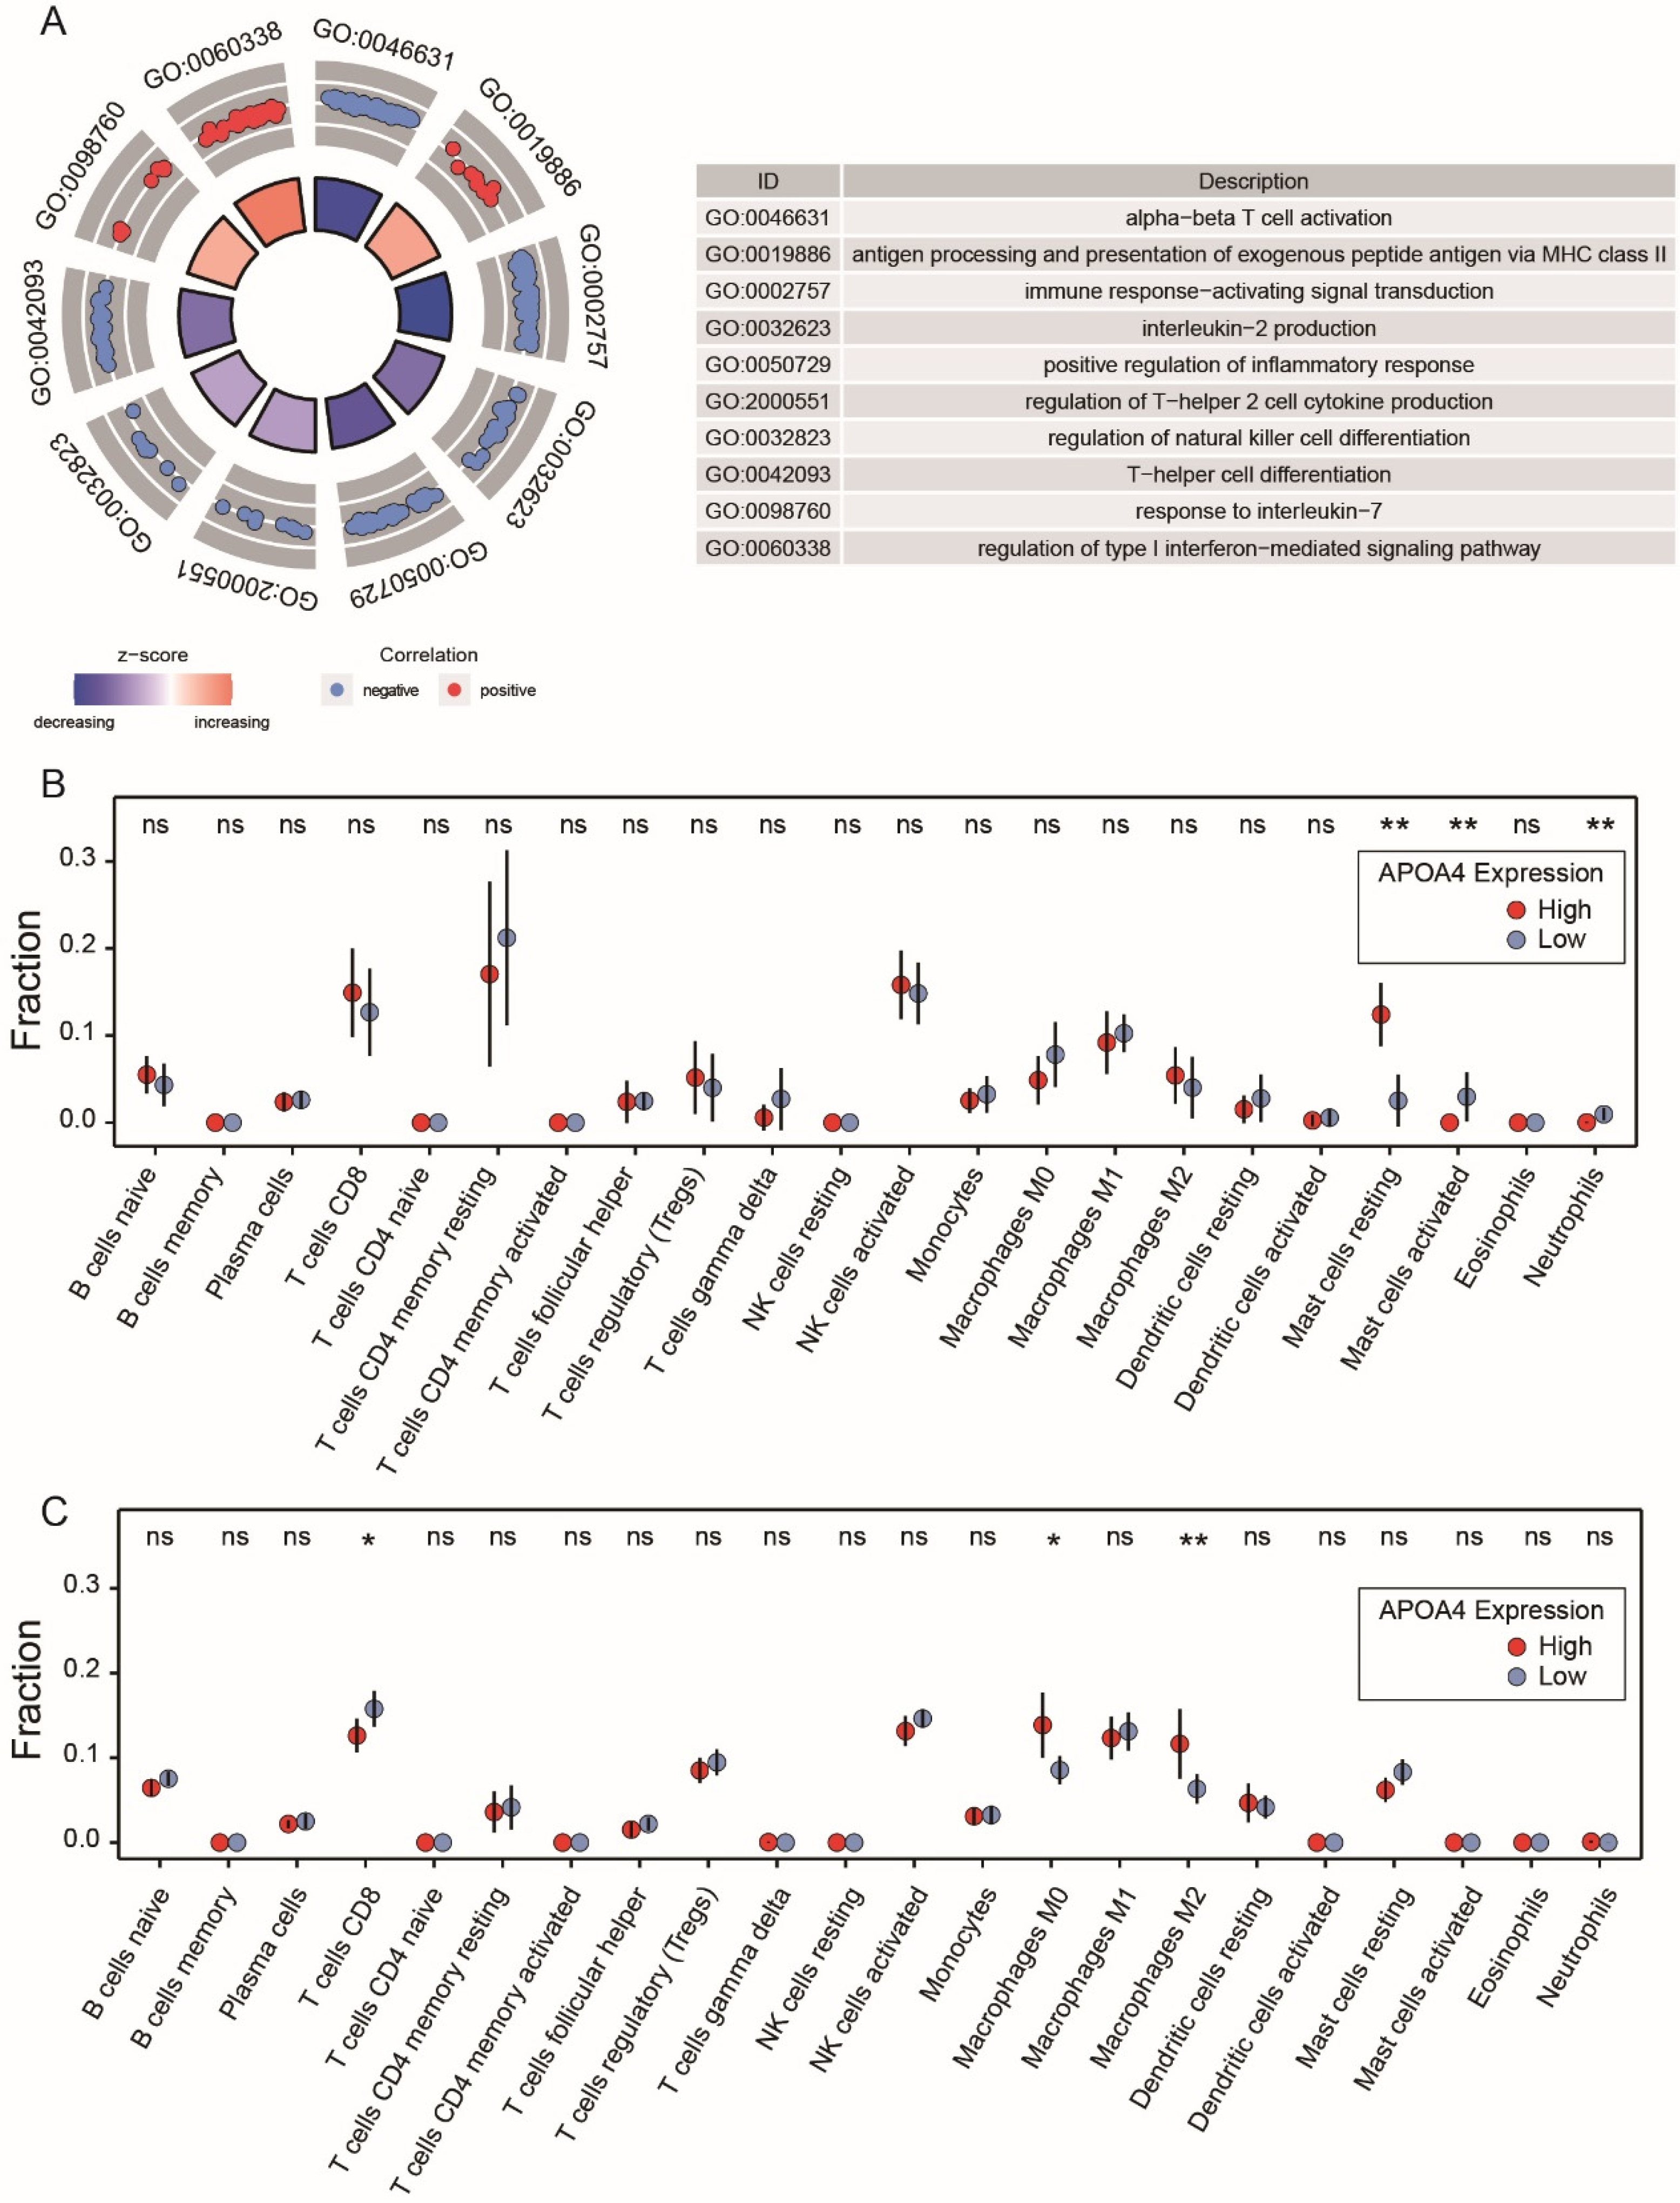
2.4. Functional Enrichment and PPI Analysis

In this study, the Metascape database was used to determine the potential biological functions of APOA4. These co-expression genes were mainly enriched in pathways such as Fcgamma receptor (FCGR) dependent phagocytosis, platelet activation signaling, and aggregation. They were primarily involved in biological processes such as the regulation of exocytosis, alpha-amino acid metabolism, and negative regulation of the protein modification process (Figure 3D,E). These results suggest that the pathways of phagocytosis, amino acid metabolism, and protein modification are involved in the lesions of AH, which was strongly related to APOA4 expression. Furthermore, STRING tools were employed to analyze the interaction between APOA4 and protein-coding genes mentioned earlier. Figure 3F illustrates the results of the analysis.

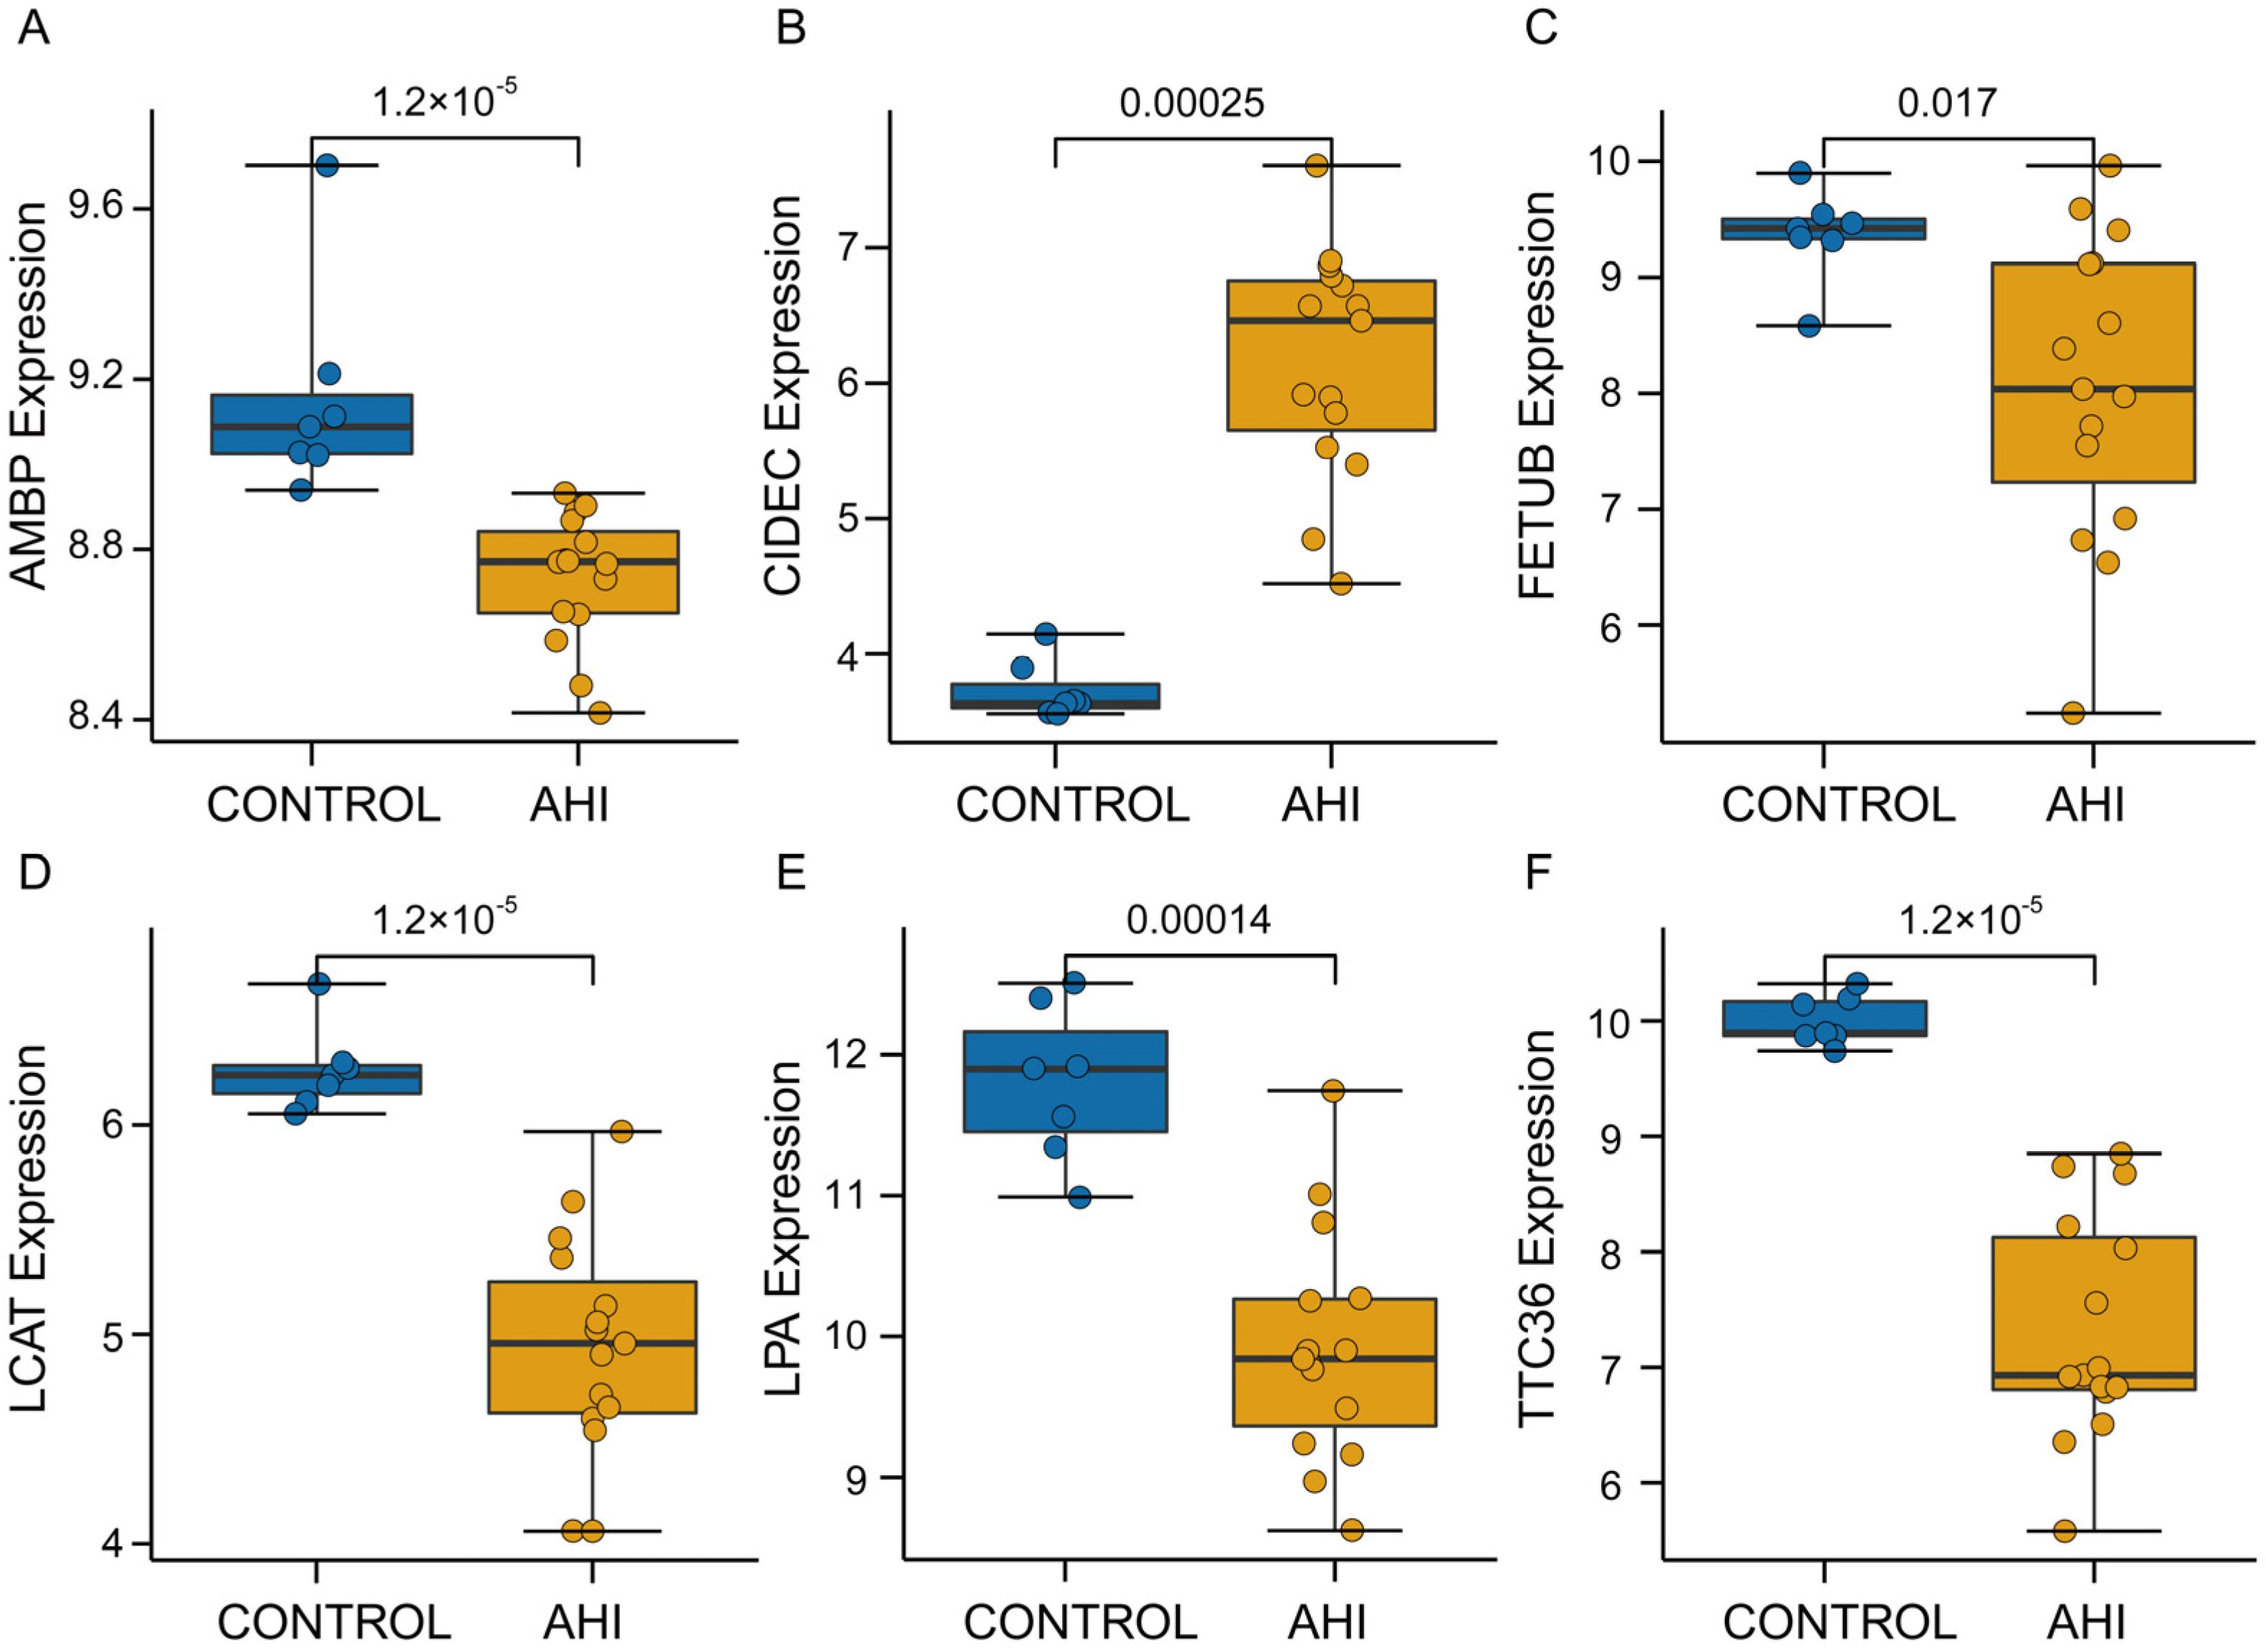
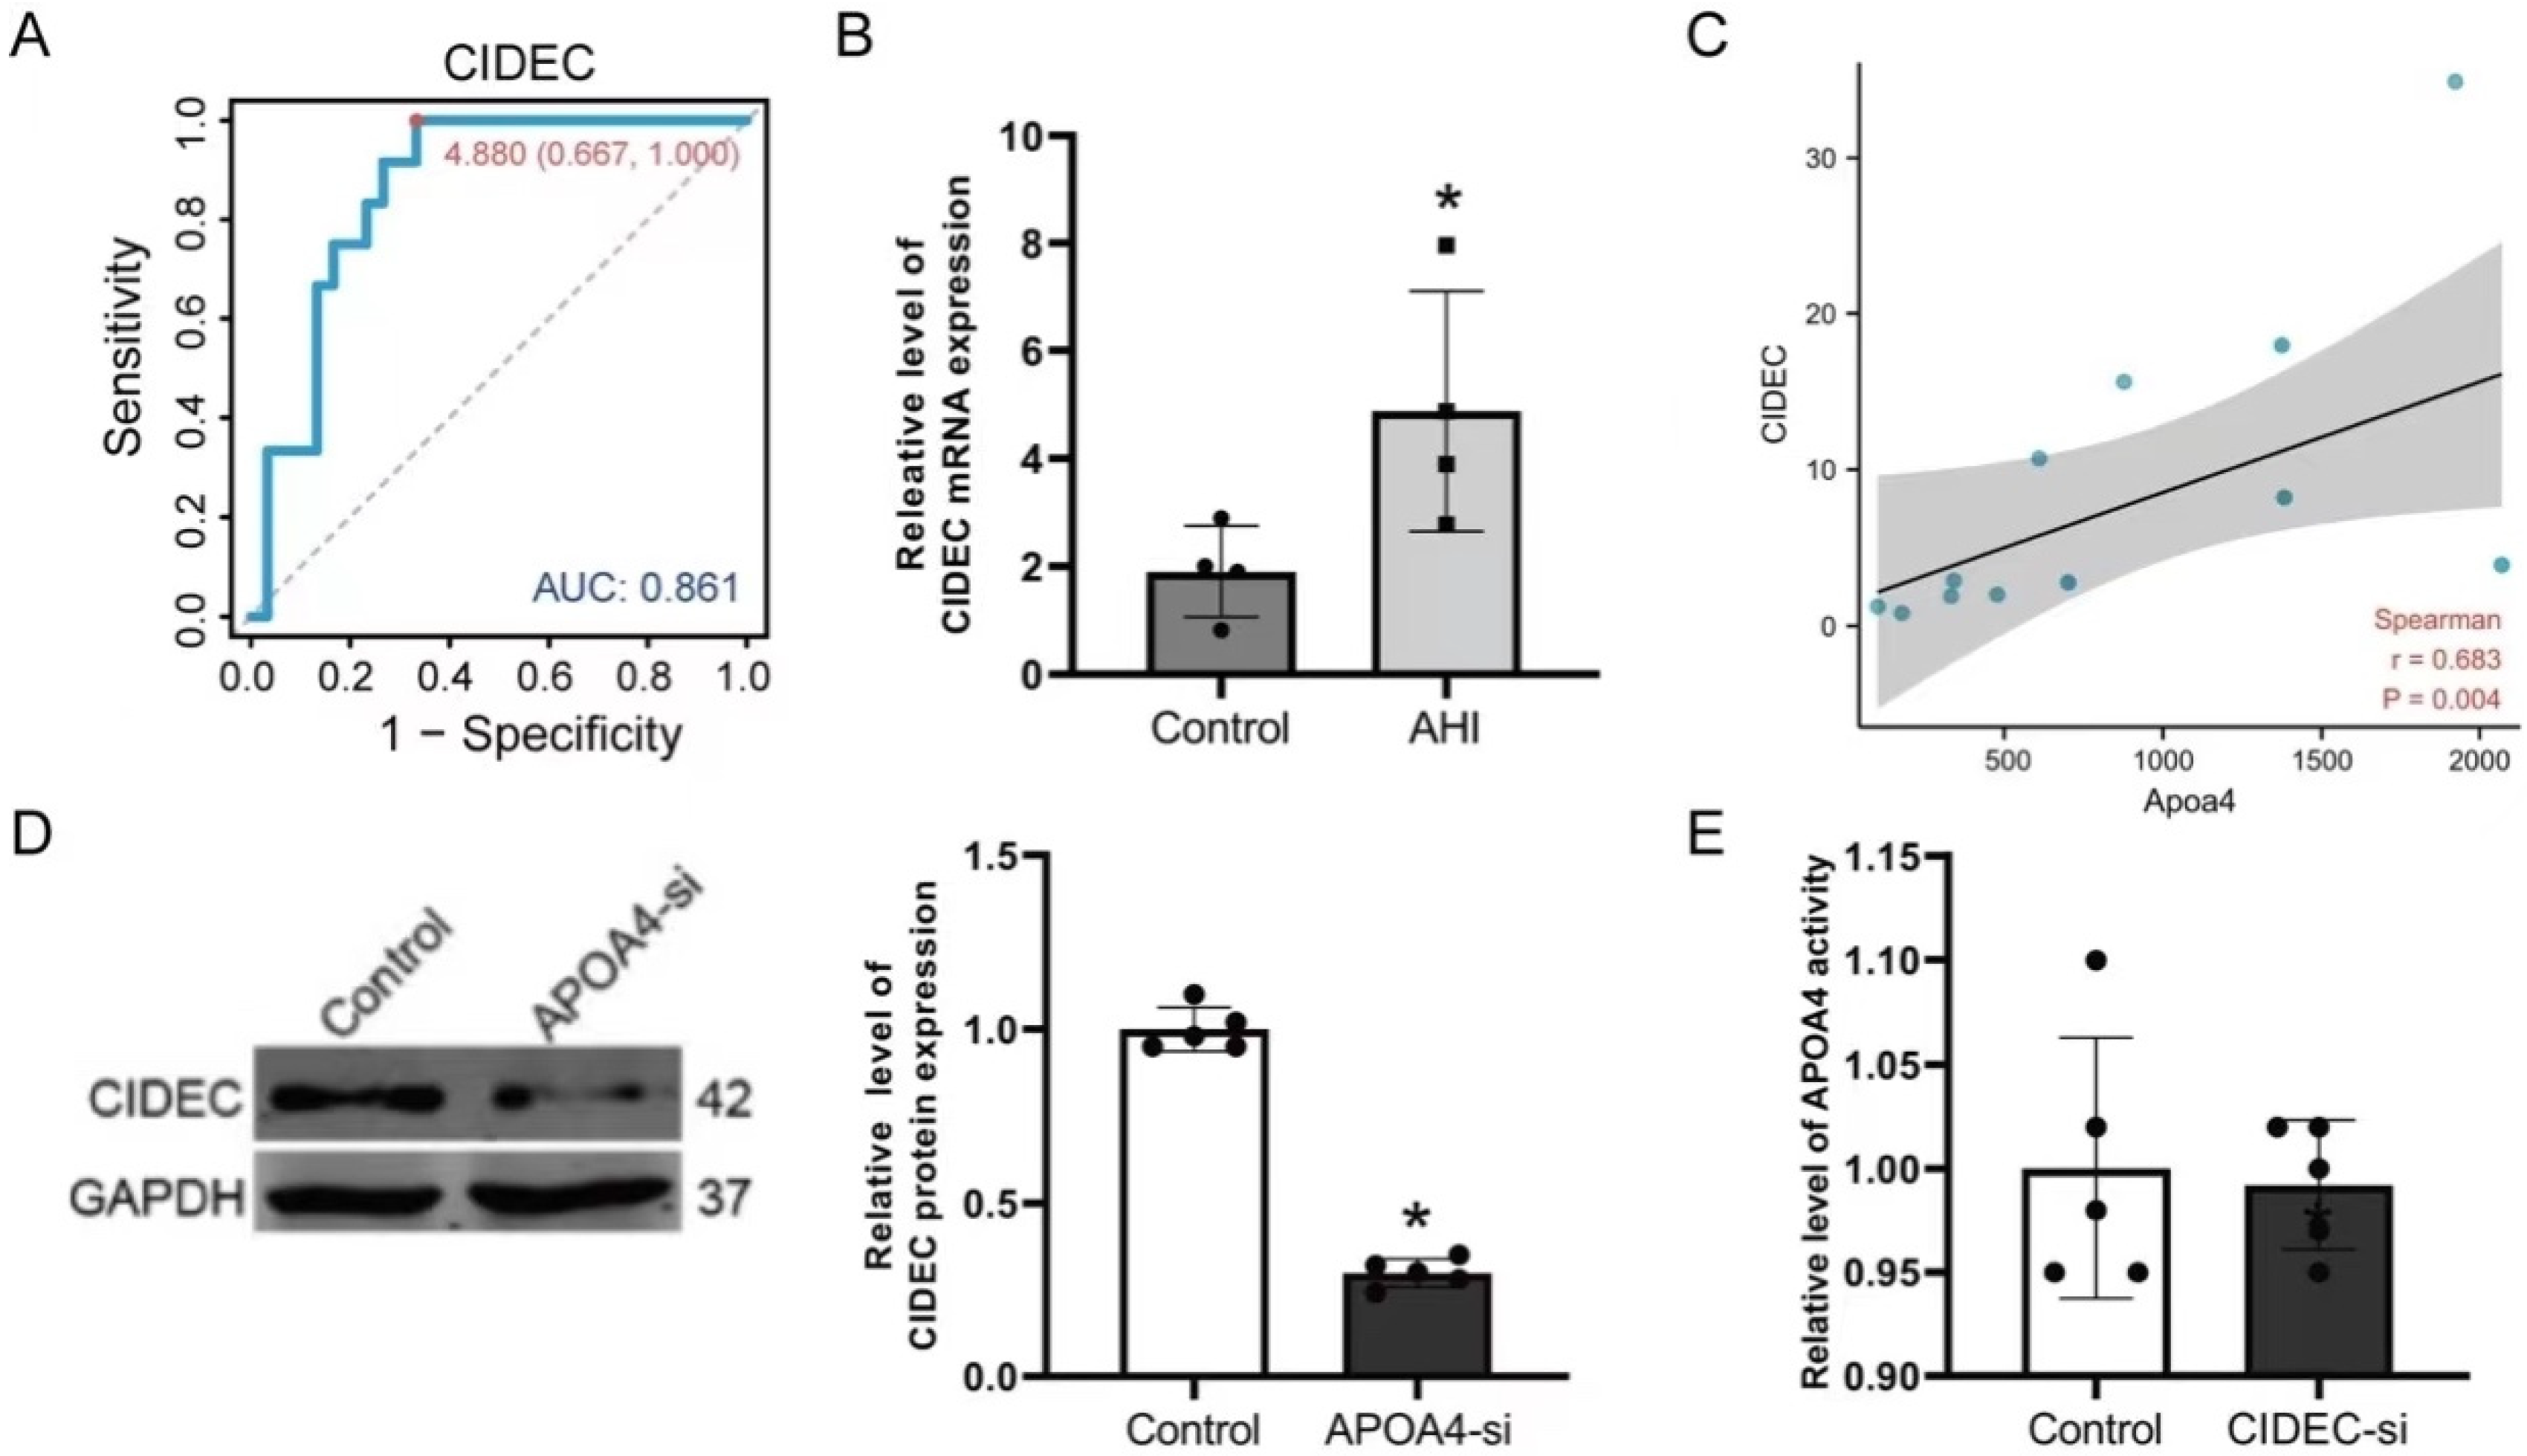
2.5. Hub Gene Recognition and Validation

We created a PPI network to uncover the intrinsic relationships among the genes co-expressed with APOA4. Six genes (AMBP, CIDEC, FETUB, LCAT, LPA, and TTC36) were identified as hub genes because they were found to be directly associated with APOA4.
Next, we validated these hub genes in the GEO cohort. As shown in Figure 4A–F, AMBP, FETUB, LCAT, LPA, and TTC36 were all significantly overexpressed in normal liver tissues, whereas only CIDEC was overexpressed considerably in AH tissues. Furthermore, we plotted the receiver operating characteristic (ROC) curves for the six hub genes in the ArrayExpress cohort based on the expression of genes with the corresponding disease states. The six hub genes had excellent diagnostic value in discriminating between AH and control samples, with an AUC of 0.836 for AMBP, 0.861 for CIDEC, 0.850 for FETUB, 0.883 for LCAT, 0.811 for LPA, and A 0.889 for TTC36 (Figure 5A and Supplementary Figure S1). To test the relationship between APOA4, CIDEC, and other hub genes, we used qRT-PCR to analyze liver expressions after treating ETOH in mice. CIDEC was up-regulated in ETOH-treated mouse livers (Figure 5B and Supplementary Figure S2). Simultaneously, CIDEC was found to be positively correlated with APOA4 in both normal liver tissues and hepatocellular carcinoma tissues (Supplementary Figure S3). We then tested the relationship between APOA4 and CIDEC in AH liver tissue using by Spearman test. Our data showed APOA4 positively correlated with CIDEC (r = 0.628, p = 0.004, Figure 5C). On the other hand, we also analyzed the expression of CIDEC after the knockdown of APOA4 in AML-12 cells. At the same time, we first observed the effect of the CIDEC on AML-12 cells’ injury by ETOH (Figure S4A–D). Our data showed CIDEC knockdown could inhibit AML-12 cell injury after treatment with ETOH. The CIDEC protein was significantly down-regulated by APOA4, but APOA4 mRNA levels remained unchanged after treatment with CIDEC-si in AML-12 cells (Figure 5D,E).

2.6. Relationship between APOA4 and Immune Infiltrating Cells in AH

To elucidate the mechanism underlying APOA4’s involvement in the pathological progression of AH, we first used GSEA enrichment analysis to show the potential signaling pathways of APOA4 in AH. The data displayed in Figure 6A shows that APOA4 was connected with alpha–beta T cell activation, immune response-activating signal transduction, positive regulation of inflammatory response, and regulation of T-helper 2 cell cytokine production signaling pathways. These findings highlighted the importance of the immune system in the abnormal expression of APOA4 in AH. Based on the expression profiles from the ArrayExpress cohort, we assessed the relationship between the APOA4 expression and the immune system in 22 types of immune-invading cells via the CIBERSORT algorithm. As illustrated in Figure 6B, resting mast cells (p = 0.005) increased in the high APOA4 group of normal liver tissues, whereas activated neutrophils (p = 0.006) and mast cells (p = 0.010) decreased. In AH tissues, while M0 (p = 0.016) and M2 (p = 0.003) macrophages were enriched in the high APOA4 group, and resting mast cells (p = 0.026), CD8 T cells (p = 0.021), and follicular helper T cells (p = 0.022) were enriched in the low APOA4 group (Figure 6C). We also observed the relationship between CIDEC and immune infiltrating cells in AH and found similar results as APOA4 in immune infiltrating cells in AH (Supplementary Figure S5).

3. Discussion

AH is the most severe type of ALD and is associated with high mortality [24]. Heavy alcohol consumption alters lipid metabolism, resulting in lipid aggregation in hepatocytes and the secretion of danger-associated molecular patterns, which, in combination with gut-originating pathogen-associated molecular patterns, trigger an inflammatory response characteristic of AH [25,26]. AH is usually associated with ETOH’s misuse, progressive jaundice, and inflammatory liver injury [23]. Since AH progresses as time goes on, early diagnosis, potential therapeutic targets screened, and downstream pathways have significant clinical importance [27]. Unfortunately, there are few non-invasive, dependable methods for detecting alcohol-induced hepatocyte injury and alcoholic hepatitis.
APOA4 is a highly conserved protein that often exists in eukaryotic cells [28]. It is primarily located in the nucleus; however, it can shuttle from the nucleus to the cytoplasm and subsequently function in nucleocytoplasmic signal transport [29,30,31]. Previous studies found that APOA4 levels were markedly elevated in cancer and growing cells, in contrast to quiescent cells [32,33]. Over-expression of APOA4 promotes the growth and proliferation of diverse cancer cell types [34]. All of these implied that APOA4 might be a prospective target for cancer gene treatment [35].
Nevertheless, few investigations on APOA4 in AH have been conducted. Here, we first find that APOA4 is up-regulated in the tissue of AH patients, and APOA4 can regulate immune infiltrating cells in AH. These results show that APOA4 may be a potential biomarker and therapeutic target in AH. To test this hypothesis, we used molecular biological methods to explore the effect of APOA4 on AH. Our data showed that silenced APOA4 significantly decreased the AML-12 cell injury induced by ETOH, and APOA4 inactivated the ROS activity induced by ETOH. These data indicate that APOA4 contributed to the anti-AH effect.
What is the molecular mechanism involved in APOA4 in AH? Xu et al. found CIDEC could promote the development of alcoholic steatohepatitis in mice and humans [36]. We found CIDEC may be a gene downstream of APOA4 in AH with a high AUV value (0.861) (Figure 4, Figure 5, and Figures S1–S3). To further confirm the downstream gene of APOA4 in AH, we employed molecular Biotechnology (western blot, ELISA kit, and flow cytometry) to detect the effect of CIDEC in AML-12 cells and AH tissues, and results showed CIDEC was up-regulated in ETOH-treated liver cells and positively correlated with APOA4 in AH. Furthermore, the expression of CIDEC modulates lipid deposition and secretion, both of which are significant steps in AH [37], thus confirming our hypothesis.
In addition, APOA4 has an immune-regulatory role in some diseases, such as in alveolar macrophages [38], spondylarthritis [39], as well as obesity-associated inflammatory hepatic steatosis [40]. The result showed APOA4 was connected with immune-relative signaling pathways, such as alpha-beta T cell activation, immune response-activating signal transduction, positive regulation of inflammatory response, and T-helper 2 cell cytokine production signaling pathways (Figure 6A). The innate immune responses triggered by pathogen-associated molecular patterns, such as the translocation of gut microflora and the sterile danger signals emanating from hepatocytes injured by alcohol, resulting in the activation of Kupffer cells (resident liver macrophages) and the mobilization and activation of macrophages in the liver [41,42,43]. Macrophages mobilize neutrophils to the site of liver injury, thus amplifying proinflammatory reactions and liver damage [44]. Nonetheless, these neutrophils have been documented to be mainly dysfunctional [45,46]. Because the activation of macrophages is critical in ALD onset, determining and characterizing the circulating biomarkers of macrophage activation in individuals with AH is essential. Although the diagnosis of AH is based on clinical and laboratory findings, novel biomarkers are required to estimate clinical outcomes and disease severity [47,48]. At the same time, dysregulating APOA4 in AH tissue and normal liver tissue regulates different immune cells. Such as, the resting mast cells are increased with high expression of APOA4 in normal liver tissues; otherwise, the activated neutrophils and mast cells are decreased. At the same time, M0 and M2 macrophages were enriched in the high APOA4 group in AH tissues, while the resting mast cells, CD8 T cells, as well as follicular helper T cells, were increased in the low expression APOA4 group (Figure 6C). These data showed the connection of APOA4 in immune cell infiltration in AH.
Above all, our data suggested that APOA4 has an antagonistic effect on immunity in patients with AH, thus providing new ideas and strategies for investigating APOA4 as an immunotherapy for AH. The APOA4/CIDEC/immune cell infiltration axis is expected to serve as a new biomarker or target, potentially leading to the development of the next generation of AH therapy.

4. Materials and Methods

4.1. Data Collection and Preprocessing

First, AH-related microarray data were obtained from the GEO data resource (www.ncbi.nlm.gov/geo, accessed on 3 October 2022) and the Array Express database (www.ebi.ac.uk/arrayexpress, accessed on 3 October 2022). The GSE28619 dataset contained data from seven people with normal livers and 15 patients with AH, whereas the E-MTAB-2664 dataset included data from 12 healthy individuals and 30 patients with AH. Two datasets were background connected and normalized with the “affy” package. We additionally downloaded the file that corresponded to the dataset to convert probes to gene symbols. For duplicate gene symbols, averaged overexpression values are reported. Data was accessed on 1 January 2021.

4.2. Identification of Genes Co-Expressed with APOA4 and Functional Enrichment Analysis

The top 50 genes with positive and negative Pearson’s correlation coefficients were selected as genes co-expressed with APOA4. Analysis with Metascape (http://metascape.org/gp/index.html#/main/step1, accessed on 3 October 2022), a free web analysis tool for gene functional enrichment analysis, revealed 100 co-expressed genes, which were imported into the Metascape data resource for Gene Ontology and Kyoto Encyclopedia of Genes and Genomes pathway analysis. Analysis with Metascape was accessed on 1 February 2021.

4.3. Protein-Protein Interaction (PPI) Analysis

We used the STRING data resource (https://string-db.org/, accessed on 3 October 2022) to explore the PPI network and Cystoscope v3.6.1 software to visualize this network. The cross-talk score was set at 0.4 in the STRING data resource. In the PPI network, genes directly interacting with APOA4 were considered hub genes and were used in subsequent analyses. STRING data resource was accessed on 1 February 2021.

4.4. Immune Infiltration Analysis

CIBERSORT, a deconvolution algorithm, calculated the proportion of 22 different types of immune cells in each tissue by analyzing the relative expression levels of 547 genes in individual tissue samples per their gene expression profiles [49]. The 22 types of immune cells include naive B cells, memory B cells, plasma cells, CD8+ T cells, naive CD4+ T cells, CD4+ resting memory T cells, CD4+ memory activated T cells, follicular helper T cells, regulatory T cells, γ δ T cells, resting natural killer cells, activated natural killer cells, monocytes, M0 macrophages, M1 macrophages, M2 macrophages, resting dendritic cells, activated dendritic cells, resting mast cells, activated mast cells, eosinophils, and neutrophils. Subsequently, we divided the samples into high and low-expression groups according to the medium APOA4 expression value in healthy and alcoholic liver tissue, respectively. Therefore, in our study, the CIBERSORT algorithm was applied to quantify the percentage of immune cells in the APOA4 high expression and the APOA4 low expression groups in the ArrayExpress cohort. Furthermore, the number of permutations of the default signature matrix was set to 100.

4.5. Animal Studies

Approximately 16 mice (male, ten weeks old) were obtained from Changsheng Biotechnology (Shenyang, China). The mice were randomly divided into two groups. One group was fed a nutritionally adequate liquid diet (Cat. #F1259, BIO-SERV, Flemington, NJ, USA) without ETOH pair-fed as control. The other was fed with a 5% ethanol (ETOH) diet as the alcohol-fed experimental group. The ethanol concentration for the ethanol diets in the experimental group gradually increased from 0% to 5% to acclimatize the mice to ethanol (Cat. #F1258, BIO-SERV, USA). The 5% ethanol and control diets were provided during the night for 12 h (20:00–8:00), and the normal diets were provided during daylight (8:00–20:00). All operations followed the manufacturer’s instructions throughout the experiment. In our study, all procedures were allowable according to the “Guide for the Care and Use of Laboratory Animals” published by the National Institutes of Health. Euthanasia was performed with cervical dislocation under anesthesia. Animal studies were approved by the Institutional Animal Care and Use Committee of Harbin Medical University, Harbin, China (Approval Code: IRB3015722). Sample analyses were not blinded. All tissues were collected for further study.

4.6. Cell Culture and Treatment

AML-12, a mouse hepatocyte cell line, was obtained from ShangCheng Beina ChuangLian Biology Technology Co., Ltd. (Shanghai, China). The cells were maintained under 37 °C and 5% CO2. The AML-12 cells were cultured in a 1:1 mixture of Dulbecco’s modified Eagle’s medium (cat. 11320033, Gibco, New York, NY, USA)/Ham’s F-12 medium (cat. 11320082, Gibco, New York, NY, USA), with 40 ng/mL dexamethasone, 5 μg/mL insulin-transferrin-selenium (cat. I1884, Sigma-Aldrich, St. Louis, SL, USA), and 10% fetal bovine serum (cat. FB65011, CLARK Bioscience, Australia).
Before further extraction, cells were pre-treated with 200 μmol/L ethanol or left untreated (control) for 12 h. An APOA4-small interfering RNA (APOA4-si) kit and RiboFECT CP Transfection Kit were obtained from RiboBio (Guangzhou, China). The RiboFECT CP Transfection Kit was used to transfect APOA4-si into AML-12 cells to down-regulate APOA4 expression. After transfection for 36 h, the AML-12 cells were treated with EtOH for 12 h or left untreated. After 48 h of treatment, cells were harvested for subsequent experiments, such as cell viability and biochemical analyses. The sequences of the APOA4 siRNA were as follows:
  • si-m-APOA4_001: 5′-GACCTGCAAGATCAGATCA-3′
  • si-m-APOA4_002: 5′-GCTGTAGAACAGTTTCAGA-3′
  • si-m-APOA4_003: 5′-GCAGCTGGAACAGTTCAGA-3′

4.7. Cell Viability

A Cell Counting, Kit-8 (Mei lune, Dalian, China), was used to analyze the viability of AML-12 cells. The cells were seeded in 96-well plates and incubated at 37 °C for two h. The optical density values were measured at 450 nm with a microplate reader (Thermo Fisher Multiskan FC, Shanghai, China).

4.8. Western Blotting

The cells were lysed with RIPA buffer and protein inhibitor (100:1, Beyotime, Shanghai, China). The total protein was detected with a BCA kit (Beyotime, Shanghai, China). Electrophoresis was then performed with 60–80 μg protein for approximately 1–2 h. The proteins were then transferred to an NC membrane for 2 h in an ice bath. The NC membrane was immediately placed into a solution with 5% non-fat milk and stored at room temperature for two hours to block nonspecific sites. Primary antibodies to the following proteins were used for western blotting: CIDEC (Abclonal, Wuhan, China) and β-actin (Abclonal, Wuhan, China).

4.9. ROS Level Assay

ROS production in AML-12 cells was assessed using 2′,7′-dichlorofluorescein diacetate (DCFH-DA) (Meilunebio, Dalian, China). The AML-12 cells were seeded into six-well plates at a density of 5 × 10⁵ cells per well and treated with ETOH or ETOH + APOA4-si for 48 h alone. A concentration of 10 mmol/L was achieved by diluting DCFH-DA with a serum-free medium by a factor of 1:1000. DCFH-DA was introduced after the cell culture media had been taken out. For 20 min, the cells were incubated at 37 °C. With media devoid of serum, the cells were washed three times. Flow cytometry (BD LSRFortessa, Becton Dickinson, Franklin Lakes, NJ, USA) was used to analyze ROS levels.

4.10. Enzyme-Linked Immunosorbent Assay (ELISA)

AML-12 cell supernatants from each subgroup were analyzed for interleukin (IL)-1β, AST (Aspartate transaminase), and ALT (Alanine transaminase). We used Quantikine ELISA Kits to determine IL-1β (Servicebio, Wuhan, China), AST (Elabscience Biotechnology Co., Ltd., Wuhan, China), and ALT (Elabscience Biotechnology Co., Ltd., Wuhan, China) activity.

4.11. RNA Isolation and Quantitative RT-PCR

A TRIzol reagent (Invitrogen, Shanghai, China) was used to extract total RNA from AML-12 cells. To reverse transcription of the total RNA, we used the First Strand cDNA Synthesis Kit (Thermo Fisher Scientific, Rockford, IL, USA) under previous conditions. Light Cycler Fast Start DNA Master Plus SYBR Green I Kit’s protocols (Roche Diagnostics, Burgess Hill, UK) were strictly followed during the RT-PCR. To measure APOA4 and CIDEC expression levels, GAPDH was used as an endogenous control. The 2−ΔΔCt method was used for statistical analysis.
Sequences of the primers are as follows:
  • APOA4-forward: 5′-GGCCTGAGGTAGGAGGTTGT-3′,
  • APOA4-reverse: 5′-CAGTGCGTGTCGTGGAGT-3′;
  • CIDEC-forward: 5′-AAATACTCTATGGCTGCCTCCCC-3′,
  • CIDEC-reverse: 5′-TGTCTAACAAGTCCCCAAACTGT-3′;
  • GAPDH-forward: 5′-CATGGGTGTGAACCATGAGA-3′,
  • GAPDH-reverse: 5′-GTCTTCTGGGTGGCAGTGAT-3′.

4.12. Statistical Analysis

Statistical analyses were implemented in R v.3.6.1 software. To compare differences between groups, the nonparametric Wilcoxon rank-sum test was used. Pearson’s correlation coefficients were used to explore the relationships among continual variables. Unless otherwise specified, p < 0.05 was considered to indicate statistical significance.

Supplementary Materials

The following supporting information can be downloaded at: https://www.mdpi.com/article/10.3390/ijms24010670/s1.

Author Contributions

Conceptualization: Q.L. and H.S. Methodology: W.-H.L., L.Z., Y.-Y.L. and X.-Y.W. Statistical analysis: J.-L.L., S.-N.Z. and M.-Q.N. Investigation: W.-H.L. and L.Z. Writing: W.-H.L., L.Z., Q.L. and H.S. Supervision: Q.L. All authors have read and agreed to the published version of the manuscript.

Funding

This research was supported by the foundation of the National Conference on Undergraduate Innovation and Entrepreneurship (No. S202110226059).

Institutional Review Board Statement

The animal study protocol was approved by the Institutional Animal Care and Use Committee of Harbin Medical University, Harbin, China (Approval Code: IRB3015722).

Informed Consent Statement

Not applicable.

Data Availability Statement

The data that support this study are available within the article and available from the authors upon request.

Acknowledgments

We are grateful to all members of our laboratory for insightful discussions and practical assistance. Hui SUN thanks Er-Dan SUN, his lovely son, who gave him great strength while writing this manuscript.

Conflicts of Interest

The authors declare no conflict of interest.

References

  1. Singal, A.K.; Bataller, R.; Ahn, J.; Kamath, P.S.; Shah, V.H. ACG Clinical Guideline: Alcoholic Liver Disease. Am. J. Gastroenterol. 2018, 113, 175–194. [Google Scholar] [CrossRef] [PubMed]
  2. Rocco, A.; Compare, D.; Angrisani, D.; Sanduzzi Zamparelli, M.; Nardone, G. Alcoholic disease: Liver and beyond. World J. Gastroenterol. 2014, 20, 14652–14659. [Google Scholar] [CrossRef] [PubMed]
  3. Lamas-Paz, A.; Hao, F.; Nelson, L.J.; Vazquez, M.T.; Canals, S.; Gomez Del Moral, M.; Martinez-Naves, E.; Nevzorova, Y.A.; Cubero, F.J. Alcoholic liver disease: Utility of animal models. World J. Gastroenterol. 2018, 24, 5063–5075. [Google Scholar] [CrossRef] [PubMed]
  4. O’Shea, R.S.; Dasarathy, S.; McCullough, A.J.; Practice Guideline Committee of the American Association for the Study of Liver Diseases; The Practice Parameters Committee of the American College of Gastroenterology. Alcoholic liver disease. Hepatology 2010, 51, 307–328. [Google Scholar] [CrossRef]
  5. Marroni, C.A.; Fleck, A.M., Jr.; Fernandes, S.A.; Galant, L.H.; Mucenic, M.; de Mattos Meine, M.H.; Mariante-Neto, G.; Brandao, A.B.M. Liver transplantation and alcoholic liver disease: History, controversies, and considerations. World J. Gastroenterol. 2018, 24, 2785–2805. [Google Scholar] [CrossRef]
  6. Takeuchi, M.; Vidigal, P.T.; Guerra, M.T.; Hundt, M.A.; Robert, M.E.; Olave-Martinez, M.; Aoki, S.; Khamphaya, T.; Kersten, R.; Kruglov, E.; et al. Neutrophils interact with cholangiocytes to cause cholestatic changes in alcoholic hepatitis. Gut 2021, 70, 342–356. [Google Scholar] [CrossRef]
  7. Llovet, J.M.; Kelley, R.K.; Villanueva, A.; Singal, A.G.; Pikarsky, E.; Roayaie, S.; Lencioni, R.; Koike, K.; Zucman-Rossi, J.; Finn, R.S. Hepatocellular carcinoma. Nat. Rev. Dis. Prim. 2021, 7, 6. [Google Scholar] [CrossRef]
  8. Schwabe, R.F.; Greten, T.F. Gut microbiome in HCC-Mechanisms, diagnosis and therapy. J. Hepatol. 2020, 72, 230–238. [Google Scholar] [CrossRef] [Green Version]
  9. Kong, L.Z.; Chandimali, N.; Han, Y.H.; Lee, D.H.; Kim, J.S.; Kim, S.U.; Kim, T.D.; Jeong, D.K.; Sun, H.N.; Lee, D.S.; et al. Pathogenesis, Early Diagnosis, and Therapeutic Management of Alcoholic Liver Disease. Int. J. Mol. Sci. 2019, 20, 2712. [Google Scholar] [CrossRef] [Green Version]
  10. Qu, J.; Ko, C.W.; Tso, P.; Bhargava, A. Apolipoprotein A-IV: A Multifunctional Protein Involved in Protection against Atherosclerosis and Diabetes. Cells 2019, 8, 319. [Google Scholar] [CrossRef]
  11. Qin, W.; Li, X.; Xie, L.; Li, S.; Liu, J.; Jia, L.; Dong, X.; Ren, X.; Xiao, J.; Yang, C.; et al. A long non-coding RNA, APOA4-AS, regulates APOA4 expression depending on HuR in mice. Nucleic Acids Res. 2016, 44, 6423–6433. [Google Scholar] [CrossRef] [PubMed] [Green Version]
  12. Cheng, C.; Liu, X.H.; He, J.; Gao, J.; Zhou, J.T.; Fan, J.N.; Jin, X.; Zhang, J.; Chang, L.; Xiong, Z.; et al. Apolipoprotein A4 Restricts Diet-Induced Hepatic Steatosis via SREBF1-Mediated Lipogenesis and Enhances IRS-PI3K-Akt Signaling. Mol. Nutr. Food Res. 2022, 66, e2101034. [Google Scholar] [CrossRef] [PubMed]
  13. Peters, K.E.; Davis, W.A.; Ito, J.; Winfield, K.; Stoll, T.; Bringans, S.D.; Lipscombe, R.J.; Davis, T.M.E. Identification of Novel Circulating Biomarkers Predicting Rapid Decline in Renal Function in Type 2 Diabetes: The Fremantle Diabetes Study Phase II. Diabetes Care 2017, 40, 1548–1555. [Google Scholar] [CrossRef] [Green Version]
  14. Wang, P.W.; Hung, Y.C.; Wu, T.H.; Chen, M.H.; Yeh, C.T.; Pan, T.L. Proteome-based identification of apolipoprotein A-IV as an early diagnostic biomarker in liver fibrosis. Oncotarget 2017, 8, 88951–88964. [Google Scholar] [CrossRef] [Green Version]
  15. Duverger, N.; Tremp, G.; Caillaud, J.M.; Emmanuel, F.; Castro, G.; Fruchart, J.C.; Steinmetz, A.; Denefle, P. Protection against atherogenesis in mice mediated by human apolipoprotein A-IV. Science 1996, 273, 966–968. [Google Scholar] [CrossRef] [PubMed]
  16. Recalde, D.; Ostos, M.A.; Badell, E.; Garcia-Otin, A.L.; Pidoux, J.; Castro, G.; Zakin, M.M.; Scott-Algara, D. Human apolipoprotein A-IV reduces secretion of proinflammatory cytokines and atherosclerotic effects of a chronic infection mimicked by lipopolysaccharide. Arterioscler. Thromb. Vasc. Biol. 2004, 24, 756–761. [Google Scholar] [CrossRef] [PubMed] [Green Version]
  17. Vowinkel, T.; Mori, M.; Krieglstein, C.F.; Russell, J.; Saijo, F.; Bharwani, S.; Turnage, R.H.; Davidson, W.S.; Tso, P.; Granger, D.N.; et al. Apolipoprotein A-IV inhibits experimental colitis. J. Clin. Investig. 2004, 114, 260–269. [Google Scholar] [CrossRef] [Green Version]
  18. Wang, Y.; Yang, Z.; Wei, Y.; Li, X.; Li, S. Apolipoprotein A4 regulates the immune response in carbon tetrachloride-induced chronic liver injury in mice. Int. Immunopharmacol. 2021, 90, 107222. [Google Scholar] [CrossRef]
  19. Pinal-Fernandez, I.; Casal-Dominguez, M.; Derfoul, A.; Pak, K.; Miller, F.W.; Milisenda, J.C.; Grau-Junyent, J.M.; Selva-O’Callaghan, A.; Carrion-Ribas, C.; Paik, J.J.; et al. Machine learning algorithms reveal unique gene expression profiles in muscle biopsies from patients with different types of myositis. Ann. Rheum. Dis. 2020, 79, 1234–1242. [Google Scholar] [CrossRef]
  20. Gao, B.; Argemi, J.; Bataller, R.; Schnabl, B. Serum Acylcarnitines Associated with High Short-Term Mortality in Patients with Alcoholic Hepatitis. Biomolecules 2021, 11, 281. [Google Scholar] [CrossRef]
  21. Brenner, C.; Galluzzi, L.; Kepp, O.; Kroemer, G. Decoding cell death signals in liver inflammation. J. Hepatol. 2013, 59, 583–594. [Google Scholar] [CrossRef] [PubMed] [Green Version]
  22. Knott, C.; Bell, S.; Britton, A. Alcohol Consumption and the Risk of Type 2 Diabetes: A Systematic Review and Dose-Response Meta-analysis of More Than 1.9 Million Individuals From 38 Observational Studies. Diabetes Care 2015, 38, 1804–1812. [Google Scholar] [CrossRef] [PubMed] [Green Version]
  23. Qi, W.; Wang, B.; Yang, M.; Zhu, L.; Hu, S.; Sun, H. The implementation of drug reposition for alcoholic hepatitis based on a sub-pathway integration strategy. Ann. Transl. Med. 2020, 8, 208. [Google Scholar] [CrossRef] [PubMed]
  24. Im, G.Y.; Cameron, A.M.; Lucey, M.R. Liver transplantation for alcoholic hepatitis. J. Hepatol. 2019, 70, 328–334. [Google Scholar] [CrossRef] [Green Version]
  25. Tiberio, L.; Del Prete, A.; Schioppa, T.; Sozio, F.; Bosisio, D.; Sozzani, S. Chemokine and chemotactic signals in dendritic cell migration. Cell. Mol. Immunol. 2018, 15, 346–352. [Google Scholar] [CrossRef]
  26. Di Gioia, M.; Spreafico, R.; Springstead, J.R.; Mendelson, M.M.; Joehanes, R.; Levy, D.; Zanoni, I. Endogenous oxidized phospholipids reprogram cellular metabolism and boost hyperinflammation. Nat. Immunol. 2020, 21, 42–53. [Google Scholar] [CrossRef]
  27. Addanki, S.; Meas, S.; Sarli, V.N.; Singh, B.; Lucci, A. Applications of Circulating Tumor Cells and Circulating Tumor DNA in Precision Oncology for Breast Cancers. Int. J. Mol. Sci. 2022, 23, 7843. [Google Scholar] [CrossRef]
  28. Hammoudeh, S.M.; Hammoudeh, A.M.; Bhamidimarri, P.M.; Al Safar, H.; Mahboub, B.; Kunstner, A.; Busch, H.; Halwani, R.; Hamid, Q.; Rahmani, M.; et al. Systems Immunology Analysis Reveals the Contribution of Pulmonary and Extrapulmonary Tissues to the Immunopathogenesis of Severe COVID-19 Patients. Front. Immunol. 2021, 12, 595150. [Google Scholar] [CrossRef]
  29. Cheng, C.W.; Chang, C.C.; Chen, H.W.; Lin, C.Y.; Chen, J.S. Serum ApoA4 levels predicted the progression of renal impairment in T2DM. Eur. J. Clin. Investig. 2018, 48, e12937. [Google Scholar] [CrossRef]
  30. Zhang, Y.; He, J.; Zhao, J.; Xu, M.; Lou, D.; Tso, P.; Li, Z.; Li, X. Effect of ApoA4 on SERPINA3 mediated by nuclear receptors NR4A1 and NR1D1 in hepatocytes. Biochem. Biophys. Res. Commun. 2017, 487, 327–332. [Google Scholar] [CrossRef]
  31. Obinata, H.; Kuo, A.; Wada, Y.; Swendeman, S.; Liu, C.H.; Blaho, V.A.; Nagumo, R.; Satoh, K.; Izumi, T.; Hla, T. Identification of ApoA4 as a sphingosine 1-phosphate chaperone in ApoM- and albumin-deficient mice. J. Lipid Res. 2019, 60, 1912–1921. [Google Scholar] [CrossRef] [PubMed]
  32. Soukup, V.; Capoun, O.; Pesl, M.; Vavrova, L.; Sobotka, R.; Levova, K.; Hanus, T.; Zima, T.; Kalousova, M. The significance of calprotectin, CD147, APOA4 and DJ-1 in non-invasive detection of urinary bladder carcinoma. Neoplasma 2019, 66, 1019–1023. [Google Scholar] [CrossRef] [PubMed]
  33. Taavela, J.; Viiri, K.; Valimaki, A.; Sarin, J.; Salonoja, K.; Maki, M.; Isola, J. Apolipoprotein A4 Defines the Villus-Crypt Border in Duodenal Specimens for Celiac Disease Morphometry. Front. Immunol. 2021, 12, 713854. [Google Scholar] [CrossRef] [PubMed]
  34. Ueda, K.; Saichi, N.; Takami, S.; Kang, D.; Toyama, A.; Daigo, Y.; Ishikawa, N.; Kohno, N.; Tamura, K.; Shuin, T.; et al. A comprehensive peptidome profiling technology for the identification of early detection biomarkers for lung adenocarcinoma. PLoS ONE 2011, 6, e18567. [Google Scholar] [CrossRef]
  35. Farrokhi Yekta, R.; Arefi Oskouie, A.; Rezaei Tavirani, M.; Mohajeri-Tehrani, M.R.; Soroush, A.R. Decreased apolipoprotein A4 and increased complement component 3 as potential markers for papillary thyroid carcinoma: A proteomic study. Int. J. Biol. Markers 2018, 33, 455–462. [Google Scholar] [CrossRef] [Green Version]
  36. Xu, M.J.; Cai, Y.; Wang, H.; Altamirano, J.; Chang, B.; Bertola, A.; Odena, G.; Lu, J.; Tanaka, N.; Matsusue, K.; et al. Fat-Specific Protein 27/CIDEC Promotes Development of Alcoholic Steatohepatitis in Mice and Humans. Gastroenterology 2015, 149, 1030–1041.e6. [Google Scholar] [CrossRef] [Green Version]
  37. Li, Y.; Kang, H.; Chu, Y.; Jin, Y.; Zhang, L.; Yang, R.; Zhang, Z.; Zhao, S.; Zhou, L. Cidec differentially regulates lipid deposition and secretion through two tissue-specific isoforms. Gene 2018, 641, 265–271. [Google Scholar] [CrossRef]
  38. Luo, M.; Lai, W.; He, Z.; Wu, L. Development of an Optimized Culture System for Generating Mouse Alveolar Macrophage-like Cells. J. Immunol. 2021, 207, 1683–1693. [Google Scholar] [CrossRef]
  39. Russell, T.; Watad, A.; Bridgewood, C.; Rowe, H.; Khan, A.; Rao, A.; Loughenbury, P.; Millner, P.; Dunsmuir, R.; Cuthbert, R.; et al. IL-17A and TNF Modulate Normal Human Spinal Entheseal Bone and Soft Tissue Mesenchymal Stem Cell Osteogenesis, Adipogenesis, and Stromal Function. Cells 2021, 10, 341. [Google Scholar] [CrossRef]
  40. Kang, H.S.; Okamoto, K.; Takeda, Y.; Beak, J.Y.; Gerrish, K.; Bortner, C.D.; DeGraff, L.M.; Wada, T.; Xie, W.; Jetten, A.M. Transcriptional profiling reveals a role for RORalpha in regulating gene expression in obesity-associated inflammation and hepatic steatosis. Physiol. Genom. 2011, 43, 818–828. [Google Scholar] [CrossRef]
  41. Joffre, J.; Hellman, J.; Ince, C.; Ait-Oufella, H. Endothelial Responses in Sepsis. Am. J. Respir. Crit. Care Med. 2020, 202, 361–370. [Google Scholar] [CrossRef] [PubMed]
  42. Dixon, L.J.; Barnes, M.; Tang, H.; Pritchard, M.T.; Nagy, L.E. Kupffer cells in the liver. Compr. Physiol. 2013, 3, 785–797. [Google Scholar] [CrossRef] [PubMed] [Green Version]
  43. Tsutsui, H.; Nishiguchi, S. Importance of Kupffer cells in the development of acute liver injuries in mice. Int. J. Mol. Sci. 2014, 15, 7711–7730. [Google Scholar] [CrossRef] [Green Version]
  44. Koyama, Y.; Brenner, D.A. Liver inflammation and fibrosis. J. Clin. Investig. 2017, 127, 55–64. [Google Scholar] [CrossRef] [PubMed]
  45. Yang, W.; Tao, Y.; Wu, Y.; Zhao, X.; Ye, W.; Zhao, D.; Fu, L.; Tian, C.; Yang, J.; He, F.; et al. Neutrophils promote the development of reparative macrophages mediated by ROS to orchestrate liver repair. Nat. Commun. 2019, 10, 1076. [Google Scholar] [CrossRef] [PubMed] [Green Version]
  46. Calvente, C.J.; Tameda, M.; Johnson, C.D.; Del Pilar, H.; Lin, Y.C.; Adronikou, N.; De Mollerat Du Jeu, X.; Llorente, C.; Boyer, J.; Feldstein, A.E. Neutrophils contribute to spontaneous resolution of liver inflammation and fibrosis via microRNA-223. J. Clin. Investig. 2019, 129, 4091–4109. [Google Scholar] [CrossRef] [PubMed] [Green Version]
  47. Shen, M.; Shen, Y.; Fan, X.; Men, R.; Ye, T.; Yang, L. Roles of Macrophages and Exosomes in Liver Diseases. Front. Med. 2020, 7, 583691. [Google Scholar] [CrossRef] [PubMed]
  48. Schuppan, D. Liver fibrosis: Common mechanisms and antifibrotic therapies. Clin. Res. Hepatol. Gastroenterol. 2015, 39 (Suppl. 1), S51–S59. [Google Scholar] [CrossRef]
  49. Newman, A.M.; Liu, C.L.; Green, M.R.; Gentles, A.J.; Feng, W.; Xu, Y.; Hoang, C.D.; Diehn, M.; Alizadeh, A.A. Robust enumeration of cell subsets from tissue expression profiles. Nat. Methods 2015, 12, 453–457. [Google Scholar] [CrossRef]
Figure 1. APOA4 is elevated in AH. Volcano plots showed the differentially expressed genes (DEGs) between AH and normal liver tissues in the E-MTAB-2664 dataset and the GSE28619 dataset. Orange dots indicate the up-regulated genes, blue dots indicate down-regulated genes, and gray dots indicate non-DEGs. (A,B) Volcano map and Box plot of APOA4 expression between AH and normal liver tissues in the E-MTAB-2664 dataset. (C,D) Volcano map and Box plot of APOA4 expression between AH and normal liver tissues in the GSE28619 dataset. (E) Hematoxylin-eosin (H&E) staining. (F,G) The activity of ALT and AST. (H,I) The expression of APOA4 in AH tissue as well as serum. (J) The expression of APOA4 in AML-12 cells after 200 μmol/L ETOH treatment for 12 h. (n = 3–6) * p < 0.05, ** p < 0.01 vs. the control group.
Ijms 24 00670 g001
Figure 2. APOA4 inhibition decreased cell injury in ETOH -treated AML-12 cells. (A) AML-12 cells were transfected with APOA4 siRNA or control siRNA for 48 h. The expression of APOA4 was determined with qRT-PCR. (B) The AST and ALT activity in AML-12 cells after treatment with APOA4-si stimulated by ETOH or left untreated. (C) IL-1β activity by IL-1β ELISA kit. (D) ROS fluorescence intensity was detected by flow cytometry. (n = 3–6) * p < 0.05, ** p < 0.01 vs. the control group; # p < 0.05 vs. the ETOH group or NS p > 0.05 vs. the Control group.
Ijms 24 00670 g002
Figure 3. Functional enrichment and PPI analysis of APOA4 co-expressed genes. (A) A Pearson test was used to analyze the correlation between APOA4 and other genes in AH. Red indicates positively correlated genes; blue indicates negatively correlated genes. (B,C) Heat maps illustrating genes positively and negatively correlated with APOA4 in AH (top 50). (D) Analysis of Gene Ontology and Kyoto Encyclopedia of Genes and Genomes pathways associated with APOA4 expression. (E) Network plot of the relationships among the top 20 terms. (F) PPI network plot of genes co-expressed with APOA4.
Ijms 24 00670 g003
Figure 4. Validation of hub genes. (A) AMBP, (B) CIDEC, (C) FETUB, (D) LCAT, (E) LPA, and (F) TTC36.
Ijms 24 00670 g004
Figure 5. The role of CIDEC in AH. (A) CIDEC, in the ArrayExpress cohort. (B) The expression of CIDEC in AH tissue compared with the control group. (C) The correlation of CIDEC and APOA4 in AH liver tissue. The correlated concentration between APOA4 and CIDEC was determined by western blotting (D) and qRT-PCR (E). (n = 3–6) * p < 0.05, vs. the Control group.
Ijms 24 00670 g005
Figure 6. Proportions of 22 immune infiltrating cells’ subpopulations in normal liver tissues and AH tissues were associated with APOA4. (A) Analysis of Gene Ontology associated with APOA4 expression by GSEA enrichment analysis. (B) Immune infiltrating cells in normal liver tissues. (C) Immune infiltrating cells in AH tissues. * p < 0.05, ** p < 0.01 vs. the high group, ns p > 0.05 vs the high group.
Ijms 24 00670 g006
Disclaimer/Publisher’s Note: The statements, opinions and data contained in all publications are solely those of the individual author(s) and contributor(s) and not of MDPI and/or the editor(s). MDPI and/or the editor(s) disclaim responsibility for any injury to people or property resulting from any ideas, methods, instructions or products referred to in the content.

