
Using COP Model to Map the Vulnerability of Groundwater Wells Adjacent to Landfills

 ,
,
Abstract
:1. Introduction
2. Materials and Methods
2.1. Study Area and Data Collection
2.2. Data Verification
2.3. Building the Vulnerability Maps Using COP Model
- Calculating the C Factor: The C factor allows us to assess the impact of the karst systems if they exist. Karst systems are characterized by a duality of infiltration, where the infiltration can occur diffusively on the entire catchment, and/or it is concentrated in sinkholes or dolines (fast flow pathways). In the COP method, the catchment was divided into two main zones. The first zone (Scenario 1) includes the recharge area of the karst features, namely, dolines or sinkholes. The second zone (Scenario 2) consists of the rest of the area, where no surface karst features were identified. In the area of this study, (Scenario 2) was used due to the absence of karst formations.
- Calculating the O Factor: The O factor represents the overlying layers, namely, the soil cover (OS) overlying the unsaturated lithology (OL).
- OS factor: The OS factor represents the texture and thickness of the soil. The thicker the soil cover is, then the higher the likelihood is of contaminant attenuation occurring. Furthermore, fine soil textures (i.e., clay) have a lower degree of hydraulic conductivity, and they are therefore characterized by longer transit times. Additionally, due to their sorption capacity for ionic species, they are more likely to attenuate some types of contaminants (ionic or charged species). The OS factor increases with an increasing thickness and finer soil texture, denoting a low groundwater vulnerability. For the study area, a soil database was utilized to identify the soil texture and depth at various sampling locations. These data were geo-processed using ArcGIS tools such as selection, joining and interpolation in order to produce the OS Factor layer. To obtain more details about the tools used and the process, one should refer to the main report.
- OL factor: The OL factor is representative of the unsaturated zone below the soil layer and above the groundwater table. To calculate it, the following are determined first: (1) type of lithology, (2) the confinement of the aquifer and (3) the thickness of the unsaturated zone. It is calculated according to the following equation (), where the product of ly and m is calculated separately, reclassified and multiplied by the degree of confinement. ly is the lithology type, m is the thickness of each layer and cn is the confining condition. For the study area, the soil database was utilized to determine the lithology and confinement of the aquifer. The thickness of the unsaturated zone was determined using the static water level data collected during the field surveys. The lower the value of the product of ly is and m the lower the protection value is, the higher the vulnerability is.
- O factor: finally, the O Factor is calculated by summing the OL and the OS factors.
- Calculating the P Factor: The P Factor represents the climatic conditions in the catchment. It is the sum of two sub-factors (PQ and PI) defining the amount and intensity of precipitation, respectively, for the wet years. For the study area, daily rain records from 3 weather stations surrounding the landfill were used.
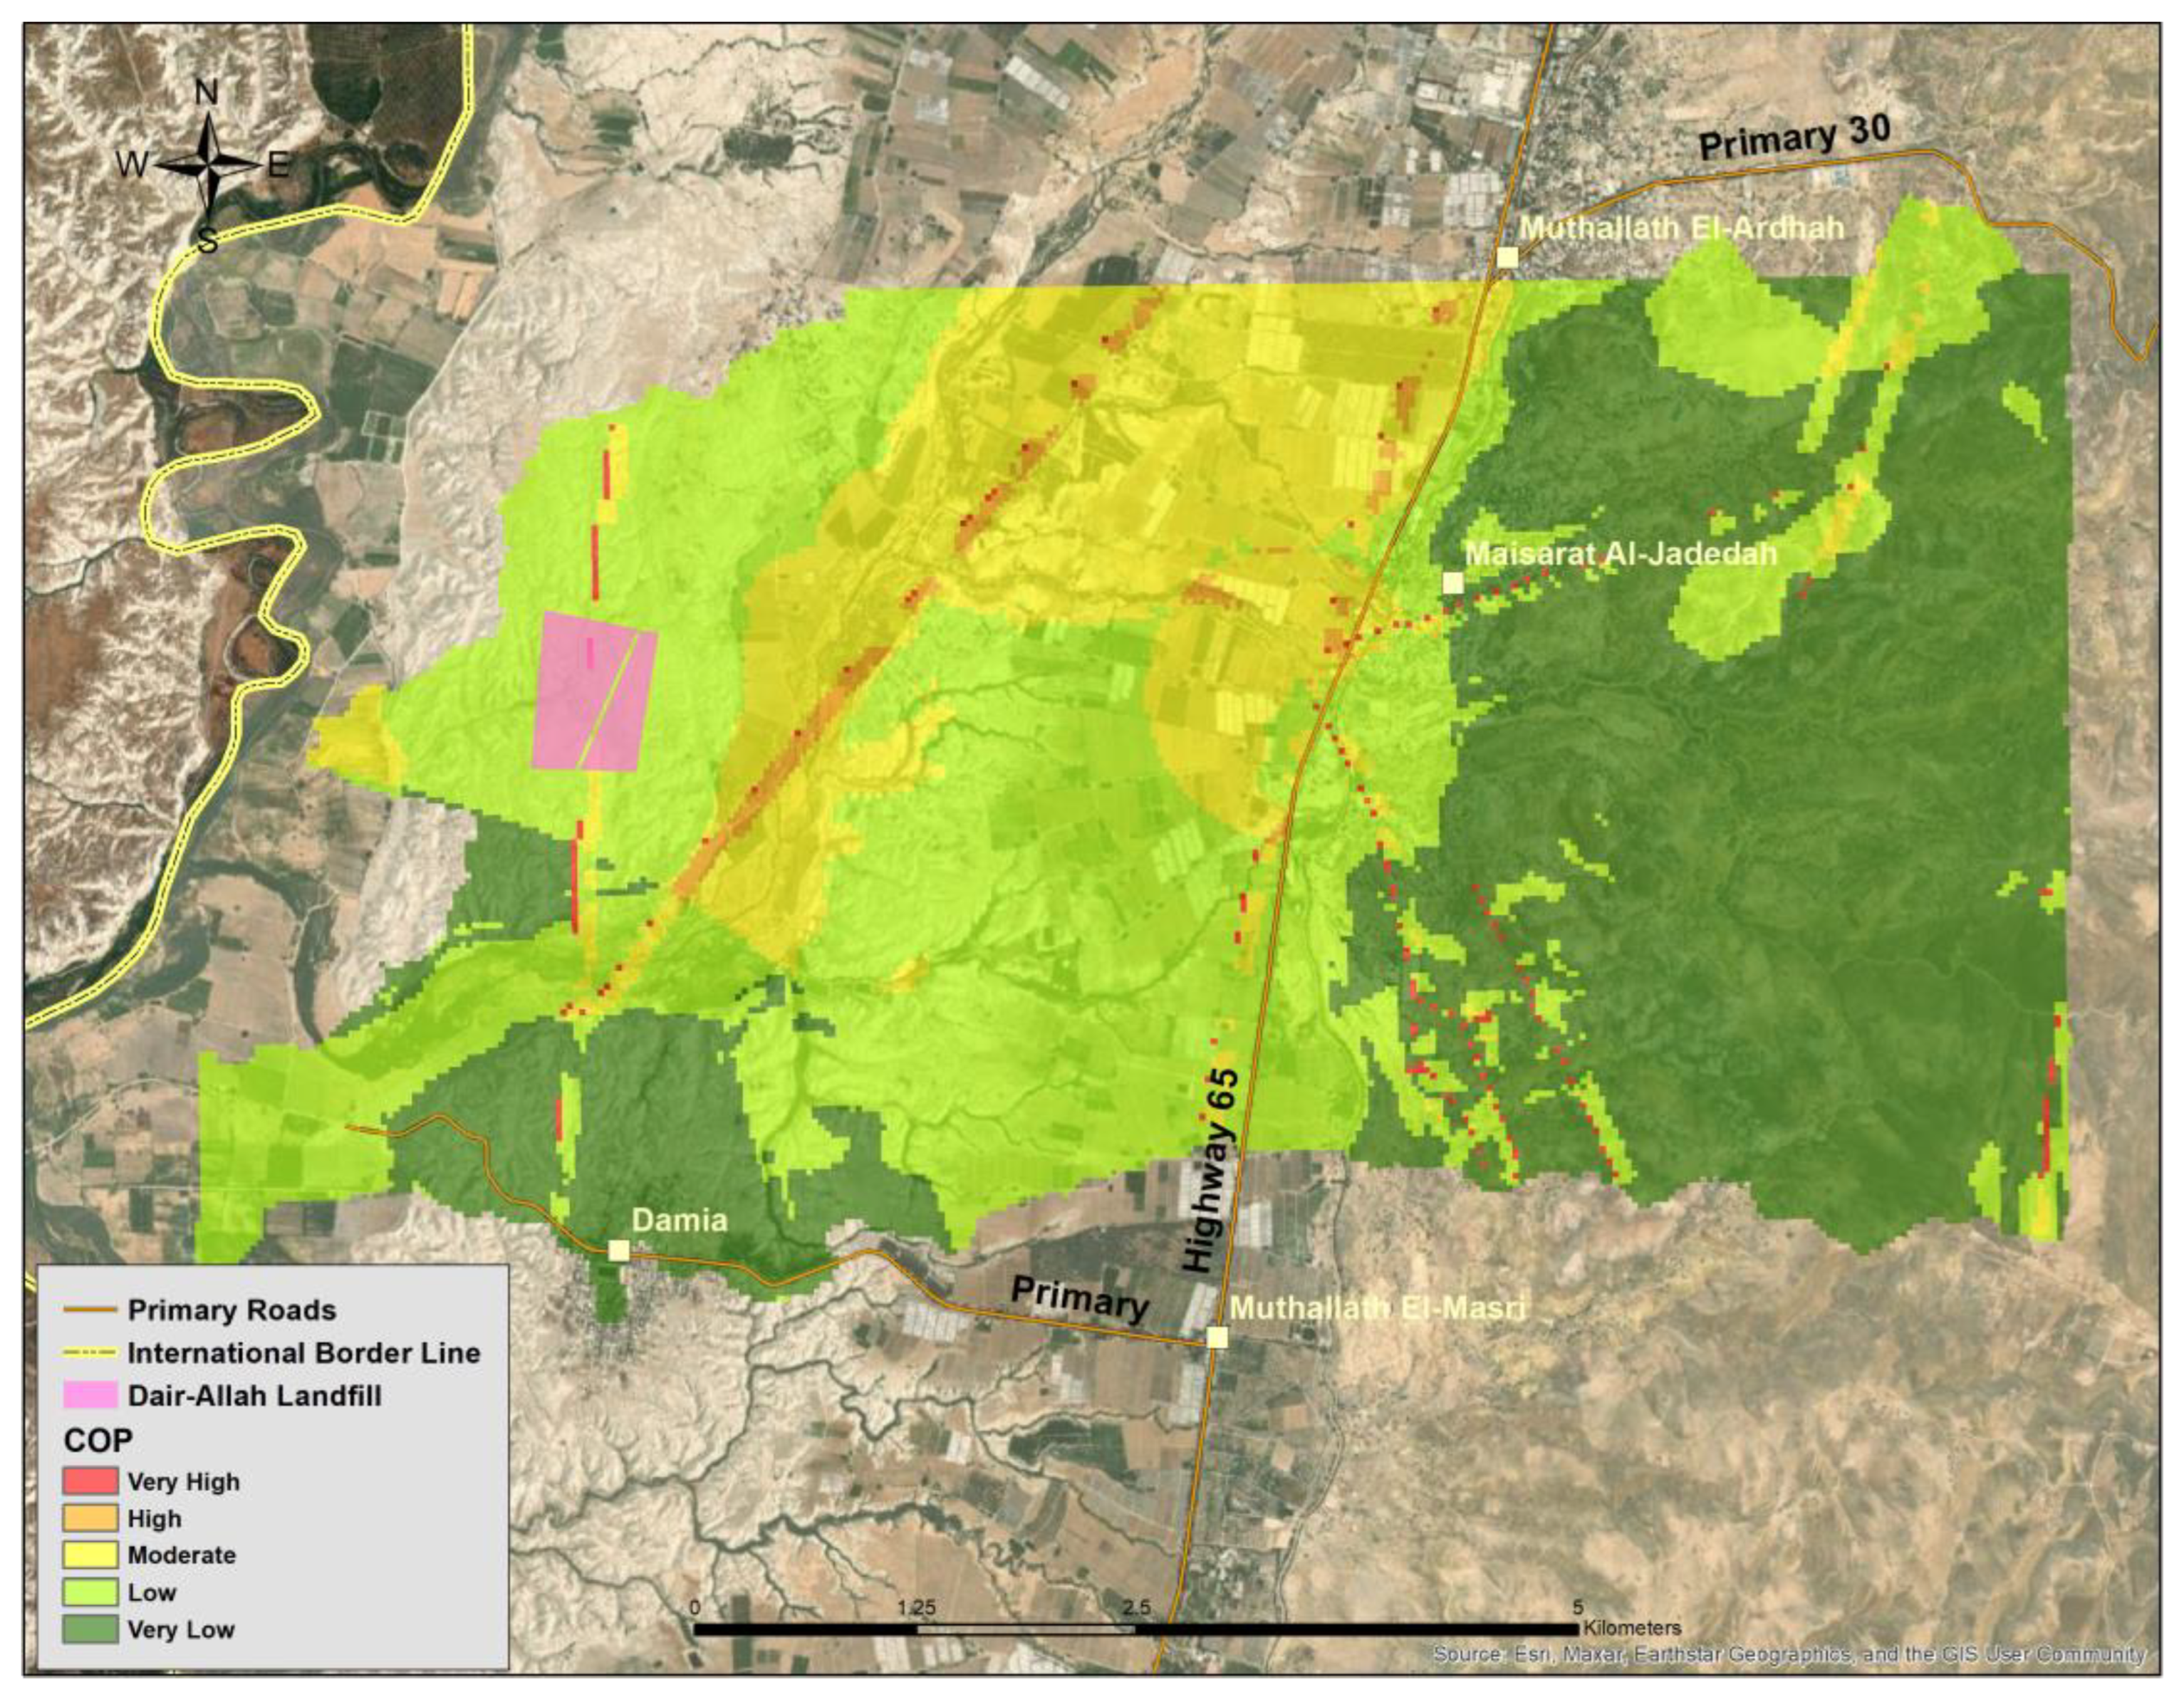
- Calculating the COP Index: The multiplication of the three factors, namely, C, O and P, yields the COP factor/index which represents the degree of groundwater vulnerability to contamination. The final map is the reclassified according to the vulnerability classes, as shown in the table below (Table 4).
2.4. Maps Verification
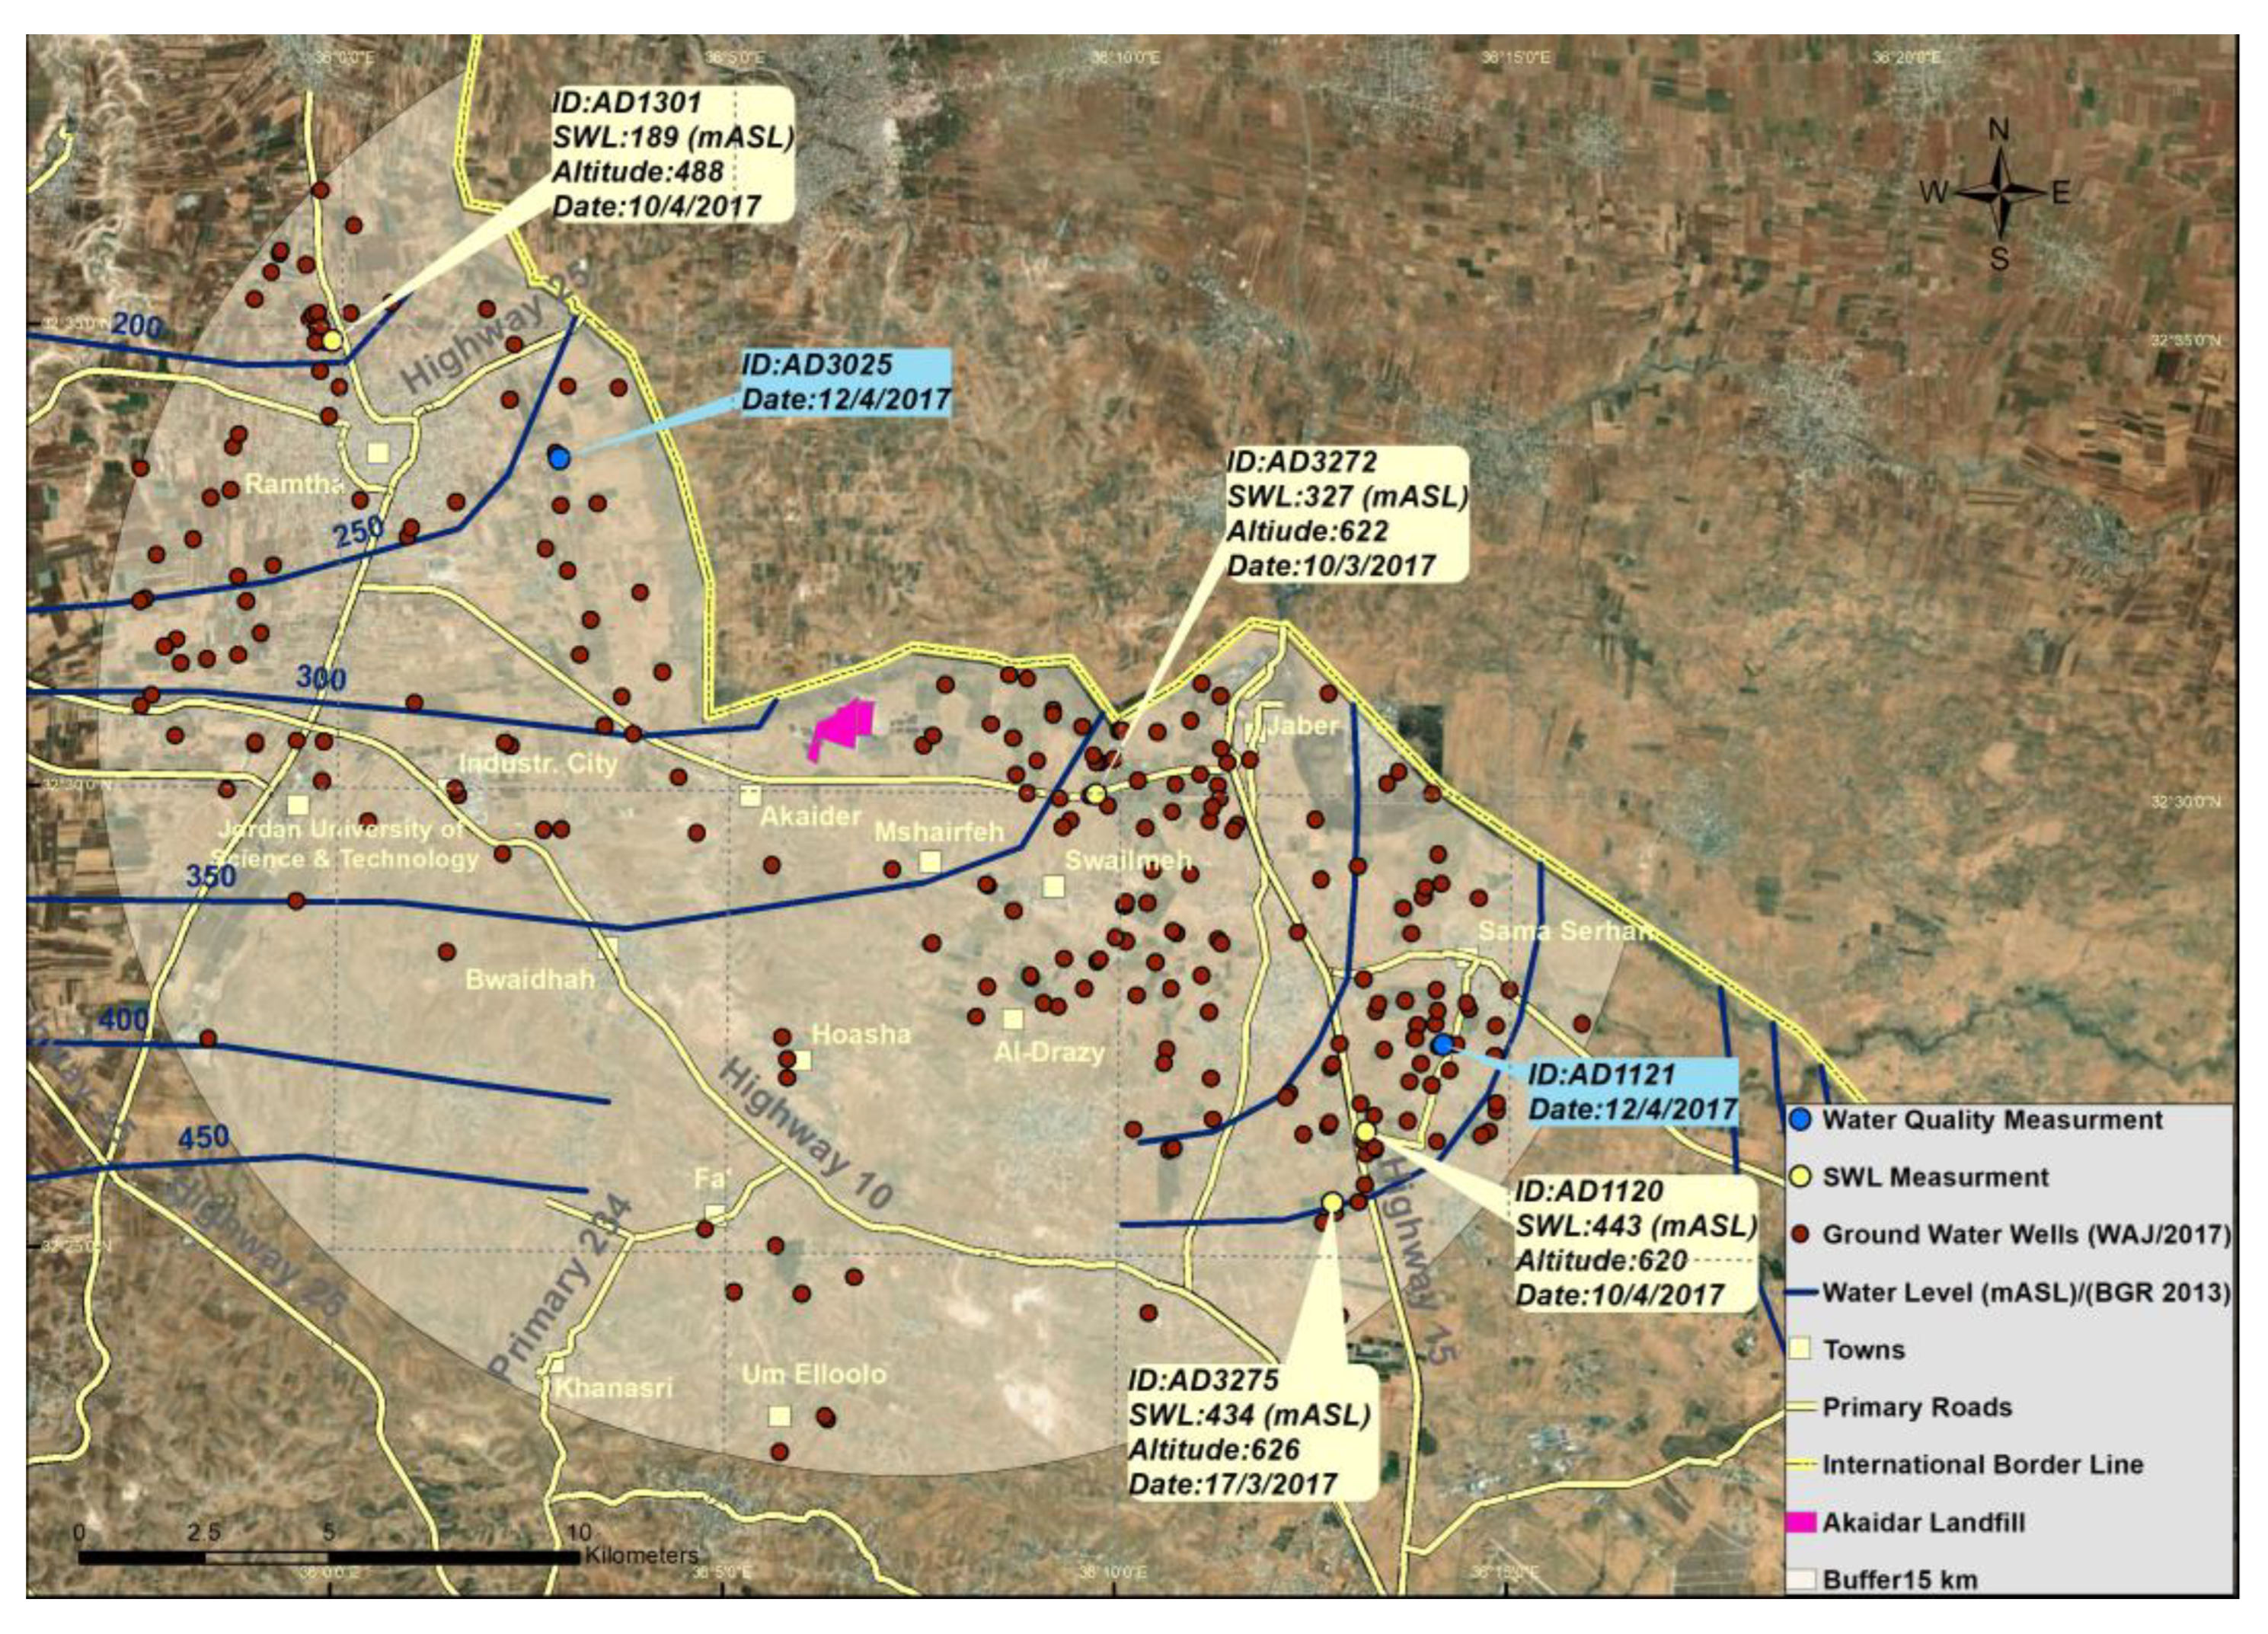
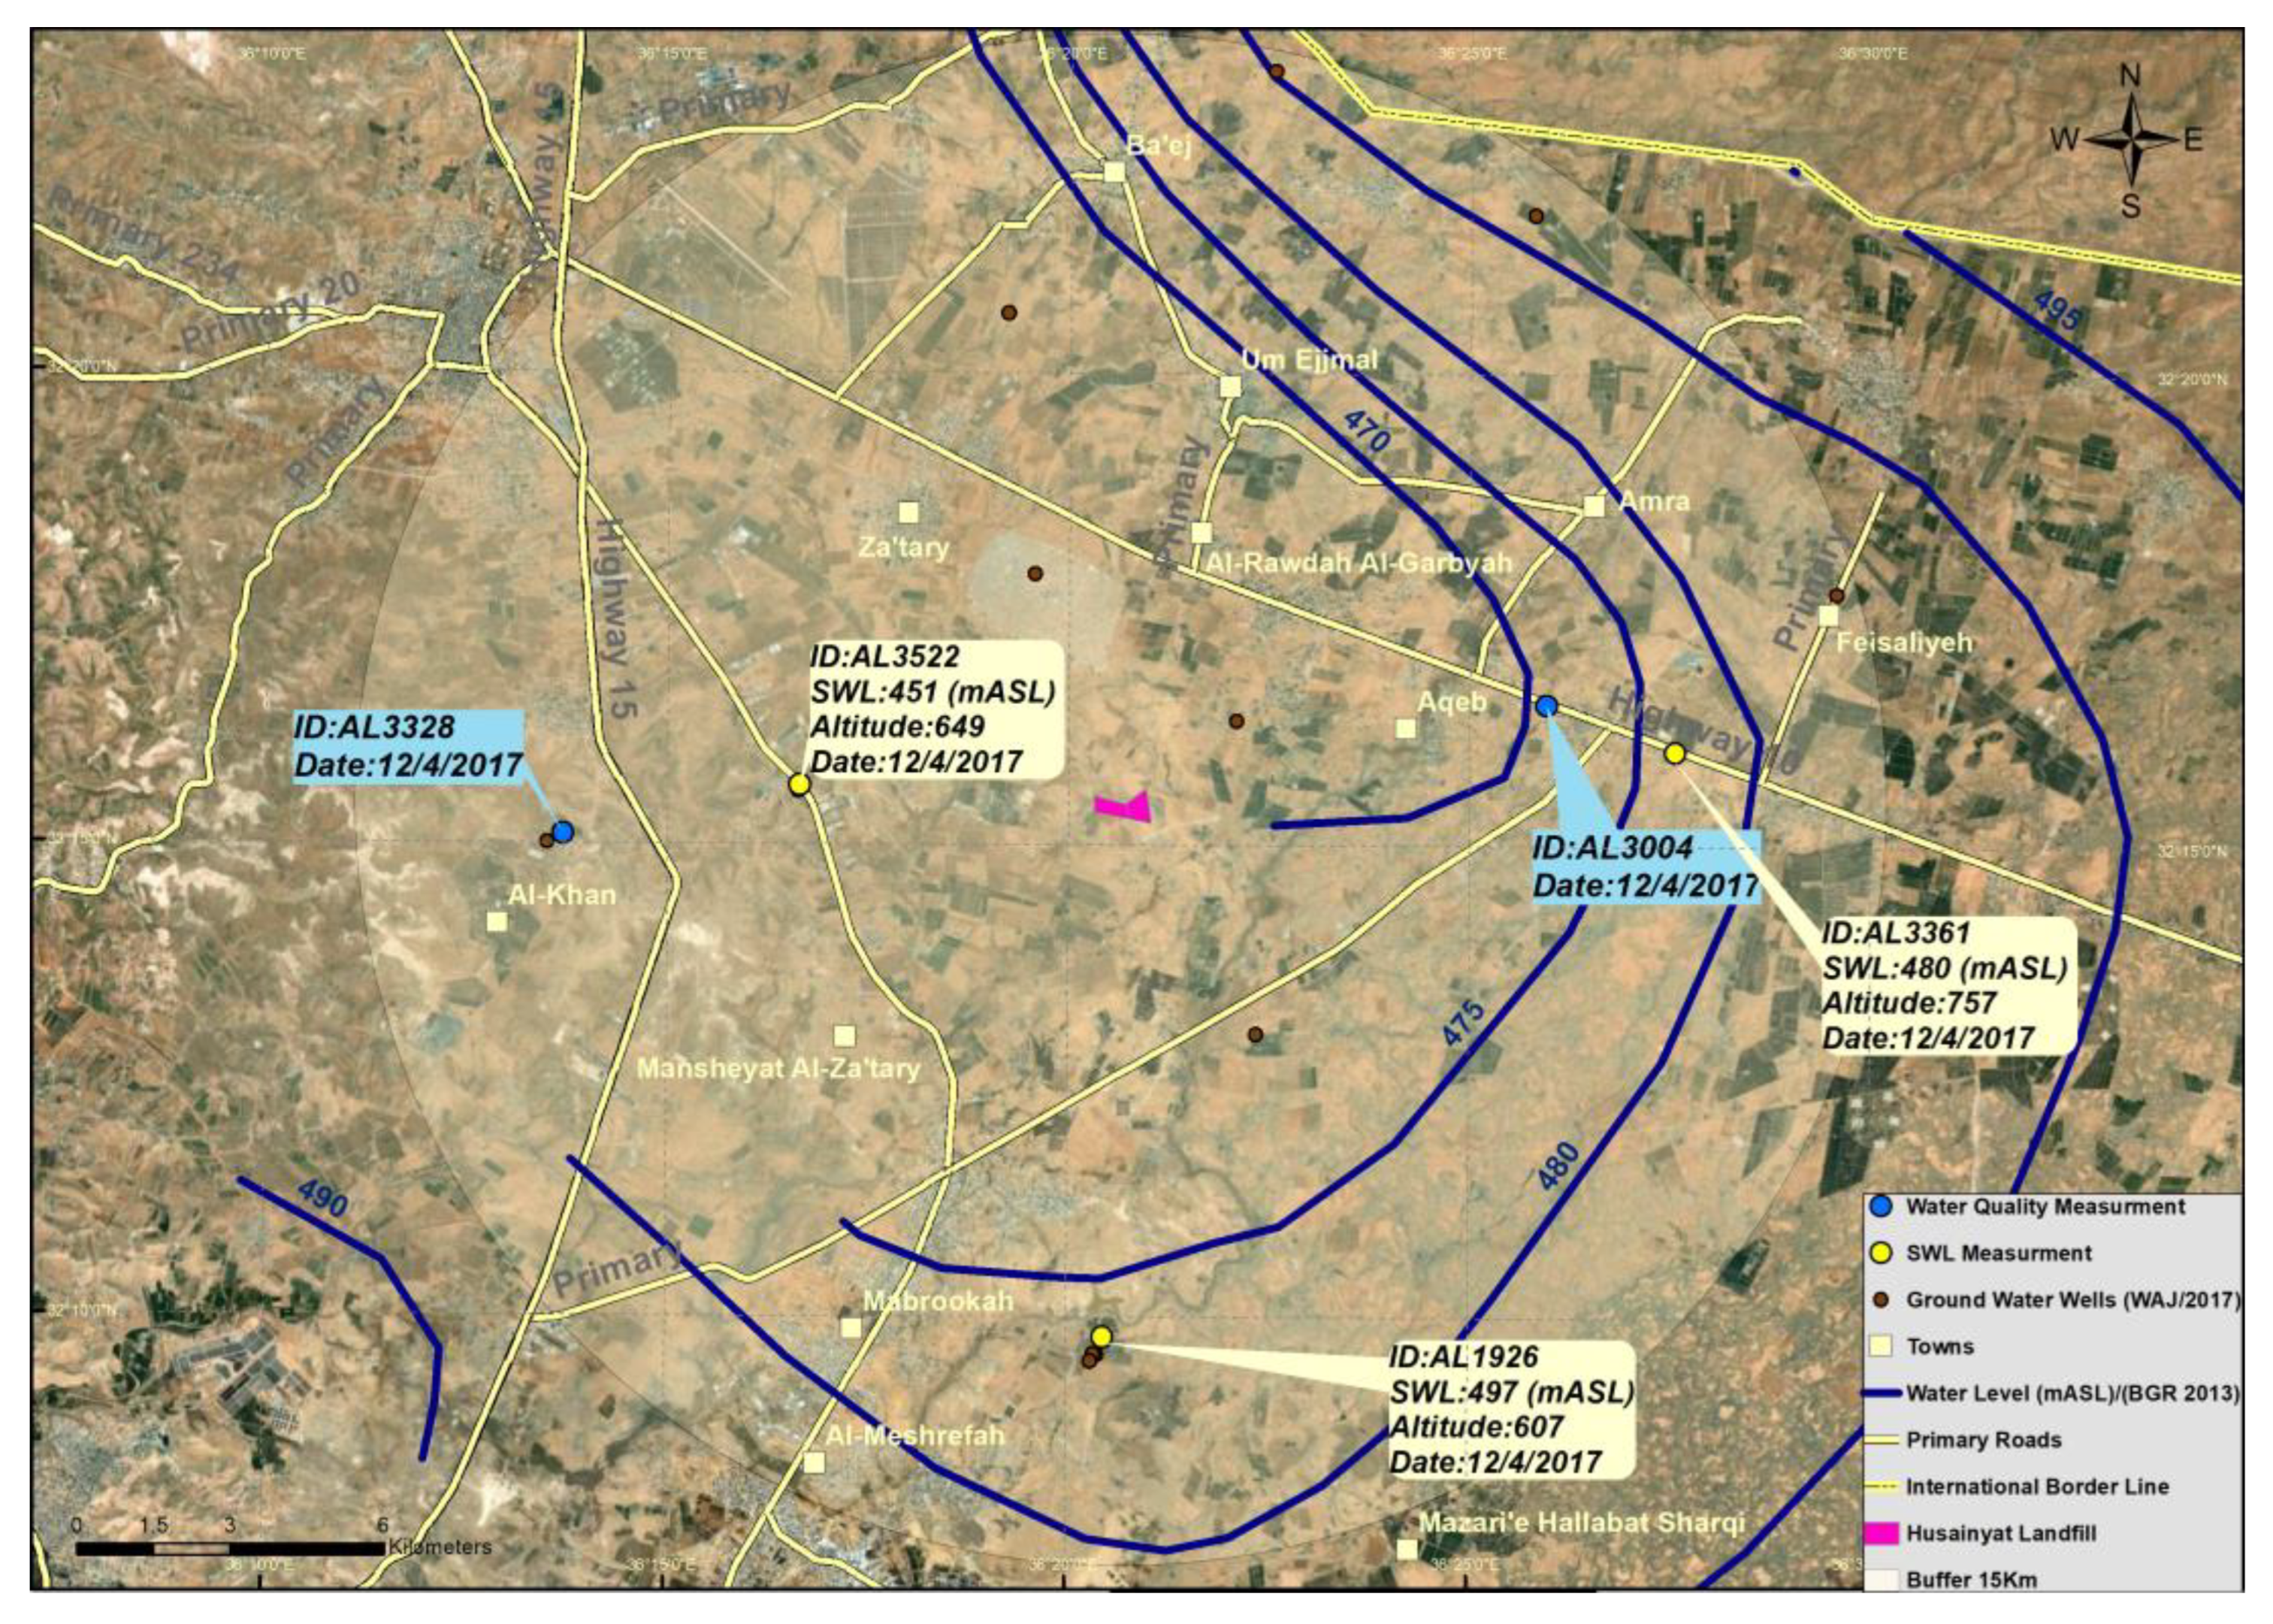
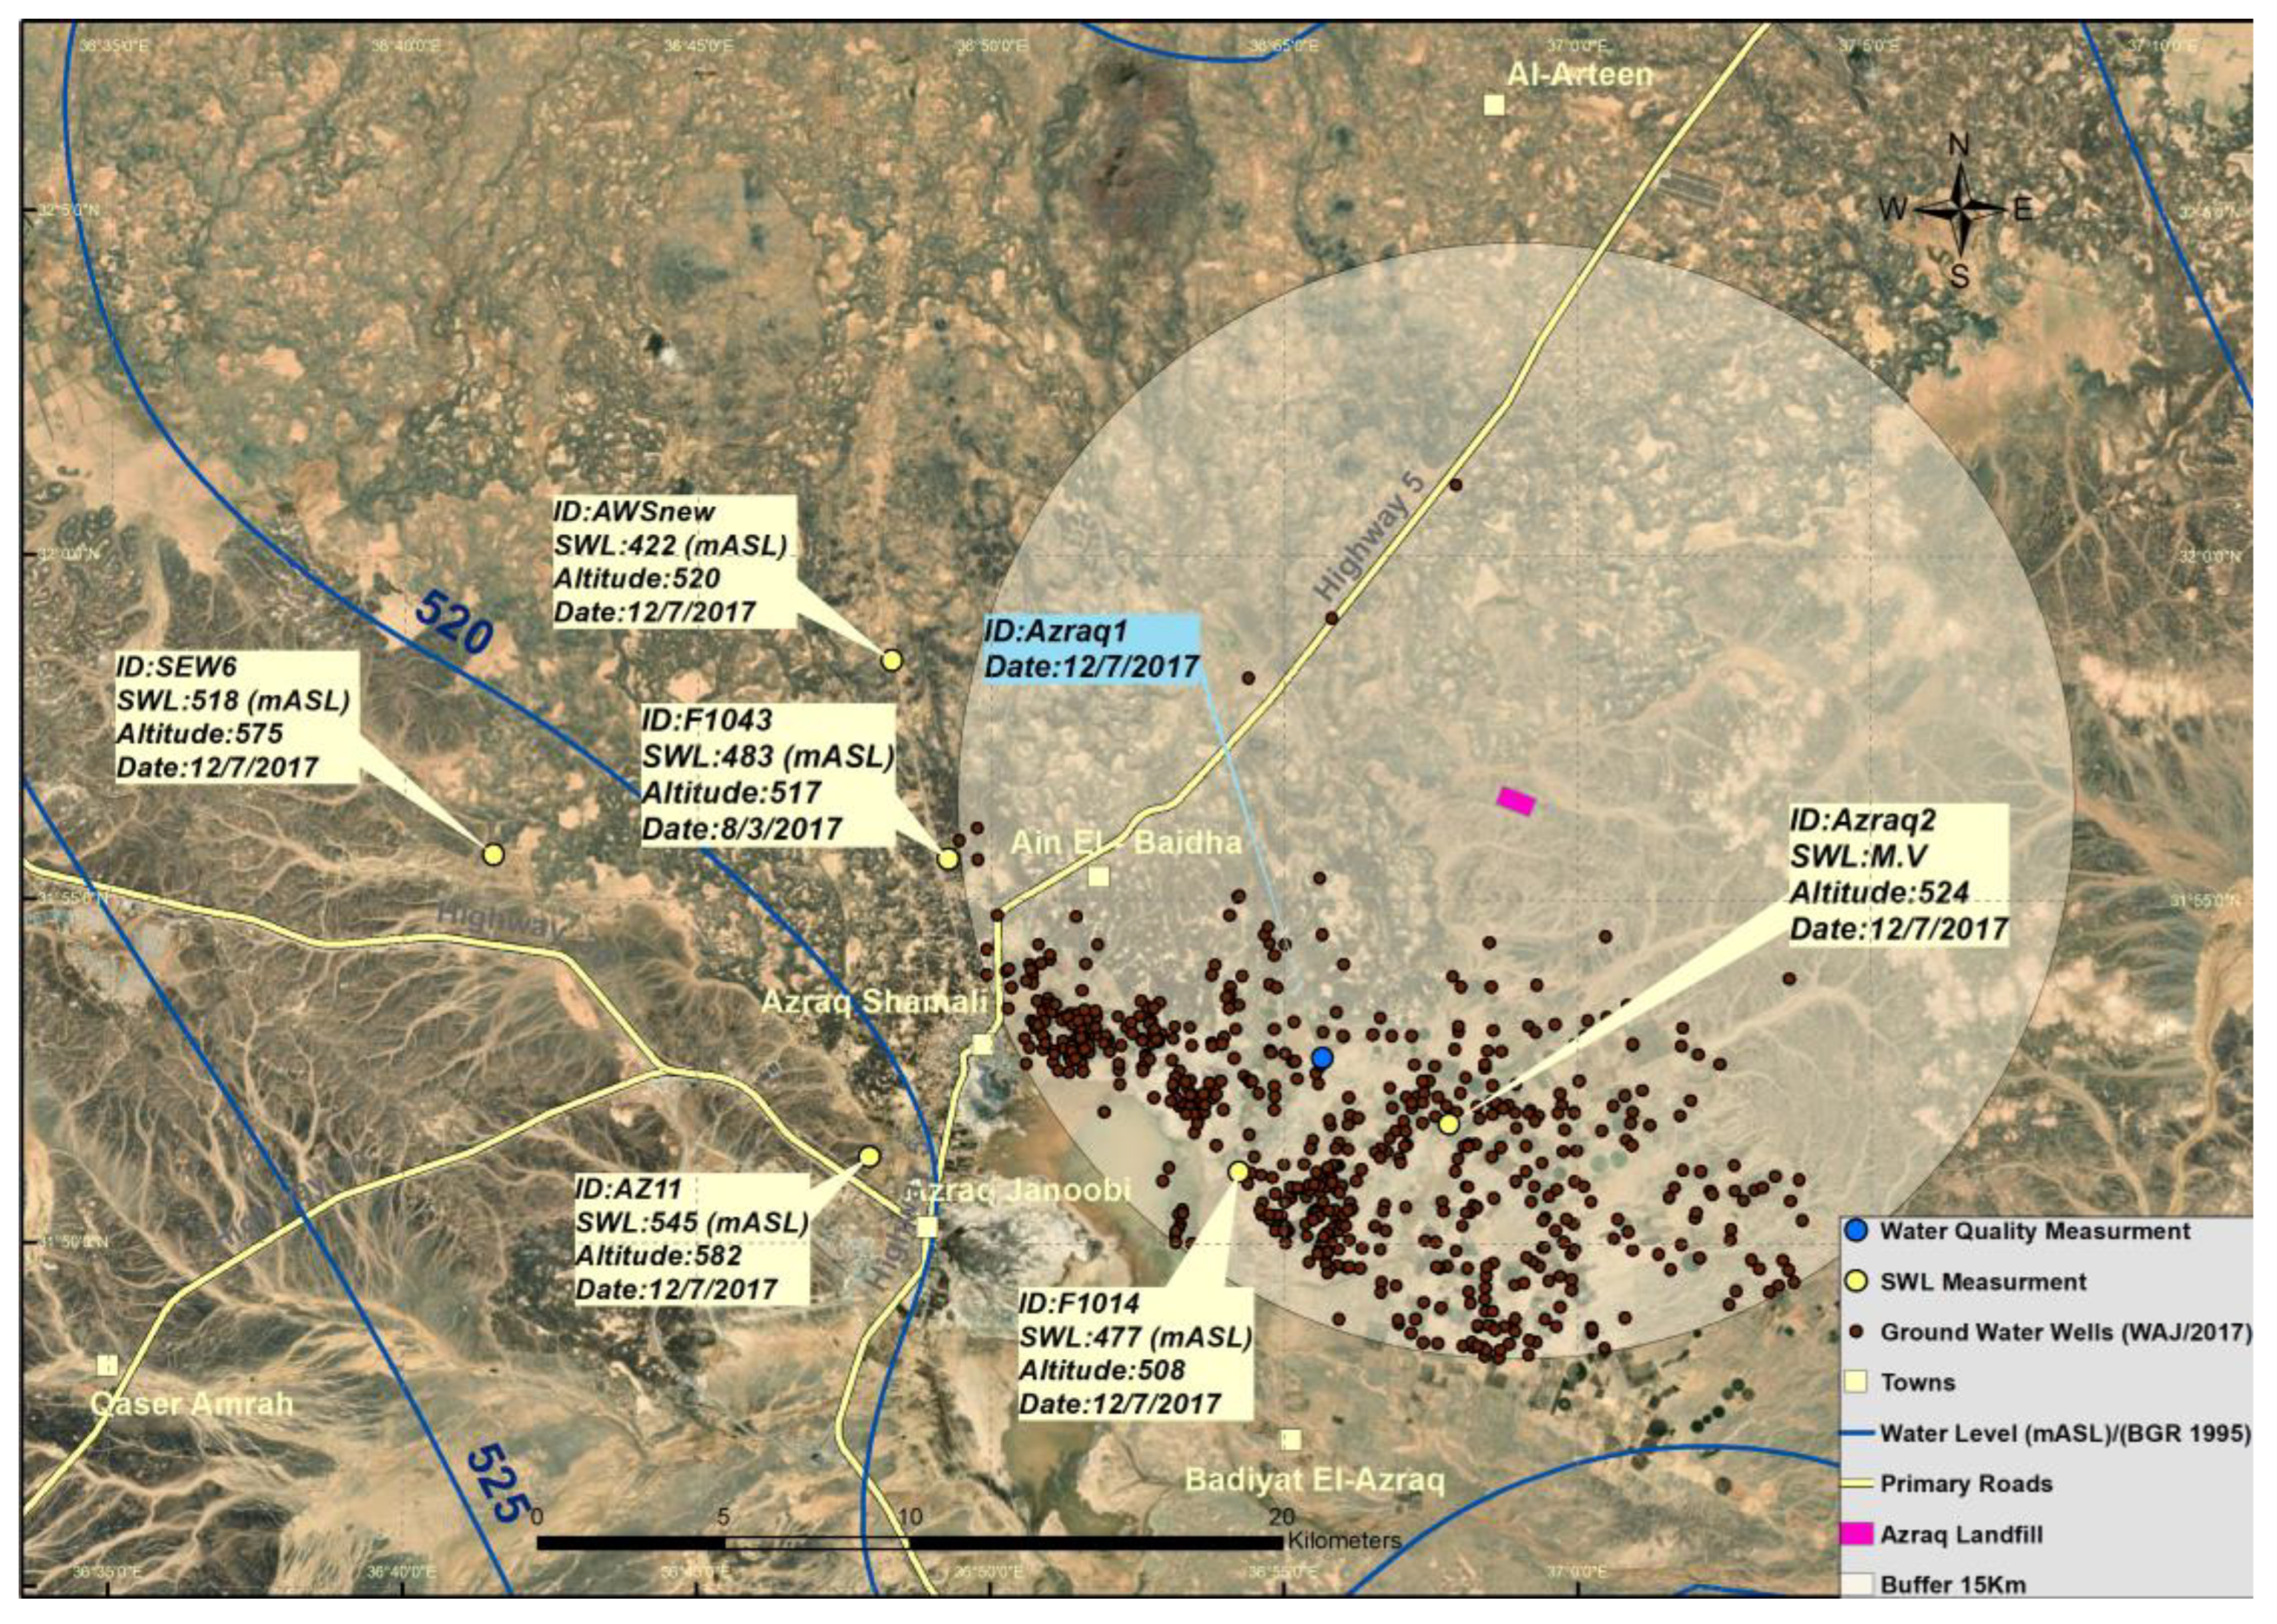
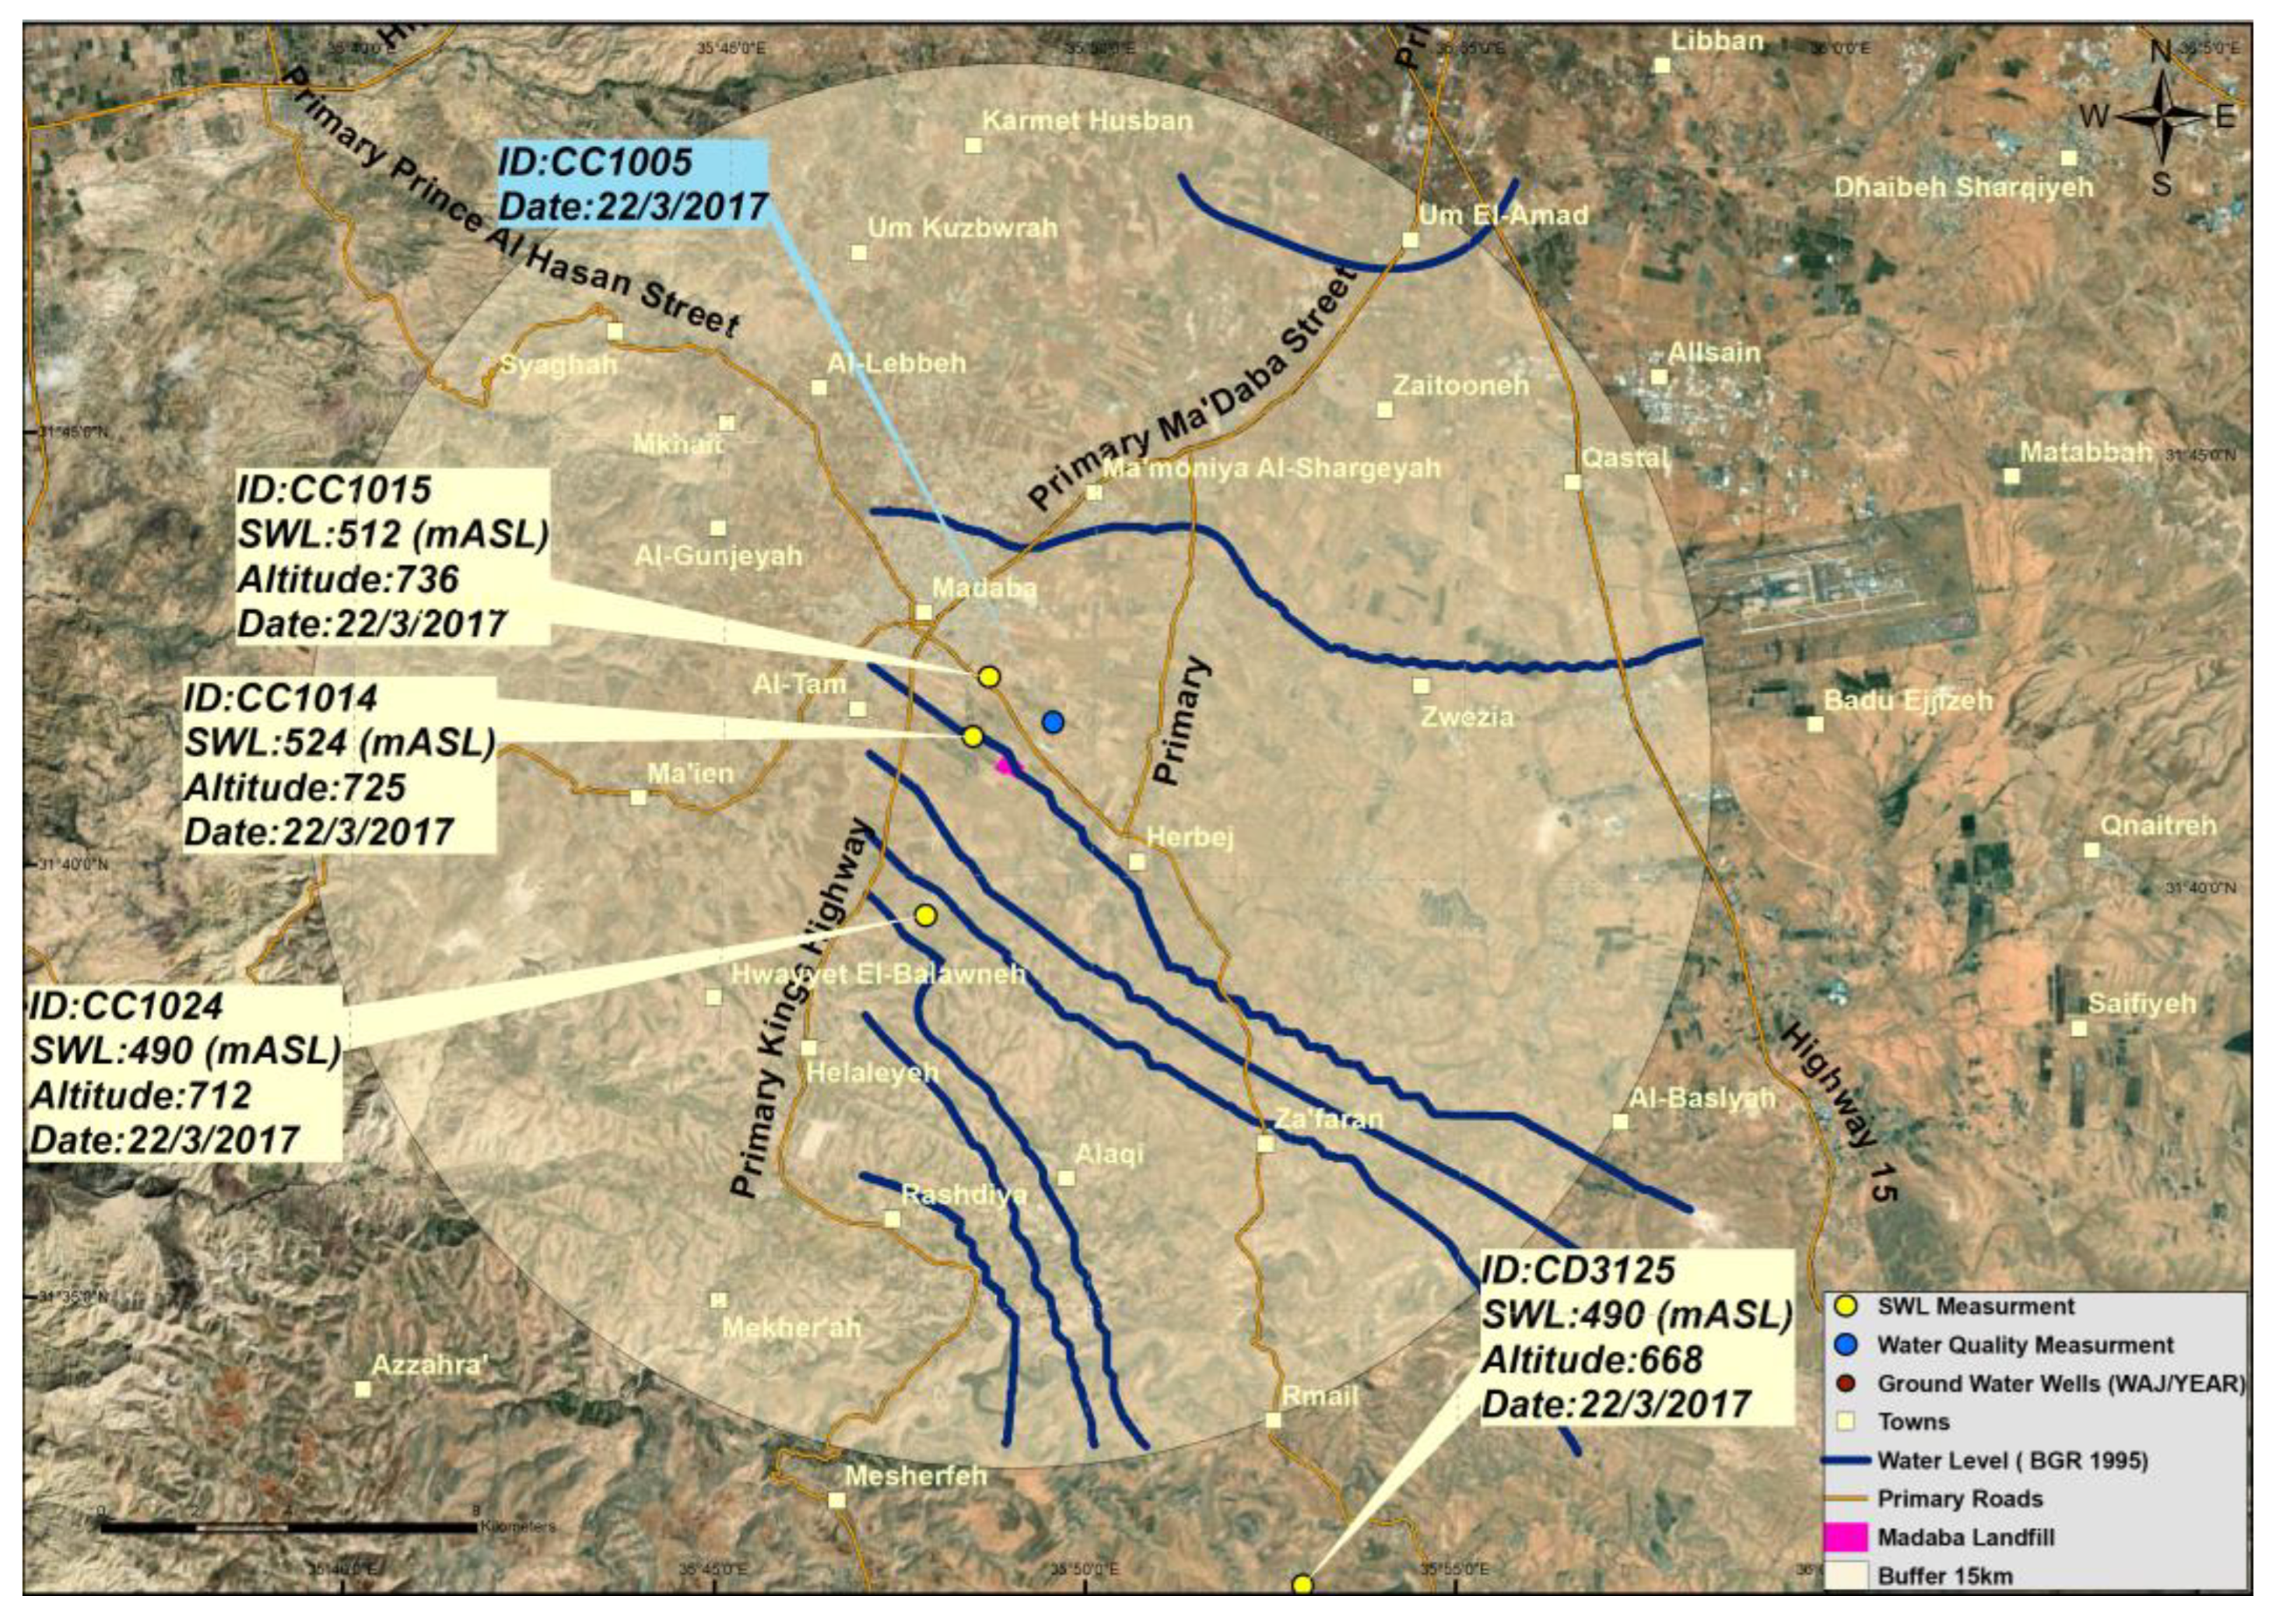
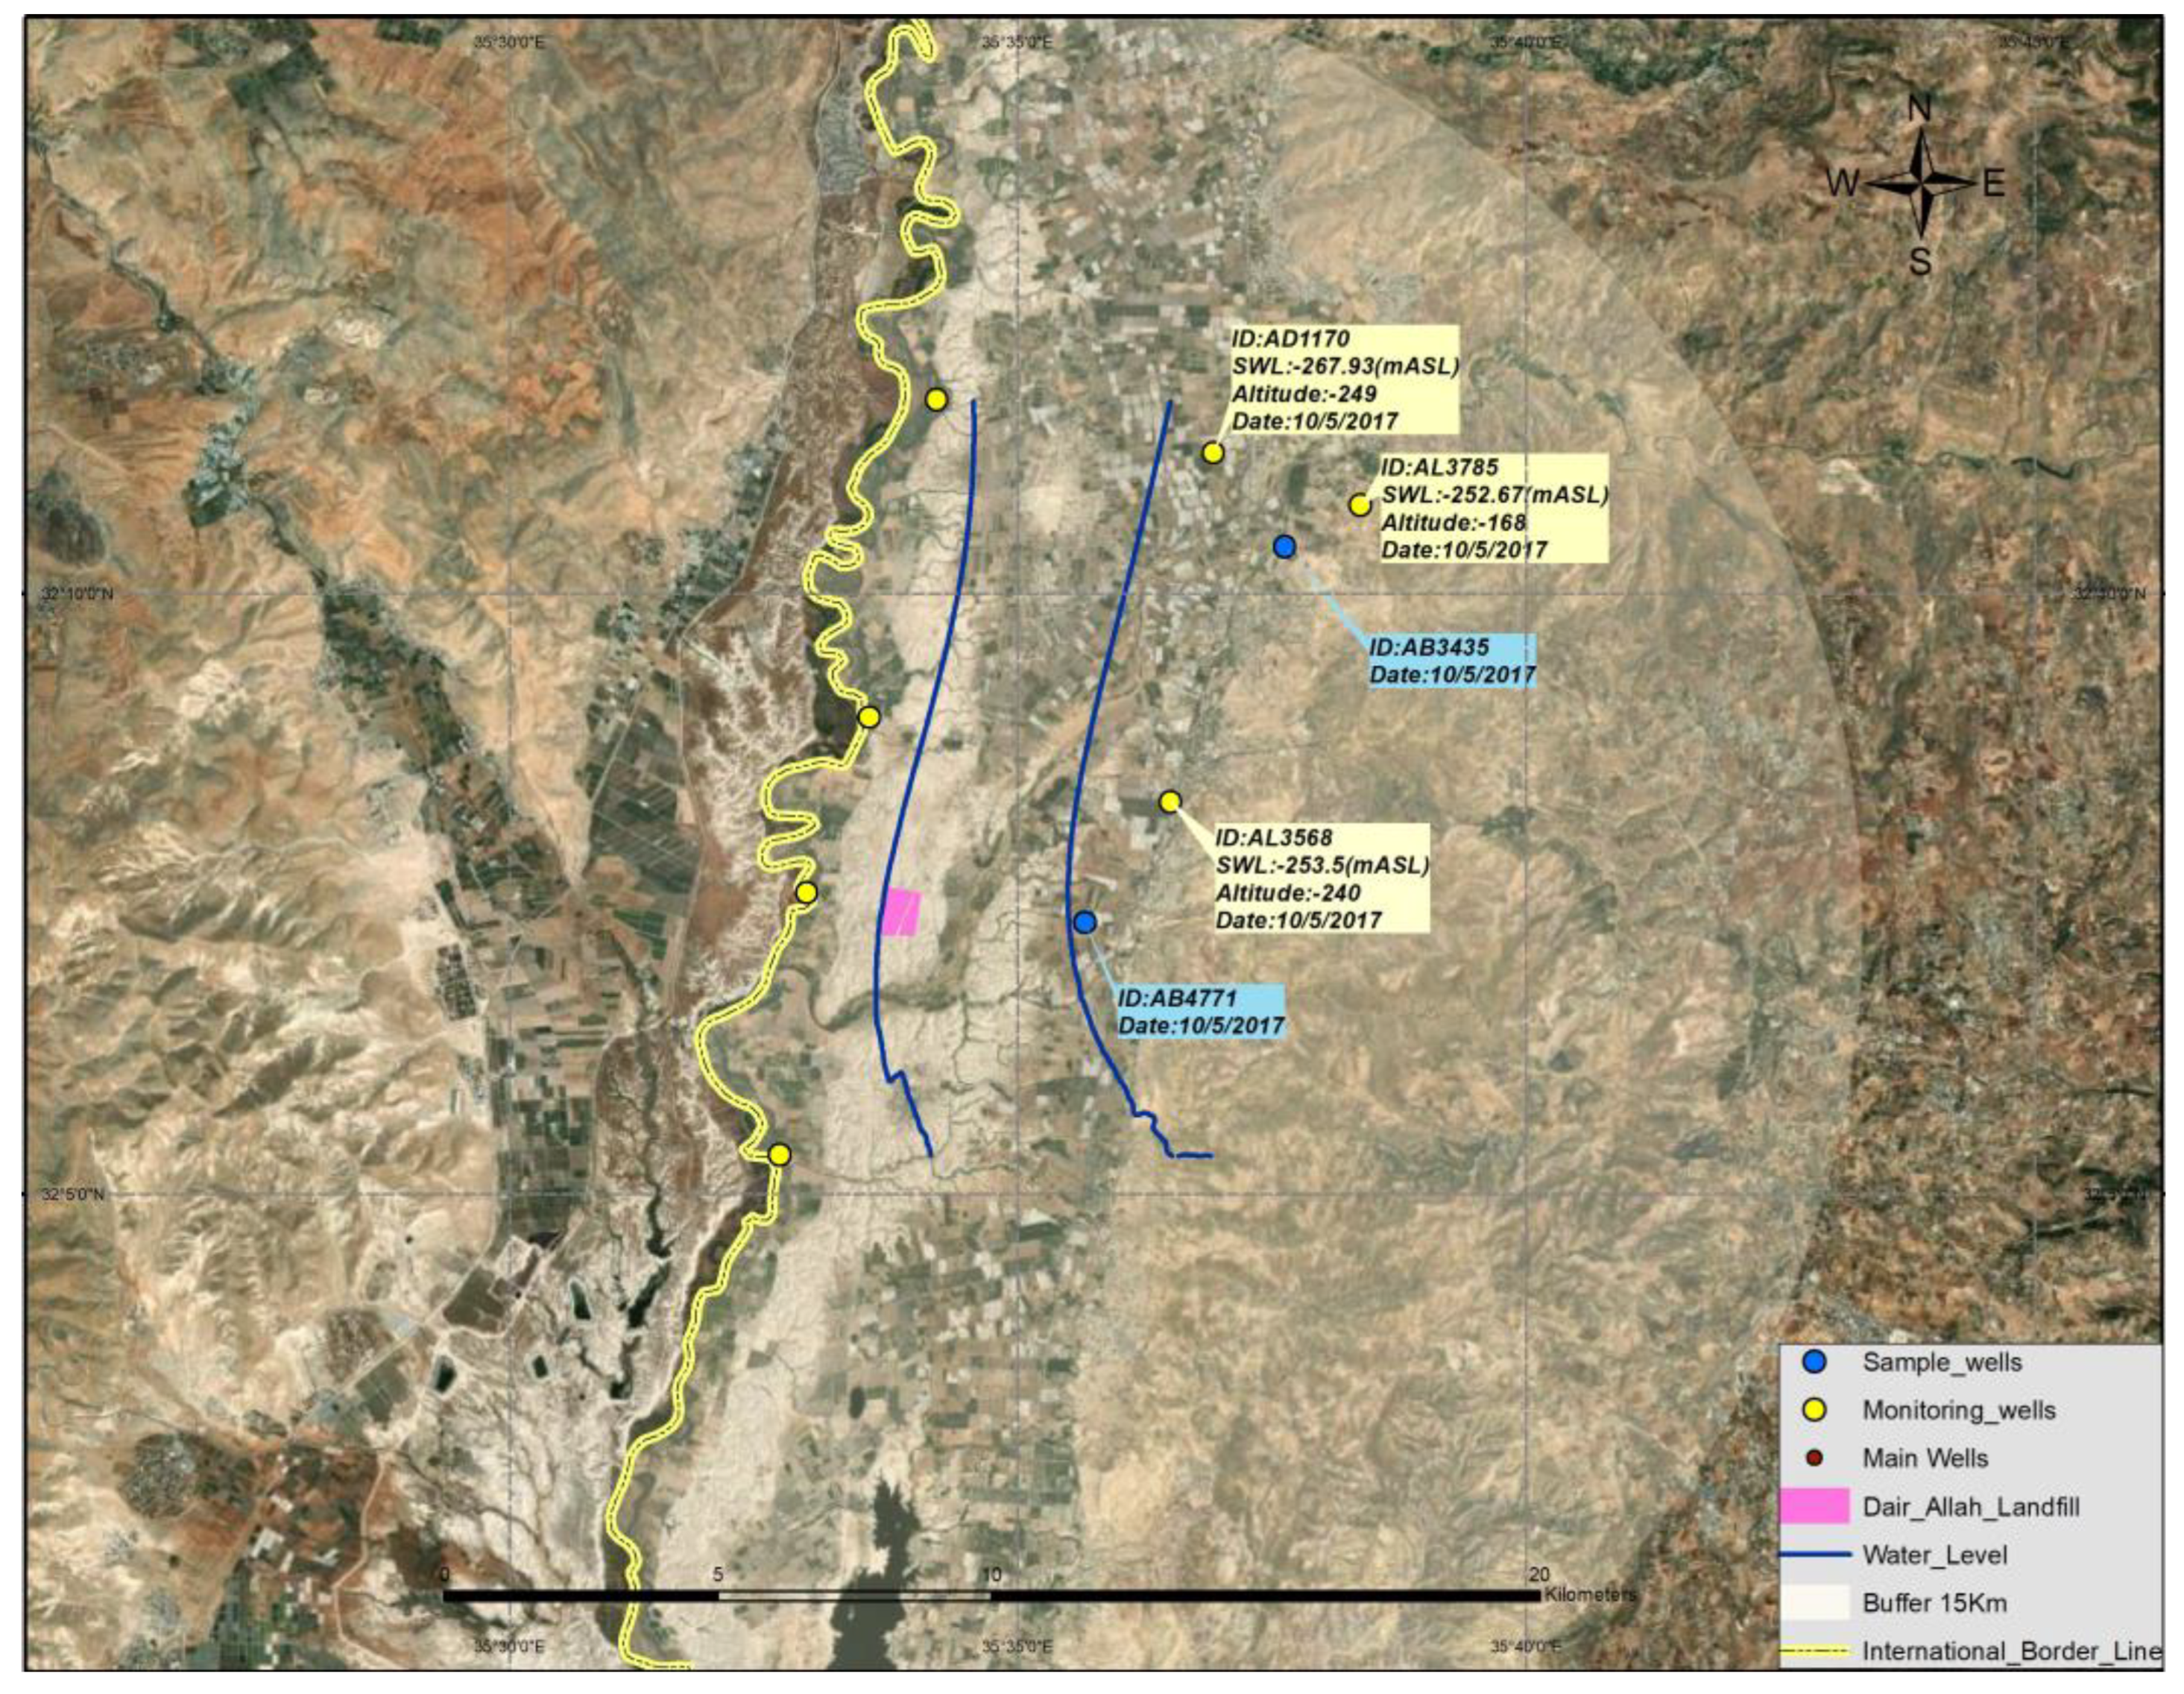
2.4.1. Identifying the Direction of Water Flow
2.4.2. Water Quality Monitoring
3. Results and Discussion
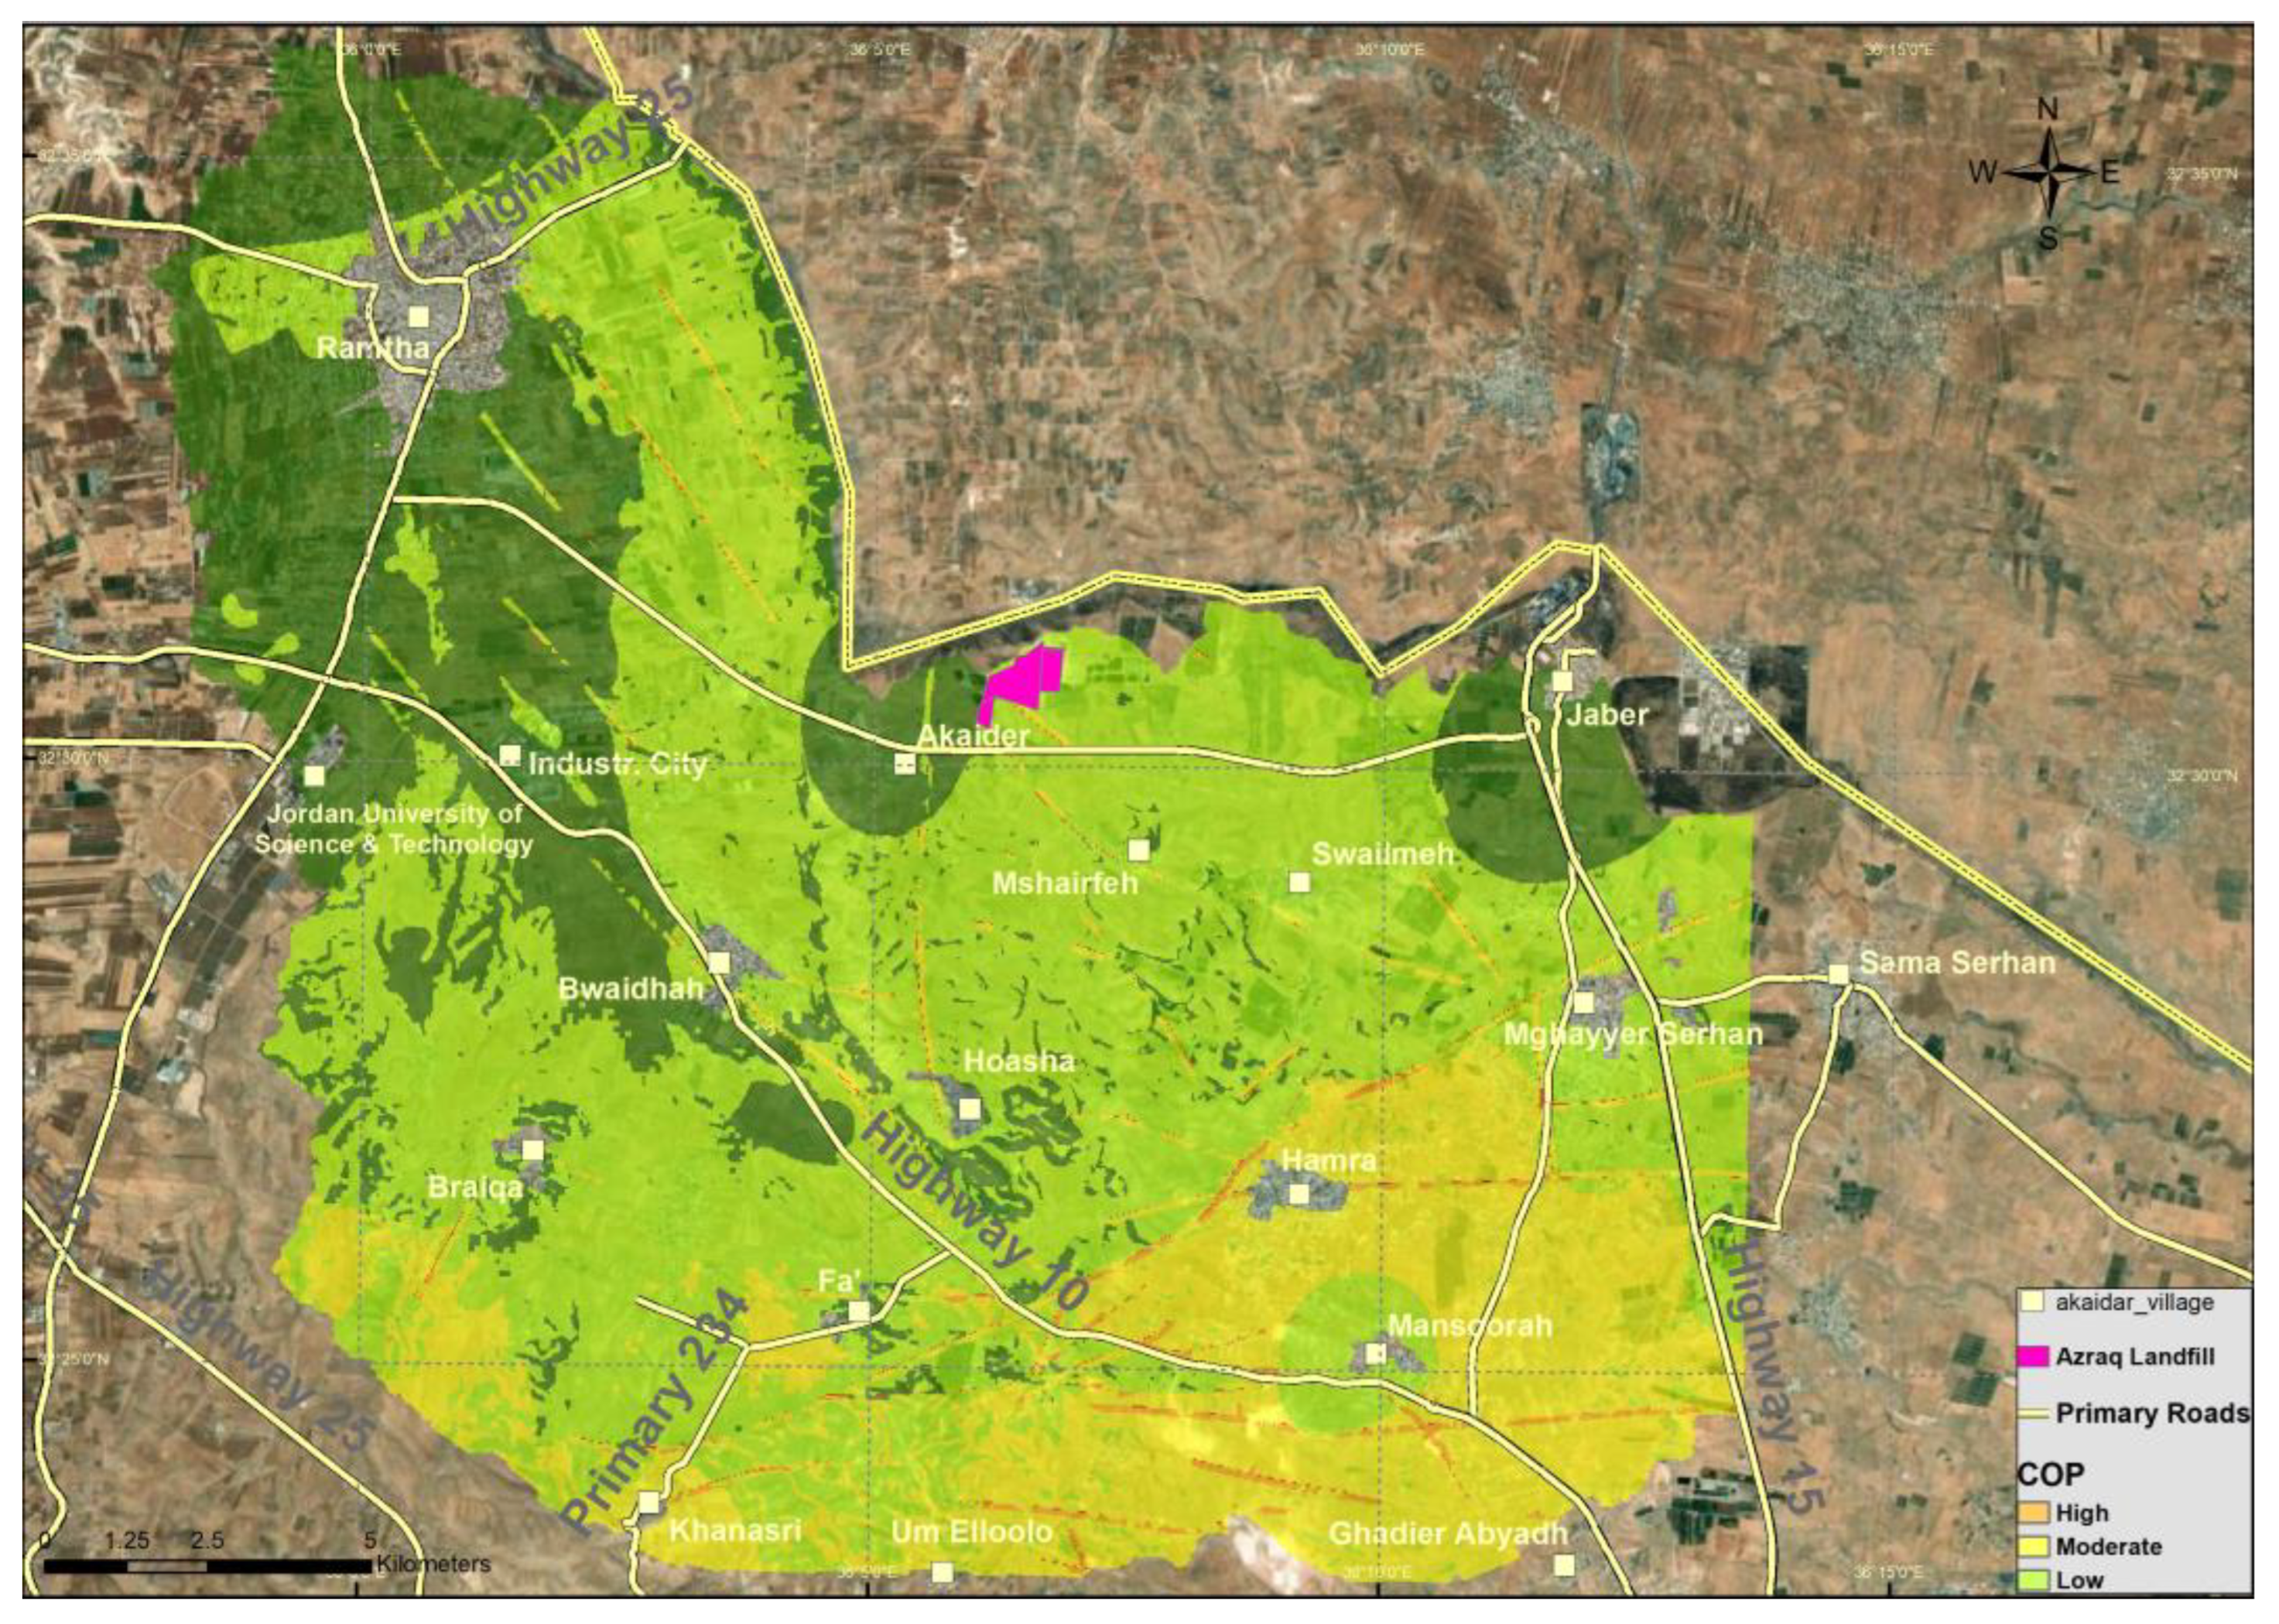
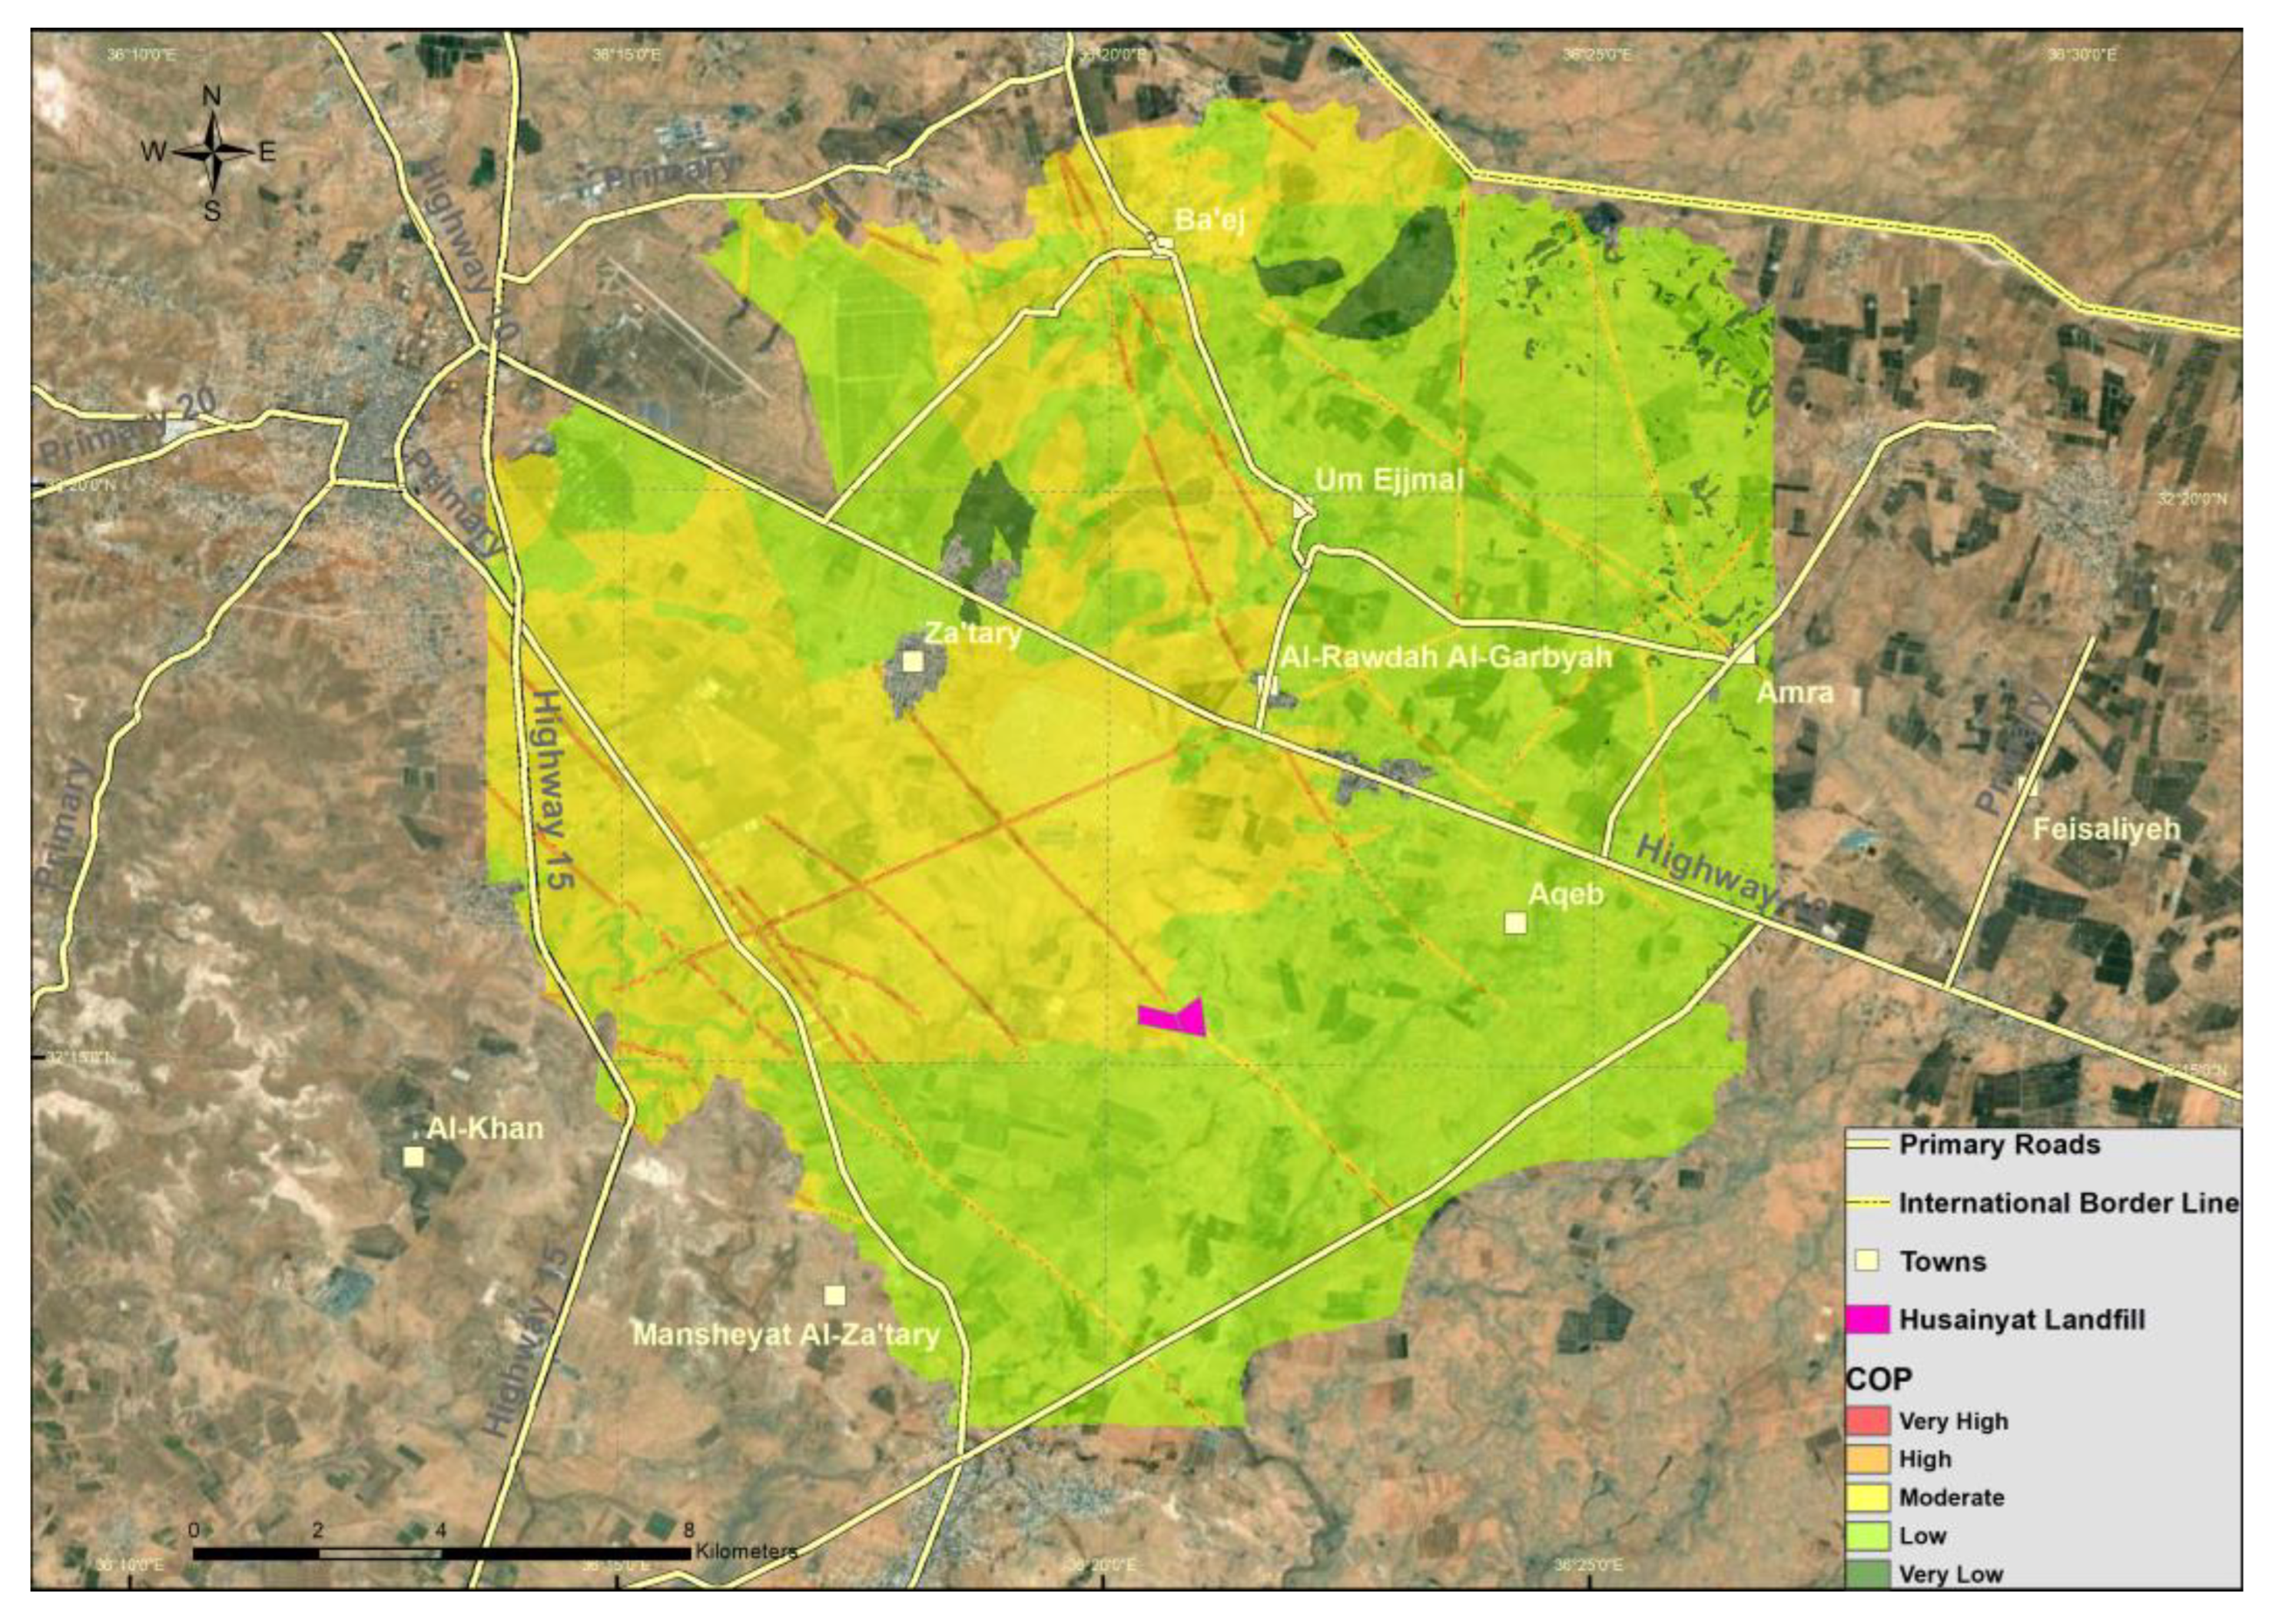
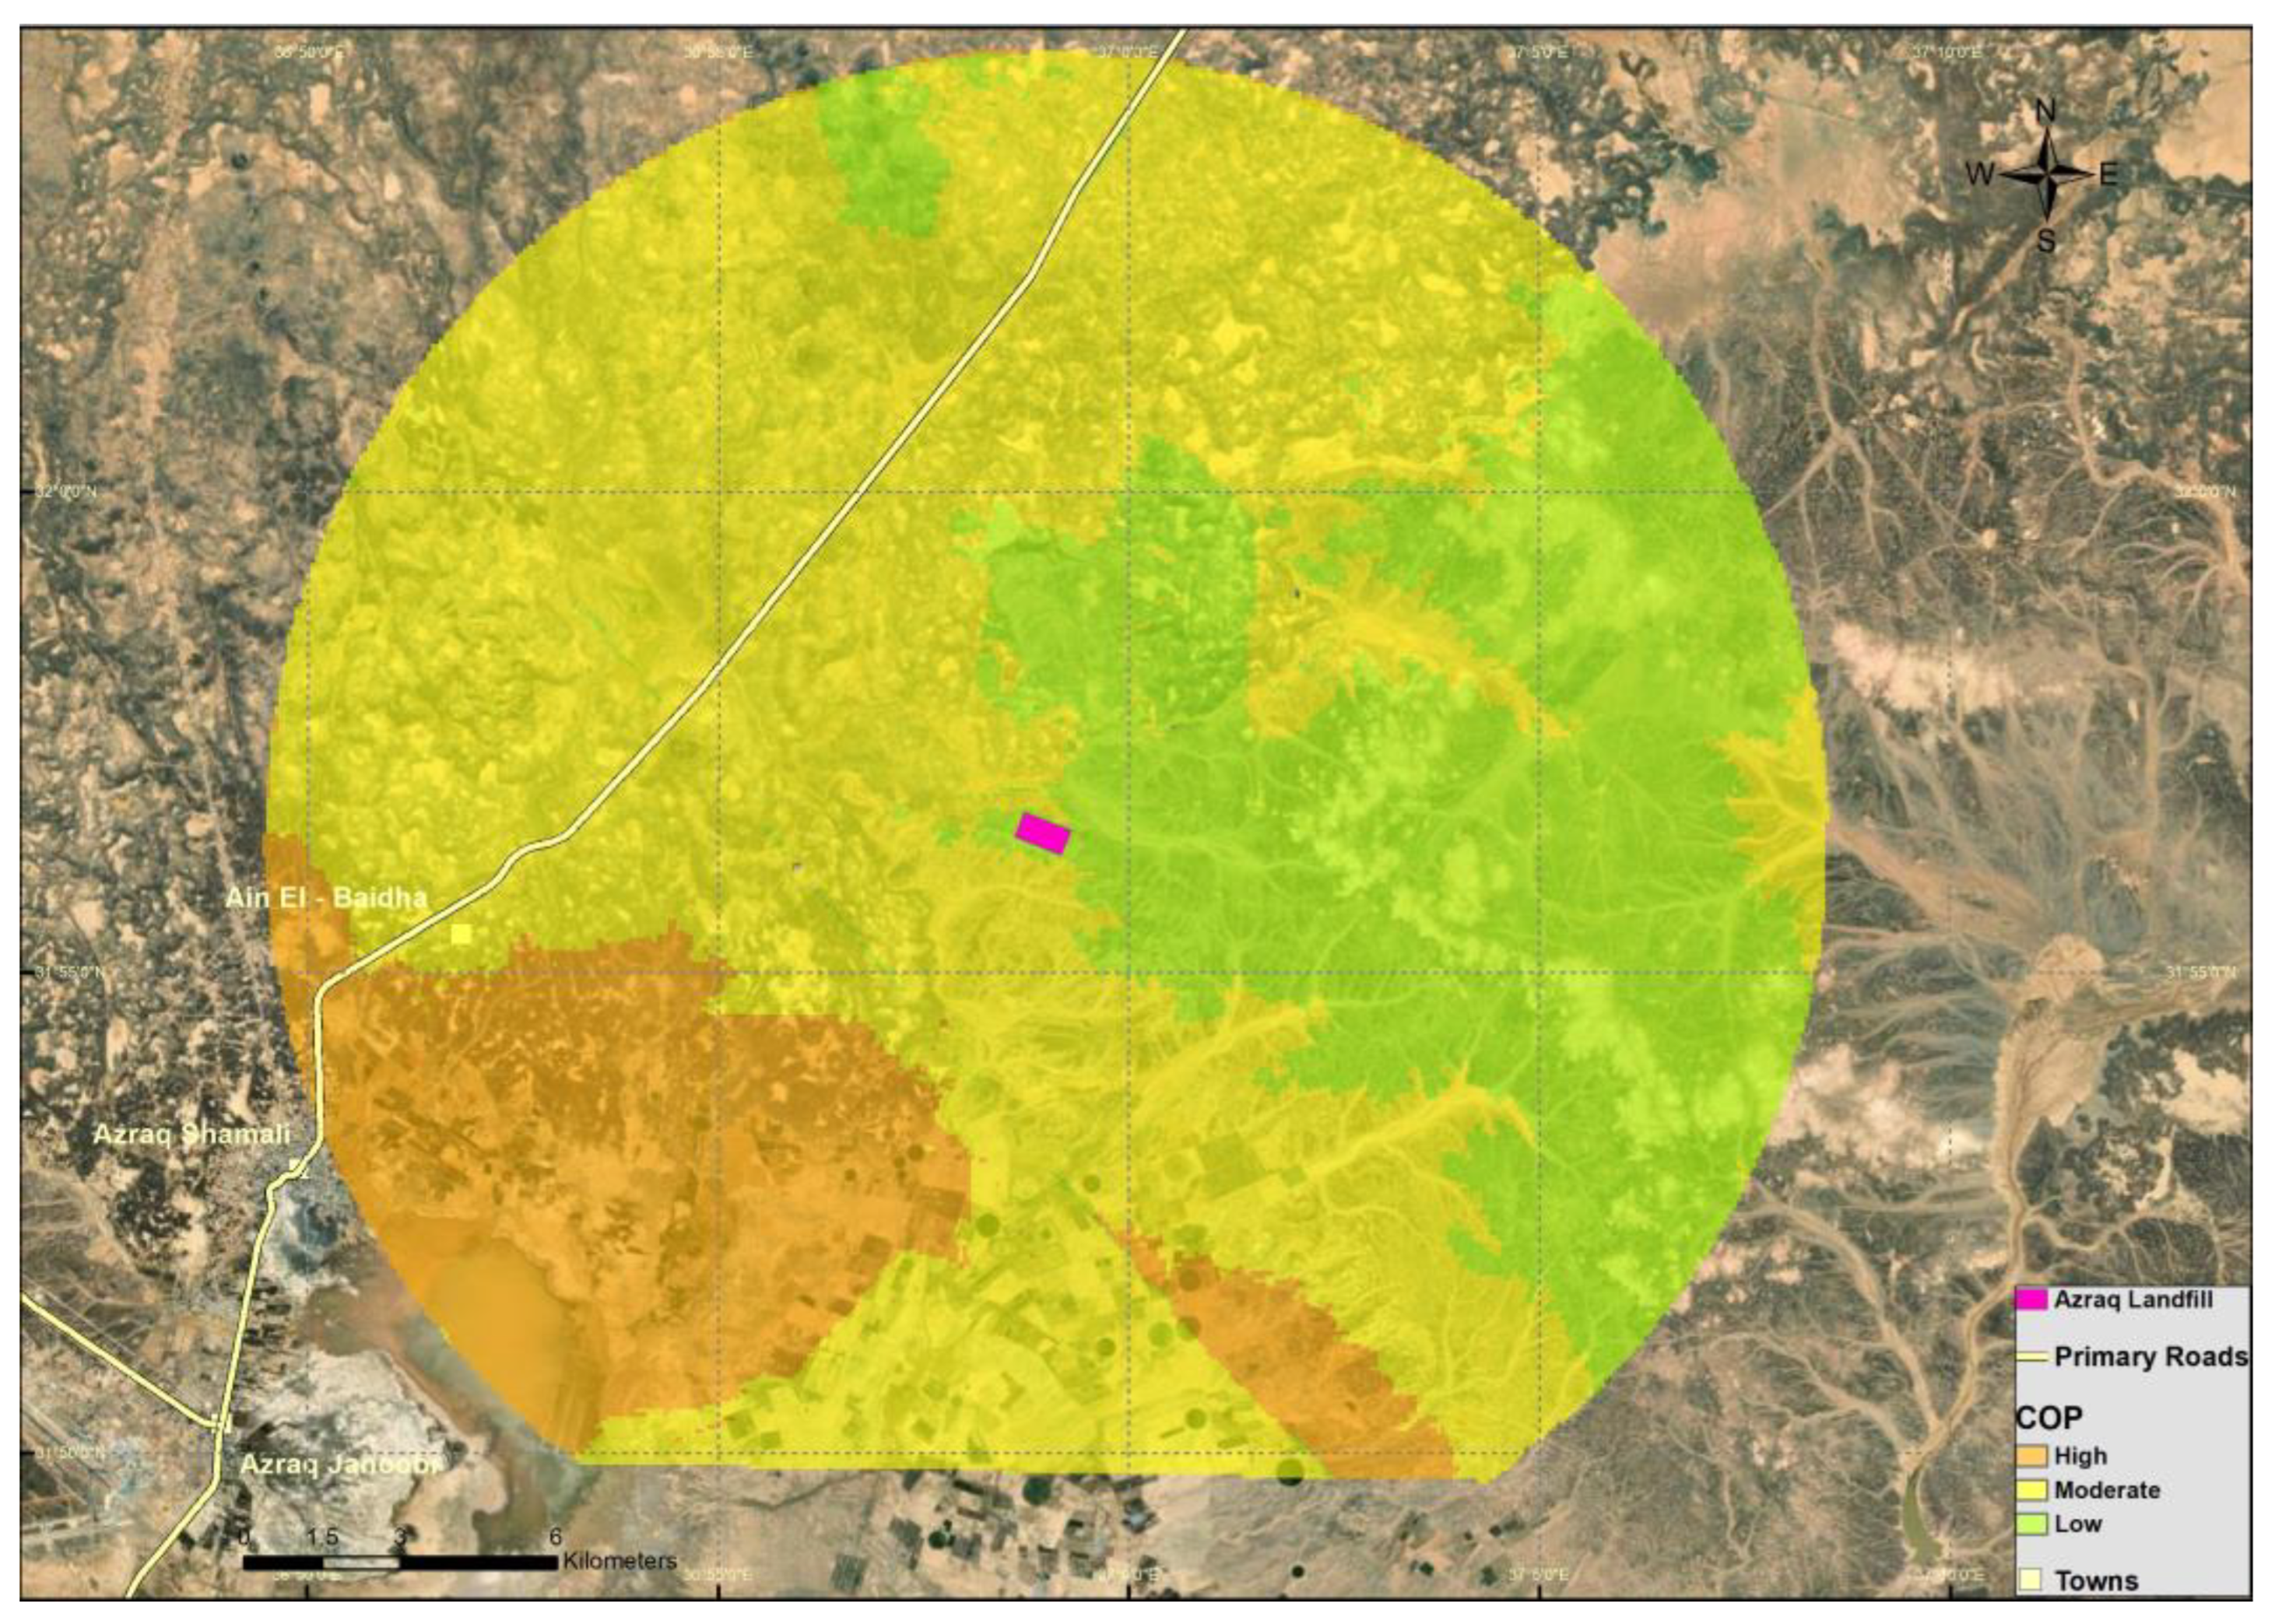
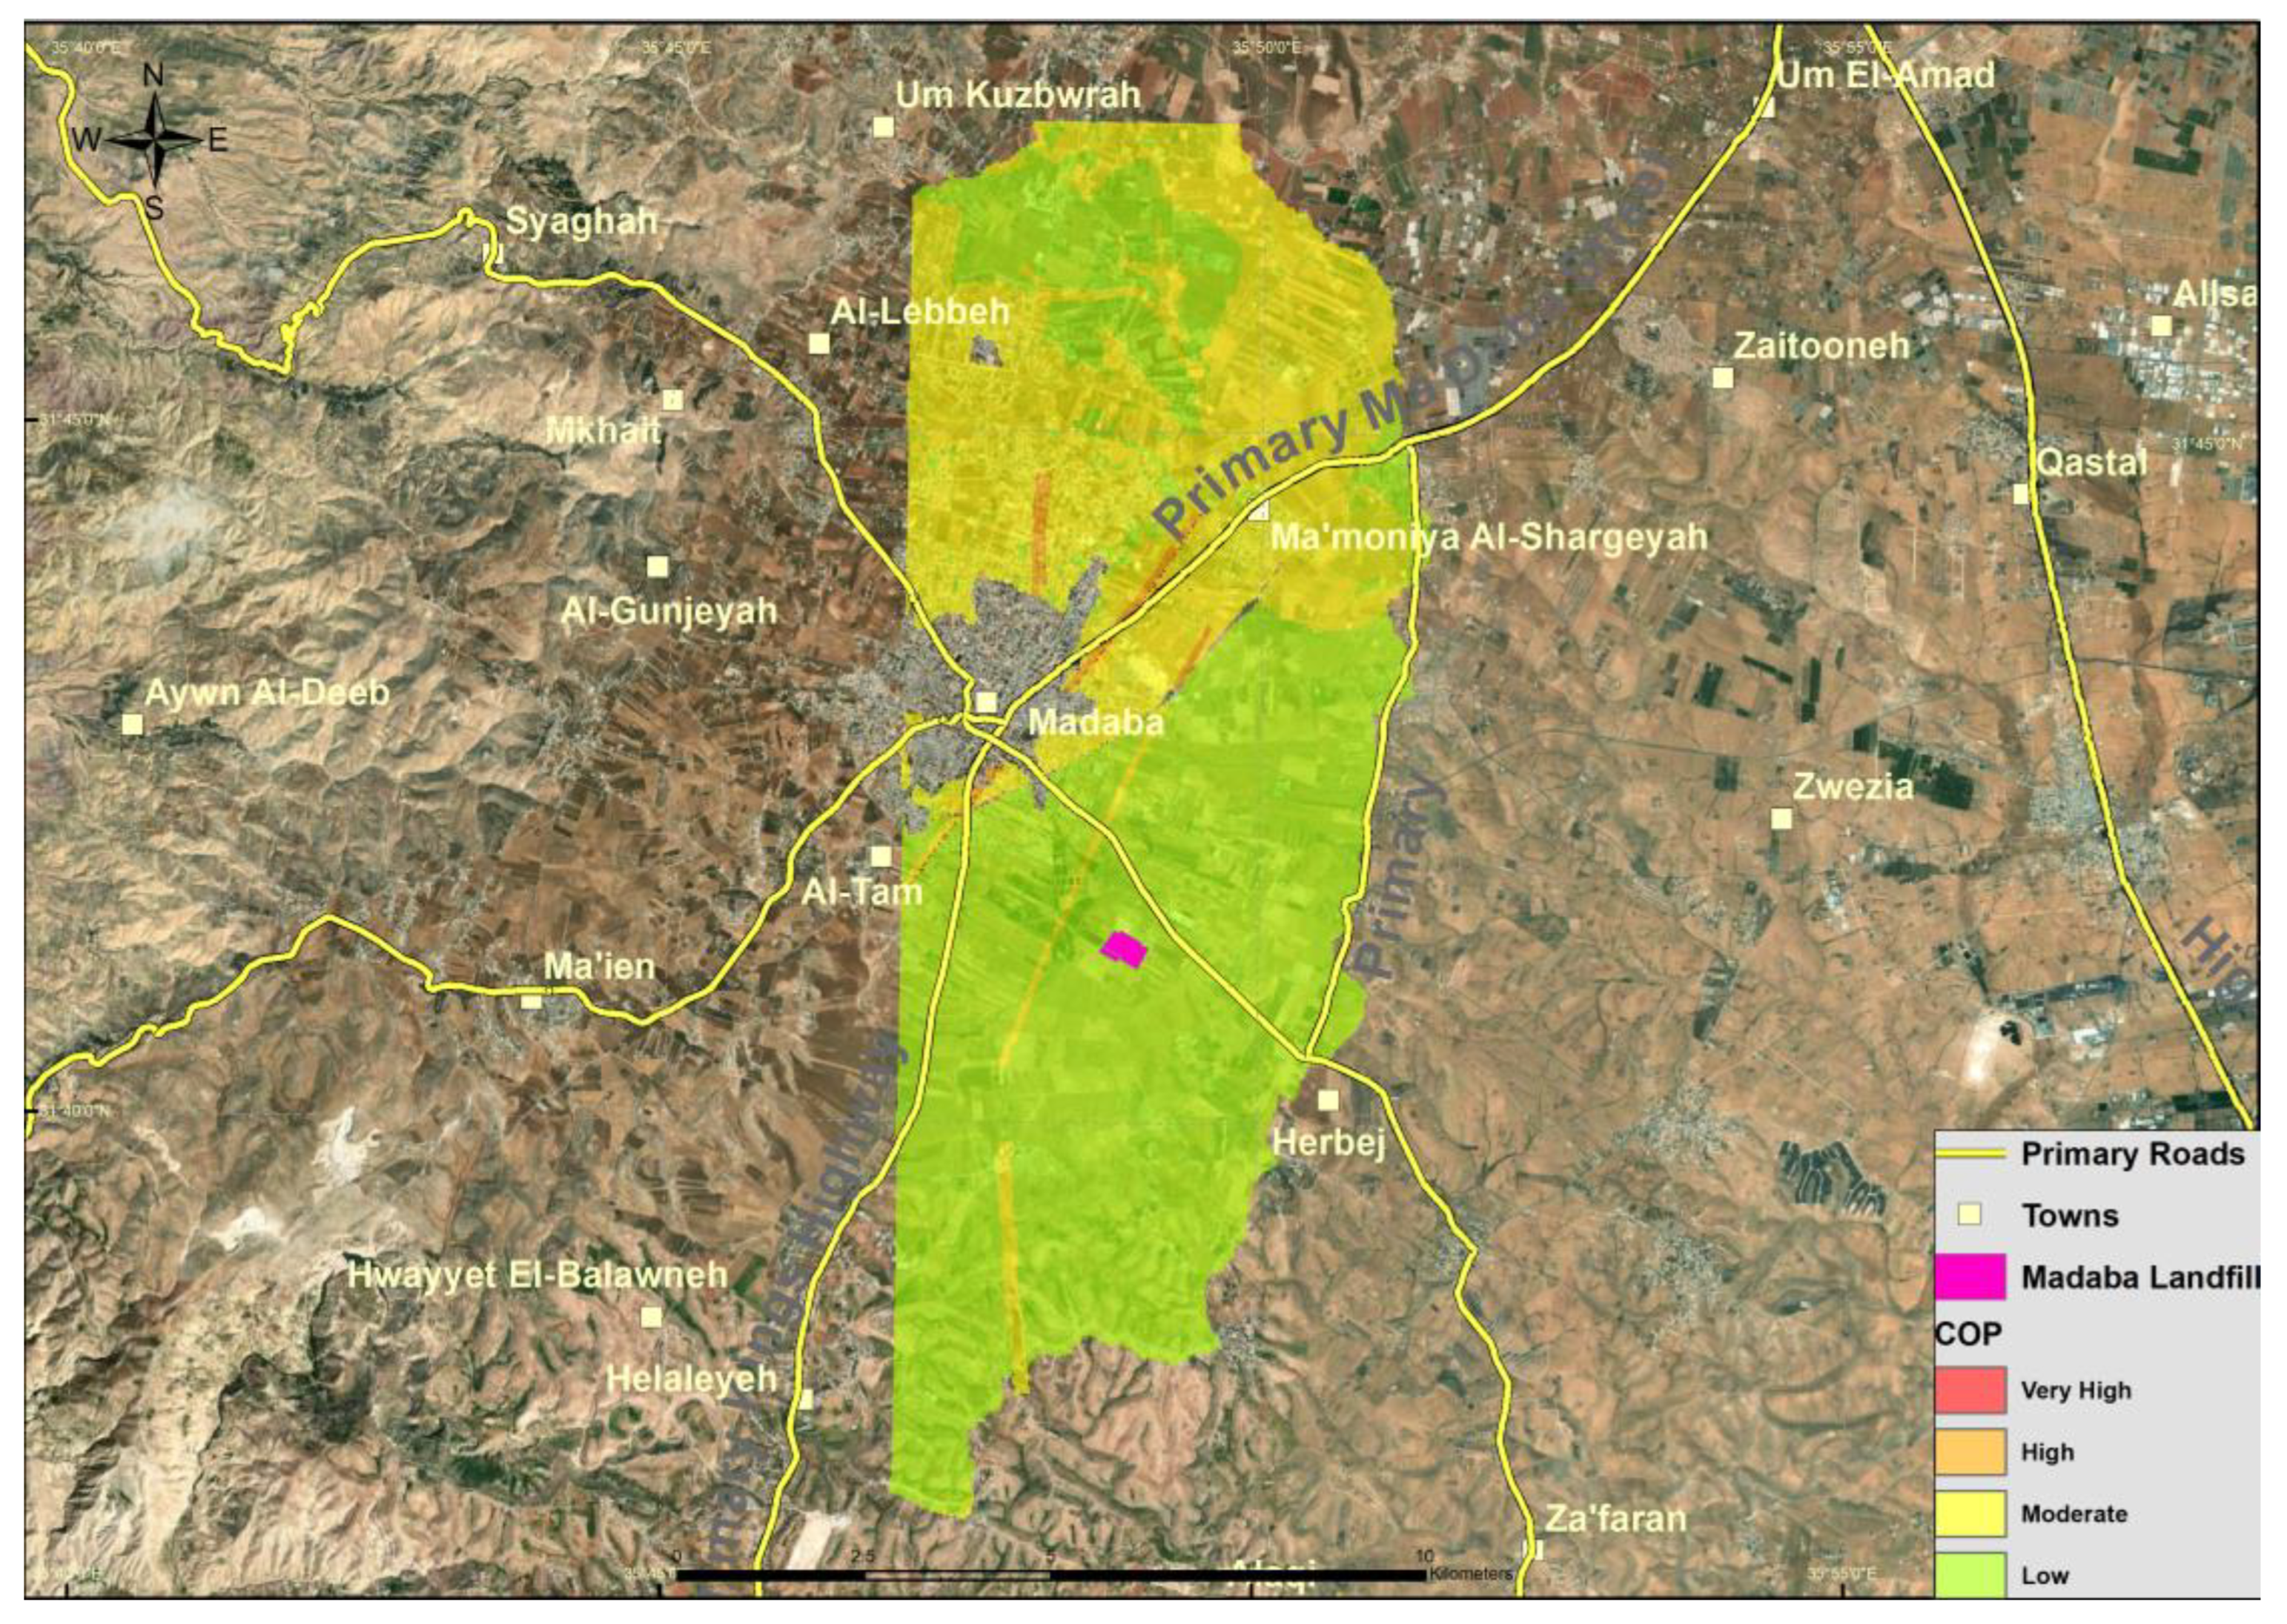
3.1. Developing the Vulnerability Maps Using COP Models
3.2. Developing the Peizometric Maps
3.3. Water Quality Monitoring
4. Conclusions
Author Contributions
Funding
Institutional Review Board Statement
Informed Consent Statement
Data Availability Statement
Conflicts of Interest
References
- Water Authority (WAJ). Jordan’s Water Budget 2019; Ministry of Water and Irrigation: Amman, Jordan, 2019.
- Ministry of Water and Irrigation. Jordan’s Water Strategy 2016–2025; Ministry of Water and Irrigation: Amman, Jordan, 2016.
- Jang, W.S.; Engel, B.; Harbor, J.; Theller, L. Aquifer Vulnerability Assessment for Sustainable Groundwater Management Using DRASTIC. Water 2017, 9, 792. [Google Scholar] [CrossRef] [Green Version]
- Nanda, S.; Berruti, F. Municipal solid waste management and landfilling technologies: A review. Environ. Chem. Lett. 2020, 19, 1433–1456. [Google Scholar] [CrossRef]
- Wijesekara, S.S.R.M.D.H.R.; Mayakaduwa, S.S.; Siriwardana, A.R.; de Silva, N.; Basnayake, B.F.A.; Kawamoto, K.; Vithanage, M. Fate and transport of pollutants through a municipal solid waste landfill leachate in Sri Lanka. Environ. Earth Sci. 2014, 72, 1707–1719. [Google Scholar] [CrossRef]
- Yu, X.; Sui, Q.; Lyu, S.; Zhao, W.; Cao, X.; Wang, J.; Yu, G. Do high levels of PPCPs in landfill leachates influence the water environment in the vicinity of landfills? A case study of the largest landfill in China. Environ. Int. 2020, 135, 105404. [Google Scholar] [CrossRef] [PubMed]
- Nagarajan, R.; Thirumalaisamy, S.; Lakshumanan, E. Impact of leachate on groundwater pollution due to non-engineered municipal solid waste landfill sites of erode city, Tamil Nadu, India. Iran. J. Environ. Health Sci. Eng. 2012, 9, 35. [Google Scholar] [CrossRef] [Green Version]
- Chonattu, J.; Prabhakar, K.; Pillai, H.P.S. Geospatial and Statistical Assessment of Groundwater Contamination Due to Landfill Leachate—A Case Study. J. Water Resour. Prot. 2016, 08, 121–134. [Google Scholar] [CrossRef] [Green Version]
- Manasrah, W.; Hilat, I.; El-Hasan, T. Heavy metal and anionic contamination in the water and sediments in Al-Mujib Reservoir, central Jordan. Environ. Earth Sci. 2010, 60, 613–621. [Google Scholar] [CrossRef]
- Rajeev, K.; Soman, S.; Renjith, V.; George, P. Human vulnerability mapping of chemical accidents in major industrial units in Kerala, India for better disaster mitigation. Int. J. Disaster Risk Reduct. 2019, 39, 101247. [Google Scholar] [CrossRef]
- Mavriou, Z.; Kazakis, N.; Pliakas, F.-K. Assessment of Groundwater Vulnerability in the North Aquifer Area of Rhodes Island Using the GALDIT Method and GIS. Environments 2019, 6, 56. [Google Scholar] [CrossRef] [Green Version]
- Saranya, T.; Saravanan, S. Evolution of a hybrid approach for groundwater vulnerability assessment using hierarchical fuzzy-DRASTIC models in the Cuddalore Region, India. Environ. Earth Sci. 2021, 80, 179. [Google Scholar] [CrossRef]
- Kazakis, N.; Voudouris, K.S. Groundwater vulnerability and pollution risk assessment of porous aquifers to nitrate: Modifying the DRASTIC method using quantitative parameters. J. Hydrol. 2015, 525, 13–25. [Google Scholar] [CrossRef]
- Neshat, A.; Pradhan, B. An integrated DRASTIC model using frequency ratio and two new hybrid methods for groundwater vulnerability assessment. Nat. Hazards 2015, 76, 543–563. [Google Scholar] [CrossRef] [Green Version]
- Vaezihir, A.; Tabarmayeh, M. Total vulnerability estimation for the Tabriz aquifer (Iran) by combining a new model with DRASTIC. Environ. Earth Sci. 2015, 74, 2949–2965. [Google Scholar] [CrossRef]
- Zghibi, A.; Merzougui, A.; Chenini, I.; Ergaieg, K.; Zouhri, L.; Tarhouni, J. Groundwater vulnerability analysis of Tunisian coastal aquifer: An application of DRASTIC index method in GIS environment. Groundw. Sustain. Dev. 2016, 2, 169–181. [Google Scholar] [CrossRef]
- Maria, R. Comparative studies of groundwater vulnerability assessment. IOP Conf. Series Earth Environ. Sci. 2018, 118, 012018. [Google Scholar] [CrossRef]
- Boualla, N.; Benziane, A.; Aït-Mokhtar, A. Assessing Vulnerability of Groundwater with GOD Model: A Case Study in Oran Sebkha Basin, Algeria. J. New Technol. Mater. 2017, 7, 18–26. [Google Scholar] [CrossRef]
- Vías, J.M.; Andreo, B.; Perles, M.J.; Carrasco, F.; Vadillo, I.; Jiménez, P. Proposed method for groundwater vulnerability mapping in carbonate (karstic) aquifers: The COP method. Hydrogeol. J. 2006, 14, 912–925. [Google Scholar] [CrossRef]
- Talozi, S. Drastic Vulnerability of Groundwater Aquifers in the Jordan River Valley Enhancing Water Education at the University Level in Jordan by Incorporating an Innovative Multi-Agent Modeling and Analysis Tool View Project; EcoPeace Middle East: Amman, Jordan, 2016. [Google Scholar] [CrossRef]
- Alraggad, M.; Al-Saleh, S.; Al-Amoush, H.; Jasem, A.H.; Isied, D. Vulnerability of Groundwater System in Central Jordan Valley/Pollution Indicators and Decontamination Process. J. Water Resour. Prot. 2012, 04, 133–139. [Google Scholar] [CrossRef] [Green Version]
- Al-Shatnawi, A.M.; Al-Shboul, R.; Al-Fawwaz, B.M.; Al-Sharafat, W.; Khalf, R.M.B. Vulnerability Assessment Using Raster Calculation and DRASTIC Model for the Jordan Valley Subsurface Basin (AB1) Imaging Maps. J. Geogr. Inf. Syst. 2014, 06, 585–593. [Google Scholar] [CrossRef]
- Al Kuisi, M.; Mashal, K.; Al-Qinna, M.; Abu Hamad, A.; Margana, A. Groundwater Vulnerability and Hazard Mapping in an Arid Region: Case Study, Amman-Zarqa Basin (AZB)-Jordan. J. Water Resour. Prot. 2014, 06, 297–318. [Google Scholar] [CrossRef] [Green Version]
- Ibrahim, M.; Koch, B. Assessment and Mapping of Groundwater Vulnerability Using SAR Concentrations and GIS: A Case Study in Al-Mafraq, Jordan. J. Water Resour. Prot. 2015, 07, 588–596. [Google Scholar] [CrossRef] [Green Version]
- Al-Tarazi, E.; Abu Rajab, J.; Al-Naqa, A.; El-Waheidi, M. Detecting leachate plumes and groundwater pollution at Ruseifa municipal landfill utilizing VLF-EM method. J. Appl. Geophys. 2008, 65, 121–131. [Google Scholar] [CrossRef]
- Al-Adamat, R.; Al-Harahsheh, S. The use of DRASTIC Index and Simple Matrix Techniques to Assess the Environmental Impact of Akaider Dumpsite Area/Jordan. Res. J. Environ. Earth Sci. 2014, 6, 500–509. [Google Scholar] [CrossRef]
- MWI (Ministry of Water and Irrigation); BGR (Bundesanstalt für Geowissenschaften und Rohstoffe). Groundwater Resource Assessment of Jordan 2017; MWI and BGR: Amman, Jordan, 2019.
- Abu-Rukah, Y.; Al-Kofahi, O. The assessment of the effect of landfill leachate on ground-water quality–A case study. El-Akader landfill site–North Jordan. J. Arid Environ. 2001, 49, 615–630. [Google Scholar] [CrossRef]
- Yaseen, I.A.A.B.; Al-Naeem, T.A. Assessment of Groundwater Pollution with Heavy Metals at the Al-Akaider Landfill Area, North Jordan. Res. J. Environ. Earth Sci. 2018, 10, 16–23. [Google Scholar] [CrossRef]


| Landfill | Governorate | Establishment Year | Area (Dunm) 1 Dunm = 1000 m2 | Type of Solid Waste Received by the Landfill | Annual Precipitation (mm/yr) | Area Geology | Flash Floods | Environmental Problems |
|---|---|---|---|---|---|---|---|---|
| Madaba | Madaba | 1992, expanded several times, the last was in 2014. | 140 | Municipal waste, dead animals (carcasses) and some spoiled food. Diseased carcasses as well as spoiled food are buried in separate halls than those that are used for municipal waste | 250–300 | Limestone | No flash floods | Fires during summer with no bad smells. No leachate or water pollution problems |
| Akaider | Irbid | 1982 | 800–1000 | Municipal waste, olive mills’ waste, and liquid sludge. It is used to receive different types of hazardous and liquid waste till the mid of 2015 | Less than 200 | Limestone (many layers with different hardness). Upper layers are mix of clay and sand | No flash floods | Bad smells and flies |
| Al-Husaineyat | Mafraq | 1987 | 380 | Municipal waste and dead animals (carcasses) | 160–300 | Basalt rocks and high-salinity sand. | Occasional flash floods occur | Bad smells, flies and fires due to high temperature. |
| Dair Alla | Balqa’a | 1998 | 350 | Municipal waste | Around 300 | Dispersed soil | No flash floods | Bad smells and fires due to high temperature. |
| Azraq | Zarqa | Officially launched in 2022 but it was used informally. | 200 | Municipal waste | Less than 200 | NA | Flash floods exist | A new landfill and it is being built to be a sanitary landfill. |
| Landfill | Decimal Degrees—Lat/Long | Degrees, Decimal Minutes—Lat/Long | Degrees, Minutes, Seconds—Lat/Long | UTM—Lat/Long | MGRS | Altitude (masl) |
|---|---|---|---|---|---|---|
| Dair Alla | 32.120642°, 35.562850° | 32°07.238′ N, 35°33.771′ E | 32°07′14.31″ N, 35°33′46.26″ E | 36S 741,792.68 mE 3,556,684.52 mN | 36SYA4179356685 | −280 |
| Akaider | 32.514244°, 36.109111° | 32°30.855′ N, 36°06.547′ E | 32°30′51.28″ N, 36°06′32.80″ E | 37S 228,426.10 mE 3,601,122.63 mN | 37SBS2842601123 | 670 |
| Al-Husaineyat | 32.256217°, 36.349556° | 32°15.373′ N, 36°20.973′ E | 32°15′22.38″ N, 36°20′58.40″ E | 37S 250,311.47 mE 3,571,919.58 mN | 37SBR5031171920 | 660 |
| Madaba | 31.688194°, 35.815253° | 31°41.292′ N, 35°48.915′ E | 31°41′17.50″ N, 35°48′54.91″ E | 36R 766,860.10 mE 3,509,320.88 mN | 36RYA6686009321 | 750 |
| Azraq | 31.940921°, 36.982643° | 31°56.455′ N, 36°58.959′ E | 31°56′27.32″ N, 36°58′57.51″ E | 37R 309,310.29 mE 3,535,663.74 mN | 37RCR0931035664 | 507 |
| Data | Type of Data | Data Source |
|---|---|---|
| Weather Stations | Point feature | MWI |
| Precipitation (mm/day) 2006–2016 | Excel Sheets | MWI |
| Topography/Slope | DEM Raster (30 m × 30 m) | ASTER tiles that are already mosaicked for all Jordan |
| Land use/Land cover | Satellites image from ArcGIS online | Esri, DigitalGlobe, GeoEye, Earthstar Geographics, CNES/Airbus DS, USDA, USGS, AeroGRID, IGN, and the GIS User Community |
| Soil Texture | Access database | RSS |
| Soil Thickness | Polygon feature | RSS |
| Lithology layer type | Polygon feature | MWI |
| Lithology layer elevation | Raster | MWI |
| Karstic feature | Absence | MWI & BGR |
| Groundwater monitoring wells | Point feature | MWI |
| [COP] Score | |
|---|---|
| COP Index = [C] × [O] × [P] | |
| XVI | |
| COP Index | Vulnerability Classes |
| (0–0.5] | Very high |
| (0.5–1] | High |
| (1–2] | Moderate |
| (2–4] | Low |
| (4–15] | Very low |
| Number of Well | Description | GARMIN GPS | Static Water Level (SWL)—Measured Manually by Using the Amescope Apparatus (Meters) | Upstream/Downstream of the Landfill | Distance from the Landfill (km) | ||
|---|---|---|---|---|---|---|---|
| Longitude (E) | Latitude (N) | Altitude (H) | |||||
| Madaba | |||||||
| CC1005 | Private Well/Production well | 35.82505 | 31.68775 | 774 | A grab sample was collected and analyzed on 22 March and 12 October 2017 | Upstream | 1 |
| CC1024 | Private Well/Production well | 35.79661 | 31.65909 | 716 | 220.915, where a grab sample was collected and analyzed on 22 March and 12 October 2017 | Downstream | 4 |
| Akaider | |||||||
| AD3025 | Production Well | 36.04656° | 32.55990° | 528 | A grab sample was collected and analyzed on 10 April and 8 October 2017 | Downstream | 8 |
| AD1121 | Production Well | 36.23585 | 32.45537 | 605 | A grab sample was collected and analyzed on 10 April and 8 October 2017 | Upstream | 14 |
| Al-Husaineyat | |||||||
| AL3004 | YWC’s Well/Production well | 36.43270° | 32.27504° | 729 | A grab sample was collected and analyzed on 12 April and 8 October 2017 | Upstream | 9 |
| AL3328 | Private Well/Production well | 36.22838° | 32.25175° | 659 | A grab sample was collected and analyzed on 12 April and 8 October 2017 | Downstream | 12 |
| Dair Alla | |||||||
| AB4771 | Production Well | 35.59435° | 32.12101° | −259 | A grab sample was collected and analyzed on 10 May 2017 | Downstream | 4 |
| AB3435 | Production Well | 35.62706° | 32.17323° | −200 | A grab sample was collected and analyzed on 10 May and 22 October 2017 | Upstream | 9 |
| Azraq | |||||||
| Azraq | Production well | 36.92769° | 31.87862° | 516 | A grab sample was collected and analyzed on 12 July 2017 | Downstream | 14 |
| Landfill Name | P FACTOR | C FACTOR | O FACTOR | ||||||||||
|---|---|---|---|---|---|---|---|---|---|---|---|---|---|
| P Score | Data Source | Scenario 2 | Surface Feature | Slope and Vegetation | Data Source | OS | OL | ||||||
| Texture | Data Source | Soil Thickness SS | Data Source | Lithology and Fraction | Data Source | Confining Condition | |||||||
| Akaidar | N.A INTER-POLATION IDW | RSS EXCEL SHEET | SCENARIO 2 | Non-karstic terrains/ absence | Calculate NDVI index (July/2013) between bands 4 and 5 from LanSat8 and apply the rules in table (XI) in Slope and NDVI Rasters around the Akaidar Landfill | Slope: DEM 30 M Vegetation cover: LanSat 8 Satallites image | N.A INTER-POLATION IDW | RSS | RSS EXCEL SHEET | RSS SHAPE FILE | A7B2, B3, B45, Basalt | RSS RASTER | UNCONFINED |
| Al-Huseinyat | N.A INTER-POLATION IDW | RSS EXCEL SHEET | SCENARIO 2 | Scarcely developed or dissolution features/ fissured karst | Calculate NDVI index (July/2013) between bands 4 and 5 from LanSat8 and apply the rules in table (XI) in Slope and NDVI Rasters around the Huseinyat Landfill | Slope: DEM 30 M Vegetation cover: LanSat 8 Satallites image | N.A INTER-POLATION IDW | RSS | RSS EXCEL SHEET | RSS SHAPE FILE | A7B2, Basalt | RSS RASTER | UNCONFINED |
| Dair Alla | N.A INTER-POLATION IDW | RSS EXCEL SHEET | SCENARIO 2 | Non-karstic terrains/ absence | Calculate NDVI index (July/2013) between bands 4 and 5 from LanSat8 and apply the rules in table (XI) in Slope and NDVI Rasters around the DairAllah Landfill | Slope: DEM 30 M Vegetation cover: LanSat 8 Satallites image | N.A INTER-POLATION IDW | RSS | <0.5 M | NO DATA | A7B2 | NO DATA | UNCONFINED |
| Madaba | N.A INTER-POLATION IDW | RSS EXCEL SHEET | SCENARIO 2 | Scarcely developed or dissolution features/ fissured karst | Calculate NDVI index (July/2013) between bands 4 and 5 from LanSat8 and apply the rules in table (XI) in Slope and NDVI Rasters around the Madaba Landfill | Slope: DEM 30 M Vegetation cover: LanSat 8 Satallites image | N.A INTER-POLATION IDW | RSS | RSS EXCEL SHEET | RSS SHAPE FILE | A7B2, B3 | RSS RASTER | UNCONFINED |
| Azraq | P = 1 | NO DATA | SCENARIO 2 | Non-karstic terrains/ absence | Calculate NDVI index (July/2013) between bands 4 and 5 from LanSat8 and apply the rules in table (XI) in Slope and NDVI Rasters around the Azraq Landfill | Slope: DEM 30 M Vegetation cover: LanSat 8 Satallites image | SANDY = 0 | NO DATA | <0.5 M | NO DATA | B45, Basalt | RSS RASTER | UNCONFINED |
| Number of Well | Description | Leica Viva GNSS GPS–Cassini | GARMIN GPS | masl (Altitude-SWL)—Ground Level | Static Water Level (SWL)—Measured Manually by Using the Amescope Apparatus (Meters) | Distance from the Landfill (km) | ||||
|---|---|---|---|---|---|---|---|---|---|---|
| Longitude (E) | Latitude (N) | Altitude (H) | Longitude (E) | Latitude (N) | Altitude (H) | |||||
| Madaba | ||||||||||
| CC1015 | Monitoring Well | 226,823.17362 | 1,123,738.1582 | 736.2081 | NA | NA | NA | 513.4381 | 222.77 | NA |
| CC1014 | Monitoring Well | 226,515.3585 | 1,122,478.9360 | 725.5813 | 35.80632° | 31.69333° | 723 | 524.5413 | 201.04 | 1 |
| Akaider | ||||||||||
| AD3028 | Monitoring Well | 242,814.0343 | 1,222,327.8497 | 490.6215 | 35.98581° | 32.59282° | 487 | 456.1415 | 34.48 | 14.5 |
| AD1301 | Monitoring Well | 243,960.8035 | 1,220,994.7877 | 482.3284 | 35.99796° | 32.58074° | 488 | 183.3284 | 299 | 12.8 |
| AD3272 | Monitoring Well | 259,408.5153 | 1,212,135.826 | 620.8219 | 36.16149° | 32.50001° | 622 | 325.8219 | 295 | 5.2 |
| AD3275 | Monitoring Well | 264,301.6145 | 1,204,057.3586 | 620.5813 | 36.21253° | 32.42657° | 626 | 429.5313 | 191.05 | 13.8 |
| AD1120 | Monitoring Well | 264,924.8818 | 1,205,519.5843 | 613.2834 | 36.21950° | 32.43956° | 620 | 436.9934 | 176.29 | 13.3 |
| Al-Husaineyat | ||||||||||
| AL1926 | Monitoring Well | 276,628.3473 | 1,174,874.7456 | 600.8653 | 36.34066° | 32.16225° | 607 | 491.6953 | 109.17 | 10.5 |
| AL3522 | Monitoring Well | 270,534.9639 | 1,185,597.3328 | 647.9349 | 36.27719° | 32.25951° | 649 | 450.5949 | 197.34 | 6.8 |
| AL3361 | Monitoring Well | 287,662.9688 | 1,186,481.7577 | 748.9591 | 36.45907° | 32.26580° | 757 | 472.6571 | 276.302 | 10.4 |
| Dair Alla | ||||||||||
| AL3568 | Monitoring Well | 207,552.438 | 1,171,511.626 | −257.311 | 35.60817° | 32.13637° | −240 | 13.5 cmasl | 11.96 | 4.6 |
| AL3785 | Monitoring Well | 210,473.936 | 1,176,250.929 | −178.825 | 35.63938° | 32.17899° | −168 | 84.67 cmasl | 84.89 | 9.7 |
| AD1170 | Monitoring Well | 208,207.756 | 1,177,043.455 | −239.754 | 35.61536° | 32.18625° | −249 | 18.93 cmasl | 17.70 | 8.8 |
| Azraq | ||||||||||
| F1014 | Monitoring Well | 330,406.7973 | 1,141,366.7123 | 528.9169 | 36.90419° | 31.85089° | 508 | 498.3469 | 30.57 | 12.4 |
| F1060 | Monitoring Well | NA | NA | NA | 36.97376° | 31.83974° | 520 | NA | NA | 11.3 |
| F1280 | Monitoring Well | 323,838.4212 | 1,148,207.1597 | 511.6086 | 36.83588° | 31.1339° | 515 | 487.4786 | 24.13 | 90.5 |
| Parameter | Unit | Jordanian Standard for Drinking Water No. 286/2015- Allowable Limit | Sampling Date/Sample Code/Result | Test Method No. and Date | ||||||||
|---|---|---|---|---|---|---|---|---|---|---|---|---|
| AlHoseinyat | Madaba | Akaider | Deir Alla | Azraq | ||||||||
| 12/04/2017 | 22/03/2017 | 10/04/2017 | 10/05/2017 | 12/07/2017 | ||||||||
| AL3004 | AL3328 | CC1005 | CC1024 | AD1121 | AD3025 | AB4771 | AB3435 | Azraq1 | ||||
| Physical and Chemical Analyses | ||||||||||||
| pH | SU | 6.5–8.5 | 7.84 | 7.79 | 7.39 | 7.32 | 8.18 | 7.85 | 6.90 | 6.90 | 7.59 | 4500—H+, B, 2011 * |
| Alkalinity | mg/L | --- | 115 | 201 | 283 | 241 | 134 | 234 | 462 | 409 | 128 | 2320—B, 2011 * |
| EC @ 25 °C | µs/cm | --- | 594 | 1070 | 1532 | 1415 | 719 | 786 | 4740 | 7840 | 1895 | 2510—B, 2011 * |
| BOD5 | mg/L | --- | <2 | <2 | 2.07 | 2.16 | <2 | 2.0 | 5.93 | 7.74 | <2 | 5210—B, 2011 * |
| COD | mg/L | --- | 11.3 | 5.5 | 6.4 | 6.9 | <5 | 7.6 | 12.6 | 19.8 | <5 | 5220—B, 2011 * |
| Cl | mg/L | ≤500 | 79.9 | 173 | 216 | 146 | 103 | 98.3 | 902 | 1856 | 397 | 4500—Cl, D, 2011 * |
| TKN | mg/L | --- | <4.5 | <4.5 | <4.5 | <4.5 | <4.5 | <4.5 | <4.5 | <4.5 | <4.5 | 4500 –Norg, B, 2011 * |
| NH4 | mg/L | ≤0.2 | 0.234 | 0.105 | <4.5 | <4.5 | 0.097 | <0.08 | 0.164 | 0.101 | <0.08 | ASTM D 1426-15 |
| NO2-N | mg/L | ≤0.913 | 0.006 | <0.001 | <0.001 | <0.001 | <0.001 | <0.001 | 0.074 | <0.001 | <0.001 | 4500—NO2, B, 2011 * |
| NO3-N | mg/L | ≤11.3 | 1.00 | 8.26 | 0.697 | <0.226 | 1.12 | <0.226 | 32.4 | 16.9 | 1.07 | 4110—B, 2011 * |
| SO4 | mg/L | ≤500 | 42.5 | 42.3 | 236 | 315 | 53.6 | 30.9 | 518 | 1056 | 165 | 4110—B, 2011 * |
| Phenol | mg/L | --- | <0.002 | <0.002 | 0.062 | 0.026 | <0.002 | <0.002 | <0.002 | <0.002 | 0.005 | 5530—C, 2011 * |
| Na | mg/L | ≤200 ** | 68.4 | 70.5 | 94 | 73 | 88.7 | 57.8 | 577 | 1064 | 198.8 | 3111—B, 2011 * |
| Mn | mg/L | ≤0.4 | <0.05 | <0.05 | 0.06 | 0.05 | <0.05 | <0.05 | <0.05 | <0.05 | <0.05 | 3120—B, 2011 * |
| Fe | mg/L | ≤1.0 | <0.1 | <0.1 | 1.8 | 1.1 | <0.1 | <0.1 | 0.7 | <0.1 | <0.1 | 3120—B, 2011 * |
| As | mg/L | ≤0.01 | <0.01 | <0.01 | <0.05 | <0.05 | <0.01 | <0.01 | <0.1 | <0.1 | <0.05 | 3120—B, 2011 * |
| Ba | mg/L | ≤1.0 | <0.2 | <0.2 | 0.22 | 0.21 | <0.2 | <0.2 | <0.2 | <0.2 | <0.1 | 3120—B, 2011 * |
| Cd | mg/L | ≤0.003 | <0.005 | <0.005 | <0.01 | <0.01 | <0.005 | <0.005 | <0.005 | <0.005 | <0.01 | 3120—B, 2011 * |
| Cr | mg/L | ≤0.05 | <0.02 | <0.02 | <0.02 | <0.02 | <0.02 | <0.02 | <0.02 | <0.02 | <0.02 | 3120—B, 2011 * |
| Hg | mg/L | ≤0.006 | <0.001 | <0.001 | <0.001 | <0.001 | <0.001 | <0.001 | <0.001 | <0.001 | <0.001 | 3112—B, 2011 * |
| Pb | mg/L | ≤0.01 | <0.01 | <0.01 | <0.05 | <0.05 | <0.01 | <0.01 | <0.05 | <0.05 | <0.05 | 3120—B, 2011 * |
| Se | mg/L | ≤0.04 | <0.01 | <0.01 | <0.1 | <0.1 | 0.015 | <0.01 | <0.1 | <0.1 | <0.05 | 3120—B, 2011 * |
| Microbiological Analyses | ||||||||||||
| TCC | MPN/100 mL | <1.1 | 1.1 | <1.1 | <1.1 | 13 | <1.1 | <1.1 | 140 | <1.1 | 23 | 9221—BC, 2006 * |
| TTCC | MPN/100 mL | <1.1 | <1.1 | <1.1 | <1.1 | 2 | <1.1 | <1.1 | 2 | <1.1 | <1.8 | 9221—EC, 2006 * |
| VOCs Analyses | ||||||||||||
| Benzene | µg/L | ≤10 | <10 | <10 | <10 | <10 | <10 | <10 | <10 | <10 | <10 | SOP 17/01/01/01-23 Issue (1) |
| Tetrachloroethylene (PCE) | µg/L | ≤40 | <10.53 | <10.53 | <10.53 | <10.53 | <10.53 | <10.53 | <10.53 | <10.53 | <10.53 | SOP 17/01/01/01-23 Issue (1) |
| Trichloroethylene (TCE) | µg/L | ≤20 | <12.95 | <12.95 | <12.95 | <12.95 | <12.95 | <12.95 | <12.95 | <12.95 | <12.95 | SOP 17/01/01/01-23 Issue (1) |
| Ethylbenzene | µg/L | ≤300 | <8.25 | <8.25 | <8.25 | <8.25 | <8.25 | <8.25 | <8.25 | <8.25 | <8.25 | SOP 17/01/01/01-23 Issue (1) |
| Total Xylene | µg/L | ≤500 | <15.32 | <15.32 | <15.32 | <15.32 | <15.32 | <15.32 | <15.32 | <15.32 | <15.32 | SOP 17/01/01/01-23 Issue (1) |
| Toluene | µg/L | ≤700 | <8.35 | <8.35 | <8.35 | <8.35 | <8.35 | <8.35 | <8.35 | <8.35 | <8.35 | SOP 17/01/01/01-23 Issue (1) |
| PAHs Analyses | ||||||||||||
| Acenaphytlene | µg/L | --- | <0.04 | <0.04 | X | X | <0.04 | <0.04 | <0.04 | <0.04 | <0.04 | 6410-B, 2011 * |
| Flourene | µg/L | --- | <0.07 | <0.07 | X | X | <0.07 | <0.07 | <0.07 | <0.07 | <0.07 | 6410-B, 2011 * |
| Phenanthrene | µg/L | --- | <0.07 | <0.07 | X | X | <0.07 | <0.07 | <0.07 | <0.07 | <0.07 | 6410-B, 2011 * |
| Anthracene | µg/L | --- | <0.06 | <0.06 | X | X | <0.06 | <0.06 | <0.06 | <0.06 | <0.06 | 6410-B, 2011 * |
| Pyrene | µg/L | --- | <0.2 | <0.2 | X | X | <0.2 | <0.2 | <0.2 | <0.2 | <0.2 | 6410-B, 2011 * |
| Benzo (a) anthracene | µg/L | --- | <0.3 | <0.3 | X | X | <0.3 | <0.3 | <0.3 | <0.3 | <0.3 | 6410-B, 2011 * |
| Chrycene | µg/L | --- | <0.3 | <0.3 | X | X | <0.3 | <0.3 | <0.3 | <0.3 | <0.3 | 6410-B, 2011 * |
| Benzo (b) flurene | µg/L | --- | <0.35 | <0.35 | X | X | <0.35 | <0.35 | <0.35 | <0.35 | <0.35 | 6410-B, 2011 * |
| Benzo (k) flurene | µg/L | --- | <0.35 | <0.35 | X | X | <0.35 | <0.35 | <0.35 | <0.35 | <0.35 | 6410-B, 2011 * |
| Benzo (a) pyrene | µg/L | --- | <0.6 | <0.6 | X | X | <0.6 | <0.6 | <0.6 | <0.6 | <0.6 | 6410-B, 2011 * |
| Indeno (1,2,3cd) pyrene | µg/L | --- | <1.1 | <1.1 | X | X | <1.1 | <1.1 | <1.1 | <1.1 | <1.1 | 6410-B, 2011 * |
| Dibenzo (a,h) anthracene | µg/L | --- | <1.3 | <1.3 | X | X | <1.3 | <1.3 | <1.3 | <1.3 | <1.3 | 6410-B, 2011 * |
| Benzo (g,h,I) pyrene | µg/L | --- | <1.3 | <1.3 | X | X | <1.3 | <1.3 | <1.3 | <1.3 | <1.3 | 6410-B, 2011 * |
| Parameter | Unit | Jordanian Standard for Drinking Water No. 286/2015- Allowable Limit | Sampling Date/Sample Code/Result | Test Method No. and Date | |||||||
|---|---|---|---|---|---|---|---|---|---|---|---|
| AlHoseinyat | Madaba | Akaider | Deir Alla | ||||||||
| 08/10/2017 | 12/10/2017 | 08/10/2017 | 22/10/2017 | ||||||||
| AL3004 | AL3328 | CC1005 | CC1024 | AD1121 | AD3025 | Abu Za’atar Farm | AB3435 | ||||
| Physical and Chemical Analyses | |||||||||||
| pH | SU | 6.5-8.5 | 7.93 | 7.43 | 7.02 | 7.31 | 8.65 | 7.17 | 7.14 | 7.04 | 4500—H+, B, 2011 * |
| Alkalinity | mg/L | --- | 113 | 194 | 286 | 225 | 77.2 | 222 | 214 | 802 | 2320—B, 2011 * |
| EC @ 25 °C | s/cmµ | --- | 563 | 1063 | 1635 | 1395 | 598 | 804 | 5430 | 8020 | 2510—B, 2011 * |
| BOD5 | mg/L | --- | 2.48 | 2.48 | 2.40 | <2 | 2.33 | 2.07 | <2 | 2.59 | 5210—B, 2011 * |
| COD | mg/L | --- | <5 | <5 | <5.0 | <5.0 | <5 | <5 | 59 | 54 | 5220—B, 2011 * |
| Cl | mg/L | ≤500 | 68.9 | 165 | 217 | 143 | 107 | 97.5 | 1409 | 1818 | 4500—Cl, D, 2011 * |
| TKN | mg/L | --- | <4.5 | <4.5 | <4.5 | <4.5 | <4.5 | <4.5 | <4.5 | <4.5 | 4500 –Norg, B, 2011 * |
| NH4 | mg/L | ≤0.2 | <0.08 | <0.08 | <4.5 | <4.5 | 0.489 | <0.08 | <4.5 | <4.5 | ASTM D 1426-15 & 4500 NH3, B & C, 2011 * |
| NO2 - N | mg/L | ≤0.913 | 0.004 | <0.001 | <0.001 | 0.009 | 0.002 | <0.001 | <0.001 | <0.001 | 4500—NO2, B, 2011 * |
| NO3 - N | mg/L | ≤11.3 | 1.07 | 8.88 | <0.226 | <0.226 | <0.226 | <0.226 | 18.4 | 17.0 | 4110—B, 2011 * |
| SO4 | mg/L | ≤500 | 41.8 | 46.6 | 254 | 299 | 39.0 | 33.7 | 291 | 1167 | 4110—B, 2011 * |
| Phenol | mg/L | --- | 0.006 | 0.006 | 0.003 | 0.006 | 0.004 | 0.002 | 0.009 | 0.004 | 5530—C, 2011 * |
| Na | mg/L | ≤200 ** | 67.3 | 74.2 | 87.9 | 69.3 | 95.5 | 60.9 | 519 | 988 | 3111—B, 2011 * |
| Mn | mg/L | ≤0.4 | <0.05 | <0.05 | <0.05 | <0.05 | <0.05 | <0.05 | <0.05 | <0.05 | 3111—B, 2011 * |
| Fe | mg/L | ≤1.0 | 0.12 | 0.25 | 4.83 | 0.51 | 0.45 | <0.1 | <0.1 | <0.1 | 3111—B, 2011 * |
| As | mg/L | ≤0.01 | <0.05 | <0.05 | <0.05 | <0.05 | <0.05 | <0.05 | <0.05 | <0.05 | 3120—B, 2011 * |
| Ba | mg/L | ≤1.0 | <0.2 | <0.2 | <0.2 | <0.2 | <0.2 | <0.2 | <0.2 | <0.2 | 3120—B, 2011 * |
| Cd | mg/L | ≤0.003 | <0.01 | <0.01 | <0.01 | <0.01 | <0.01 | <0.01 | <0.01 | <0.01 | 3120—B, 2011 * |
| Cr | mg/L | ≤0.05 | <0.02 | <0.02 | <0.02 | <0.02 | <0.02 | <0.02 | <0.02 | <0.02 | 3120—B, 2011 * |
| Hg | mg/L | ≤0.006 | <0.001 | <0.001 | <0.001 | <0.001 | <0.001 | <0.001 | <0.001 | <0.001 | 3112—B, 2011 * |
| Pb | mg/L | ≤0.01 | <0.05 | <0.05 | <0.05 | <0.05 | <0.05 | <0.05 | <0.05 | <0.05 | 3120—B, 2011 * |
| Se | mg/L | ≤0.04 | <0.05 | <0.05 | <0.05 | <0.05 | <0.05 | <0.05 | <0.05 | <0.05 | 3120—B, 2011 * |
| Microbiological Analyses | |||||||||||
| TCC | MPN/100mL | <1.1 | <1.1 | <1.1 | 79 | 4.5 | <1.1 | <1.1 | 2.0 | <1.8 *** | 9221—BC, 2006* |
| TTCC | MPN/100mL | <1.1 | <1.1 | <1.1 | <1.8 *** | 4.5 | <1.1 | <1.1 | 2.0 | <1.8 *** | 9221—EC, 2006* |
| VOCs Analyses | |||||||||||
| Benzene | µg/L | ≤10 | <10 | <10 | <10 | <10 | <10 | <10 | <10 | <10 | SOP 17/01/01/01-23 Issue (1) |
| Tetrachloroethylene (PCE) | µg/L | ≤40 | <10.53 | <10.53 | <10.53 | <10.53 | <10.53 | <10.53 | <10.53 | <10.53 | SOP 17/01/01/01-23 Issue (1) |
| Trichloroethylene (TCE) | µg/L | ≤20 | <12.95 | <12.95 | <12.95 | <12.95 | <12.95 | <12.95 | <12.95 | <12.95 | SOP 17/01/01/01-23 Issue (1) |
| Ethylbenzene | µg/L | ≤300 | <8.25 | <8.25 | <8.25 | <8.25 | <8.25 | <8.25 | <8.25 | <8.25 | SOP 17/01/01/01-23 Issue (1) |
| Total Xylene | µg/L | ≤500 | <15.32 | <15.32 | <15.32 | <15.32 | <15.32 | <15.32 | <15.32 | <15.32 | SOP 17/01/01/01-23 Issue (1) |
| Toluene | µg/L | ≤700 | <8.35 | <8.35 | <8.35 | <8.35 | <8.35 | <8.35 | <8.35 | <8.35 | SOP 17/01/01/01-23 Issue (1) |
| PAHs Analyses | |||||||||||
| Acenaphytlene | µg/L | --- | <0.04 | <0.04 | <0.04 | <0.04 | <0.04 | <0.04 | <0.04 | <0.04 | 6410-B, 2011 * |
| Flourene | µg/L | --- | <0.07 | <0.07 | <0.07 | <0.07 | <0.07 | <0.07 | <0.07 | <0.07 | 6410-B, 2011 * |
| Phenanthrene | µg/L | --- | <0.07 | <0.07 | <0.07 | <0.07 | <0.07 | <0.07 | <0.07 | <0.07 | 6410-B, 2011 * |
| Anthracene | µg/L | --- | <0.06 | <0.06 | <0.06 | <0.06 | <0.06 | <0.06 | <0.06 | <0.06 | 6410-B, 2011 * |
| Pyrene | µg/L | --- | <0.2 | <0.2 | <0.2 | <0.2 | <0.2 | <0.2 | <0.2 | <0.2 | 6410-B, 2011 * |
| Benzo (a) anthracene | µg/L | --- | <0.3 | <0.3 | <0.3 | <0.3 | <0.3 | <0.3 | <0.3 | <0.3 | 6410-B, 2011 * |
| Chrycene | µg/L | --- | <0.3 | <0.3 | <0.3 | <0.3 | <0.3 | <0.3 | <0.3 | <0.3 | 6410-B, 2011 * |
| Benzo (b) flurene | µg/L | --- | <0.35 | <0.35 | <0.35 | <0.35 | <0.35 | <0.35 | <0.35 | <0.35 | 6410-B, 2011 * |
| Benzo (k) flurene | µg/L | --- | <0.35 | <0.35 | <0.35 | <0.35 | <0.35 | <0.35 | <0.35 | <0.35 | 6410-B, 2011 * |
| Benzo (a) pyrene | µg/L | --- | <0.6 | <0.6 | <0.6 | <0.6 | <0.6 | <0.6 | <0.6 | <0.6 | 6410-B, 2011 * |
| Indeno (1,2,3cd) pyrene | µg/L | --- | <1.1 | <1.1 | <1.1 | <1.1 | <1.1 | <1.1 | <1.1 | <1.1 | 6410-B, 2011 * |
| Dibenzo (a,h) anthracene | µg/L | --- | <1.3 | <1.3 | <1.3 | <1.3 | <1.3 | <1.3 | <1.3 | <1.3 | 6410-B, 2011 * |
| Benzo (g, h, I) pyrene | µg/L | --- | <1.3 | <1.3 | <1.3 | <1.3 | <1.3 | <1.3 | <1.3 | <1.3 | 6410-B, 2011 * |
Disclaimer/Publisher’s Note: The statements, opinions and data contained in all publications are solely those of the individual author(s) and contributor(s) and not of MDPI and/or the editor(s). MDPI and/or the editor(s) disclaim responsibility for any injury to people or property resulting from any ideas, methods, instructions or products referred to in the content. |
© 2022 by the authors. Licensee MDPI, Basel, Switzerland. This article is an open access article distributed under the terms and conditions of the Creative Commons Attribution (CC BY) license (https://creativecommons.org/licenses/by/4.0/).
Share and Cite
Assayed, A.; Talozi, S.; Ardah, R.; Alziq, N.; Bataineh, S.; Alhushki, A. Using COP Model to Map the Vulnerability of Groundwater Wells Adjacent to Landfills. Sustainability 2023, 15, 623. https://doi.org/10.3390/su15010623
Assayed A, Talozi S, Ardah R, Alziq N, Bataineh S, Alhushki A. Using COP Model to Map the Vulnerability of Groundwater Wells Adjacent to Landfills. Sustainability. 2023; 15(1):623. https://doi.org/10.3390/su15010623
Chicago/Turabian StyleAssayed, Almoayied, Samer Talozi, Rana Ardah, Nanci Alziq, Siham Bataineh, and Aisha Alhushki. 2023. "Using COP Model to Map the Vulnerability of Groundwater Wells Adjacent to Landfills" Sustainability 15, no. 1: 623. https://doi.org/10.3390/su15010623
APA StyleAssayed, A., Talozi, S., Ardah, R., Alziq, N., Bataineh, S., & Alhushki, A. (2023). Using COP Model to Map the Vulnerability of Groundwater Wells Adjacent to Landfills. Sustainability, 15(1), 623. https://doi.org/10.3390/su15010623