Abstract
The purpose of this study was to examine the effects of dissolved and particulate compounds on quorum sensing in the marine luminescent bacterium Aliivibrio fisheri. Bacteria were exposed to increasing concentrations of CuSO4 (Cu2+), gadolinium chloride (Gd3+), 20-nm silver nanoparticles (nanoAg) and 1-3 μm microplastic polyethylene beads for 250 min. During this period, luminescence measurements were taken at 5-min intervals. Toxicity was first examined by measuring luminescence output at 5-min and 30-min incubation time. Based on the effective concentration that decreases luminescence by 20% (EC20), the compounds were toxic at the following concentrations in decreasing toxicity: Cu2+ (3.2 mg/L) < nanoAg (3.4 mg/L, reported) < Gd3+ (34 mg/L) < microplastics (2.6 g/L). The data revealed that luminescence changed non-linearly over time. In control bacteria, luminescence changed at eight specific major frequencies between 0.04 and 0.27 cycle/min after Fourier transformation of time-dependent luminescence data. The addition of dissolved Cu2+ and Gd3+ eliminated the amplitude changes at these frequencies in a concentration-dependent manner, indicating loss of quorum sensing between bacteria at concentrations below EC20. In the presence of nanoAg and microplastic beads, the decreases in amplitudes were modest but compressed the luminescence profiles, with shorter frequencies appearing at concentrations well below EC20. Thus, loss of communication between bacteria occurs at non-toxic concentrations. In addition, with exposure to a mixture of the above compounds at concentrations that do not produce effects for Gd3+, nanoAg and microplastics, Cu2+ toxicity was significantly enhanced, suggesting synergy. This study revealed for the first time that small microplastic particles and nanoparticles can disrupt quorum sensing in marine bacteria.
Introduction
To study toxic compounds in the aquatic environment, sensitive bioassays were developed for various organisms in the food chain, ranging from unicellular bacteria, yeasts and algae to multicellular organisms such as nematodes/annelids, mollusks, microcrustaceans and fish.1 The main advantage of these bioassay systems is that toxicity is measured in the environmental sample without prior knowledge of the compounds present in the testing media. However, in order to be used for routine screening, these assays should have the following features: low cost, quick and reproducible response to contaminants, high sample throughput, and modest laboratory equipment and space requirements. Bioassays, combined with biochemical markers, could also be used to unravel the mechanisms of the toxic effects.2 Luminescent bacteria were soon recognized as simple and quick bioassay system to examine the toxicity of various substances and complex mixtures; this was later commercially produced as the MicrotoxTM test for Aliivibrio fisheri.3
The bacterium Aliivibrio fisheri emits blue-green light during normal metabolism, which can be used as an indicator of viability, and this property was used as a toxic endpoint. The luminescence process is catalyzed by the luciferin-luciferase system.4 The reaction requires a flavin mononucleotide (FMNH2), a long chain aliphatic aldehyde and O2 to produce light: FMNH2 + RCHO + O2 à FMN + RCOOH + H2O + h ʋ.5 This reaction is catalyzed by bacterial luciferase and is synthesized by a process called quorum sensing, in which bacteria sense each other and adjust their respective metabolic activity accordingly.6 The enzyme synthesis occurs when cells exceed a threshold density. The substrates FMNH2 and RCHO are also produced by the bacteria, and O2 is obtained from the immediate environment. Recently, an oscillation in luminescence from stirred bacterial suspension was reported.7 Luminescence and ambient O2 concentration were found to be related: onset of luminescence is associated with decreased O2 content in the medium, and luminescence decreases as the O2 concentration drops and increases again as O2 re-enters the environment (e.g., as a result of stirring). Quorum sensing is also achieved through the production of small highly diffusible autoinducers (AIs) in the extracellular environment. Indeed, the luminescence of Aliivibrio fisheri, a luminescent bacterium that colonizes squids’ light-emitting organ, is regulated by O2 availability and two known AIs: 3-oxohexanoyl lhomoserine lactone and octanoyl lhomoserine lactone.8,9 The luminescence signal peak is non-linear and is composed of at least two major peaks with a period of 150-225-min depending on the incubation conditions (Figure 1A).
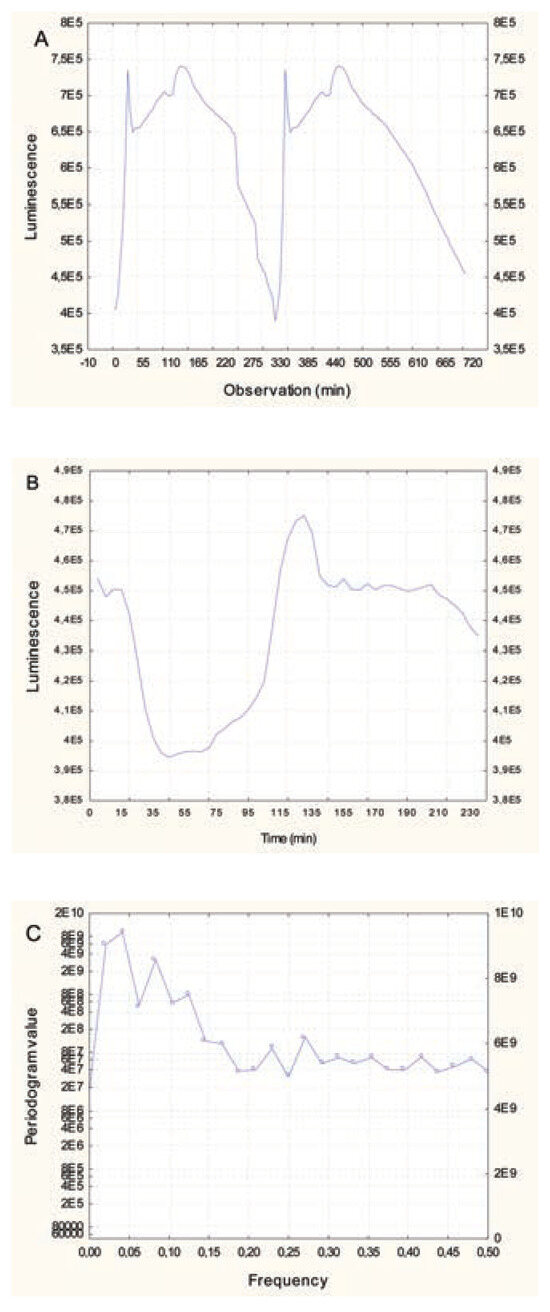
Figure 1.
Change in luminescence in Allovibrio fisheri. Bacteria were re-suspended at 20 million cells/mL in 2% NaCl and luminescence was recorded at 5-min intervals for 3 h at 20°C under constant agitation. Luminescence oscillatory changes at 20 million cells/mL (A), luminescence for the first 50 observations (250 min) and frequency domain analysis (C) are shown.
Currently, the effects of environmental contaminants on quorum sensing in marine bacteria are not well understood. For example, the influence of metal ions such as copper (Cu2+) and gadolinium (Gd3+), which are common urban and industrial contaminants, on bacterial communication during adaptation to changes in dissolved O2 levels needs to be better understood. Moreover, the presence of emerging contaminants such as silver nanoparticles (nanoAg)10 and microplastics11 in marine ecosystems warrants investigation of their potential impact on quorum sensing in marine bacteria. The release of nanoparticles and micro/nanoplastic compounds has recently attracted much attention, as the marine environment is the final reservoir for these complex colloids and polymers. Micro(nano)plastics represent a considerable danger to the ecosystem because they are inadvertently ingested by various organisms during feeding and respiration. Moreover, microplastics and nanoparticles have the capacity to adsorb contaminants at orders of magnitudes higher than the surface water concentration and could thus act as vectors for contaminants.11,12,13
The purpose of this study was to examine the effects of Cu2+, Gd3+, nanoAg and microplastic polyethylene beads on Aliivibrio fisheri toxicity and quorum sensing. Moreover, Cu2+ toxicity was examined in the presence of non-toxic concentrations of Gd3+, nanoAg and microplastic bead mixtures. Bacteria concentration was first optimized to initiate non-linear wave-like changes in luminescence and compared when the above substances were added in the incubation medium. An attempt was made to identify the mode of action of dissolved elements (Cu2+ and Gd3+) and particles (nanoAg and microplastics) by analyzing quorum sensing changes in luminescence.
Materials and Methods
Chemicals
Copper sulfate (CuSO4) and gadolinium chloride (GdCl3) were purchased from Sigma Chemical Company (Ontario, Canada). Citrate-coated silver nanoparticles (1 mg/mL stock solution, 20 nm mean diameter) were purchased from nanoComposix (Cederlane, Burlington, Canada). Microplastic beads (clear white polyethylene, 1-4 μm diameter) were purchased from Cospheric (California, USA). They were resuspended at 20 mg/mL in 2% NaCl and formed a homogenous suspension at this size range. Larger-size particles did not disperse in saline water and readily partitioned at the top of the solution.
Allivibrio fischeri bacteria were provided by the Microtox reagent (Microtox® Acute Reagent, Hoskin Scientific Ltd, Quebec City, Canada). The lyophilized bacteria were rehydrated in reconstitution media to obtain 100 million bacteria/mL and kept on ice. The bacteria reagent suspension was then diluted at 20 million cells/mL with 2% NaCl in white microplates for luminescence measurements. It requires a critical amount of bacteria in a given volume to permit bacteria communication i.e., it requires an optimal concentration of cells for the bacteria to sense one other. The cells were exposed to CuSO4 (75, 150 and 300 μM), GdCl3 (30, 60 and 120 μM), citrate-coated silver nanoparticles at 20 nm diameter (125, 250 and 500 μg/L) and microplastic polyethylene beads at 1-3 μm diameter (1, 2 and 4 mg/mL) in white 96-well microplates. Bacteria were also exposed to the mixture of the above compounds at the lowest concentration: 75 μM for CuSO4, 30 μM for GdCl3, 125 ng/L for nanoAg and 1 mg/mL for polyethylene. Luminescence was measured with a microplate reader at 5-min intervals under constant agitation for 250 min (Synergy 4, Bioscan, microplate multireader, USA). In parallel, toxicity evaluation was also performed by measuring total luminescence after 5-min (acute) and 30- min (subacute) exposure times.
Data analysis
The exposure experiments were repeated N=3 times and mean luminescence values were reported at 5-min intervals for 250 min. The concentration that lowers bacterial luminescence by 20% (EC20) was calculated based on linear regression analysis. The data were also analyzed using Fourier transformation to determine the amplitude changes (periodogram) and frequency profiles (spectral analysis). Fourier analysis transforms any functions f(x,t) into functions in the frequency domain g(k). More precisely, g(k) = a0 + Σ[Ak ∗ cos(2π(kn/N) + Bk ∗ sin(2π(kn/N)], where n = 1 to N observations (time in the present case). The variable n represents the individual observations of the series expressed in time (min), and k is the frequency. The constants Ak and Bk are used to calculate the periodogram (Pg) value, which is related to the amplitude variance of the sine and cosine functions at each frequency k: Pg = (Ak 2 + Bk 2 )*N/2, where N is the total number of observations. The Pg value is thus related to the variance of the function at a given frequency. The significance of each Pg value was tested and compared to random noise using the Kolmogorov-Smirnov test (exponential adjustment). Phase shift analysis was also performed to determine changes in phases of the luminescence signal. All statistical tests were performed using the Statistica software package (France).
Results
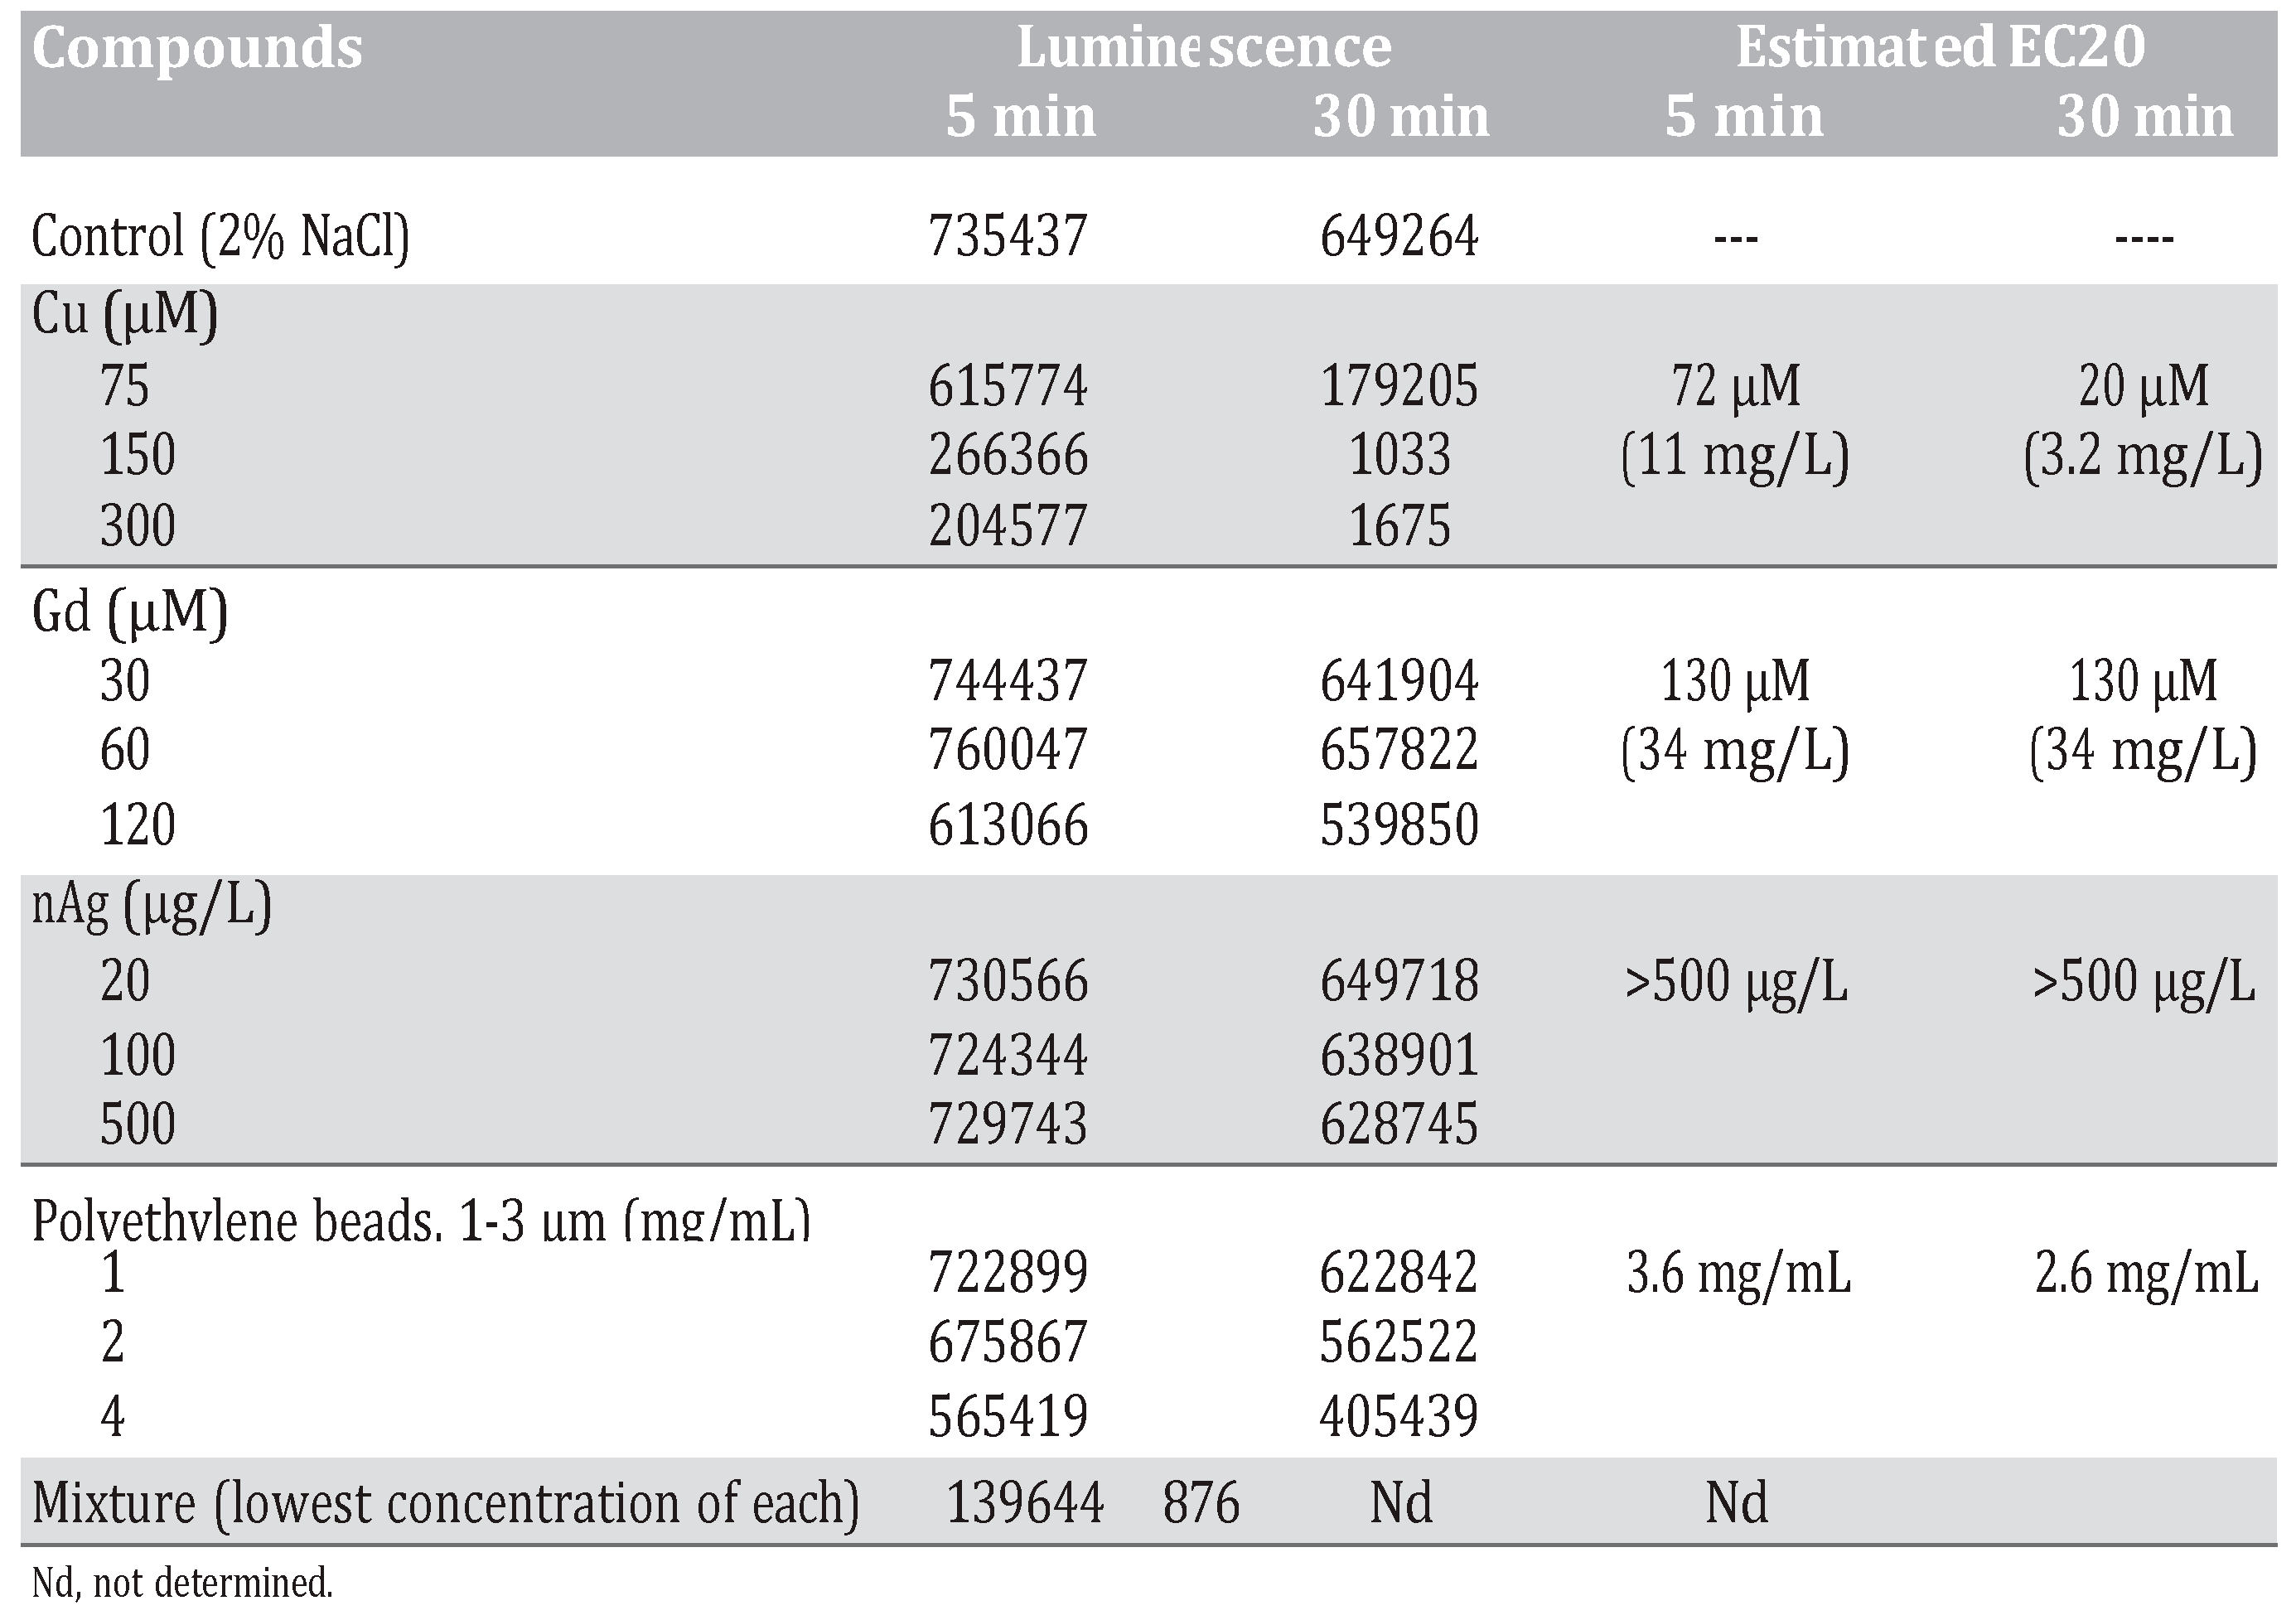
The toxicity of the Cu2+, Gd3+, nanAg and polyethylene beads was examined at a concentration of 20 million cells/mL, which is higher than the concentration in the standard testing procedure (1 million bacteria/mL)14 (Environment Canada, 1992). Measurements were performed at 5 min and 30 min for the toxicity assessments. The decrease in luminescence is the measured endpoint for toxicity assessment. For Cu2+, a dramatic decrease in luminescence was observed: approximately 390- fold at the highest concentration used. An estimated EC20 of 72 μM and 20 μM was observed after 5-min and 30-min exposure times respectively. For Gd3+, there was a moderate decrease: 1.2-fold at the highest tested concentration. An estimated EC20 of 130 μM Gd3+ was observed at 5-min and 30-min exposure times. For nanoAg, a low decrease in luminescence was observed, reaching only 1.3-fold at the highest concentration tested, but EC20 was at concentrations higher than 500 μg/L. For polyethylene microplastic beads, a 1.6-fold decrease was observed at the highest concentration. The estimated EC20 was 3.6 mg/mL and 2.6 mg/mL for 5-min and 30- min exposure times respectively. As for the mixture, as explained in the Materials and Methods section, it decreased luminescence by 740-fold compared to the control, which represented 200 times the decrease produced by Cu2+ alone at 75 μM. This indicates an important synergy between Cu2+ and Gd3+/nanoAg/microplastics, given that the latter did not produce any significant effects alone at the lowest concentration tested. When bacteria density reached 20 million cells/mL in 2% NaCl, luminescence changed non-linearly in time following a characteristic cyclic-like pattern (Figure 1B). The peak in luminescence lasted 120 to 150 min. This process is associated with quorum sensing by bacteria populations, which is a function of oxygen availability and AI effects between bacteria for luminescence reaction. Fourier transformation of the data revealed that this signal could be broken down into major frequencies (Figure 1C). Indeed, we observed that the following eight frequencies were dominant: 0.020, 0.042, 0.0625, 0.083, 0.104, 0.125, 0.22 and 0.27. The most important frequencies were in the range of 0.042 to 0.10, which corresponds to periods of 50 to 120 min.
In bacteria exposed to Cu2+, a strong decrease in luminescence was observed at the lowest concentration (75 μM), followed by an even stronger decrease in luminescence at higher concentrations (Figure 2A). The frequency profiles revealed that Cu2+ eliminated the signals in the range of 0.06 to 0.27 at the lowest concentration, suggesting loss of quorum sensing in the bacterial population. This occurs at the same range as the chronic (30-min) EC20. In bacteria exposed to Gd3+, a gradual decrease in luminescence was observed with the exposure concentration (Figure 3A). At the lowest exposure concentration, the curve still had a wavelike shape, but with very low amplitude changes (Figure 3B). Frequency analysis revealed a loss of signals at frequencies 0.06 to 0.1, suggesting a decrease in communication between bacteria at concentrations (30 μM) well below the reported EC20 (130 μM) for Gd3+.
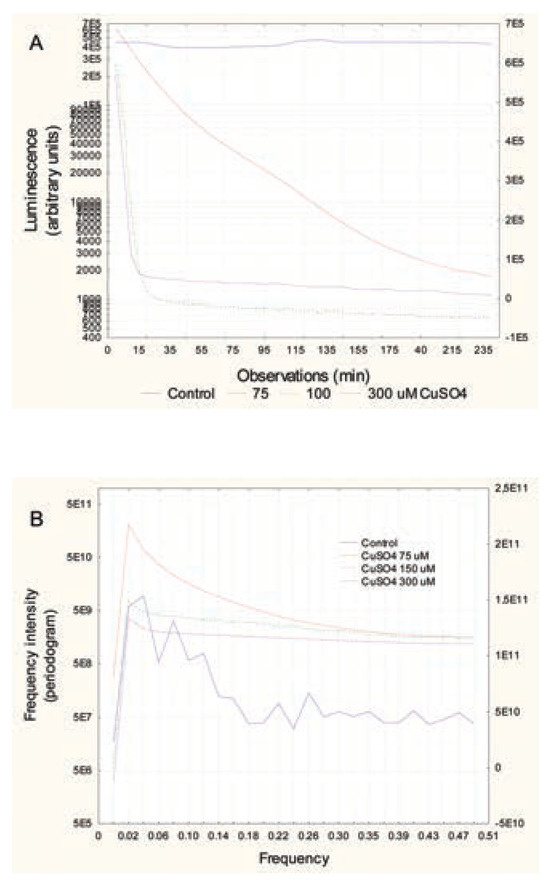
Figure 2.
Change in luminescence in bacterial suspension exposed to CuSO4. Bacteria were re-suspended at 20 million cells/mL in 2% NaCl containing increasing concentrations of CuSO4. Luminescence was recorded at 5-min intervals for 3 h at 20°C under constant agitation. Recorded luminescence at each time (A) and frequency analysis by Fourier transformation (B) are shown.
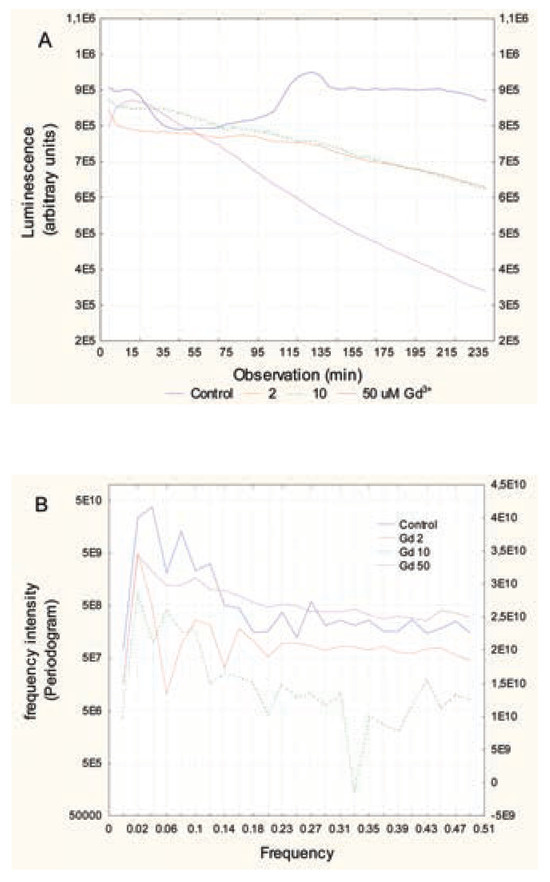
Figure 3.
Changes in luminescence over time in bacteria exposed to Gd. Bacteria were re-suspended at 20 million cells/mL in 2% NaCl containing increasing concentrations of GdCl3. Luminescence was recorded at 5-min intervals for 3 h at 20°C under constant agitation. Recorded luminescence at each time (A) and frequency analysis by Fourier transformation (B) are shown.
In bacteria exposed to nanoAg, the luminescence pattern did not change in appearance (Figure 4A). However, luminescence was lower than in the controls, and the pattern appeared out of phase compared to the controls. To show this, the 2nd large peak at the 26th observation (130 min) in controls was shifted to the 22nd observation (110 min) for all nanoAg concentrations. In addition, the peak height decreased in proportion to the nanoAg concentrations used. This was confirmed by phase shift analysis, which showed that the signals were shifted by a factor of 4 or 5 observations (p=0.02). Frequency analysis revealed that the major signal intensities (periodogram) at frequencies 0.1 (period of 50 min), 0.08 (62 min) and 0.06 (83 min) were lower than the controls and that the decreases were concentration- dependent (Figure 4B). This suggests that the presence of nanoAg in the incubation media disrupts bacterial communication, as shown by reduced luminescence and loss of signals at specific frequencies (0.06, 0.08 and 0.1) at concentrations that do not produce toxic effects (<EC20). In respect to microplastic polyethylene beads, the same pattern was observed with the nanoparticles (Figure 5A). There was a concentration- dependent loss of luminescence, especially at the 2nd major peak (26th observation). Bacteria exposed to microplastics also showed shifted spectra, but with a different behaviour. The major 2nd peak (26th observation or 130 min) appeared to shift down to the 23nd observation (115 min) at the lowest concentration of microplastics but shifted to the 35th observation (175 min) at higher concentrations. These changes occurred at concentrations in the range of EC20. Frequency analysis revealed some changes in the frequency profiles (Figure 5B). A loss of signal at frequencies 0.06, 0.08 and 0.1 was also found in bacteria exposed to microplastic beads. The control bacteria also exhibited characteristic minor peaks at higher frequencies 0.22 (115-min period) and 0.26 (95-min period) which was also systematically lost by all the compounds tested at the lower concentration respectively. We also examined the influence of the mixture composed of each substance at the lowest concentrations on bacterial luminescence (results not shown). The mixture decreased luminescence and eliminated the frequency profiles, with only one signal at 0.02-frequency. The intensity value of the signal was 22 times lower than for the control bacteria. To show the effects of the tested substances (Cu2+, Gd3+, nanoAg, microplastic beads and mixture) on the luminescence profiles, a hierarchical tree analysis was performed on the first eight frequencies of the tested substances (Figure 6). The index of similarity between each substance (x axis) was expressed as 1- r, where r is the correlation coefficient of the first eight frequencies. The analysis revealed that the frequency profile (first eight frequencies) of the control had low similarity to bacteria exposed to all substances (r=0.575). The Cu2+ responses were very closely related to the mixture responses (r=0.99), which suggests that Cu2+ dominated the effects in the mixture (consistent with the fact that they were present at the lowest concentration for each, where Cu2+ only decreased luminescence on its own). Gd3+ responses were related to Cu2+, nanoAg and microplastics (r=0.825). The microplastics and nanoAg were highly correlated with each other (r=0.985), which suggests similar (colloidal-like) interactions.
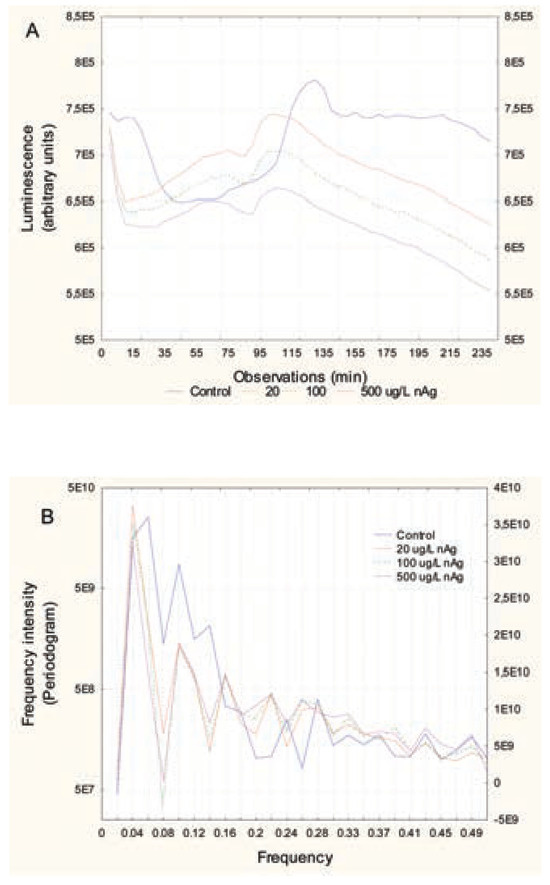
Figure 4.
Change in luminescence over time in bacteria exposed to silver nanoparticles. Bacteria were re-suspended at 20 million cells/mL in 2% NaCl containing increasing concentrations of nanoAg. Luminescence was recorded at 5-min intervals for 3 h at 20°C under constant agitation. Recorded luminescence at each time (A) and frequency analysis by Fourier transformation (B) are shown.
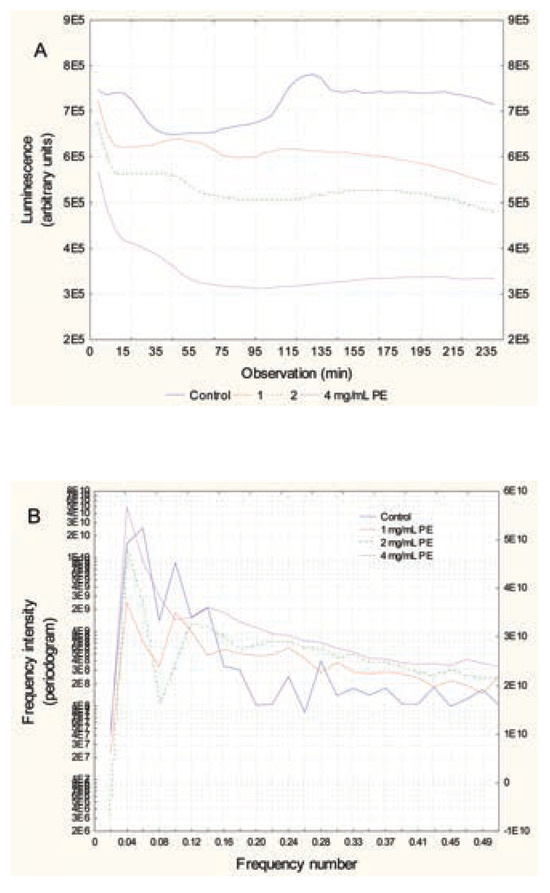
Figure 5.
Luminescence change over time in bacteria exposed to microplastic beads (1-3 um). Bacteria were re-suspended at 20 million cells/mL in 2% NaCl containing increasing concentrations of polyethylene microplastic beads. Luminescence was recorded at 5-min intervals for 3 h at 20°C under constant agitation. Recorded luminescence at each time (A) and frequency analysis by Fourier transformation (B) are shown.
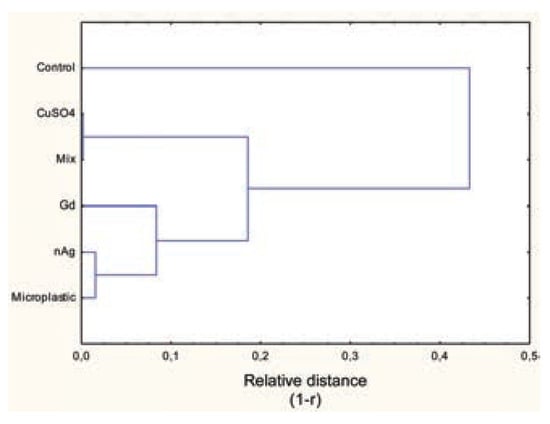
Figure 6.
Hierarchical analyses of the first eight frequencies in luminescence changes. The periodogram value of the first eight frequencies was used to classify the quorum-sensing properties of the selected contaminants in bacterial suspension. Mixture was composed of the lowest concentration of CuSO4 (75 μM), GdCl3 (30 μM), nAg (20 μg/L) and microplastic beads (1 mg/mL).
Discussion
The reported toxicity of Cu2+ for the Microtox test is in the same range as in the present study with an EC50 of 1-2 mg/L.15 These values are close to the EC20 value of 3.2 mg/L obtained here, given that high bacteria concentration (20 million cells/mL compared to 1 million cells/mL) was used. It is noteworthy that copper toxicity was enhanced 5 times when combined with the other compounds (which were not toxic on their own), suggesting synergy. Indeed, Cu2+ was the main driver of toxicity in the mixture, since the other compounds (Gd3+, nanoAg and microplastic beads) did not produce toxicity at the concentrations used. Moreover, the lowest concentration of Cu2+, which was below EC20, completely eliminated luminescence signals over time, suggesting that Cu2+ disrupts quorum sensing in bacterial populations at sub-toxic concentrations. Loss of quorum sensing could be deleterious for the population since they would contribute to consume oxygen from its environment and contribute to decreased oxygen availability. Data on the aquatic toxicity of Gd+3 are scarce in the literature. A 7- day exposure to lanthanum in Microcystis aeruginosa produced an NOEC value of 2.5 mg/L compared to the 30-min EC20 value of 34 mg/L for gadolinium.16 Gd+3 decreased cell viability in primary cultures of rainbow trout hepatocytes at 250 mg/L in primary cultures of rainbow trout after 24 h.17 For nanoAg, the reported 30-min toxicity with the standard Microtox test was 3.4 mg/L for 20-nm nanoparticles,18 which is well above the concentrations used in the present study. Nevertheless, changes in quorum sensing based on luminescence were observed at 20 μg/L, which is about 170 times less than the EC50 value. Given the low Zeta potential for citrate-coated nanoAg, the nanoparticles are expected to be in aggregates as a result of charge neutralization due to the high salt (NaCl) content of the incubation medium.19 The presence of conglomerates of nanoAg in the extracellular medium seems to dampen cell signaling by small diffusible small molecules (autoinducers).20 This raises the question of whether nanoAg could have somewhat of a binding effect on these AIs or act as a screen limiting diffusion between cells. It was found that individual cells vary in onset time of luminescence intensity, even in the presence of high concentrations of AIs. This indicates that luminescence phasing of cells leading to luminescence oscillations is a delicate mechanism and that the nature of the incubation medium and the presence of toxic compounds could readily influence bacteria communication. Microplastic polyethylene beads, which were in the same size range as bacteria (diameter of 1-3 μm), likely remain in the intracellular media, leading to decreased luminescence and altering the signal over time. It is therefore possible, as with nanoAg aggregates that the presence of particles in the extracellular environment could act as a shield against signalling of O2 or AIs. Given that other contaminants could adhere to microplastics,11 this raises the possibility that microplastics could also bind signalling AI molecules involved in quorum sensing of bacterial populations. This is the first report of such an interaction between microplastics and bacterial luminescence. The observed changes in luminescence over time occurred at relatively large concentrations (1 mg/mL), which is unlikely in the water column but might occur in microenvironments such as tissues loaded with microplastics (e.g., gut or gills).21 Moreover, microplastics could degrade into nanoplastics (size range of 1 to 100 nm), which could increase bioavailability and perhaps initiate toxicity at this scale through as yet unknown mechanisms or through vectorization or binding of essential biomolecules (AIs, hormones, cofactors neurotransmitters, etc.).13 It was also observed that exposure to nanoparticles and microplastic beads compressed the luminescence profile somewhat and produced changes at lower frequencies. These changes in frequencies were also observed in NADH levels during glycolysis in Saccharomyces cerevisiae yeast cells exposed to various contaminants including Gd3+.22 Exposure of yeast cells for 3 h in nutrient-free media to Cu2+, Gd3+ and nanoAg led to the formation of higher frequencies in NADH levels with concentration- dependent amplitude changes. Cu2+ was the most toxic compound and produced changes at higher frequencies than the others, suggesting that toxicity manifests at different frequencies from the normal frequency spectrum.
Conclusions
In conclusion, the bacterial luminescence test commonly used in ecotoxicology to test for toxicity of liquid (and solid) samples could be adapted to determine the potential of compounds to disrupt quorum sensing by observing changes in luminescence at high bacteria density. At high density, a characteristic change in luminescence was observed: a periodic cycle of 150-200 min, with smaller changes at lower time scales. Fourier transformation revealed characteristic changes in luminescence at selected frequencies (eight major frequencies) between 0.04 and 0.27 cycles. The presence of ionic Cu and Gd clearly decreased luminescence output and eliminated these frequencies at concentrations that were usually lower than either the reported or measured acute toxicity values for Aliivibrio fisheri. The presence of silver nanoparticles and microplastic beads led to a different change in luminescence profiles. The decrease in luminescence was smaller, but the luminescence profiles were somewhat compressed, with the appearance of shorter frequencies. Moreover, the observed changes in amplitudes and frequencies occurred at sub-toxic concentrations, suggesting that loss of quorum sensing occurs at low non-toxic concentrations. This study also revealed for the first time that microplastic beads could disrupt quorum sensing in bacterial populations.
Highlights
- The wave-like behavior in luminescence are changed by chemicals.
- Suspensions of silver nanoparticles and microplastics disrup chorum sensing in bacteria.
Acknowledgments
This work was funded by the Chemical Management Plan of Environment and Climate Change Canada. Kate Forster provided assistance with editing.
References
- Blaise, C; Gagné, F; Bombardier, M. Recent developments in microbiotesting and early millennium prospects. Water Air Soil Poll 2000, 123, 11. [Google Scholar]
- Blaise, C; Gagné, F. Aquatic ecotoxicology: What has been accomplished and what lies ahead? An Eastern Canada historical perspective. J Xenobiotics 2013, 3, e8. [Google Scholar]
- Steinberg, SM; Poziomek, EJ; Engelmann, W; Rogers, K. A review of environmental applications of bioluminescence measurements. Chemosphere 1995, 30, 2155. [Google Scholar]
- Raushel, FM; Baldwin, TO. Proposed mechanism for the bacterial bioluminescence reaction involving a dioxirane intermediate. Biochem Biophys Res Comm 1989, 164, 1137. [Google Scholar]
- Balny, C; Hastings, JW. Fluorescence and bioluminescence of bacterial luciferase intermediates. Biochemistry 1975, 14, 4719. [Google Scholar]
- Sasaki, S. Oscillation in bacterial bioluminescence. Bioluminescence - Recent advances in oceanic measurements and laboratory applications 2012, 167. [Google Scholar]
- Sato, Y; Sasaki, S. Observation of Oscillation in Bacterial Luminescence. Analyt Sci 2008, 24, 423–5. [Google Scholar]
- Eberhard, A; Burlingame, AL; Eberhard, C; Kenyon, GL; Nealson, KH; Oppenheimer, NJ. Structural identification of autoinducer of Photobacterium fischeri luciferase. Biochemistry 1981, 28, 2444–9. [Google Scholar]
- Gilson, L; Kuo, A; Dunlap, PV. AinS and a new family of autoinducer synthesis proteins. J Bacteriol 1995, 177, 6946. [Google Scholar]
- Zuykov, M; Pelletier, E; Demers, S. Colloidal complexed silver and silver nanoparticles in extrapallial fluid of Mytilus edulis. Mar Environ Res 2011, 71, 17. [Google Scholar]
- Crawford, C; Quinn, B. Microplastic pollutants, 1st ed.; Elsevier; Amsterdam, 2016; p. 336. [Google Scholar]
- Anderson, JC; Park, BJ; Palace, VP. Microplastics in aquatic environments: Implications for Canadian ecosystems. Environ Poll 2016, 18, 269. [Google Scholar]
- Gagné, F; Gagnon, C; Blaise, C. Aquatic nanotoxicology: a review. Res Trends 2008, 4, 1–14. [Google Scholar]
- Environment Canada. Biological test method. Toxicity test using luminescent bacteria SPE 1/RM/24. Montreal: Environment Canada; 1992. [Google Scholar]
- Liu, D; Dutka, BJ. Toxicity screening procedures using bacterial systems. Boca Raton, FL: CRC Press; 1984. [Google Scholar]
- Oosterhout, F; Lürling, M. The effect of phosphorus binding clay (Phoslocks) in mitigating cyanobacterial nuisance: a laboratory study on the effects on water quality variables and plankton. Hydrobiologia 2013, 710, 265. [Google Scholar]
- Laville, N; Ait-Aissa, S; Gomez, E; Casellas, C; Porcher, JM. Effects of human pharmaceuticals on cytotoxicity, EROD activity and ROS production in fish hepatocytes. Toxicology 2004, 196, 41. [Google Scholar]
- Jemec, A; Kahru, A; Potthoff, A; Drobne, D; Heinlaan, M; Bohme, S; et al. An interlaboratory comparison of nanosilver characterisation and hazard identification: Harmonising techniques for high quality data. Environ Intern 2016, 87, 20. [Google Scholar]
- Gagné, F; Auclair, J; Fortier, M; Bruneau, A; Fournier, M; Turcotte, P; et al. Bioavailability and immunotoxicity of silver nanoparticles to the freshwater mussel Elliptio complanata. J Toxicol Environ Health A 2014, 76, 767. [Google Scholar]
- Delfino, Perez P; Hagen, SJ. Heterogeneous response to a quorumsensing signal in the luminescence of individual Vibrio fischeri. PLoS One 2010, 5, e15473. [Google Scholar]
- Bouwmeester, H; Hollman, PCH; Peters, RJB. Potential health impact of environmentally released micro- and nanoplastics in the human food production cha in: experiences from nanotoxicology. Environ Sci Technol 2016, 49, 8932. [Google Scholar]
- André, C; Gagné, F. Effect of the periodic properties of toxic stress on the oscillatory behaviour of glycolysis in yeast: evidence of a toxic effect frequency. Comp Biochem Physiol 2017, 196, 36. [Google Scholar]
© Copyright F. Gagné et al., 2017 Licensee PAGEPress, Italy. This work is licensed under a Creative Commons Attribution NonCommercial 4.0 License (CC BY-NC 4.0).

