
QSAR Models for Predicting the Antioxidant Potential of Chemical Substances


Abstract
1. Introduction
2. Materials and Methods
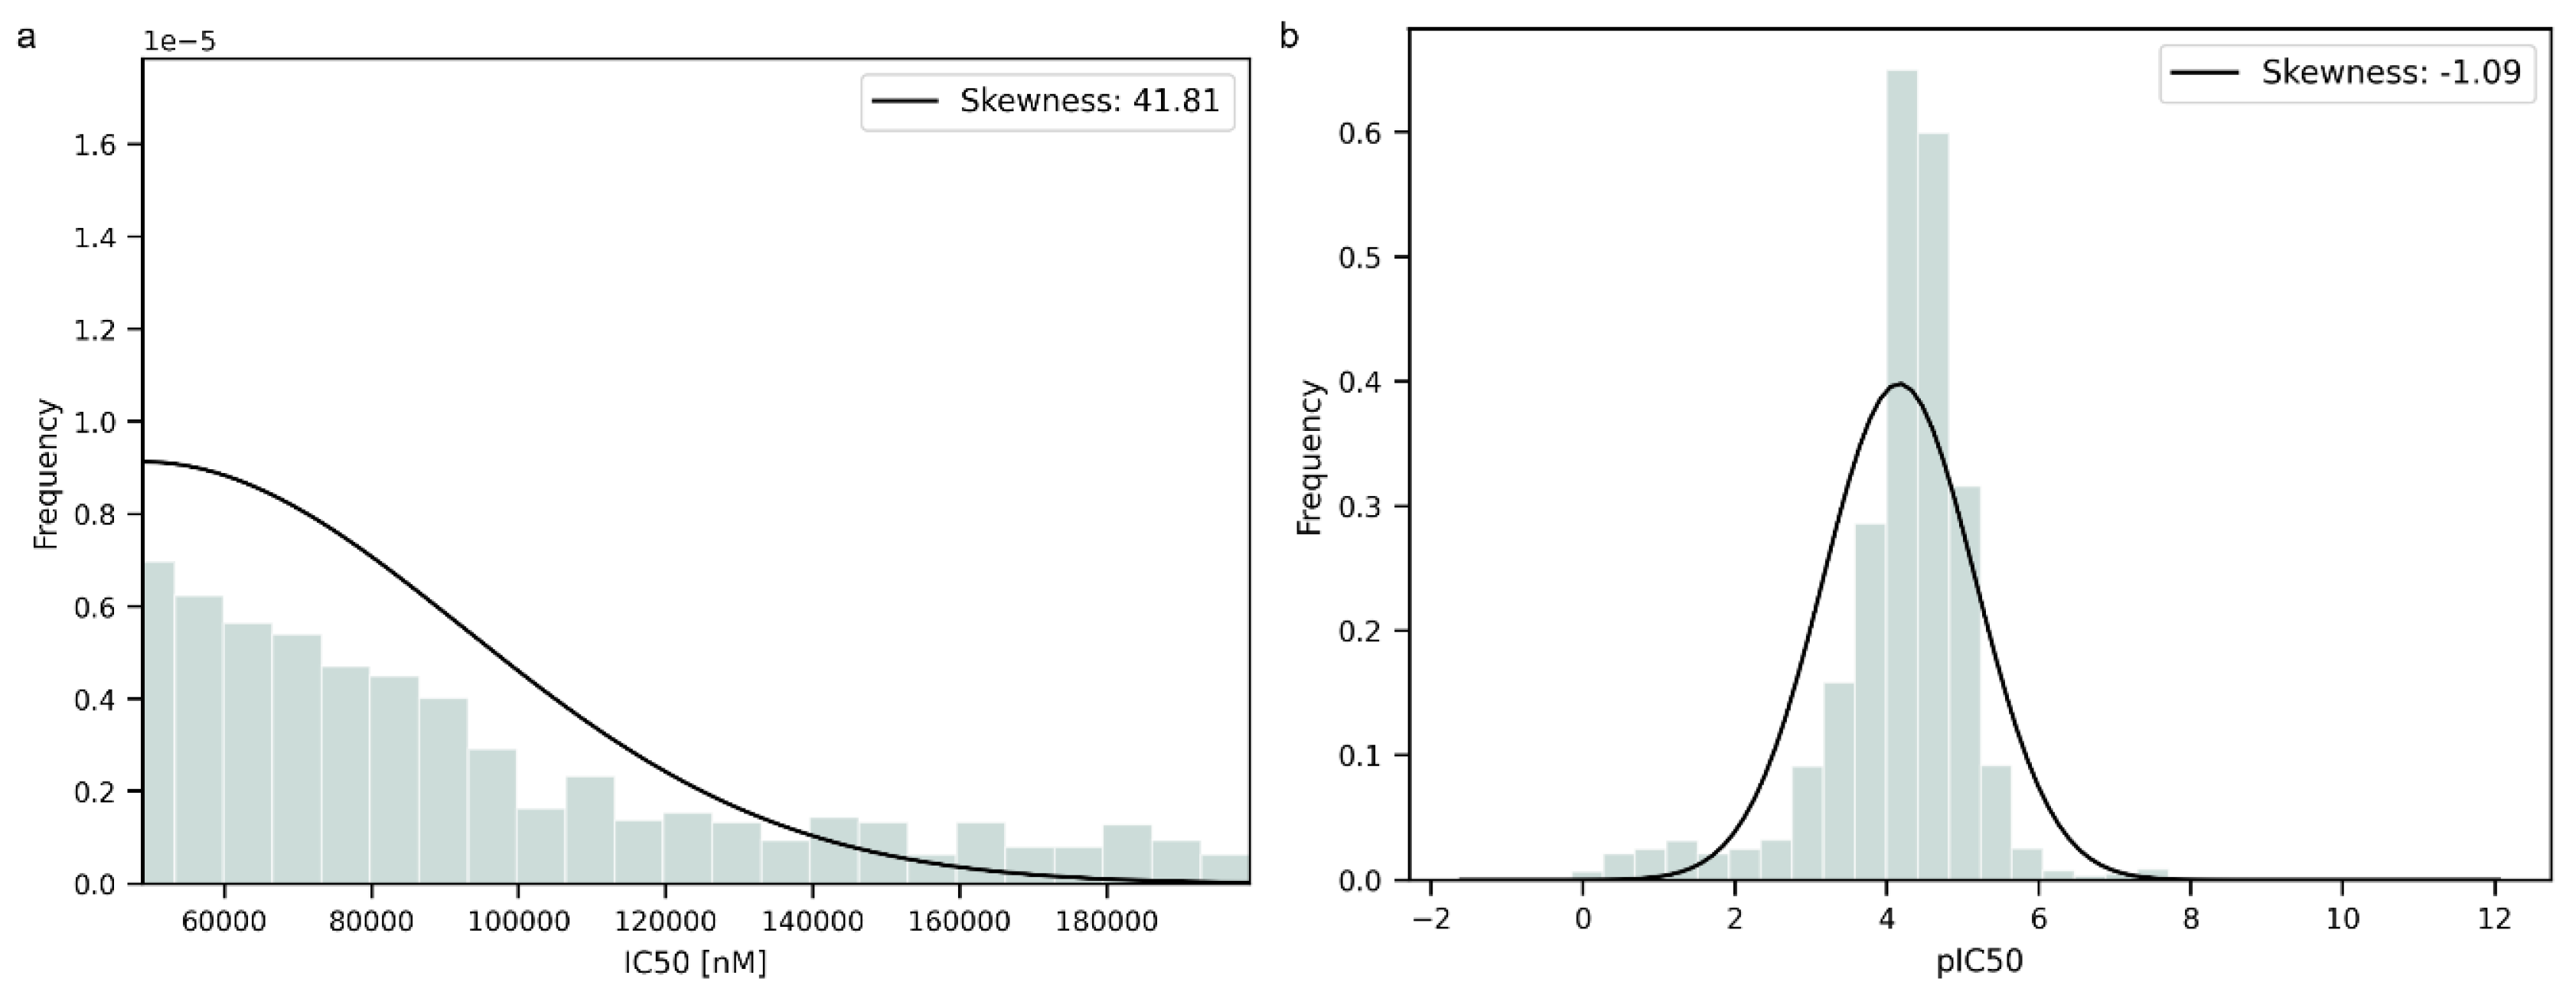
2.1. Collection and Processing of the Data
2.2. Molecular Descriptors
Feature Selection
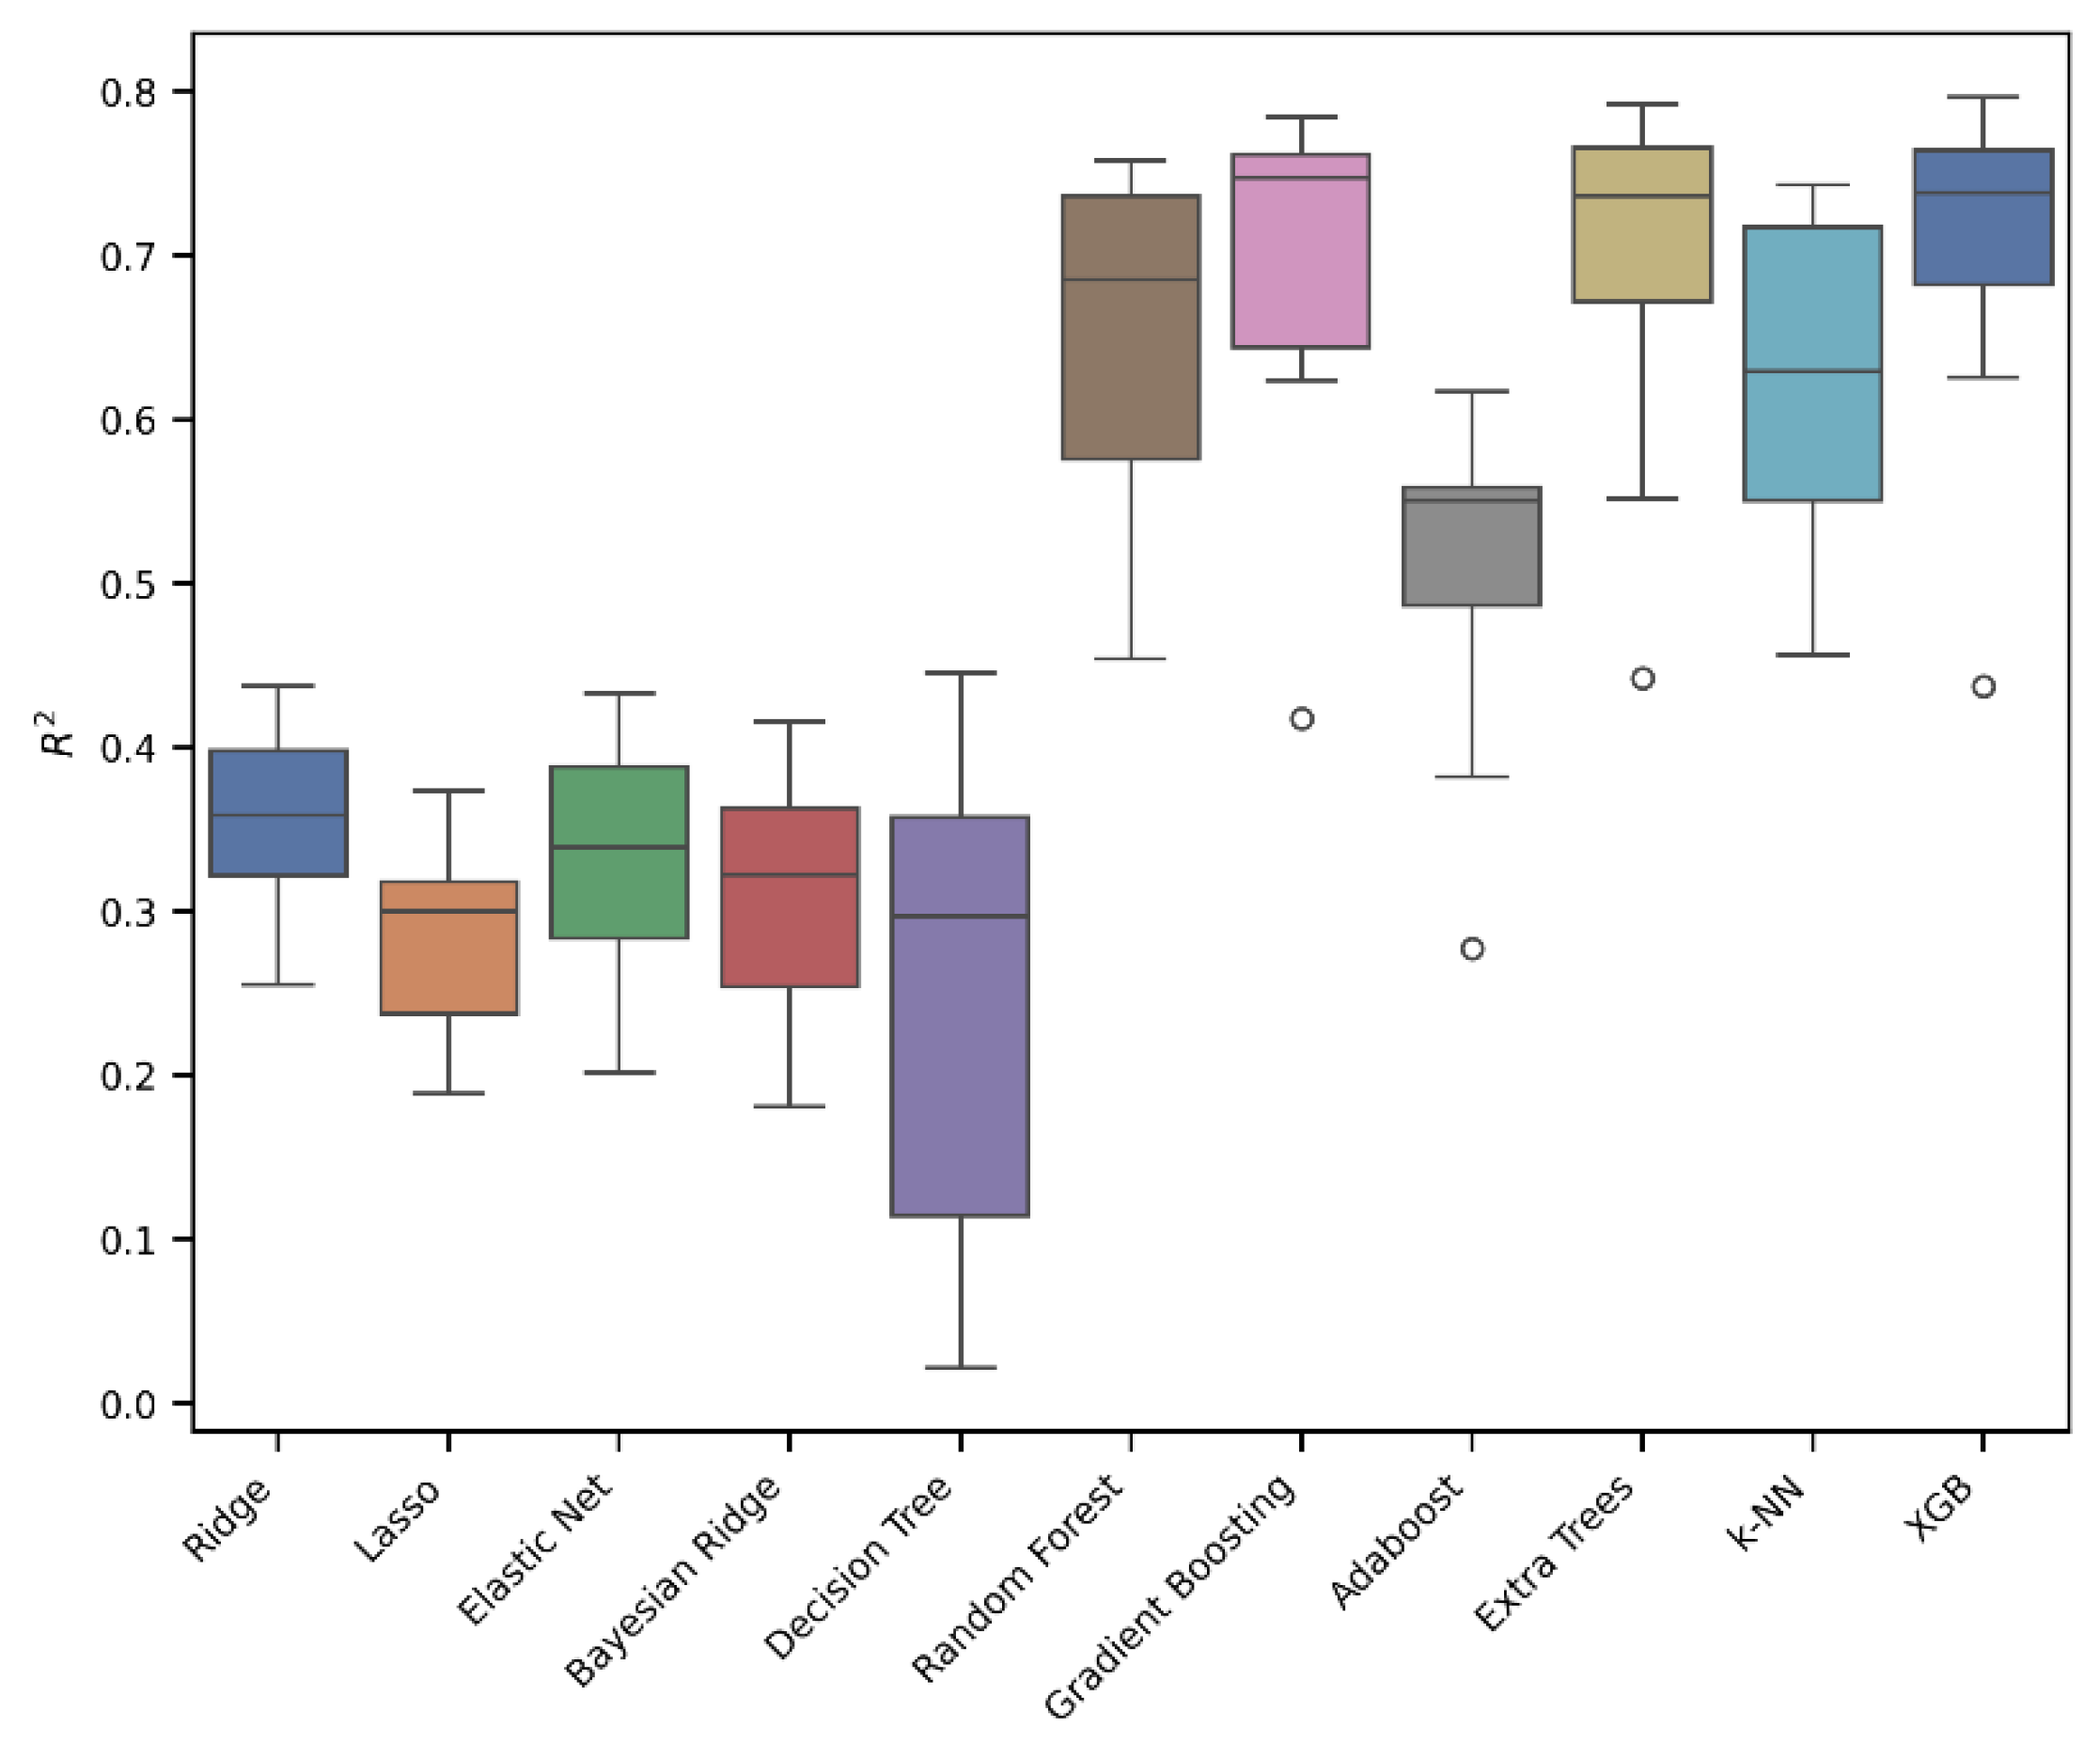
2.3. Model Development and Validation
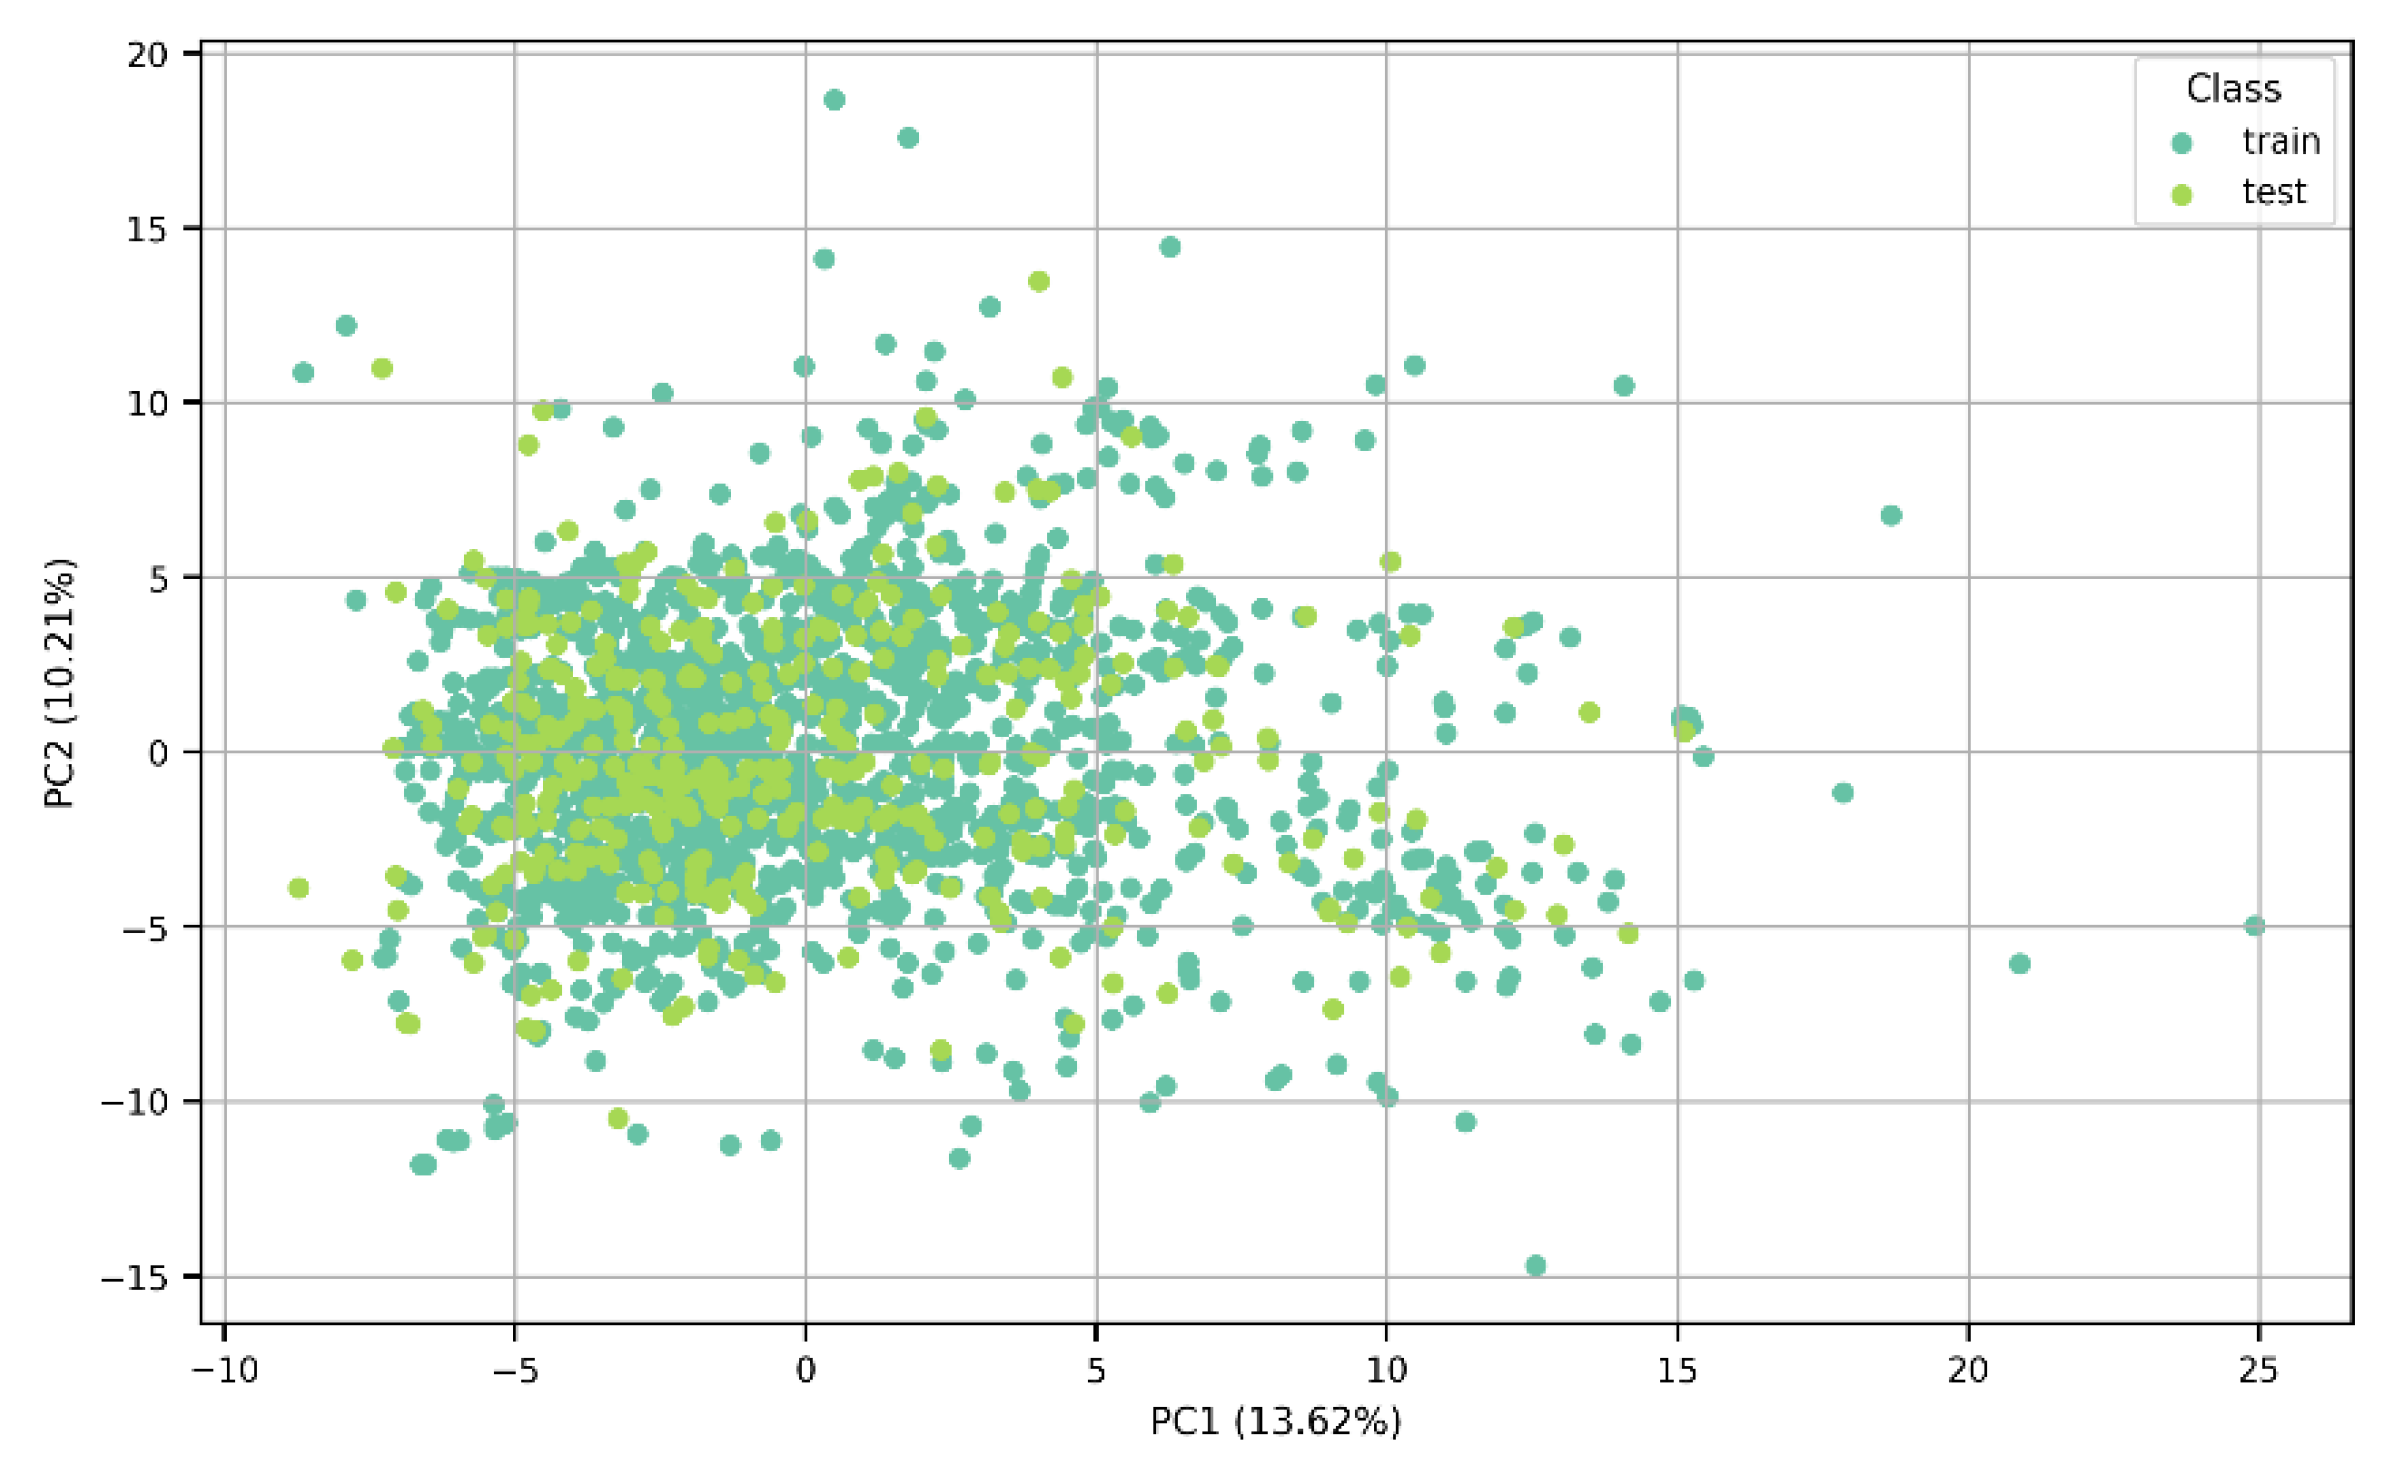
Applicability Domain
3. Results and Discussion
3.1. Case Study
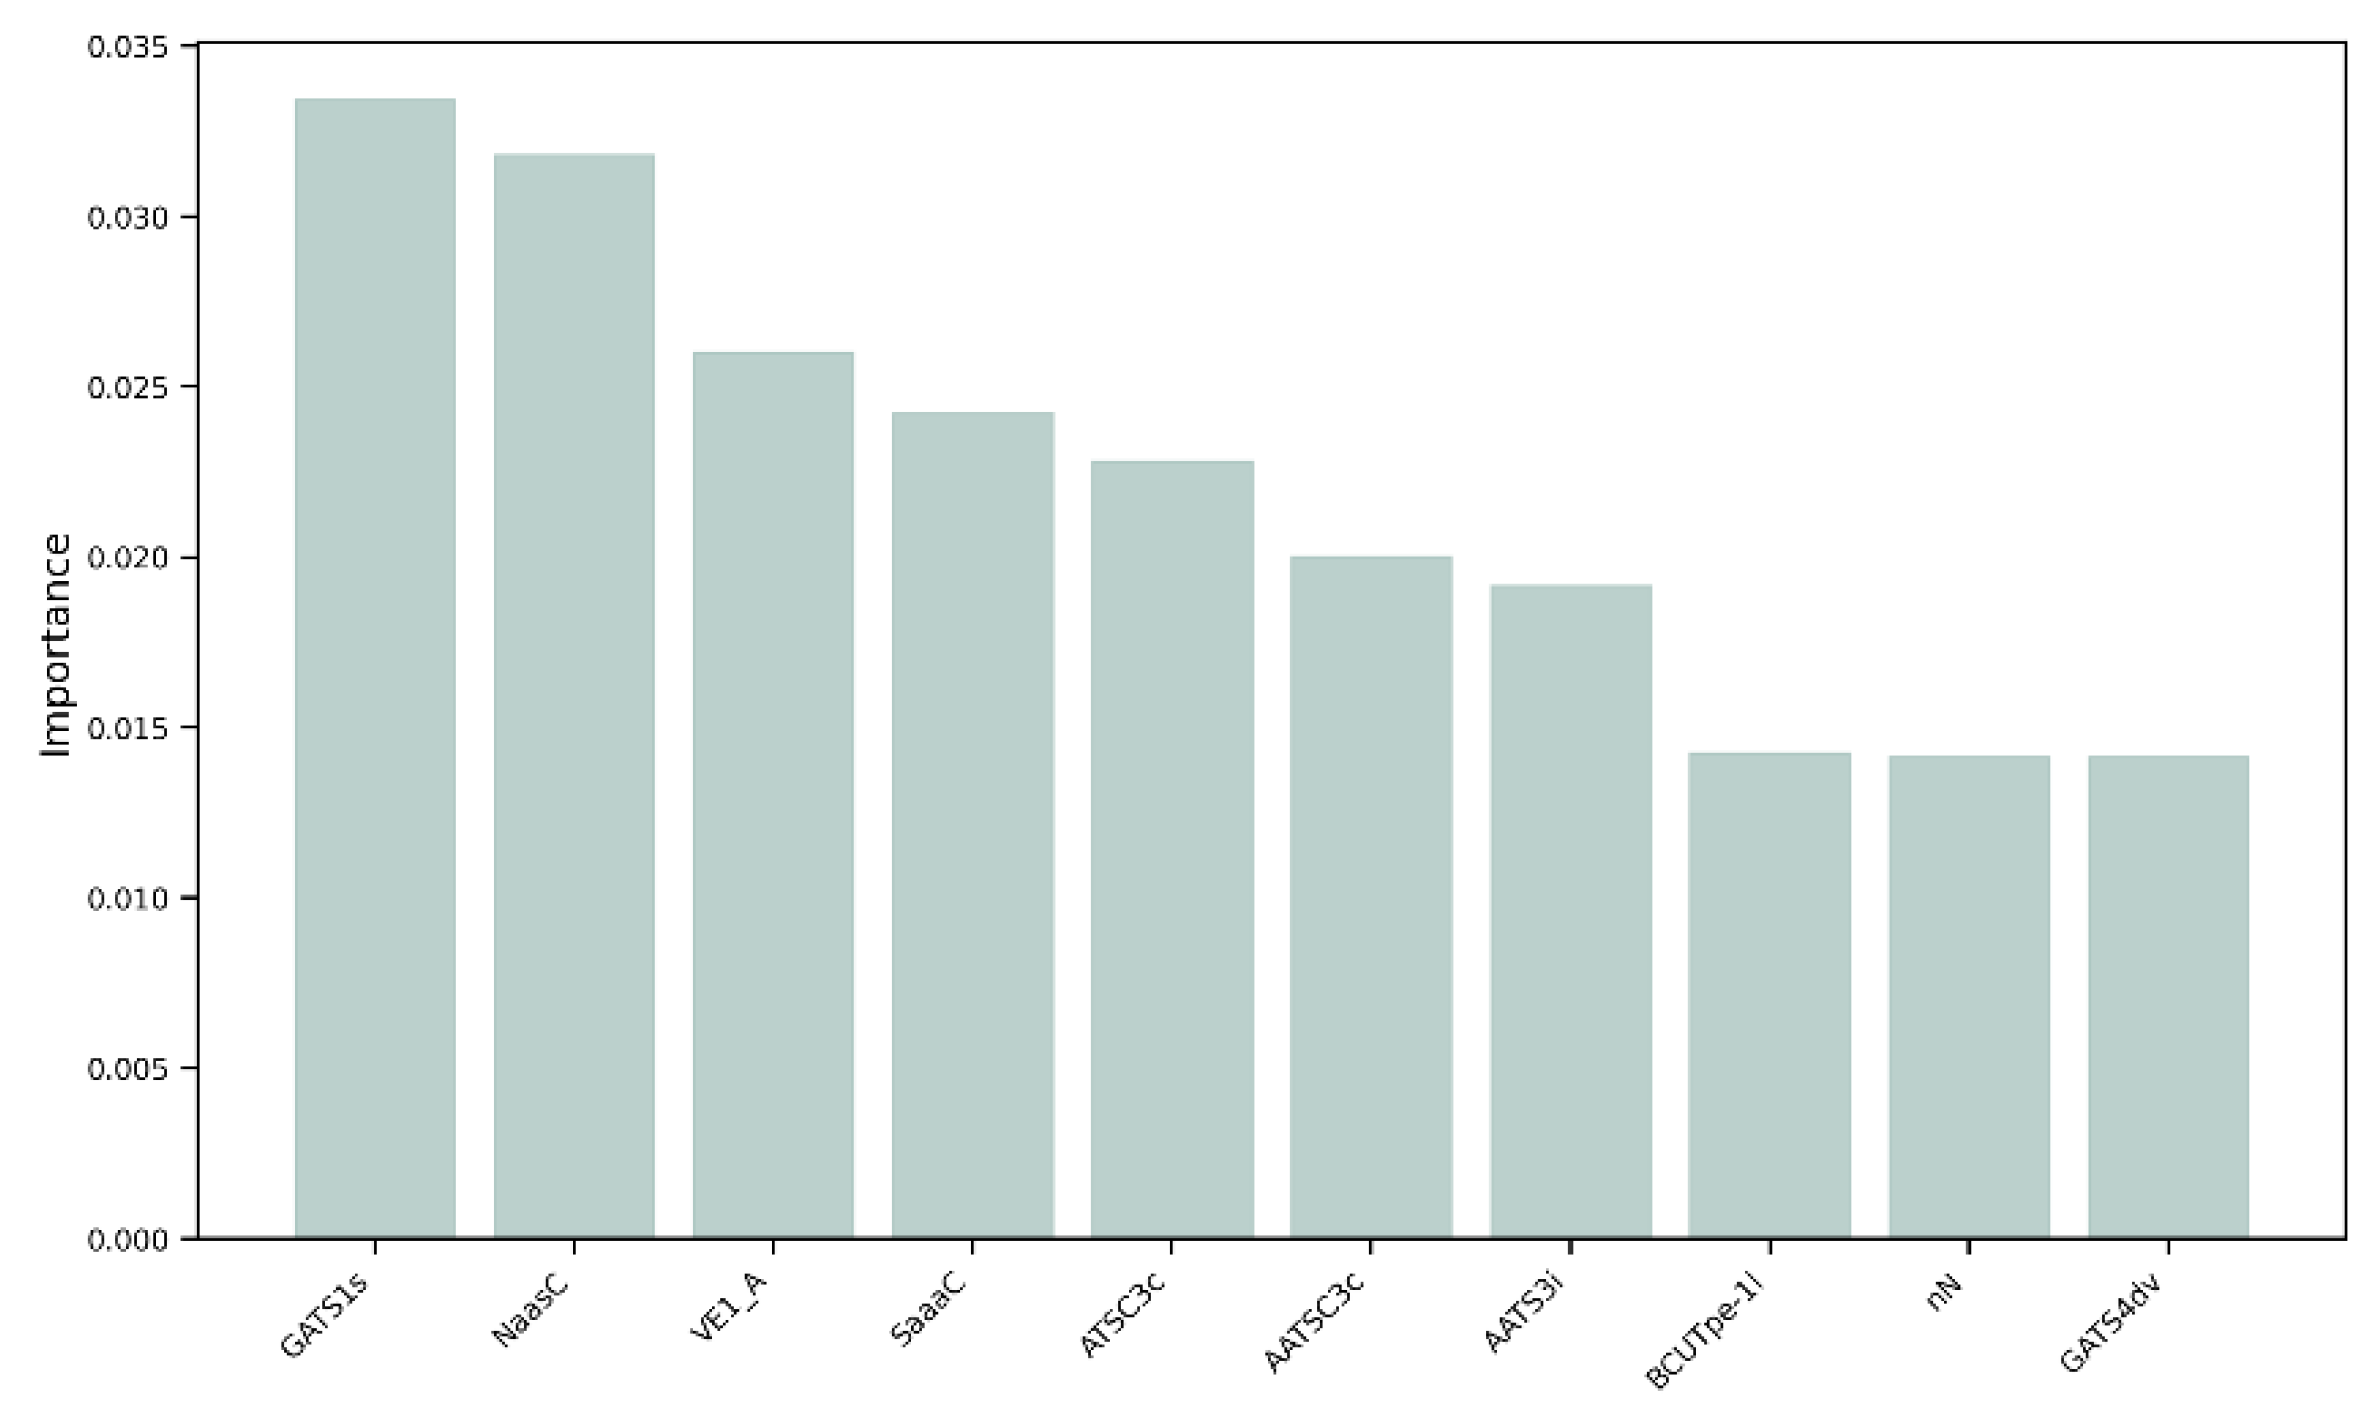
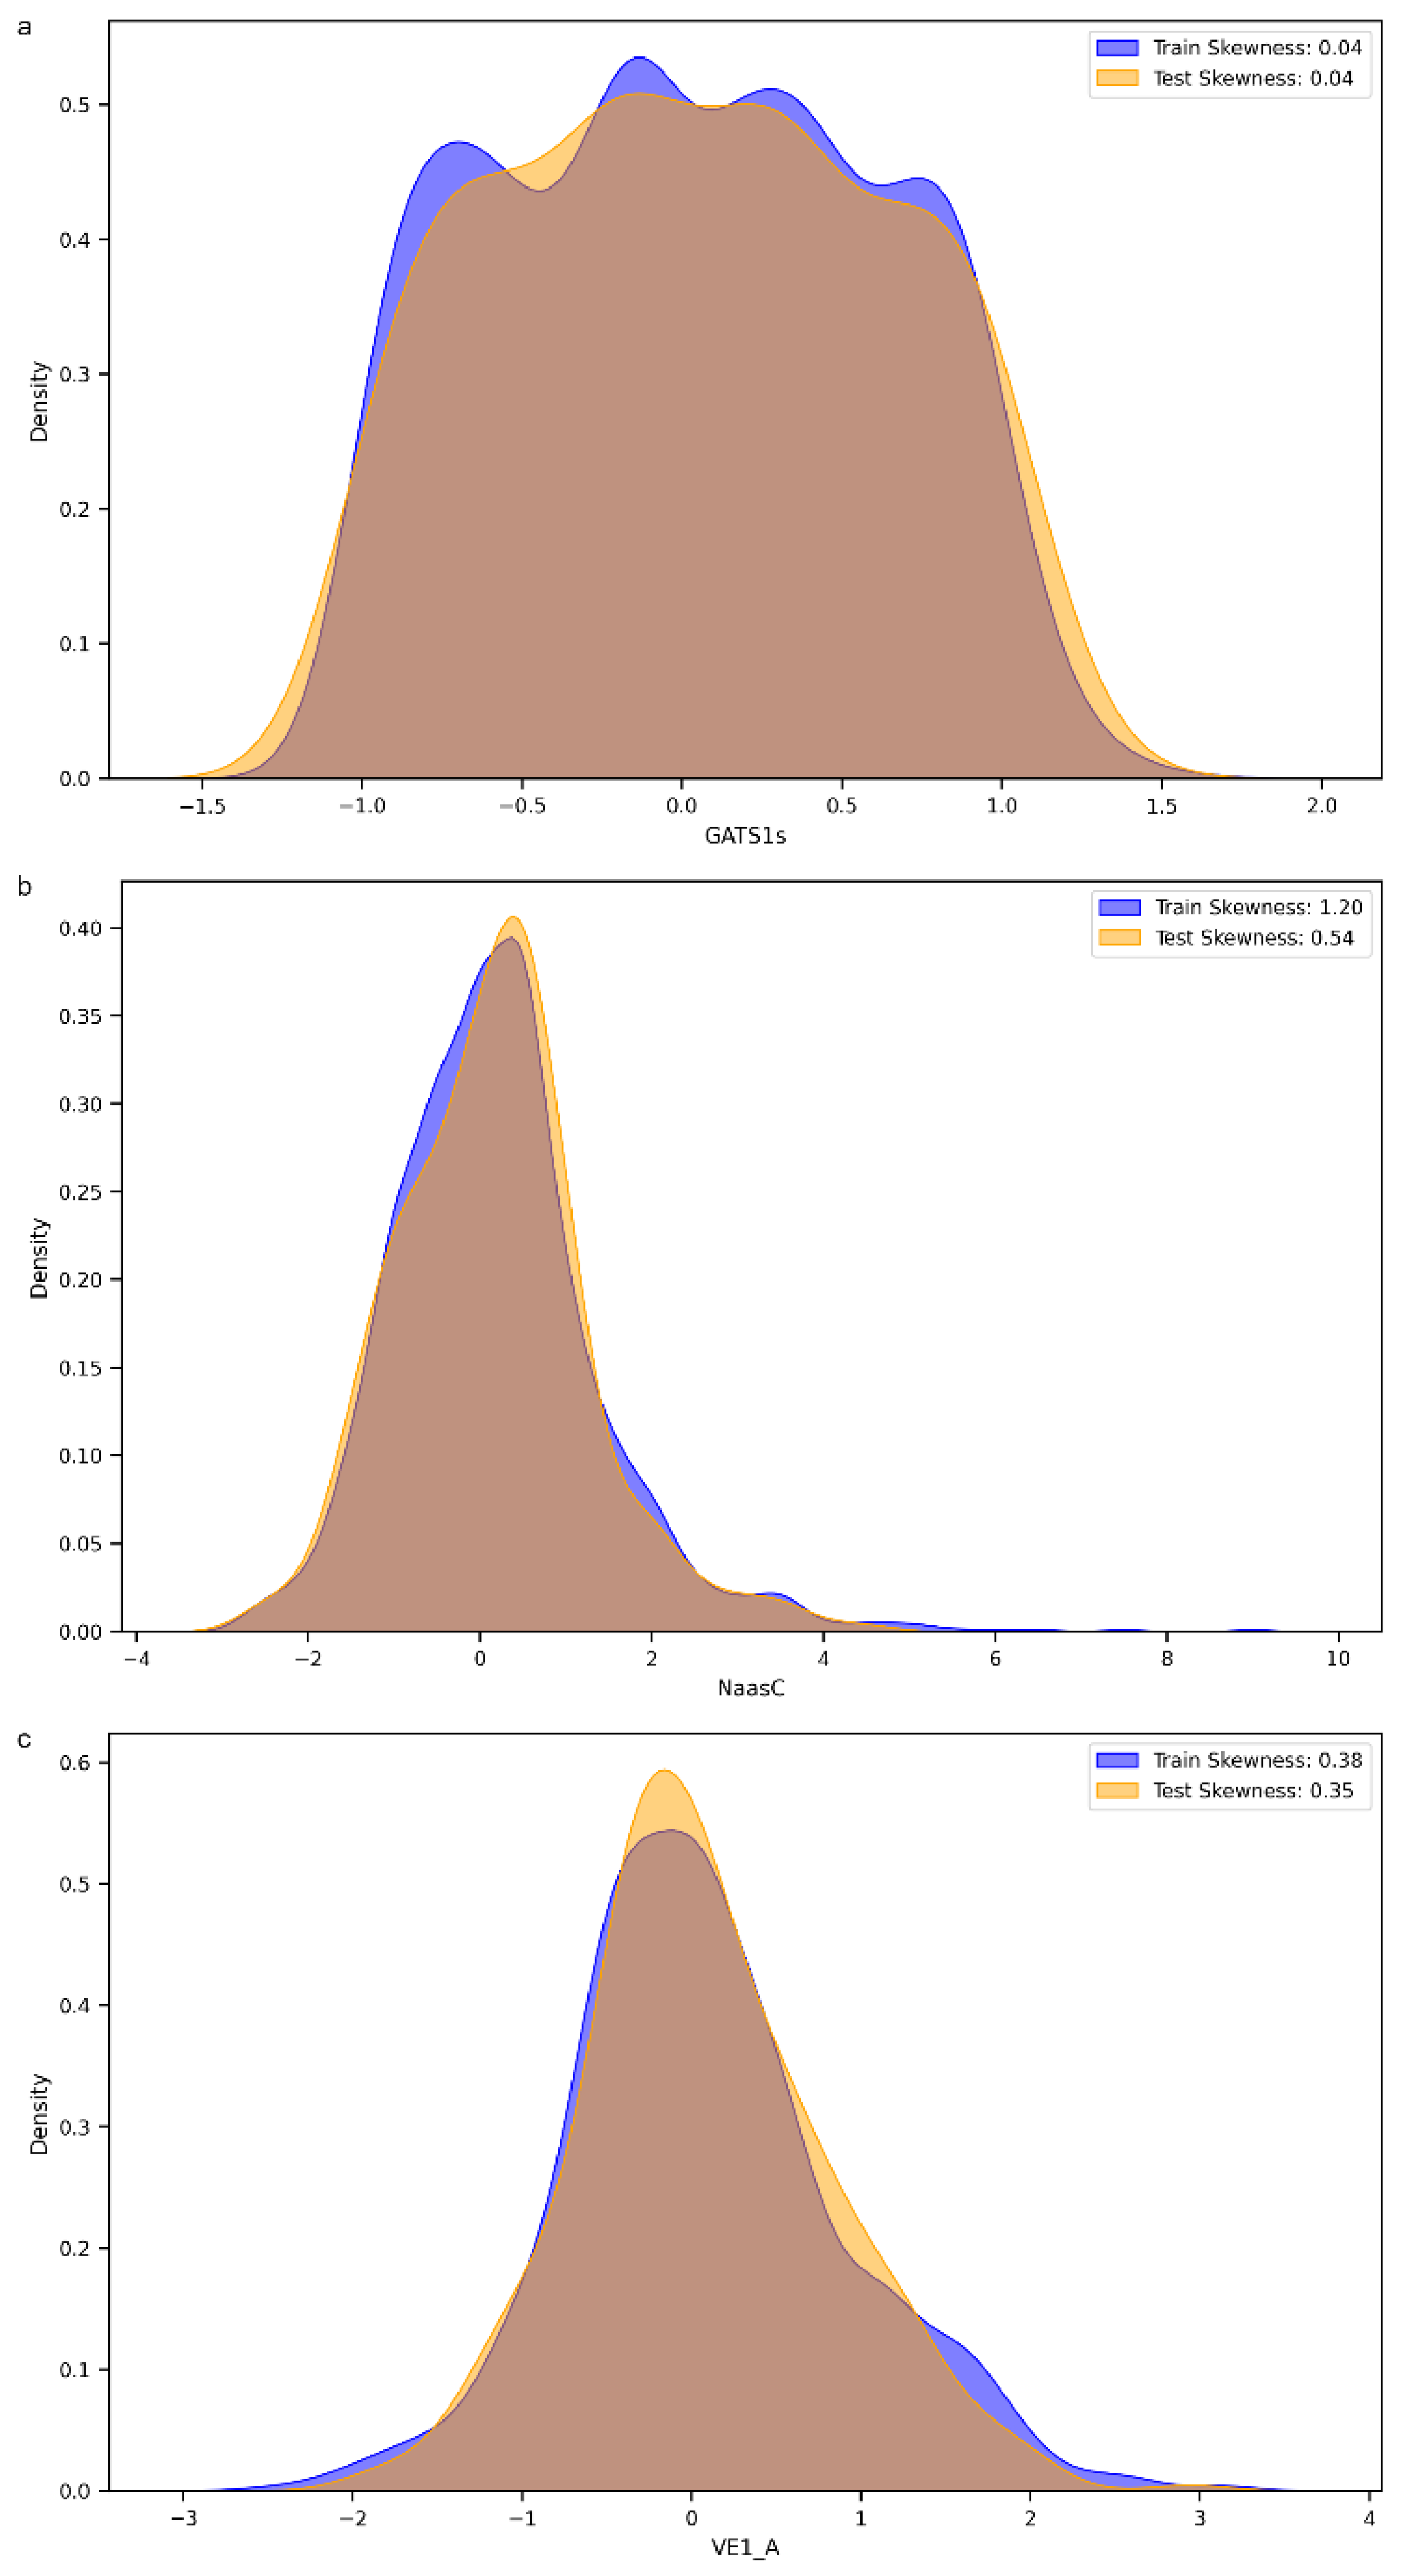
3.2. Feature Importance
3.3. Applications and Limitations
4. Conclusions
Author Contributions
Funding
Institutional Review Board Statement
Informed Consent Statement
Data Availability Statement
Acknowledgments
Conflicts of Interest
Abbreviations
| Adaboost | Adaptive Boosting Digital |
| AD | Applicability domain |
| DPPH | 1,1-Diphenyl-2-picrylhydrazyl |
| GB | Gradient Boosting |
| IC50 | Half-maximal inhibitory concentration |
| k-NN | k-nearest neighbor |
| MAE | Mean Absolute Error |
| MI | Mutual information |
| NAMs | New approach methodologies |
| PBPK | Physiologically Based Pharmacokinetic |
| QSAR | Quantitative Structure–Activity Relationship |
| R&D | Research and Development |
| RF | Random Forest |
| ROS | Reactive Oxygen Species |
| RMSE | Root-Mean-Squared Error |
| XGB | eXtreme Gradient Boosting |
References
- Averill-Bates, D.A. The Antioxidant Glutathione. In Vitamins and Hormones; Elsevier: Amsterdam, The Netherlands, 2023; Volume 121, pp. 109–141. ISBN 978-0-443-15768-4. [Google Scholar]
- Panova, I.G.; Tatikolov, A.S. Endogenous and Exogenous Antioxidants as Agents Preventing the Negative Effects of Contrast Media (Contrast-Induced Nephropathy). Pharmaceuticals 2023, 16, 1077. [Google Scholar] [CrossRef] [PubMed]
- Ghezzi, P. Environmental Risk Factors and Their Footprints In Vivo—A Proposal for the Classification of Oxidative Stress Biomarkers. Redox Biol. 2020, 34, 101442. [Google Scholar] [CrossRef] [PubMed]
- Valko, M.; Leibfritz, D.; Moncol, J.; Cronin, M.T.D.; Mazur, M.; Telser, J. Free Radicals and Antioxidants in Normal Physiological Functions and Human Disease. Int. J. Biochem. Cell Biol. 2007, 39, 44–84. [Google Scholar] [CrossRef] [PubMed]
- Das, S.K.; Vasudevan, D.M. Alcohol-Induced Oxidative Stress. Life Sci. 2007, 81, 177–187. [Google Scholar] [CrossRef]
- Pizzino, G.; Irrera, N.; Cucinotta, M.; Pallio, G.; Mannino, F.; Arcoraci, V.; Squadrito, F.; Altavilla, D.; Bitto, A. Oxidative Stress: Harms and Benefits for Human Health. Oxid. Med. Cell. Longev. 2017, 2017, 8416763. [Google Scholar] [CrossRef]
- EFSA Panel on Dietetic Products, Nutrition and Allergies (NDA). Scientific Opinion on the Substantiation of Health Claims Related to Polyphenols in Olive and Protection of LDL Particles from Oxidative Damage (ID 1333, 1638, 1639, 1696, 2865), Maintenance of Normal Blood HDL-Cholesterol Concentrations (ID 1639), Maintenance of Normal Blood Pressure (ID 3781), “Anti-Inflammatory Properties” (ID 1882), “Contributes to the Upper Respiratory Tract Health” (ID 3468), “Can Help to Maintain a Normal Function of Gastrointestinal Tract” (3779), and “Contributes to Body Defences against External Agents” (ID 3467) Pursuant to Article 13(1) of Regulation (EC) No 1924/2006. EFSA J. 2011, 9, 2033. [Google Scholar] [CrossRef]
- EFSA Panel on Dietetic Products, Nutrition and Allergies (NDA). Scientific Opinion on the Substantiation of Health Claims Related to Vitamin E and Protection of DNA, Proteins and Lipids from Oxidative Damage (ID 160, 162, 1947), Maintenance of the Normal Function of the Immune System (ID 161, 163), Maintenance of Normal Bone (ID 164), Maintenance of Normal Teeth (ID 164), Maintenance of Normal Hair (ID 164), Maintenance of Normal Skin (ID 164), Maintenance of Normal Nails (ID 164), Maintenance of Normal Cardiac Function (ID 166), Maintenance of Normal Vision by Protection of the Lens of the Eye (ID 167), Contribution to Normal Cognitive Function (ID 182, 183), Regeneration of the Reduced Form of Vitamin C (ID 203), Maintenance of Normal Blood Circulation (ID 216) and Maintenance of Normal a Scalp (ID 2873) Pursuant to Article 13(1) of Regulation (EC) No 1924/2006. EFSA J. 2010, 8, 1816. [Google Scholar] [CrossRef]
- Manca, M.L.; Casula, E.; Marongiu, F.; Bacchetta, G.; Sarais, G.; Zaru, M.; Escribano-Ferrer, E.; Peris, J.E.; Usach, I.; Fais, S.; et al. From Waste to Health: Sustainable Exploitation of Grape Pomace Seed Extract to Manufacture Antioxidant, Regenerative and Prebiotic Nanovesicles within Circular Economy. Sci. Rep. 2020, 10, 14184. [Google Scholar] [CrossRef]
- Kurek, M.; Debeaufort, F.; Voilley, A. Achievements in Applications of Antioxidants and Bioactive Compounds in Food: From Agriculture to Health Benefits. Antioxidants 2024, 13, 1247. [Google Scholar] [CrossRef]
- Gini, G. QSAR Methods. In In Silico Methods for Predicting Drug Toxicity; Benfenati, E., Ed.; Methods. In Silico Methods for Predicting Drug Toxicity; Benfenati, E., Ed.; Methods in Molecular Biology; Springer: New York, NY, USA, 2022; Volume 2425, pp. 1–26. ISBN 978-1-0716-1959-9. [Google Scholar]
- Peter, S.C.; Dhanjal, J.K.; Malik, V.; Radhakrishnan, N.; Jayakanthan, M.; Sundar, D. Quantitative Structure-Activity Relationship (QSAR): Modeling Approaches to Biological Applications. In Encyclopedia of Bioinformatics and Computational Biology; Elsevier: Amsterdam, The Netherlands, 2019; pp. 661–676. ISBN 978-0-12-811432-2. [Google Scholar]
- Russell, W.M.S.; Burch, R.L. The Principles of Humane Experimental Technique. Med. J. Aust. 1959, 1, 500. [Google Scholar] [CrossRef]
- Zhao, D.; Zhang, Y.; Chen, Y.; Li, B.; Zhou, W.; Wang, L. Highly Accurate and Explainable Predictions of Small-Molecule Antioxidants for Eight In Vitro Assays Simultaneously through an Alternating Multitask Learning Strategy. J. Chem. Inf. Model. 2024, 64, 9098–9110. [Google Scholar] [CrossRef] [PubMed]
- Halabi Diaz, A.; Galdames, F.; Velásquez, P. Accurate & Simple Open-Sourced No-Code Machine Learning and CDFT Predictive Models for the Antioxidant Activity of Phenols. Comput. Theor. Chem. 2024, 1239, 114782. [Google Scholar] [CrossRef]
- Deng, W.; Chen, Y.; Sun, X.; Wang, L. AODB: A Comprehensive Database for Antioxidants Including Small Molecules, Peptides and Proteins. Food Chem. 2023, 418, 135992. [Google Scholar] [CrossRef] [PubMed]
- AODB Database. Available online: https://aodb.idruglab.cn/ (accessed on 3 April 2024).
- Blois, M.S. Antioxidant Determinations by the Use of a Stable Free Radical. Nature 1958, 181, 1199–1200. [Google Scholar] [CrossRef]
- Pyrzynska, K.; Pękal, A. Application of Free Radical Diphenylpicrylhydrazyl (DPPH) to Estimate the Antioxidant Capacity of Food Samples. Anal. Methods 2013, 5, 4288–4295. [Google Scholar] [CrossRef]
- Heller, S.R.; McNaught, A.; Pletnev, I.; Stein, S.; Tchekhovskoi, D. InChI, the IUPAC International Chemical Identifier. J. Cheminform. 2015, 7, 23. [Google Scholar] [CrossRef]
- Weininger, D. SMILES, a Chemical Language and Information System. 1. Introduction to Methodology and Encoding Rules. J. Chem. Inf. Model. 1988, 28, 31–36. [Google Scholar] [CrossRef]
- Zdrazil, B.; Felix, E.; Hunter, F.; Manners, E.J.; Blackshaw, J.; Corbett, S.; de Veij, M.; Ioannidis, H.; Lopez, D.M.; Mosquera, J.F.; et al. The ChEMBL Database in 2023: A Drug Discovery Platform Spanning Multiple Bioactivity Data Types and Time Periods. Nucleic Acids Res. 2024, 52, D1180–D1192. [Google Scholar] [CrossRef]
- Chieng, A.; Wan, Z.; Wang, S. Recent Advances in Real-Time Label-Free Detection of Small Molecules. Biosensors 2024, 14, 80. [Google Scholar] [CrossRef]
- Todeschini, R.; Consonni, V. Methods and Principles in Medicinal Chemistry. In Molecular Descriptors for Chemoinformatics, 1st ed.; Wiley: Hoboken, NJ, USA, 2009; ISBN 978-3-527-31852-0. [Google Scholar]
- Moriwaki, H.; Tian, Y.-S.; Kawashita, N.; Takagi, T. Mordred: A Molecular Descriptor Calculator. J. Cheminform. 2018, 10, 4. [Google Scholar] [CrossRef]
- Gramatica, P. On the Development and Validation of QSAR Models. In Computational Toxicology: Volume II.; Reisfeld, B., Mayeno, A.N., Eds.; Humana Press: Totowa, NJ, USA, 2013; pp. 499–526. ISBN 978-1-62703-059-5. [Google Scholar]
- Alexander, D.L.J.; Tropsha, A.; Winkler, D.A. Beware of R2: Simple, Unambiguous Assessment of the Prediction Accuracy of QSAR and QSPR Models. J. Chem. Inf. Model. 2015, 55, 1316–1322. [Google Scholar] [CrossRef] [PubMed]
- OECD. Guidance Document on the Validation of (Quantitative) Structure-Activity Relationships [(Q)SAR] Models; OECD Series on Testing and Assessment; No. 69; OECD Publishing: Paris, France, 2007. [Google Scholar]
- Zhao, H.; Song, G.; Zhu, H.; Qian, H.; Pan, X.; Song, X.; Xie, Y.; Liu, C. Pharmacological Effects of Urolithin A and Its Role in Muscle Health and Performance: Current Knowledge and Prospects. Nutrients 2023, 15, 4441. [Google Scholar] [CrossRef] [PubMed]
- Kang, I.; Buckner, T.; Shay, N.F.; Gu, L.; Chung, S. Improvements in Metabolic Health with Consumption of Ellagic Acid and Subsequent Conversion into Urolithins: Evidence and Mechanisms12. Adv. Nutr. 2016, 7, 961–972. [Google Scholar] [CrossRef] [PubMed]
- Marchese, E.; Orlandi, V.; Turrini, F.; Romeo, I.; Boggia, R.; Alcaro, S.; Costa, G. In Silico and In Vitro Study of Antioxidant Potential of Urolithins. Antioxidants 2023, 12, 697. [Google Scholar] [CrossRef]
- Descriptor List—Mordred 1.2.1a1 Documentation. Available online: https://mordred-descriptor.github.io/documentation/master/descriptors.html (accessed on 28 January 2025).
- Hall, L.H.; Kier, L.B. Electrotopological State Indices for Atom Types: A Novel Combination of Electronic, Topological, and Valence State Information. J. Chem. Inf. Comput. Sci. 1995, 35, 1039–1045. [Google Scholar] [CrossRef]

| Algorithm | MAE | RMSE | R2 | R2 in 10-Fold Cross Validation Median Value | R2 in 10-Fold Cross Validation |
|---|---|---|---|---|---|
| Extra Trees | 0.31 | 0.45 | 0.77 | 0.74 | 0.72 ± 0.06 |
| Gradient Boosting | 0.32 | 0.46 | 0.76 | 0.75 | 0.72 ± 0.05 |
| XGB | 0.33 | 0.47 | 0.75 | 0.74 | 0.73 ± 0.04 |
| Random Forest | 0.33 | 0.48 | 0.74 | 0.69 | 0.65 ± 0.08 |
| k-NN | 0.33 | 0.50 | 0.72 | 0.63 | 0.63 ± 0.07 |
| Adaboost | 0.47 | 0.61 | 0.58 | 0.55 | 0.53 ± 0.08 |
| Decision Tree | 0.46 | 0.67 | 0.49 | 0.30 | 0.26 ± 0.10 |
| Ridge | 0.51 | 0.70 | 0.44 | 0.36 | 0.35 ± 0.04 |
| Elastic Net | 0.53 | 0.73 | 0.40 | 0.34 | 0.33 ± 0.06 |
| Bayesian Ridge | 0.54 | 0.74 | 0.38 | 0.32 | 0.31 ± 0.06 |
| Lasso | 0.56 | 0.78 | 0.31 | 0.30 | 0.28 ± 0.04 |
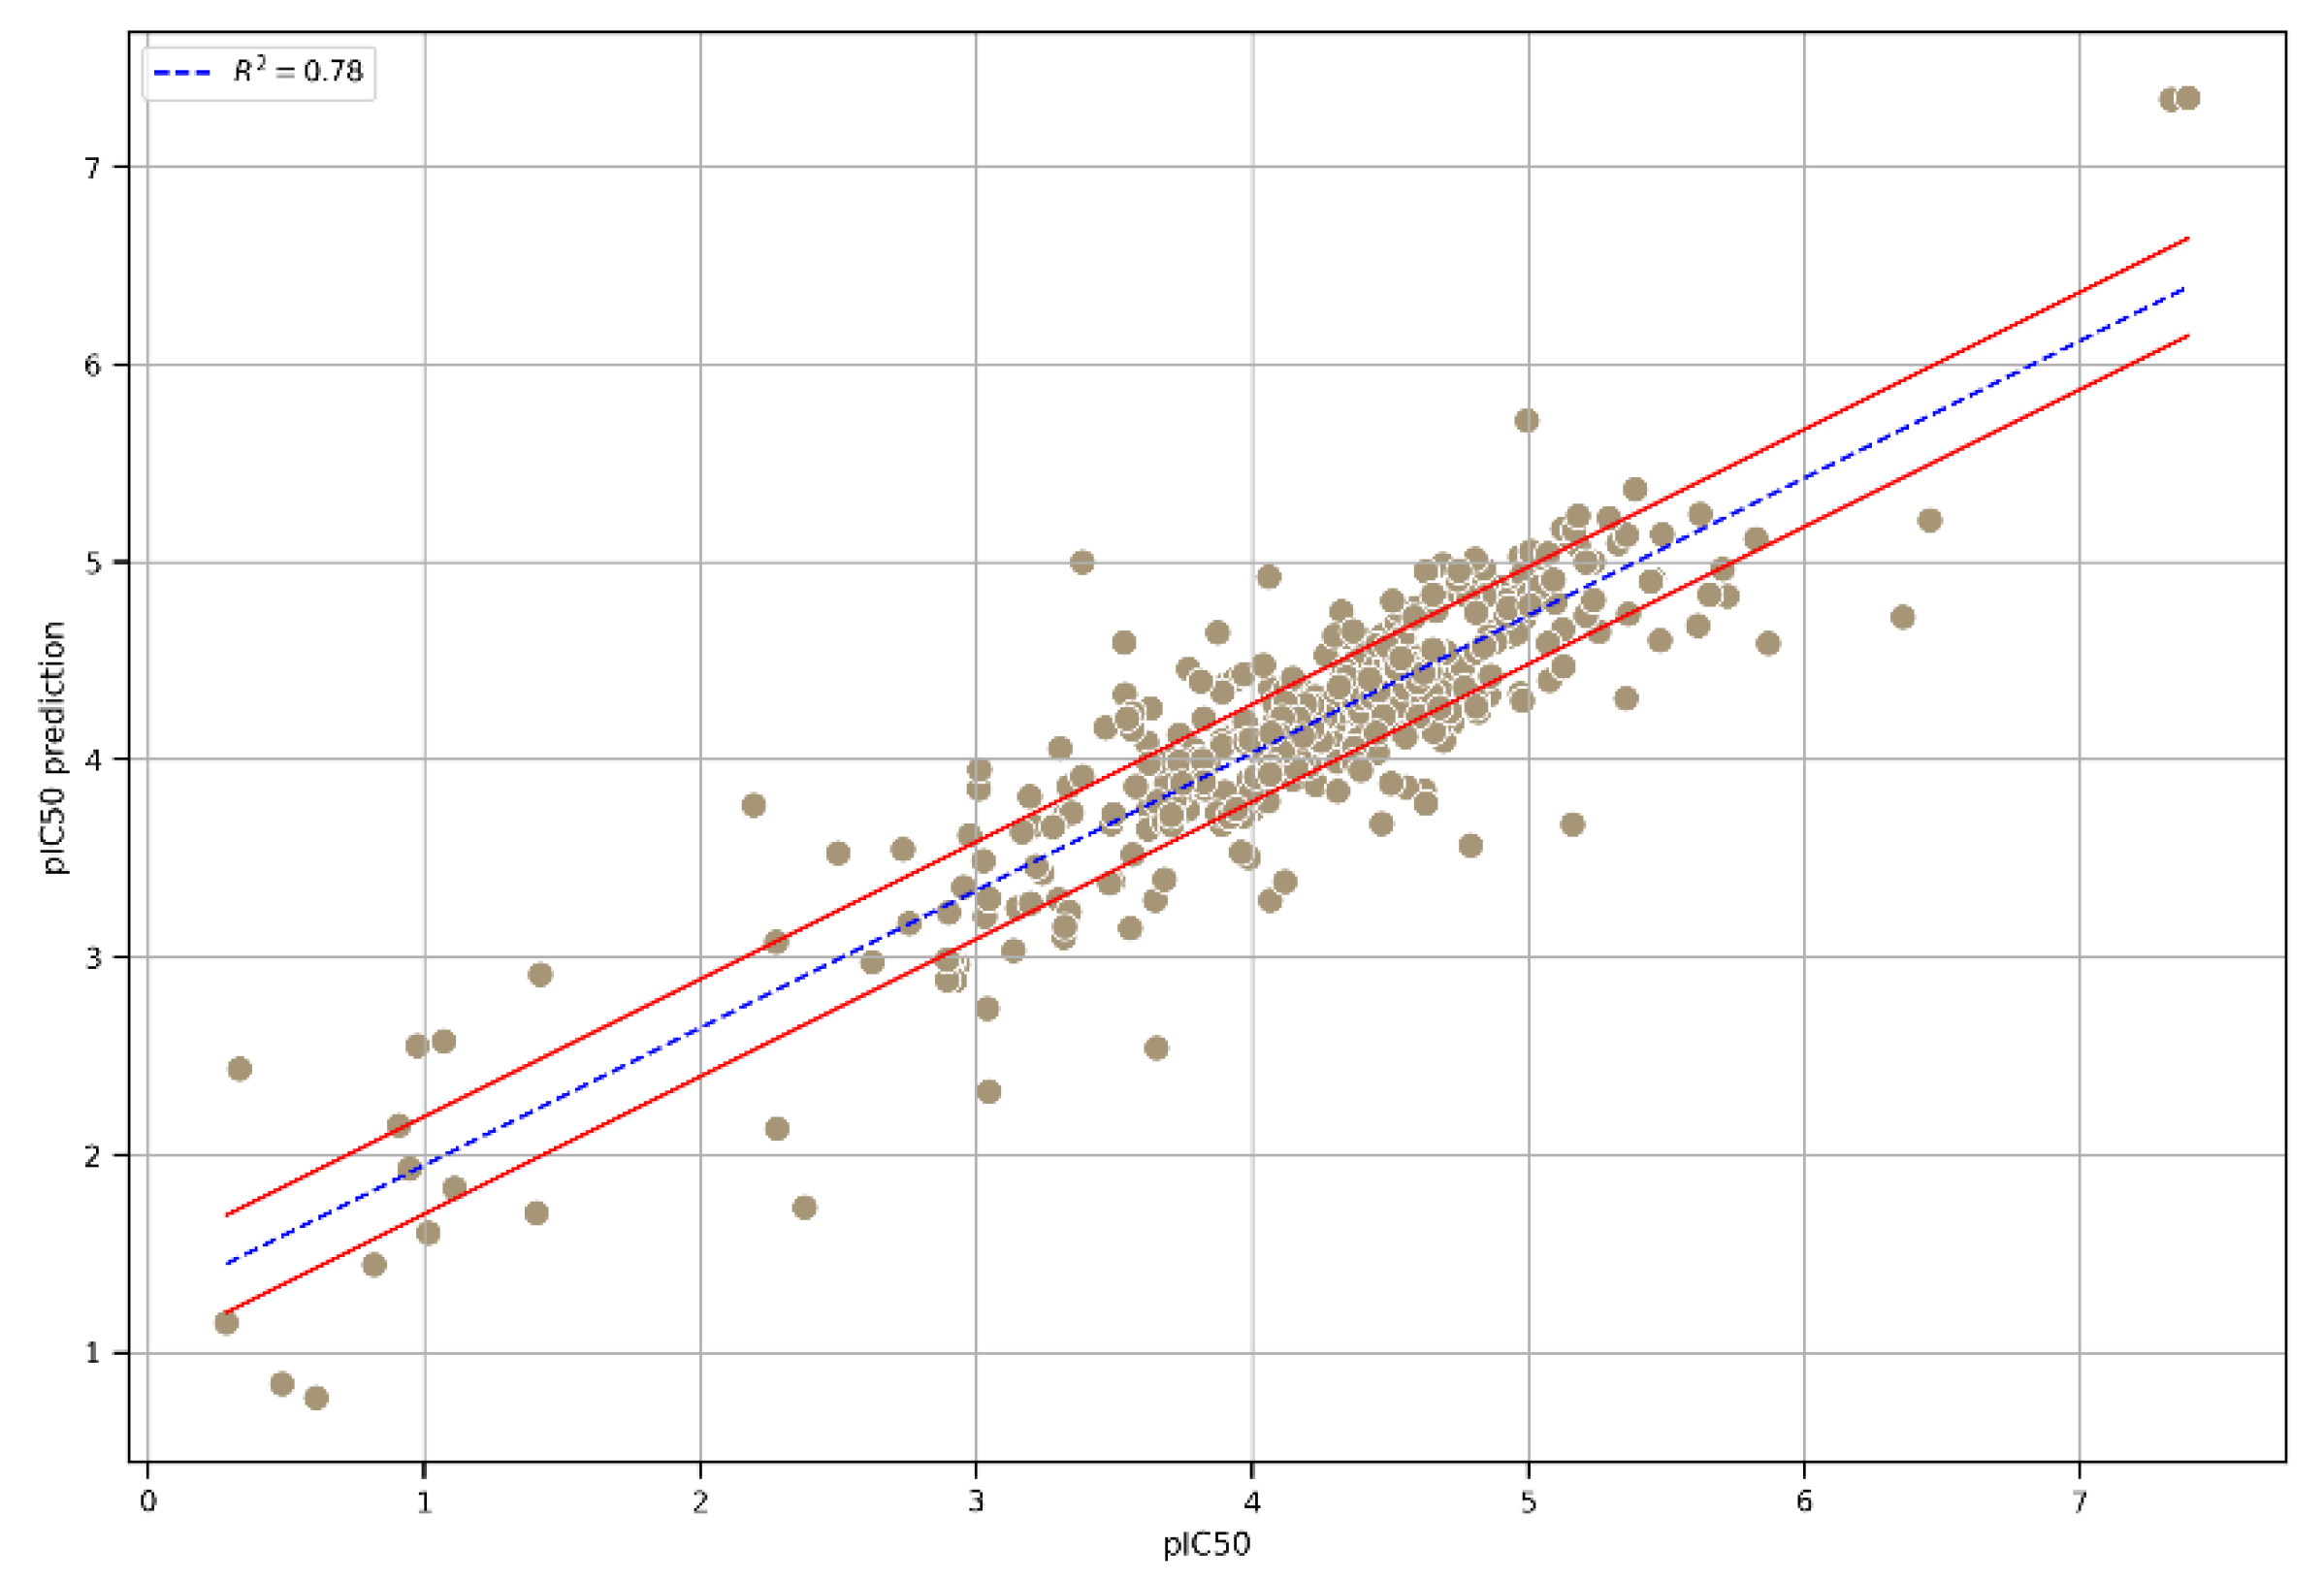
| Integrated | MAE | RMSE | R2 |
|---|---|---|---|
| Extra Trees GB XGB | 0.31 | 0.45 | 0.78 |
| Bounding Box | Centroid-Based | |
|---|---|---|
| Extra Trees | 0.77 | 0.78 |
| GB | 0.76 | 0.77 |
| XGB | 0.75 | 0.76 |
| Integrated | 0.77 | 0.78 |
Disclaimer/Publisher’s Note: The statements, opinions and data contained in all publications are solely those of the individual author(s) and contributor(s) and not of MDPI and/or the editor(s). MDPI and/or the editor(s) disclaim responsibility for any injury to people or property resulting from any ideas, methods, instructions or products referred to in the content. |
© 2025 by the authors. Licensee MDPI, Basel, Switzerland. This article is an open access article distributed under the terms and conditions of the Creative Commons Attribution (CC BY) license (https://creativecommons.org/licenses/by/4.0/).
Share and Cite
Ghironi, S.; Viganò, E.L.; Selvestrel, G.; Benfenati, E. QSAR Models for Predicting the Antioxidant Potential of Chemical Substances. J. Xenobiot. 2025, 15, 80. https://doi.org/10.3390/jox15030080
Ghironi S, Viganò EL, Selvestrel G, Benfenati E. QSAR Models for Predicting the Antioxidant Potential of Chemical Substances. Journal of Xenobiotics. 2025; 15(3):80. https://doi.org/10.3390/jox15030080
Chicago/Turabian StyleGhironi, Sofia, Edoardo Luca Viganò, Gianluca Selvestrel, and Emilio Benfenati. 2025. "QSAR Models for Predicting the Antioxidant Potential of Chemical Substances" Journal of Xenobiotics 15, no. 3: 80. https://doi.org/10.3390/jox15030080
APA StyleGhironi, S., Viganò, E. L., Selvestrel, G., & Benfenati, E. (2025). QSAR Models for Predicting the Antioxidant Potential of Chemical Substances. Journal of Xenobiotics, 15(3), 80. https://doi.org/10.3390/jox15030080