Article

Random Forest Clustering Identifies Three Subgroups of β-Thalassemia with Distinct Clinical Severity

by
Angela Vitrano
1,†,
Khaled M. Musallam
2,†,
Antonella Meloni
3,
Sebastiano Addario Pollina
4,
Mehran Karimi
5,
Amal El-Beshlawy
6,
Mahmoud Hajipour
7,
Vito Di Marco
8,
Saqib Hussain Ansari
9,
Aldo Filosa
10,
Paolo Ricchi
10,
Adriana Ceci
11,
Shahina Daar
12,13,
Efthymia Vlachaki
14,
Sylvia Titi Singer
15,
Zaki A. Naserullah
16,
Alessia Pepe
3,
Salvatore Scondotto
4,
Gabriella Dardanoni
4,
Fedele Bonifazi
11,
Vijay G. Sankaran
17,18,19,
Elliott Vichinsky
15,
Ali T. Taher
20,
Aurelio Maggio
1,* and
International Working Group on Thalassemia (IWG-THAL)
add Show full author list remove Hide full author list
1
Campus of Haematology Franco and Piera Cutino, AOOR Villa Sofia-V. Cervello, 90146 Palermo, Italy
2
Thalassemia Center, Burjeel Medical City, Abu Dhabi 92510, United Arab Emirates
3
MRI Unit, Fondazione G. Monasterio CNR-Regione Toscana, 56124 Pisa, Italy
4
D.A.S.O.E, Regione Siciliana, 90145 Palermo, Italy
5
Haematology Research Center, Shiraz University of Medical Sciences, Shiraz 71348-14336, Iran
6
Department of Pediatric Haematology, Faculty of Medicine, Cairo University, Cairo 12613, Egypt
7
Pediatric Gastroenterology, Hepatology and Nutrition Research Center, Research Institute for Children’s Health, Shahid Beheshti University of Medical Sciences, Tehran 19857-17443, Iran
8
Sezione di Gastroenterologia e Epatologia, Dipartimento Biomedico di Medicina Interna e Specialistica, University of Palermo, 90133 Palermo, Italy
9
Children’s Hospital Karachi (CHK), Karachi 75300, Pakistan
10
Rare Blood Cell Disease Unit, “Cardarelli” Hospital, 80131 Naples, Italy
11
Fondazione per la Ricerca Farmacologica Gianni Benzi Onlus, 70010 Valenzano, Italy
12
Department of Haematology, College of Medicine and Health Sciences, Sultan Qaboos University, Muscat 123, Oman
13
Wallenberg Research Centre, Stellenbosch Institute for Advanced Study, Stellenbosch University, Stellenbosch 7600, South Africa
14
Thalassaemia Unit, Ippokratio University Hospital, 546 42 Thessaloniki, Greece
15
Division of Hematology-Oncology, Department of Pediatrics, University of California San Francisco, UCSF Benioff Children’s Hospital Oakland, Oakland, CA 94609, USA
16
Dammam Maternity and Child Hospital, Dammam 32253, Saudi Arabia
17
Division of Hematology/Oncology, Boston Children’s Hospital and Department of Pediatric Oncology, Dana-Farber Cancer Institute, Harvard Medical School, Boston, MA 02115, USA
18
Broad Institute of MIT and Harvard, Cambridge, MA 02142, USA
19
Harvard Stem Cell Institute, Cambridge, MA 02138, USA
20
Department of Internal Medicine, American University of Beirut Medical Center, Beirut 11072020, Lebanon
*
Author to whom correspondence should be addressed.
These authors contributed equally to this work.
All the authors are belonging to the International working group on Thalassemia.
Thalass. Rep. 2022, 12(1), 14-23; https://doi.org/10.3390/thalassrep12010004
Submission received: 7 January 2022 / Revised: 7 February 2022 / Accepted: 8 February 2022 / Published: 18 February 2022

Abstract

:
In this work, we aimed to establish subgroups of clinical severity in a global cohort of β-thalassemia through unsupervised random forest (RF) clustering. We used a large global dataset of 7910 β-thalassemia patients and evaluated 19 indicators of phenotype severity (IPhS) to determine their contribution and relatedness in grouping β-thalassemia patients into clusters using RF analysis. RF clustering suggested that three clusters with minimal overlapping exist (classification error rate: 4.3%), and six important IPhS were identified: the current age of the patient, the mean serum ferritin level, the age at diagnosis, the age at first transfusion, the age at first iron chelation, and the number of complications. Cluster 3 represented patients with early initiation of transfusion and iron chelation, considerable iron overload, and early mortality from heart failure. Patients in Cluster 2 had lower serum ferritin levels, although they had a higher number of complications manifesting overtime. Patients in Cluster 1 represented a subgroup with delayed or absent transfusion and iron chelation, but with a high morbidity rate. Hepatic disease and cancer were dominant causes of death in patients in Cluster 1 and 2. Our findings established that patients with β-thalassemia can be clustered into three groups based on six parameters of phenotype severity.

1. Introduction

The β-thalassemias are recessively inherited disorders of hemoglobin synthesis resulting from mutations in the β-globin gene cluster and defective β-globin chain products [1,2]. In homozygous and compound heterozygous patients, the disease is primarily characterized by an imbalance in the α/β-globin chain ratio, ineffective erythropoiesis and peripheral red cell hemolysis, leading to chronic anemia. The severity of anemia and the subsequent requirement for transfusion therapy depend on the severity of inherited β-globin mutations, the co-inheritance of α-thalassemia or genetic determinants that sustain fetal hemoglobin production, as well as other tertiary genetic and environmental factors [3]. Historically, affected patients were commonly classified into two groups, β-thalassemia major or intermedia, based on the time of presentation, severity of anemia, and subsequent dependence on regular transfusion therapy [4]. More recently, this classification was revisited, and the terms transfusion-dependent β-thalassemia (TDT) and non-transfusion-dependent β-thalassemia (NTDT) are now more commonly used to classify patients, as they highlight the essential role of transfusion therapy (or lack thereof) in disease pathophysiology and management needs [5,6].
The modern understanding of NTDT establishes that even without transfusion, these patients can go on to develop multiple serious morbidities attributed to primary iron overload and hypercoagulability; thus, their clinical severity may be worse than previously recognized [5,7,8]. On the contrary, well-managed patients with TDT have seen marked reduction in morbidity and mortality risk from transfusional siderosis in view of advances in iron overload imaging and chelation in the past 20 years [9]. In fact, there is preliminary evidence that prognosis in both patient populations can be similar [10]. Moreover, although the majority of patients with TDT share a relatively similar clinical profile, there seems to be a wider range of disease severity in the NTDT group, with patients at the extreme end of the spectrum potentially requiring regular transfusion therapy to promote growth and development or for morbidity management or prevention [5,11]. Moreover, a considerable subset of patients with NTDT and TDT may transition to the opposite class. Instances of disease progression over time in NTDT have been observed, while patients with TDT responding to novel therapies may end up with considerably reduced or abolished transfusion requirement [6]. Thus, there is a need to explore alternate grouping methods that take into consideration a wider set of demographic, clinical and laboratory parameters that reflect clinical severity. In this work, we aimed to establish subgroups of clinical severity in a global cohort of β-thalassemia through unsupervised random forest (RF) clustering.

2. Materials and Methods

An International Health Repository (IHR) protocol, approved on 25 May 2017, by the Italian Ethical Committee (EudraCT and Sponsor’s Protocol Code Numbers were 2017-004457-17 and 143AOR2017) was established to allow the collection of relevant data [12]. Thalassemia centers of excellence from seven different countries participated in retrospective data collection (Supplementary Table S1).
The dataset included 7910 patients who attended the centers from the time of their diagnosis with β-thalassemia onwards. β-thalassemia diagnosis was confirmed by clinical and molecular studies at all participating centers. For this work, the retrieved data represented patients’ characteristics at the time of diagnosis as well as their clinical profile at a specific date of last observation or death between July 1997 and October 2018. For continuous variables, a mean value of the last five observations was reported for patients with more than one measurement.
Nineteen different variables were considered for each patient, and these were defined a priori during the International Working Group on Thalassemia (IWG-THAL) meeting held in Palermo (Italy) on 15 and 16 September 2017. IWG-THAL members, with decades-long experience in thalassemia care, agreed on these 19 variables for further exploration as indicators of phenotype severity (IPhS), primarily based on their clinical expertise. These included key demographic, clinical, and laboratory findings at diagnosis and follow-up, as summarized in Table 1.

2.1. Statistical Analysis

A combination of cluster and classification analyses was applied in order to uncover potential subgroups of β-thalassemia. The cluster analysis approach was formally used to find the underlying population substructure using IPhS data without considering prior information (unsupervised method) [13,14,15,16,17,18]. Grouping then followed based on predetermined subgroups, while developing criteria for distinguishing between subgroups (supervised method) [14,16,19].
Our statistical approach involved the application of the following assessments: (1) the identification of a population substructure and determination of the best number of clusters with the use of NbClust R Package [20]; (2) the grouping of patients based on their IPhS using unsupervised RF [13,14,15,16,17,18] and partitioning around medoids (PAM) clustering [13,14,16]; (3) the assessment of the accuracy of the used methodology by determining the classification error rate using supervised RF analysis; and (4) the examination of the most important IPhS differences among clusters.

2.1.1. NbClust Procedure

To find the optimal number of clusters in our population, the NbClust package [20] was used. It provides 30 indices which determine the number of clusters in a dataset, and it also offers the best clustering scheme from different results to the user. This enables the user to simultaneously evaluate several clustering schemes while varying the number of clusters, to help in determining the most appropriate number of clusters for the dataset of interest. The distance measures available in the NbClust package are: Euclidean distance, maximum distance, Manhattan distance, Canberra distance, binary distance and Minkowski distance. Several agglomeration methods are also provided by the NbClust package, namely: Ward [21], single [22,23], complete [24], average [23], McQuitty [25], median [26], and centroid [23]. All of these methods and distance measures were described in detail by Charrad M et al. [20].

2.1.2. Random Forest Clustering

To achieve the goal of our study, we combined unsupervised RF and PAM methods. In particular, the unsupervised RF algorithm was used to generate the dissimilarity matrix using all listed IPhS, and then we used the produced dissimilarity matrix as an input to the PAM technique. Finally, the full dataset was split into test and validation sets, where a supervised RF methodology [19] was applied. The unsupervised random forest dissimilarity measure was used because it has several advantages [13,14]: (a) it is not sensitive to skewed covariate distributions; (b) it also provides a natural measure of variable importance measured with the Gini coefficient; (c) it does not require the user to specify threshold values, but it automatically dichotomizes the variable expressions in a principled, data-driven way; and (d) it can accommodate missing values. On the other hand, the PAM method was used because it is not as sensitive to outliers as methods based on means, and because it can accommodate mixed data types and is not limited to continuous variables.
Supervised RF is a grouping analysis where the outcome needs to be specified. In this study, the outcome was given by the resultant clusters of the unsupervised RF-PAM procedure. Random forests tend to be very accurate compared with other classification methods. Additionally, they can handle large problems (many observations and variables) and large amounts of missing data.

2.1.3. Identification of the Most Important IPhS

Unsupervised RF procedure provides a natural measure of variable importance given by the Gini index. Based on the Gini score, it was possible to identify the most important IPhS.

2.1.4. Random Forest Using the Most Important IPhS

The unsupervised RF and PAM analyses were repeated using only the most important IPhS. Finally, the supervised RF methodology was applied, splitting the full dataset into test and validation sets, where the validation sample was used to calculate the predictive accuracy in terms of classification error rate.

2.1.5. Other Statistical Methods
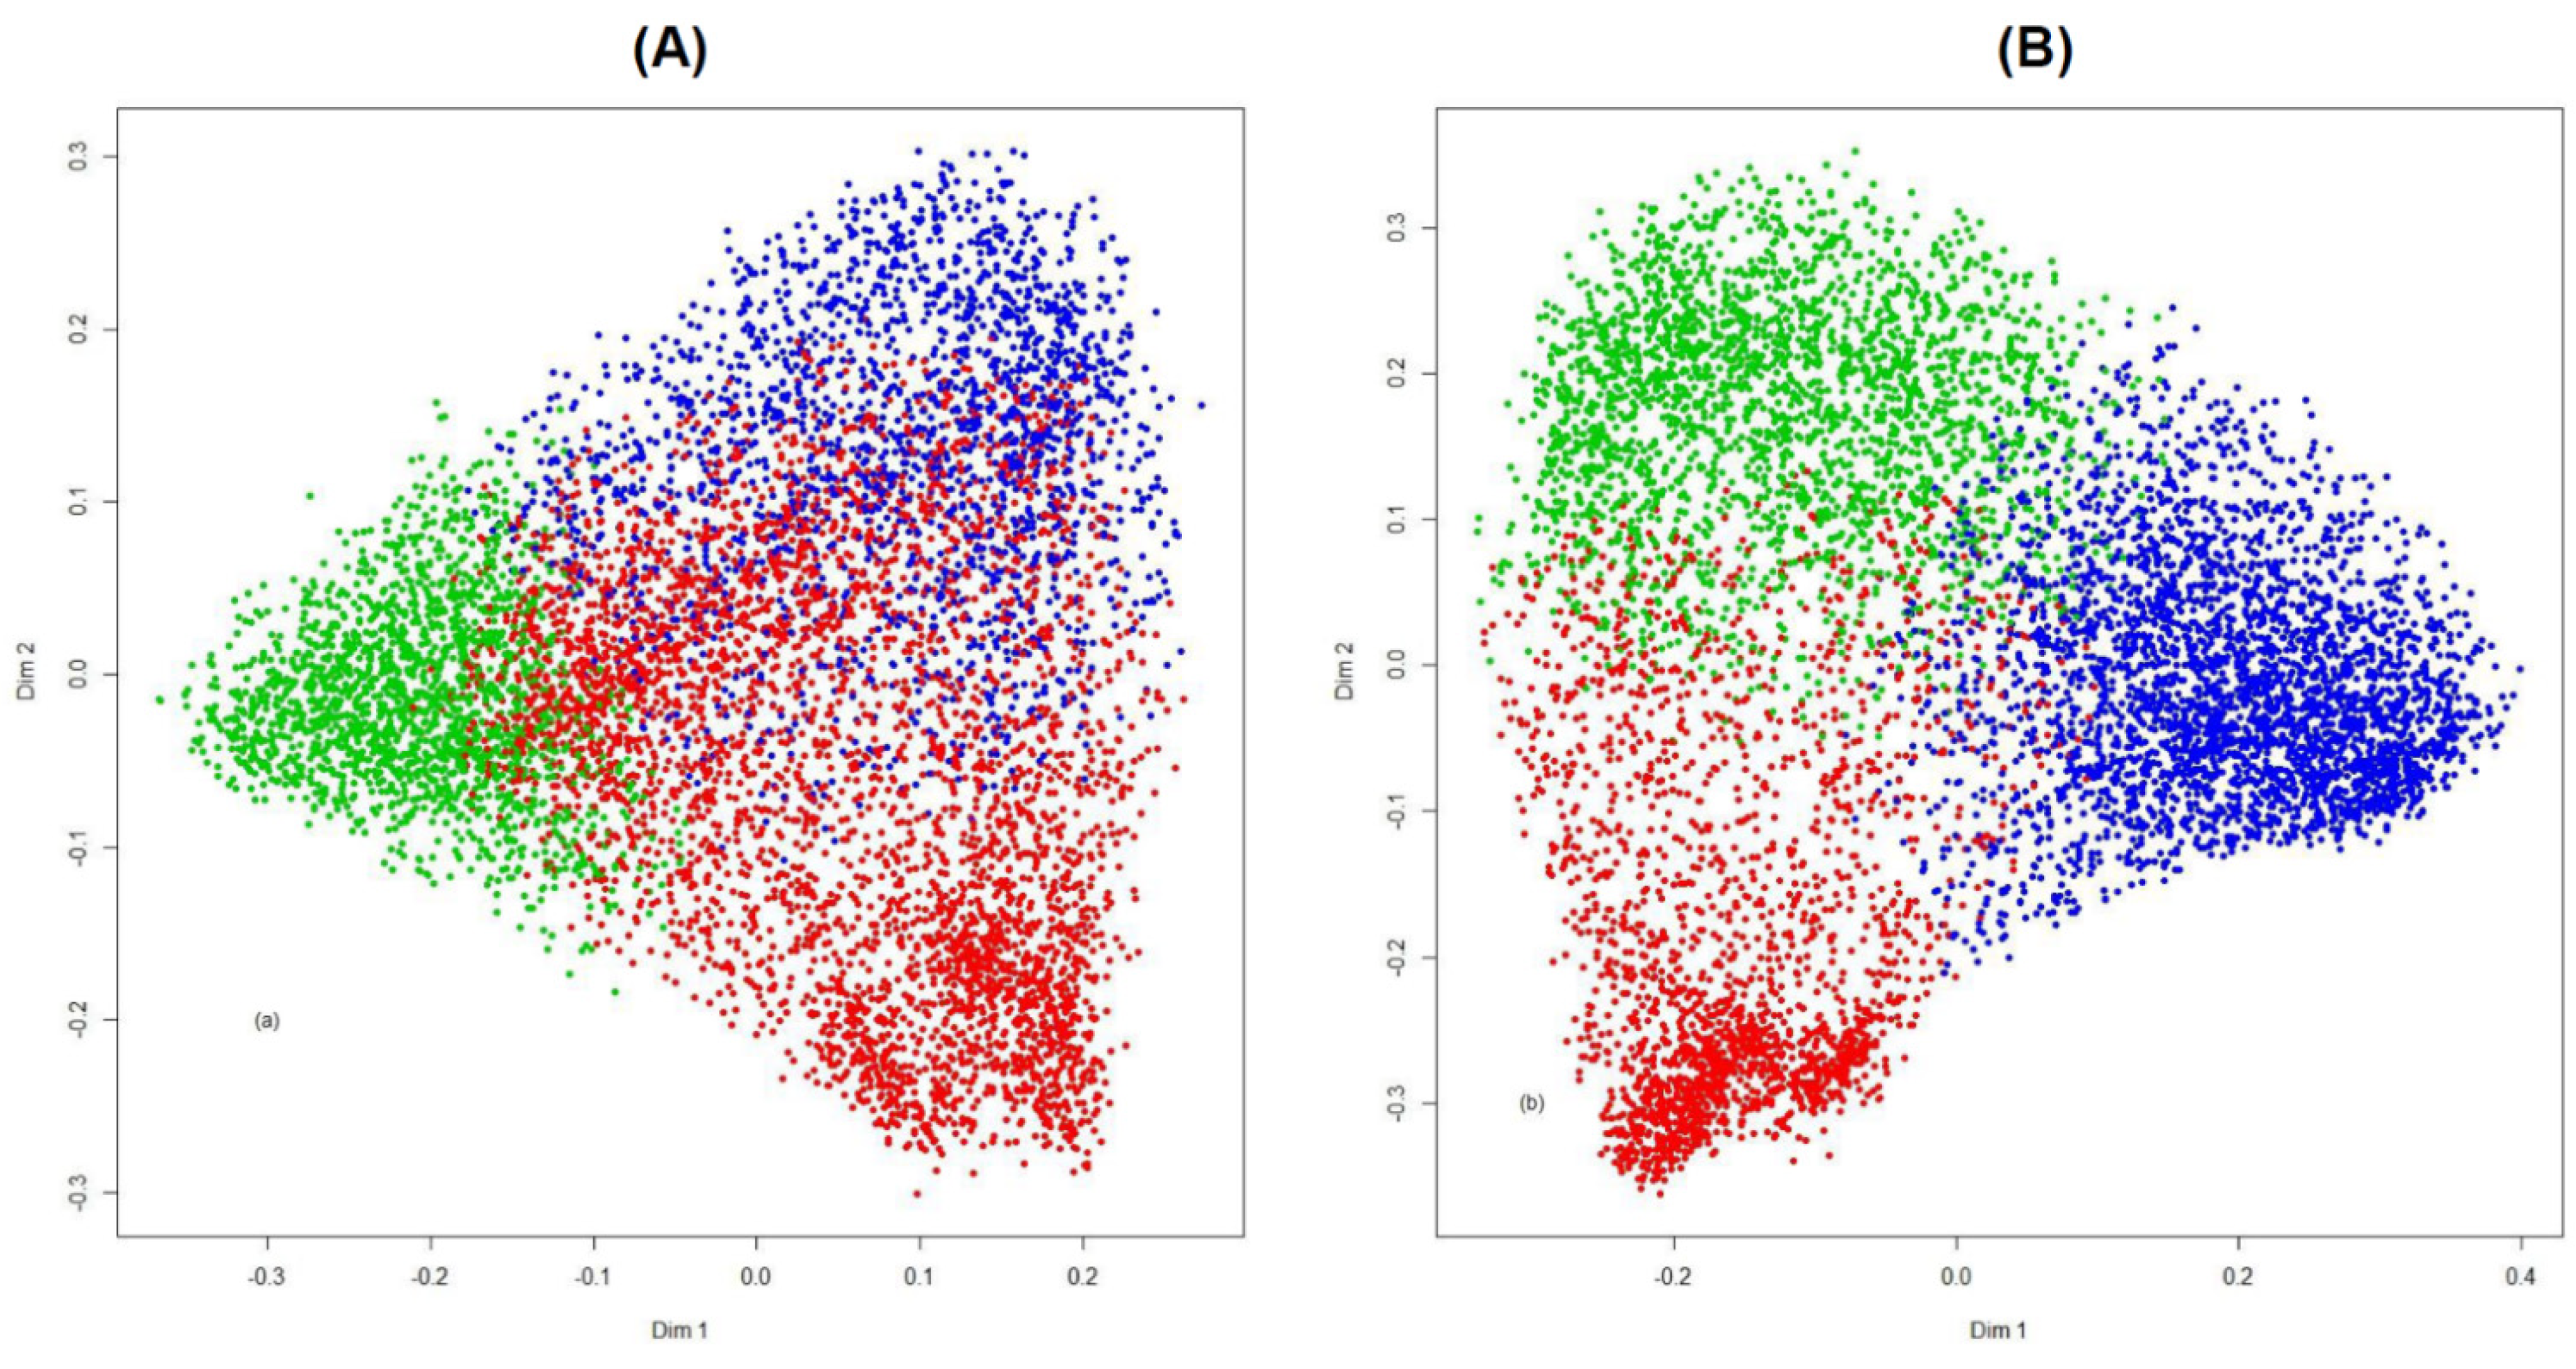
Several statistical methods were used to describe clusters in terms of IPhS: variables were treated as continuous normally distributed, continuous non-normally distributed, or categorical; the following descriptive or bivariate tests were applied accordingly: mean, standard deviation, and t-test or ANOVA; median, 1st and 3rd quartiles, and Kruskal–Wallis test; and absolute or relative frequencies, and chi-squared or Fisher’s exact test. All p-values were two-sided, and a p-value < 0.05 was considered significant. The R Software was used for the application of all these statistical analyses. Additional information is also available in the Supplementary Methods.

3. Results

The NbClust method showed that β-thalassemia patients could be grouped in three clusters, based on the majority rules (nine for average, seven for k-means, and seven for Ward D) (Supplementary Table S2). Considering that three clusters could exist, RF-PAM clustering of all patients was carried out using the 19 IPhS simultaneously. The PAM algorithm produced three clusters of 4040, 1863, and 2007 patients each. The resultant Gini scores showed that six IPhS could be considered the most important, including the current age of the patient, the mean SF level, the age at diagnosis, the age at first transfusion, the age at first iron chelation, and the number of complications (Figure 1). The RF-PAM analysis was repeated using the six most important IPhS only and produced three clusters with 2156, 2454, and 3300 patients each. The results of the two RF-PM analyses (with the original 19 and the most important six IPhS) are shown in Figure 2, where patients are represented as points in two-dimensional scaling plots and the distances between the data points reflect the random forest dissimilarities between them.
Supervised RF was performed considering as the outcome the three obtained clusters and evaluating simultaneously the six most important IPhS. The procedure showed a predictive accuracy of 95.7% with a classification error rate of 4.3% (Table 2).
Comparison of the six most important IPhS between the three clusters is summarized in Table 3. Patients in Cluster 3 were significantly younger than patients in Clusters 1 and 2. The mean age at diagnosis was comparable between Clusters 2 and 3, but was significantly delayed in Cluster 1. The mean age at first transfusion and iron chelation was marginally delayed in Cluster 2 compared with Cluster 3, but was significantly delayed in Cluster 1. The mean serum ferritin level was significantly higher in Cluster 3 and comparable in Clusters 1 and 2. The mean number of complications was highest among Cluster 2 patient, followed by Cluster 1 and Cluster 3.
Causes of death in the three clusters are summarized in Table 4. The age of death was significantly lower in patients in Clusters 3 and 2 compared with Cluster 1. Although heart failure remains the leading single cause of death in the three clusters, deaths from liver disease or hepatocellular carcinoma are dominant in Cluster 1 and Cluster 2 compared with Cluster 3. Similarly, a significantly higher proportion of patients died due to other cancers in Clusters 1 and 2 compared with 3.

4. Discussion

Our findings establish, in an evidence-based approach, that patients with β-thalassemia can be clustered into three groups based on six parameters of phenotype severity. Clustering proved robust based on a low error rate.
The first question to ask is how do these clusters relate to real-life scenarios and existing classifications of β-thalassemia? Cluster 3 patients, with the shortest survival, seem to represent a group of young patients who despite being diagnosed and started on transfusion and iron chelation early, continue to have high serum ferritin levels and associated mortality from cardiac siderosis and heart failure. These could possibly represent sub-optimally chelated patients with TDT. Cluster 2 patients, however, have comparable age at diagnosis and initiation of transfusion and iron chelation (marginally delayed compared with Cluster 3), and yet have more favorable serum ferritin levels, probably reflecting a well-chelated cohort of patients with TDT [27]. They may also represent NTDT patients who eventually end up receiving regular transfusion and iron chelation therapy and have improved survival [28]. Longer survival in these patients allows more complications to manifest, and the emergence of other causes of death such as hepatic disease and cancer, which require long-term exposure to underlying pathophysiology [2]. Finally, Cluster 1 patients represent those patients who are diagnosed later in life and end up receiving transfusion or iron chelation late, if at all. These patients also continue to develop a high number of complications and may have a mortality rate even higher than patients in Cluster 2. This echoes findings in NTDT patients, where the absence of treatment has been strongly associated with a high rate of clinical sequelae attributed to anemia, increased intestinal iron absorption and hypercoagulability [3,28,29,30].
The second important question to ask is where to go next from here? It would be safe to assume that patients with characteristics similar to Cluster 3 have the worst prognosis and may thus require careful attention and intensified therapy. The shorter survival in Cluster 1 patients may also highlight a need for (early) intervention in this patient group to optimize outcomes. Ideally, the identified IPhS in this work can pave the way forward to establish a global prognostic index to classify homozygous and compound heterozygous patients with β-thalassemia into low, intermediate, and high risk for mortality, echoing work of colleagues in myelodysplastic syndromes and myelofibrosis. We have already started such prognostic analysis [12], and further work is ongoing to refine practical utility and ensure alignment with clinical experience with the disease spectrum. Such scoring and classification systems need to be dynamic and allow the observation and measurement of change over time (worsening or improvement), while taking into consideration both natural changes in the disease as well as those attributed to ongoing management and adherence to therapy.
Our work does not come without limitations. The choice of IPhS used in this work was limited by data availability and completeness, and other parameters such as detailed blood transfusion and iron chelation requirements could have been considered. Moreover, although age at diagnosis, first transfusion, and first iron chelation were considered indicators of severity based on expert opinion, they may still be affected by other logistics aspects such as access to care, especially in resource-limited regions. Lastly, it may well be that β-thalassemia falls on a continuous spectrum of severity, and hence grouping patients into classes and categories may not be called for to begin with.

5. Conclusions

In conclusion, our work suggests that age, age at diagnosis and initiation of transfusion and iron chelation therapy, iron overload level, and number of complications are able to distinguish three clusters of phenotype severity in patients with β-thalassemia. These findings warrant further evaluation in longitudinal studies to determine specific thresholds for these (and other) parameters that are linked to poor prognosis, to allow the establishment of a metric score that supports the easy and practical classification of patients.

Supplementary Materials

The following supporting information can be downloaded at: https://www.mdpi.com/article/10.3390/thalassrep12010004/s1, Supplementary Methods, Supplementary Table S1 (Distribution of patients in the thalassemia International Health Repository), Supplementary Table S2 (Results of ‘NbClust’ Package using different types of clustering methods).

Author Contributions

Study design: A.V., K.M.M. and A.M. (Aurelio Maggio). Data collection: A.V., A.M. (Antonella Meloni), S.A.P., M.K., A.E.-B., M.H., V.D.M., S.H.A., A.F., P.R., A.C., S.D., E.V. (Efthymia Vlachaki), S.T.S., Z.A.N., A.P., S.S., G.D., F.B., E.V. (Efthymia Vlachaki) and A.M. (Aurelio Maggio). Data analysis: A.V., K.M.M. Manuscript Drafting: A.V., K.M.M., A.M. (Aurelio Maggio). Data interpretation and manuscript review for intellectual content: A.V., K.M.M., A.M. (Antonella Meloni), S.A.P., M.K., A.E.-B., M.H., V.D.M., S.H.A., A.F., P.R., A.C., S.D., E.V. (Efthymia Vlachaki), S.T.S., Z.A.N., A.P., S.S., G.D., F.B., V.G.S., E.V. (Elliott Vichinsky), A.T.T. and A.M. (Aurelio Maggio). Final approval for submission: all authors. All authors have read and agreed to the published version of the manuscript.

Funding

This research received no external funding.

Institutional Review Board Statement

The study was conducted in accordance with the Declaration of Helsinki and approved by the Italian Ethical Committee (EudraCT and Sponsor’s Protocol Code Numbers: 2017-004457-17 and 143AOR2017).

Informed Consent Statement

All data were anonymized and added to the repository following informed consent by patients or their legal representatives in case of death.

Data Availability Statement

Data were collected and stored on the IHR electronic platform (www.sanitasicilia.eu/IWG (accessed on 2 November 2021)) and are available upon request from the corresponding author.

Acknowledgments

The authors would like to thank all patients for agreeing to participate in this study. The support by Foundation Franco and Piera Cutino is appreciated.

Conflicts of Interest

Khaled M. Musallam is a consultant for Novartis, Celgene Corp (Bristol Myers Squibb), Agios Pharmaceuticals, CRISPR Therapeutics and Vifor Pharma. Antonella Meloni received speakers’ honoraria from Chiesi Farmaceutici S.p.A. Efthymia Vlachaki received hononaria from DEMO S.A. Pharmaceutical Industry and Novartis. Alessia Pepe is the principal investigator of the MIOT project that receives ‘non-profit support’ from industrial sponsorships (Chiesi Farmaceutici S.p.A. and Bayer) and she received speakers’ honoraria from Chiesi Farmaceutici S.p.A. Ali T. Taher is a consultant for Novartis, Celgene Corp (Bristol Myers Squibb), Vifor Pharma, Silence Therapeutics and Ionis Pharmaceuticals; and received research funding from Novartis, Celgene Corp (Bristol Myers Squibb), La Jolla Pharmaceutical Company, Roche, Protagonist Therapeutics and Agios Pharmaceuticals. Vijay G Sankaran serves as an advisor to and/or has equity in Novartis, Forma, Cellarity, Ensoma, and Branch Biosciences. Aurelio Maggio is a member of advisory boards for Novartis, Celgene Corp (Bristol Meyers Squibb) and Bluebird Bio. The remaining authors have no conflicts of interest to disclose.

References

  1. Galanello, R.; Origa, R. Beta-thalassemia. Orphanet J. Rare Dis. 2010, 5, 11. [Google Scholar] [CrossRef] [PubMed] [Green Version]
  2. Taher, A.T.; Musallam, K.M.; Cappellini, M.D. β-Thalassemias. N. Engl. J. Med. 2021, 384, 727–743. [Google Scholar] [CrossRef] [PubMed]
  3. Taher, A.T.; Weatherall, D.J.; Cappellini, M.D. Thalassaemia. Lancet 2018, 391, 155–167. [Google Scholar] [CrossRef]
  4. Steinberg, M.H.; Forget, B.G.; Higgs, D.R.; Weatherall, D.J. Disorders of Hemoglobin: Genetics Pathophysiology, and Clinical Management, 2nd ed.; Cambridge University Press: Cambridge, UK, 2009. [Google Scholar]
  5. Musallam, K.M.; Rivella, S.; Vichinsky, E.; Rachmilewitz, E.A. Non-transfusion-dependent thalassemias. Haematologica 2013, 98, 833–844. [Google Scholar] [CrossRef] [Green Version]
  6. Musallam, K.M.; Cappellini, M.D.; Viprakasit, V.; Kattamis, A.; Rivella, S.; Taher, A.T. Revisiting the non-transfusion-dependent (NTDT) vs. transfusion-dependent (TDT) thalassemia classification 10 years later. Am. J. Hematol. 2021, 96, E54–E56. [Google Scholar] [CrossRef]
  7. Vichinsky, E. Non-transfusion-dependent thalassemia and thalassemia intermedia: Epidemiology, complications, and management. Curr. Med. Res. Opin. 2016, 32, 191–204. [Google Scholar] [CrossRef]
  8. Viprakasit, V.; Tyan, P.; Rodmai, S.; Taher, A.T. Identification and key management of non-transfusion-dependent thalassaemia patients: Not a rare but potentially under-recognised condition. Orphanet J. Rare Dis. 2014, 9, 131. [Google Scholar] [CrossRef] [Green Version]
  9. Kattamis, A.; Forni, G.L.; Aydinok, Y.; Viprakasit, V. Changing patterns in the epidemiology of beta-thalassemia. Eur. J. Haematol. 2020, 105, 692–703. [Google Scholar] [CrossRef]
  10. Vitrano, A.; Calvaruso, G.; Lai, E.; Colletta, G.; Quota, A.; Gerardi, C.; Concetta Rigoli, L.; Pitrolo, L.; Cuccia, L.; Gagliardotto, F.; et al. The era of comparable life expectancy between thalassaemia major and intermedia: Is it time to revisit the major-intermedia dichotomy? Br. J. Haematol. 2017, 176, 124–130. [Google Scholar] [CrossRef] [Green Version]
  11. Taher, A.; Musallam, K.; Cappellini, M.D. Guidelines for the Management of Non Transfusion Dependent Thalassaemia (NTDT); Thalassaemia International Federation: Nicosia, Cyprus, 2017; Volume 2. [Google Scholar]
  12. Vitrano, A.; Meloni, A.; Addario Pollina, W.; Karimi, M.; El-Beshlawy, A.; Hajipour, M.; Di Marco, V.; Hussain Ansari, S.; Filosa, A.; Ricchi, P.; et al. A complication risk score to evaluate clinical severity of thalassaemia syndromes. Br. J. Haematol. 2021, 192, 626–633. [Google Scholar] [CrossRef]
  13. Shi, T.; Horvath, S. Unsupervised learning with random forest predictors. J. Comput. Graph. Stat. 2006, 15, 118–138. [Google Scholar] [CrossRef]
  14. Breiman, L. Random forests. Mach. Lear. 2001, 45, 5–32. [Google Scholar] [CrossRef] [Green Version]
  15. Shi, T.; Horvath, S. Using random forest similarities in unsupervised learning: Applications to microarray data. In Atlantic Symposium on Computational Biology and Genome Informatics (CBGI’03); The Association of Intelligent Machinery: Durham, NC, USA, 2003. [Google Scholar]
  16. Lesmeister, C. Mastering machine learning with R. In Advanced Prediction, Algorithms, and Learning Methods with R, 2nd ed.; Packt Publishing: Birmingham, UK, 2017. [Google Scholar]
  17. Shi, T.; Seligson, D.; Belldegrun, A.S.; Palotie, A.; Horvath, S. Tumor classification by tissue microarray profiling: Random forest clustering applied to renal cell carcinoma. Mod. Pathol. 2005, 18, 547–557. [Google Scholar] [CrossRef] [PubMed] [Green Version]
  18. Kaufman, L.; Rousseeuw, P.J. Finding Groups in Data: An. Introduction to Cluster Analysis; Wiley: New York, NY, USA, 1990. [Google Scholar]
  19. Chen, X.; Ishwaran, H. Random forests for genomic data analysis. Genomics 2012, 99, 323–329. [Google Scholar] [CrossRef] [Green Version]
  20. Charrad, M.; Ghazzali, N.; Boiteau, V.; Niknafs, A. NbClust: An R Package for Determining the Relevant Number of Clusters in a Data Set. J. Stat. Softw. 2014, 61, 1–36. [Google Scholar] [CrossRef] [Green Version]
  21. Ward, J.H. Hierarchical grouping to optimize an objective function. J. Am. Stat. Assoc. 1963, 58, 236–244. [Google Scholar] [CrossRef]
  22. Florek, K.; Lukaszewicz, J.; Perkal, J.; Zubrzycki, S. Sur la Liaison et la Division des Points d’un Ensemble Fini. Colloq. Math. 1951, 2, 282–285. [Google Scholar] [CrossRef]
  23. Sokal, R.; Michener, C. A statistical method for evaluating systematic relationships. Univ. Kans. Sci. Bull. 1958, 38, 1409–1438. [Google Scholar]
  24. Sorensen, T.A. A method of establishing groups of equal amplitude in plant sociology based on similarity of species and its application to analyses of the vegetation on danish commons. Biol. Skr. 1948, 5, 1–34. [Google Scholar]
  25. McQuitty, L.L. Similarity analysis by reciprocal pairs for discrete and continuous data. Educ. Psychol. Meas. 1966, 26, 825–831. [Google Scholar] [CrossRef]
  26. Gower, J.C. A comparison of some methods of cluster analysis. Biometrics 1967, 23, 623–637. [Google Scholar] [CrossRef] [PubMed]
  27. Pepe, A.; Pistoia, L.; Gamberini, M.R.; Cuccia, L.; Lisi, R.; Cecinati, V.; Maggio, A.; Sorrentino, F.; Filosa, A.; Rosso, R.; et al. National networking in rare diseases and reduction of cardiac burden in thalassemia major. Eur. Heart J. 2021. [Google Scholar] [CrossRef] [PubMed]
  28. Musallam, K.M.; Vitrano, A.; Meloni, A.; Pollina, S.A.; Karimi, M.; El-Beshlawy, A.; Hajipour, M.; Di Marco, V.; Ansari, S.H.; Filosa, A.; et al. Survival and causes of death in 2,033 patients with non-transfusion-dependent beta-thalassemia. Haematologica 2021, 106, 2489–2492. [Google Scholar] [CrossRef] [PubMed]
  29. Musallam, K.M.; Cappellini, M.D.; Daar, S.; Taher, A.T. Morbidity-free survival and hemoglobin level in non-transfusion-dependent beta-thalassemia: A 10-year cohort study. Ann. Hematol. 2021. [Google Scholar] [CrossRef]
  30. Musallam, K.M.; Vitrano, A.; Meloni, A.; Pollina, S.A.; Karimi, M.; El-Beshlawy, A.; Hajipour, M.; Di Marco, V.; Ansari, S.H.; Filosa, A.; et al. Risk of mortality from anemia and iron overload in nontransfusion-dependent beta-thalassemia. Am. J. Hematol. 2021. [Google Scholar] [CrossRef]
Figure 1. Variable importance plot of indicators of phenotype severity (IPhS) in β-thalassemia from unsupervised random forest (RF) analysis. SF, serum ferritin.
Thalassrep 12 00004 g001
Figure 2. (A) Plot of the 7910 β-thalassemia patients visualized using a multidimensional scaling plot based on the random forest (RF) dissimilarity of all 19 indicators of phenotype severity (IPhS). (B) Plot of the 7910 β-thalassemia patients visualized using a multidimensional scaling plot based on the RF dissimilarity of the 6 most important IPhS. Points of the same color represent patients belonging to the same cluster. Patients are colored by their cluster membership (red for Cluster 1, green for Cluster 2, and blue for Cluster 3).
Thalassrep 12 00004 g002
Table 1. Indicators of phenotype severity (IPhS) in β-thalassemia, chosen by the International Working Group on Thalassemia (IWG-THAL) members.
VariableType
Age, yearsContinuous
Age at diagnosis, monthsContinuous
Age at first transfusion, monthsContinuous
Age at first iron chelation, monthsContinuous
Sex (Femal/Male)Dichotomous
Transfusion (Yes/No)Dichotomous
Mean SF, ng/mLContinuous
No. of complicationsCounting
Cancer (Yes/No)Dichotomous
Cardiac complications (Yes/No)Dichotomous
Diabetes (Yes/No)Dichotomous
Hypogonadism (Yes/No)Dichotomous
Hypoparathyroidism (Yes/No)Dichotomous
Hypothyroidism (Yes/No)Dichotomous
Infections (Yes/No)Dichotomous
Liver complications (Yes/No)Dichotomous
Osteoporosis (Yes/No)Dichotomous
Splenectomy (Yes/No)Dichotomous
Status of death (Yes/No)Dichotomous
Table 2. Results from supervised random forest validation procedure to check the predictive accuracy of the used model.
PAM-RF Distance *Supervised RF
Class 1Class 2Class 3
Cluster 1 14037937
Cluster 233163846
Cluster 313292259
No. misclassified = 237, error rate 4.3%
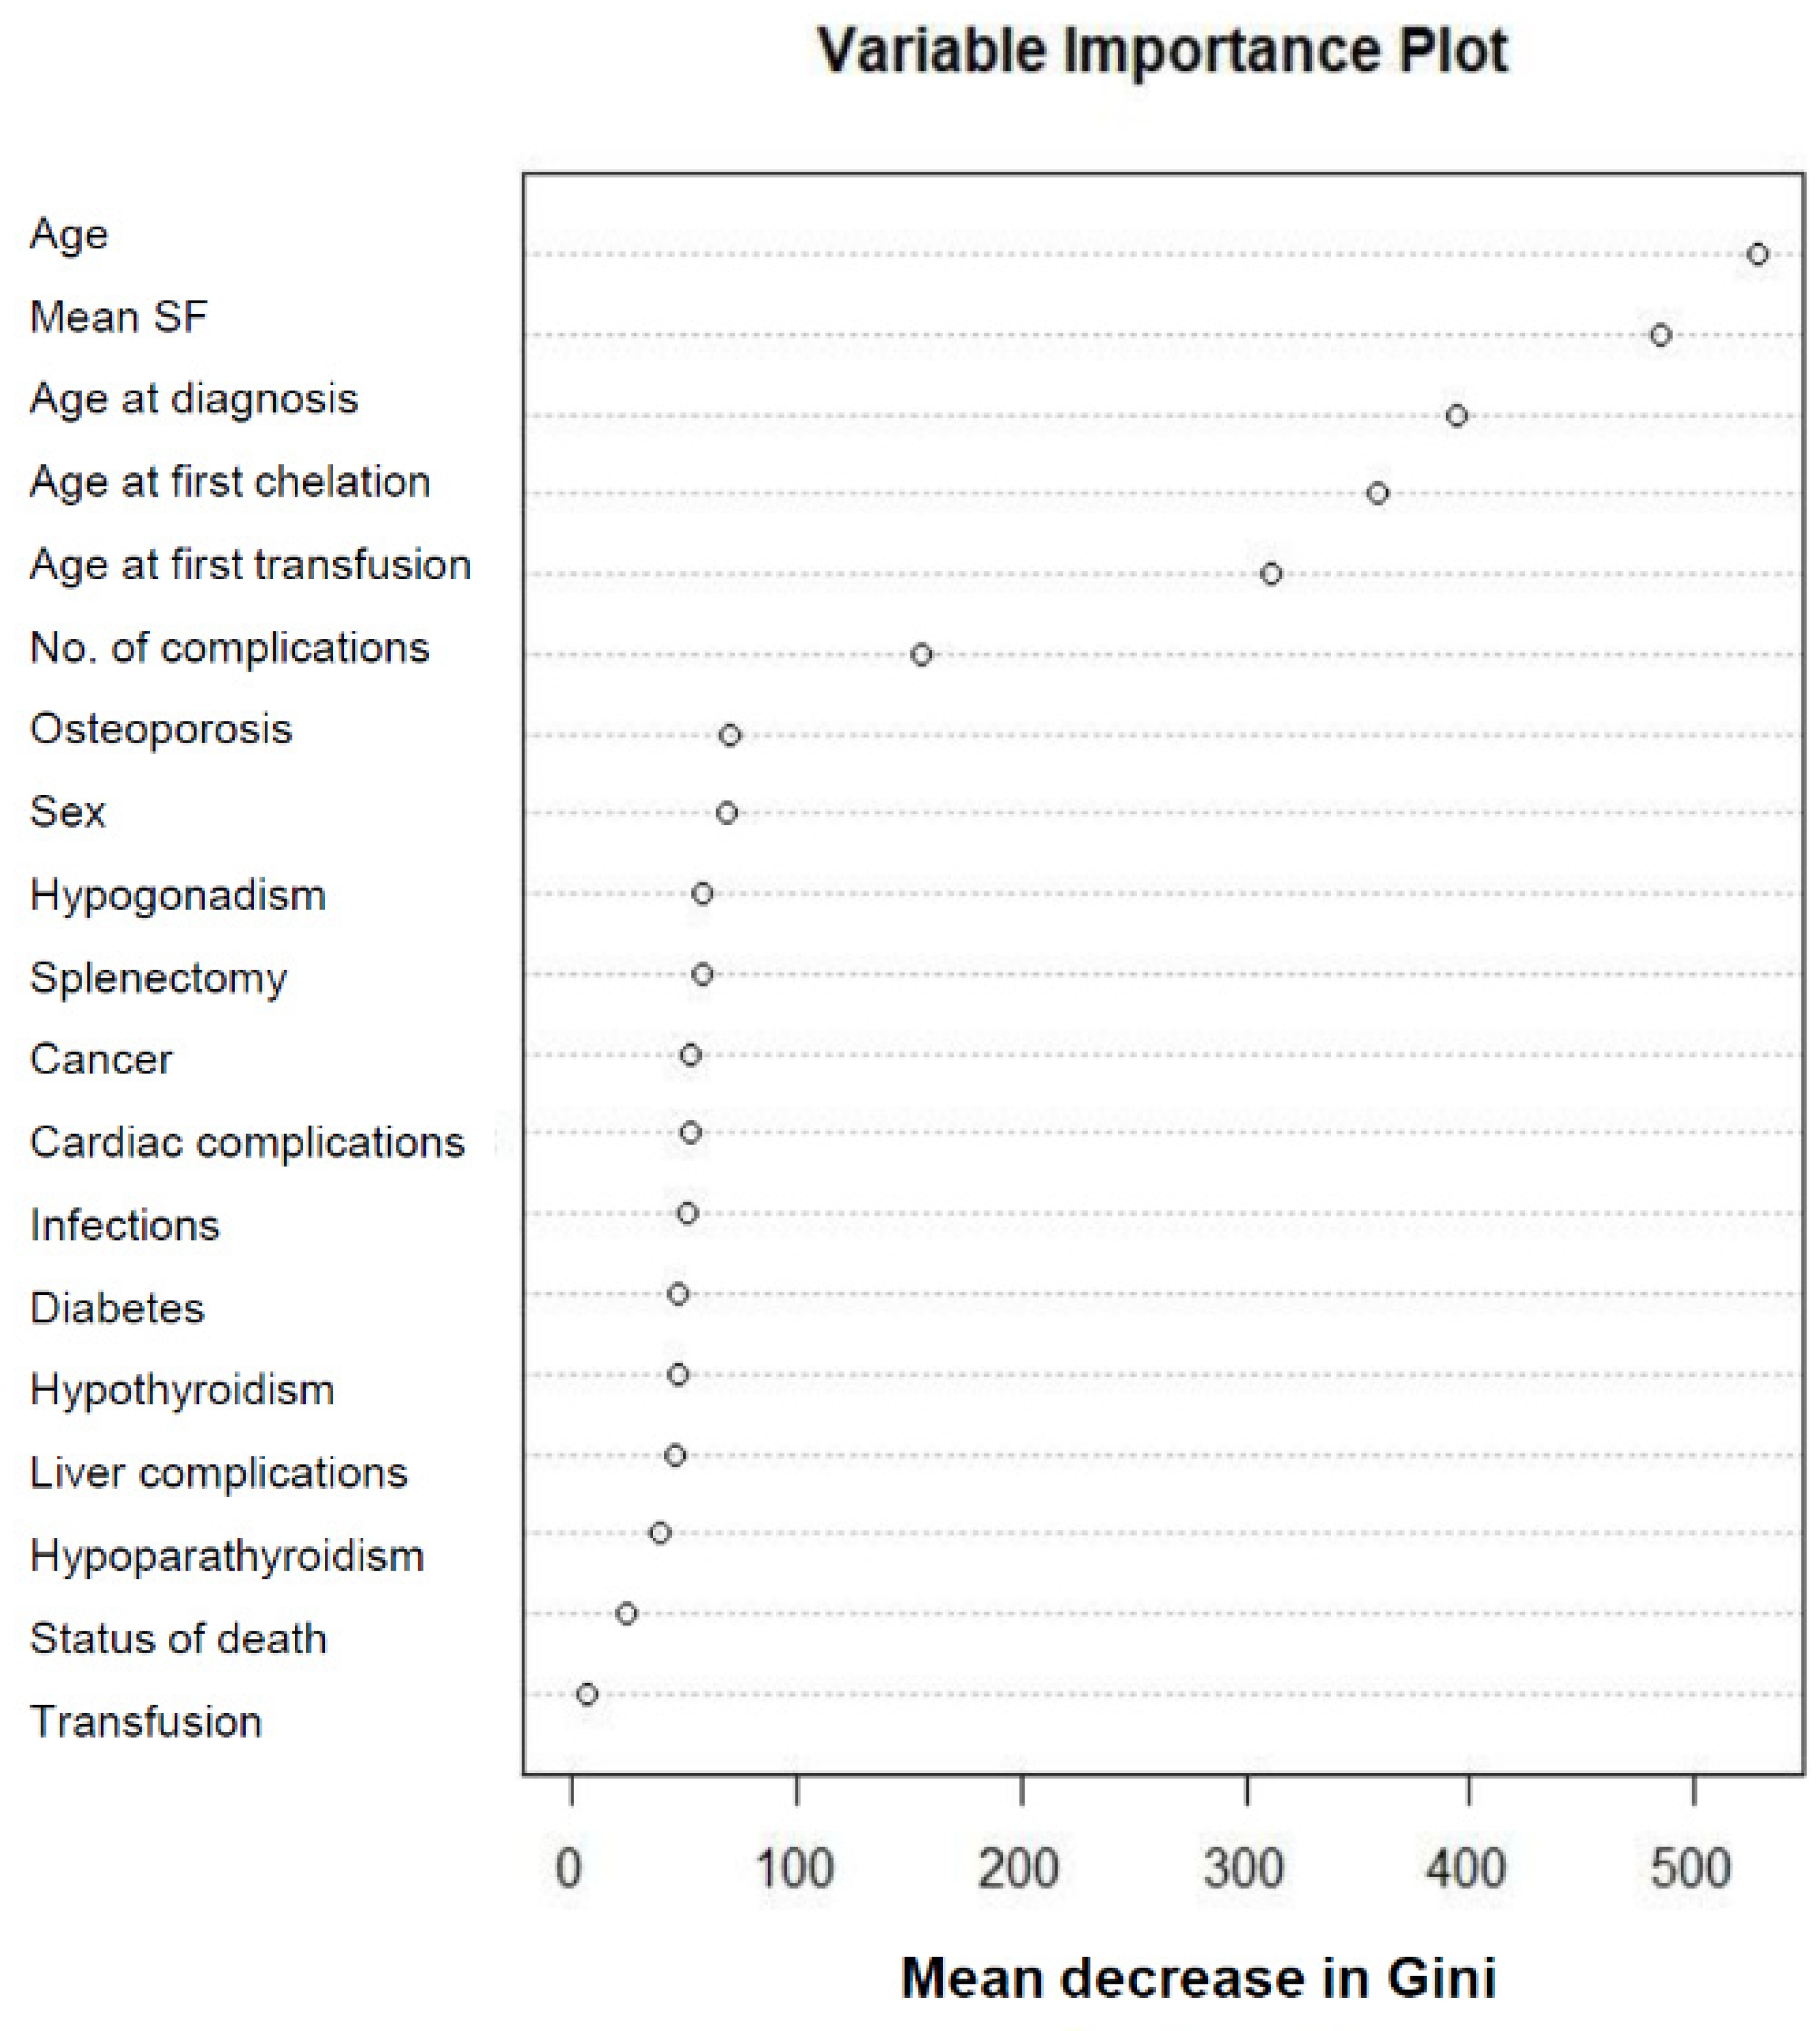
* The full data set of 7910 patients was split into a test set (n = 5537) and a validation set (n = 2373); the overall accuracy was 95.7%. RF, random forest; PAM, Partitioning Around Medoids.
Table 3. Comparison of the six most important indicators of phenotype severity (IPhS) between the three clusters.
IPhSCluster 1
(n = 2156)
Cluster 2
(n = 2454)
Cluster 3
(n = 3300)
p-Value
Age, years* 39.5 (15.6) ** 38.9 (7.0) *20.3 (7.9)<0.001
Age at diagnosis, months106.1 (125.0)12.6 (5.5)13.2 (9.4)<0.001
Age at first transfusion, months151.3 (143.6)19.2 (11.4)17.6 (18.3)<0.001
Age at first chelation, months244.1 (139.2)59.5 (30.2)51.5 (32.2)<0.001
Mean SF, ng/mL1184.0 (1533.0) *1183.0 (715.0) *3124.0 (2240.0)<0.001
No. of complications1.8 (1.7)2.3 (1.6)1.0 (1.2)<0.001
Results reported as mean (standard deviation). * Bonferroni test for couples of means was performed and these two groups did not statistically differ. SF, serum ferritin.
Table 4. Comparison of the causes of death between the three clusters.
IPhSCluster 1
(n = 99)
Cluster 2
(n = 58)
Cluster 3
(n = 289)
p-Value
Heart failure, n (%)23 (23.2)19 (32.8)94 (32.5)0.017
Liver damage, n (%)7 (7.1)7 (12.1)2 (0.7)<0.0001
Hepatocellular carcinoma, n (%)14 (14.1)7 (12.1)5 (1.7)<0.0001
Other cancers, n (%)19 (19.2)6 (10.3)2 (0.7)<0.0001
Infections, n (%) 10 (10.1)8 (13.8)16 (5.5)0.282
Other complications, n (%)26 (26.3)11 (19.0)170 (58.8)<0.0001
Age at death (years), mean (SD)47.3 (17.4)39.2 (6.4)20.4 (6.8)<0.0001
SD, standard deviation.
Publisher’s Note: MDPI stays neutral with regard to jurisdictional claims in published maps and institutional affiliations.

