Abstract
Understanding the genetic variability among Nigerian cassava accessions is a crucial prerequisite for its improvement. The objective of this study was to estimate the genetic variability among 477 cassava accessions and to classify them based on their genetic similarities for effective utilization in breeding programs. The accessions were evaluated at the Federal University of Agriculture, Abeokuta experimental site from 2023–2024, using an augmented randomized complete block design with two checks (TME 419 and NR 87184). Agromorphological descriptors were collected at 3-month intervals for 12 months. Broad sense heritability and genetic advance as percent of mean (GAM) were high, indicating that the overall phenotypic expressions observed were largely influenced by genetic factors. Multiple correspondence analysis (MCA) showed that petiole color, number of leaf lobes, color of leaf veins, and parenchyma contributed the most to the overall variability observed in the study population. Principal component analysis (PCA) identified petiole length, length of leaf lobe, width of leaf lobe, and plant height as primary contributors to the overall phenotypic variations observed in the population. Hierarchical clustering of accessions using Euclidean distance revealed two and three clusters based on qualitative and quantitative traits respectively. This study has shown the existence of wide genetic variations in several cassava traits, providing a valuable resource for breeding programs.
1. Introduction
Increasing surface temperatures and erratic rainfall patterns have necessitated investment in climate adaptable crops to ensure food security across the world. This is especially important for Africa, where a significant proportion of the people rely on agriculture for food and sustenance. Cassava, Manihot esculenta Crantz, an important food security crop, has been identified as a future smart crop due to its high carbohydrate content and drought tolerance [1]. Africa produces an estimated 213 million tons of cassava annually which provides food and sustenance to an estimated 800 million people on the continent [2]. Nigeria, the largest producer of cassava in Africa, produces an estimated 62 million tons at a largely subpar yield of 6.3 tons/ha, which is significantly lower than the amount obtained in other major cassava growing regions across the world [2]. This discrepancy in yield is largely due to the poor adoption of improved varieties and overdependence on landraces underscoring the need to study their genetic variability [3]. Despite their low productivity, landraces are valuable sources of genetic diversity, essential for crop improvement. It is therefore important to regularly collect and evaluate cassava accessions cultivated across Nigeria to determine the extent of variability, identify important traits for improvement and ensure the preservation of the genetic pool of cassava in Nigeria.
Phenotypic variability in cassava is linked to its adaptability and agronomic performances, for example, traits such as plant height, branching characteristics, and leaf morphology have been identified to have corresponding influence on the photosynthetic activities of the plant, ability to withstand abiotic stresses and yield [4,5,6]. This therefore implies that understanding the pattern of such variability can help in selection in breeding programs for climate resilient and high yielding genotypes [7].
Genetic variability in plants is usually evaluated through morphological, biochemical and molecular markers [8]. However, agromorphological markers remain one of the most practical, easily assessed and cost-effective tools for large germplasm collections as they help to easily capture visible heritable differences which have direct correlation to agronomic productivity [9]. Furthermore, agromorphological markers are phenotypic measurable characters that are largely genetically influenced and heritable. They are particularly valuable in resource-limited settings, thereby providing baseline for grouping accessions prior to molecular studies. Although molecular markers such as microsatellites (SSR) and Single Nucleotide Polymorphism (SNPs) markers offer a more accurate resolution of genetic diversity, understanding variability and characterization of germplasm using agromorphological markers is no less valuable for preliminary screening and the identification of breeding materials [8,10,11].
Hence, there is a need for renewed assessment of germplasm using standardized agromorphological descriptors to capture variations that support breeding for yield, and adaptability to varying climatic conditions. Therefore, to address this need in two major cassava growing regions in Nigeria, this study focused on evaluating, characterizing and classifying cassava accessions collected from a farmers’ field in southwest and north central Nigeria using both quantitative and qualitative descriptors as described by Fukuda et al. [12]. The overall objective is to provide additional knowledge on the extent of genetic variability in the population, and classify the accessions, while identifying traits that contribute mostly to phenotypic diversity in order to support cassava improvement and conservation efforts in the region.
2. Materials and Methods
2.1. Sample Collection
The study evaluated 477 cassava accessions collected from 412 farms across South-West and North Central states of Nigeria between 2021 and 2022 (Figure 1). The samples were collected as part of an epidemiological survey, conducted by the Central and West Africa Virus Epidemiology (WAVE) Program. Cassava farms were surveyed following a predefined survey map at a minimum of 10 km apart. On each farm, consent was obtained from the farmer and stem cuttings from a representative member of the different accessions planted in the farm were collected.
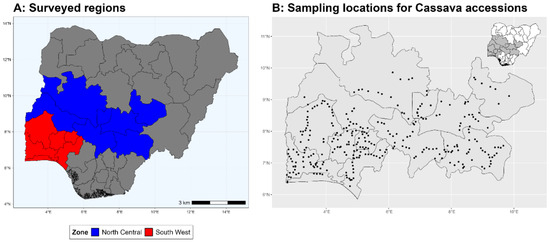
Figure 1.
(A) Surveyed regions of Nigeria; (B) Sampling locations (black dot) of each cassava accession during Survey.
2.2. Experimental Field
The experiment was conducted during the 2023–2024 cropping season using augmented randomized complete block design [13] with two checks (TME 419, NR 87184). The augmented design was adopted to accommodate the limited quantity of planting material available. The obtained cassava accessions were established at the experimental field of the Federal University of Agriculture, Abeokuta, Ogun state, Nigeria, which is located in the forest savanna transition zone with wet season occurring between March and October and dry season occurring between November and February. The average rainfall recorded from the experimental field during the planting period (June 2023–June 2024) was 99.17 mm while the average temperature was 31.95 °C. The soil characteristics of the experimental field are presented in Table 1.

Table 1.
Physicochemical properties of the soil at the FUNAAB Experimental field.
The experimental field was divided into fourteen blocks of forty-four plots each. The dimension of each plot was 1 m by 5 m, with a 2 m spacing between each block. Each of the obtained accessions were cut into 30 cm stem cuttings and planted in up to five replicates per plot. The checks plots were randomly planted twice within each block. Good agronomic practices such as regular weeding were adopted, and fertilizer was not applied.
2.3. Data Collection
A total of forty (40) geomorphological traits were collected at 3-month intervals over a 1-year period following the methods of Fukuda et al. [12]. The specific traits collected are listed in Table S1a,b.
Determination of Harvest Index
Harvest Index was calculated through the weight the total roots harvested from each accession and above ground biomass (stems, branches, and leaves). Mathematically, HI was computed as HI = weight of roots/(weight of roots + weight of aboveground biomass).
2.4. Data Analysis
To identify traits that varied significantly between accessions, Analysis of Variance (ANOVA) was computed adjusting for block effects. The adjusted means of each quantitative trait was generated using the augmentedRCBD R package (v0.1.7) [14] for continuous quantitative traits while, for traits that exhibited zero-inflation due to biological absence of expression, the adjusted mean was computed using the hurdle model implemented via the glmmTMB package (v1.1.12) in R [15] and utilized for downstream analysis.
As described in augmentedRCBD package (v0.1.7) in R, Genetic variability statistics (Table 2) for continuous quantitative traits such as mean, phenotypic, genotypic and environmental variation were calculated according to previously defined methods [16,17,18], while phenotypic and genotypic coefficient of variation was computed according to the methods of Sivasubramaniam and Madhavamenon [19]. Broad sense heritability was computed following the methods of Lush [20] while broad sense heritability categories were determined according to the methods of Robinson [21]. Genetic advance, genetic advance as percent of mean and genetic advance category were computed according to [22]. The genetic variability analysis was performed because the sum of the squares of the “treatment” test was significant. For the zero-inflated quantitative traits, genetic variability was partitioned into the presence component and the magnitude component, where the variance component for genotype, block, residual, and phenotypic was calculated, as well as broad sense heritability, phenotypic coefficient of variation, genotypic coefficient of variation, and genetic advance, calculated using the lme4 (v1.1-37) and glmmTMB (v1.1.12) packages in R.
Table 2.
Formula for determination of genetic variability estimates.
To identify the distinct morphological groups within the population, cluster analysis was performed. First, multiple correspondence analysis (MCA) was conducted on the qualitative traits and principal component analysis (PCA) on the quantitative traits in order to reduce data dimensionality and summarize the pattern of variation within the characters [23,24]. The number of dimensions retained for clustering was determined using the elbow method for quantitative traits, while the cumulative explained variance was used for the qualitative traits. Subsequently, agglomerative hierarchical clustering was performed from the retained dimensions of the MCA and PCA for each accession in the population. The Euclidean distance was used as the dissimilarity measure and clusters were computed using the wards minimum variance method [25,26]. The silhouette method was employed to objectively determine the optimal number of clusters [27]. All analysis was conducted in R version 2025.05.1 + 513.
3. Results
3.1. Frequency Description of Qualitative Traits
3.1.1. Foliar Traits
Foliar related traits varied significantly among the accessions, as presented in Table S2. Most of the accessions had purplish green (44.7%) or light green (41.1%) apical leaves with a significantly smaller proportion presenting with purple (11.3%) or dark green (2.9%) apical leaves. Pubescence was mostly absent across all accessions collected save for a minority (17%,) which showed pubescence. Leaf retention was below average in the collection with less than half of the accessions (42.8%) retaining enough leaves to cover ≥ 50% of the plant 6 months after planting. The primary leaf color observed among the accession was dark green (90.8%) with most plants presenting with a lanceolate central leaf shape (62.6%), seven leaf lobes (85.4%), smooth lobe margins (79.5%), petioles that mostly inclined upwards (54.5%) and predominantly colored green (28.2%), reddish-green (24.6%), or purple (22.6%).
3.1.2. Stem Related Traits
Stem related characteristics also showed marked variations across all accessions studied (Table S2). Foliar scars were predominantly prominent (92.5%) in the collection, while the most observed colors were dark green (65.1%) for stem cortex, light brown (70.2%) for the stem epidermidis and grey (61.8%) for the stem exterior. Most accessions had stems with a straight growth habit (86.7%), medium distance between leaf scars (59.5%), a split or forked stipule margin (63.5%) and no branching (61.8%). Most of the accessions had a compact shape (44.5%).
3.1.3. Root Related Traits
The root shapes observed in the collection were predominantly conical (37.4%) and cylindrical (32.6%) with most accessions showing few to no root constrictions (80.4%). The texture of root epidermis was primarily rough (69.5%) with the external color of storage roots being predominantly dark brown (70.2%), while the parenchyma color was mostly cream (95.6%). The color of the root cortex among the collection was primarily white or cream (94.6%) with most of the accessions having easy-to-peel roots (99.6%) and intermediate taste between sweet and bitter (64.3%), and the extent of root peduncle being predominantly sessile (48.9%) (Table S2).
3.2. Descriptive Statistics of Quantitative Traits
Table 3 presents summaries of the continuous quantitative traits for all accessions collected and evaluated. The results showed wide variation across all the quantitative traits measured. The length of leaf lobe (LLL) showed marked variation ranging from 5.28 cm to 21.18 cm and an average of 15.39 ± 2.73 cm. Similar trends were recorded with the width of leaf lobe (WLL) which ranged from 1.27 cm–6.53 cm, with an average of 4.45 ± 0.79 cm, showing a wide variation among accessions. Petiole length (PL) ranged from 6.95–36.12 cm with a mean of 23.15 ± 5.36 cm while Plant height ranged from 68.98 to 389.21 cm with an average of 229.65 ± 54.28 cm. The number of storage roots per plant (NSRP) was highly variable, ranging from 0 to 17 roots, with an average of 5.90 ± 2.73. Harvest index (HI) varied between 0.04 and 0.87, with an average of 0.44 ± 0.12. The Skewness and kurtosis values revealed that some of the traits deviated significantly from normality, especially NSRP and HI, which were positively skewed.
Table 3.
Descriptive Statistics for Quantitative Traits.
Table 3 also presents the descriptive summaries of the zero-inflated quantitative traits analyzed using the hurdle model. The summaries are presented for presence, magnitude and overall expectation components. In the presence component, Angle of Branching and Height to First branching reported a mean probability of 0.42 occurrence, while the number of commercial roots per plant (NCRP) revealed a higher mean presence of 0.89. In the magnitude component (conditional), Angle of Branching varied between 28.11 and 76.71° with an average of 55.33 ± 6.46°; Height to first branching also varied from 21.11 to 245.21 cm, with a mean of 91.70 ± 32.00 cm. Number of commercial roots per plant ranged between 1 and 11 roots, with a mean of 3.49 ± 1.65 roots. The overall expectation component which integrates both the presence and magnitude component showed a mean value of 22.94° (Angle of Branching), 36.93 cm (Height to First branching) and 3 roots (NCRP). These descriptive statistics further justify the hurdle model as an appropriate approach for capturing the occurrence and intensity of these traits’ expressions.
3.3. Genetic Variability
The genetic variability estimates revealed a wide range of variation for the continuous quantitative traits, as shown in Table 4. The phenotypic coefficient of variation (PCV) ranged from 29.81% (Length of Leaf Lobe) to 81.45% (Number of Storage roots per Plant), and a similar pattern was observed for genotypic coefficient of variation, which ranged from 26.72% (LLL) to 63.55% (NSRP). All continuous quantitative traits reveal that the values of PCV were larger than the corresponding GCV values, reflecting environmental influence. Broad-sense heritability was uniformly high, varying from 60.88% (NSRP) to 83.40% (PL), implying that a substantial proportion of the observed variations was heritable with higher magnitude of genetic contributions to the observed phenotypic variations. Similarly, Genetic Advance as a Percentage of mean (GAM) was also high across traits, ranging from 49.42% (LLL), and 102.30% (NSRP), implying good potential for selection.
Table 4.
Genetic Variability Analysis.
For the zero-inflated quantitative traits, as shown in Table 4, genetic variability was assessed separately for the hurdle model components. In the presence component, heritability estimates on the link scale were moderate, ranging from 0.44 (NCRP) to 0.54 (AoB and HFB), while for the magnitude component, larger variation was observed, with the PCV ranging from 13.74% (AoB) to 945.73% (NCRP). The GCV ranged from 6.69% (NCRP) to 23.99% (HFB), and the heritability estimates were moderate for AoB (0.29) and HFB (0.39), but extremely low for NCRP (0.0001). In addition, Genetic Advance as percentage of Mean (GAM) was high for HFB (30.76%), moderate for AoB (8.16%), and negligible for NCRP (0.10%).
3.4. Correlation Analysis for Quantitative Traits
Strong positive correlations were observed between angle of branching and height to first branching (r = 0.88) as well as between number of commercial roots per plant and number of storage roots (r = 0.70) (Figure S1). Strong association was also observed between length of leaf lobe and Petiole Length (r = 0.77), length of leaf lobe and width of leaf lobe (r = 0.75), and petiole length and width of leaf lobe (r = 0.66). Plant height had a moderate correlation with number of storage roots per plant (r = 0.36), and length of leaf lobe (r = 0.43). Harvest index showed very moderate correlation with the number of storage roots (r = 0.33) and number of commercial roots per plant (r = 0.37).
3.5. Multiple Correspondence Analysis of Qualitative Traits
The eigenvalue table (Table 5) revealed that the first twenty MCA dimensions collectively accounted for 44.9% of the total variance, which represents the optimal balance capturing meaningful balance and interpretability. The MCA map of trait categories illustrated the primary associations driving the variations, with key traits grouping along the first two dimensions, as shown in Figure 2. The optimal number of clusters was determined to be two using the silhouette approach (Figure S2), with most accessions belonging to cluster 1 (n = 472), while cluster 2 formed a small distinct outlier group (n = 7) (Figure 3).
Table 5.
Eigenvalues, Variance Explained, and Cumulative Variance Across Dimensions.
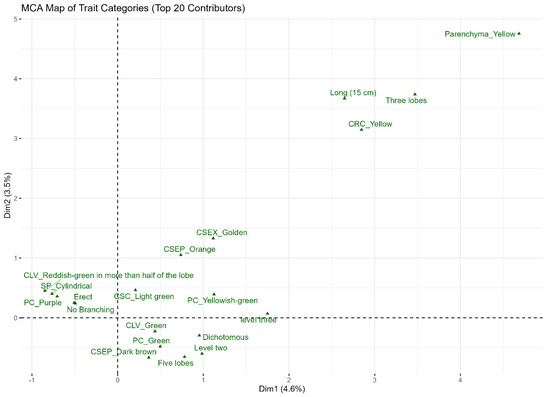
Figure 2.
Scatter plot of first two dimensions from MCA of qualitative traits.
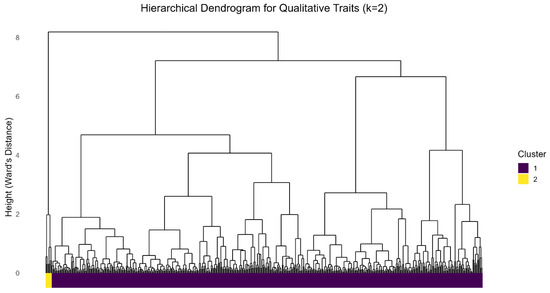
Figure 3.
Dendrogram based on Hierarchical clustering of accession based on MCA of qualitative traits.
The dendrogram (Figure 3) represents the hierarchical relationships among the accessions studied based on their qualitative traits. Accessions that are clustered in the same group share similar morphological traits, which implies a higher degree of genetic relatedness. These clusters largely reflect inherent genetic relatedness and differences as opposed to environmental influence. For qualitative characters, cluster 1, the core group of the population, was uniformly characterized by traits associated with robust plant architecture and root quality. A well-defined proportion (over 90%) of the cluster exhibited dark green leaf color, easy cortex peeling (99.6%), cream parenchyma (97%), white or cream color of root cortex (96%) and prominent foliar scars (92.4%). Furthermore, this cluster was strongly defined by straight growth habit of stem (87.5%), short length of stipule (86.7%), and seven leaf lobes (86.2%). Notably, over 83% of the accessions in this cluster lacked pubescence on their apical leaves, and few to no constrictions in their root (80.1%). Most of the accessions in this cluster also had dark brown external color of storage roots (70.8%), smooth lobe margin (79.4%) and the color of stem epidermis was mostly Light brown (70.1%). In contrast, Cluster 2 was more defined by divergent plant structure and morphology; all (100%) of the accessions in this cluster had dichotomous branching habit, green leaf vein, yellow color of root cortex, light green color of stem cortex, dark green leaf color, short length of stipule, prominent foliar scars, yellow parenchyma, and few to no constrictions in their roots. Some of the accessions in cluster 2 also possessed purplish green apical leaves (71.4%), sessile extent of root peduncle (85.7%), smooth leaf margin (85.7%), average leaf retention (71.4%), three leaf lobes (71.4%), inclined upward orientation of petiole (71.4%), conical root shape (71.4%), split or forked stipule margin (71.4%), and rough texture of root epidermis (71.4%). The cluster analysis successfully revealed that both clusters are dominated by different characteristics and mostly differentiate with their branching habit, with cluster 1 mostly erect and cluster 2 mostly dichotomous.
3.6. Principal Component Analysis of Quantitative Traits
Principal component analysis was conducted to identify the main axes of variation among the quantitative characters. The percentage variances and the eigenvalues of the principal component analysis for quantitative traits are presented in Table 6. The first three principal components accounted for 75.35% of the variation observed in the germplasm collection. The relationships between the traits and the first two principal components, accounting for 61.61% of the variance, visualized in the variable correction circle in Figure 4. The first PC with reference to its high factor loading was positively related with characters such as petiole length (0.78), length of leaf lobe (0.86), width of leaf lobe (0.76), plant height (0.59), harvest index, number of storage roots per plant (0.61), and number of commercial roots per plant (0.57). The characters that were strongly correlated with PC2 were angle of branching (0.88), height to first branching (0.85), number of storage roots per plant (0.48), and the number of commercial roots per plant (0.60). The PC3 was primarily influenced by angle of branching (0.28), height to first branching (0.39), and plant height (0.42).
Table 6.
Principal Component Analysis for Quantitative Traits.
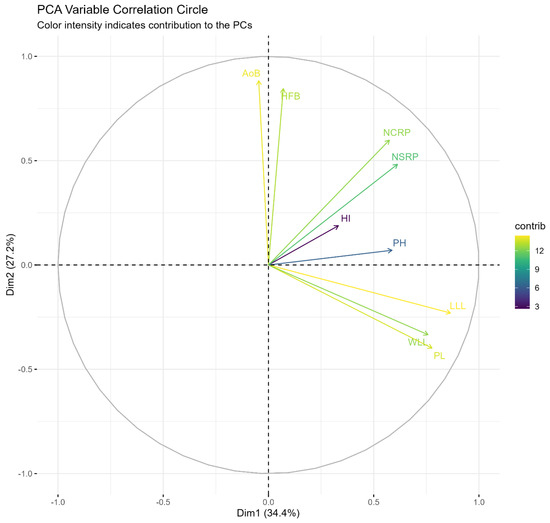
Figure 4.
Scatter plot of first two dimensions from PCA correlation circle of quantitative traits. AoB: Angle of Branching; HFB: Height to first branching; NCRP: Number of commercial roots per plant; LLL: Length of leaf lobe; WLL: Width of leaf lobe. PL: Petiole Length; PH: Plant Height; NSRP: Number of storage roots per plant; HI: Harvest Index.
Hierarchical cluster analysis was performed on the scores of the first three PCs to partition the population into distinct morphological groups. The optimal number of clusters was objectively determined to be three (k = 3) using the average Silhouette width method (Figure S3). The resulting dendrogram visually confirmed a clear and balanced division of the accessions into these three groups (Figure 5). The dendrogram (Figure 5) illustrates how accessions are grouped according to genetic similarities in the measured quantitative characters with minimal environmental influence, as accounted for by the type of experimental design employed and statistical analysis. The final cluster composition was as follows: Cluster I contains 163 accessions, cluster 2 236 accessions, and cluster 3 80 accessions (Table 7). Significant differences were observed in the mean values for most of the traits evaluated, confirming an effective classification (Table 7). Accessions with higher angle of branching were recorded in cluster 1 with a mean of 45.730, while cluster 2 had the lowest angle of branching with a mean of 8.570; accessions in cluster 1 had higher heights to first branch with a mean of 75.45 cm, while accessions in cluster 2 were characterized by lower heights to first branching with a mean of 13.64 cm. The study reveals that cluster 2 had the highest mean (0.47) for harvest index and cluster 3 had the lowest mean (0.33); the highest length of leaf lobe was observed in cluster 2 with a mean of 16.77 cm while cluster 3 had the lowest length of leaf lobe with a mean of 11.67 cm. More commercial roots per plant (4 roots) were recorded in cluster 1 and cluster 3 had a lower number of commercial roots per plant (1 root). Cluster 1 had a higher number of storage roots with a mean of 7 roots, while cluster 3 had a lower number of storage roots with a mean of 3 roots. The highest plant height was recorded in cluster 2 with a mean of 239.52 cm, while cluster 3 had the shortest plant height with a mean of 186.83 cm. Cluster 2 accessions had the longest petiole length 26.17 cm, but cluster 3 had the shortest petiole length, mean 17.16 cm. Cluster 2 had the longest width of leaf lobe with a mean of 4.84 cm, but cluster 3 had the shortest width of leaf lobe at 3.60 cm.
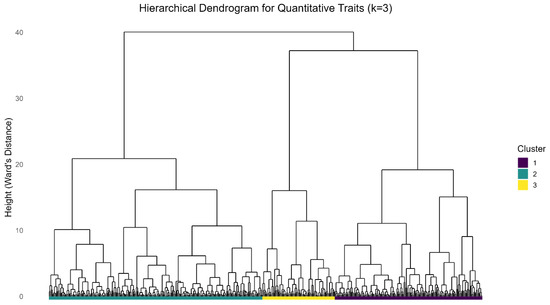
Figure 5.
Dendrogram based on Hierarchical clustering of accession based on quantitative traits.
Table 7.
Mean Trait Values for Accessions Within Each of the Three Genetic Clusters.
To assess the consistency of the classifications derived from the two trait datasets, a concordance analysis was performed. A cross-tabulation (Table 8) of the cluster memberships revealed a strong, statistically significant association between the qualitative and quantitative groupings (Pearson’s χ2 = 7.31, df = 2, p < 0.001). A high degree of concordance was observed for the small, morphologically unique group identified in the qualitative analysis (Qualitative Cluster 2). All seven accessions from qualitative cluster 2 were consistently assigned to a single cluster in the quantitative analysis (Quantitative Cluster 2). The larger group from the qualitative analysis (Qualitative Cluster 1, n = 472) was partitioned across all three quantitative clusters, with the majority (n = 236) forming Quantitative Cluster 2.
Table 8.
Cross tabulation of membership clusters.
4. Discussion
Understanding the genetic component of cassava is an important requirement for cassava improvement. This study assessed the genetic variability of several traits in 477 cassava accessions collected across 13 Nigerian states, 5 of which are among the top ten cassava producing states in Nigeria. The frequency distribution of traits in the study population revealed wide variability, an important requirement for identification and selection in crop improvement. The findings from this study showed that the majority of the accessions evaluated were morphologically similar across several traits to the two reference accessions (checks: NR 87184, TME_419) used in this study, implying that such traits are stable and can be used for selection in breeding programs. The high variability recorded in most of the traits shows the remarkable adaptability of cassava crops to genetic structures and environmental conditions across Nigeria, especially in the study region.
Leaf and stem characteristics such as petiole color, color of stem exterior, color of apical leaves, orientation of petiole, shape of central leaflets and color of leaf veins indicates potential genetic variability characteristics suitable for evaluation in cassava. Our findings align with recent studies also evaluating the phenotypic characteristics of cassava germplasm. For example, Karim et al. [28] evaluated 102 cassava genotypes, using agromorphological and single nucleotide polymorphic (SNP) markers, and found similar patterns to those observed in this study, with qualitative traits such as color of apical leaves, orientation of petioles, amongst others, showing significant genetic variability, suggesting that color is a distinguishing factor for cassava germplasm. Quantitative characteristics such as length and width of leaf lobe showed normal to skewed distributions indicating continuous variations and the impact of polygenic factors on such traits. The type of leaf lobe observed in the population showed a certain level of stale genetic background for the trait, aligning with Wang et al. [29] who emphasized that continuous variations are significant to superior genotype selection, especially as this relates to photosynthetic efficiency, partition of assimilates and defense against biotic and abiotic stressors. The diversity observed in root related traits such as the root shape, root constriction, number of roots per plant, number of commercial roots per plant, and harvest index is important for yield improvement. The number of storage roots per accession, and the number of commercial roots per accession showed positive correlations with harvest index, validating their suitability for selection in cassava improvement. This result is consistent with the work of Nadjiam, et al. [30], who reported that root number and root shape are significant determinants of cassava yield and are highly heritable.
The genetic variability analysis of cassava accessions presented interesting insights into the basic genetic architecture influencing quantitative characters. An understanding of the genotypic (GCV) and phenotypic (PCV) coefficients of variation across continuous quantitative traits provides a background for understanding the extent of genetic diversity and potential for selection in cassava breeding. The modest differences observed between the PCV and GCV indicate that, although environmental factors contributed to the overall phenotypic expression, a large proportion of the observed variability was still genetic in nature. The consistently high broad-sense heritability and genetic advance as percentage of mean estimates underscores the strong potential for direct selection. The findings in this study corroborate previous reports where heritability has been reported within cassava germplasm evaluated across diverse environments. For instance, petiole length, width of leaf lobe, and length of leaf lobe exhibited high heritability which closely mirror the findings of Daemo et al. [31], further establishing that these traits have been genetically controlled and can be effectively selected for canopy architecture improvement and photosynthetic productivity. Plant height also fell within the ranges of heritability previously reported by Mathew et al. [32], Sivan et al. [33] and Jiwuba [34], indicating that this is a genetically stable attribute that can be explored for selecting vigorous, and high-biomass genotypes. Furthermore, harvest index and number of storage roots per plant observed in this study are closely comparable with those reported by Daemo et al. [31], Rabbi et al. [35] and Sivan et al. [33], which implies that assimilation and partitioning for storage roots is controlled by genetic factors, and yield potentials can be enhanced indirectly through selection focused on these traits. Based on the heritability estimates from this study, such trait combinations are usually interpreted as evidence of additive gene action, which further strengthens the prospects for efficient early-generation selection in cassava breeding pipelines. This aligns with the study of Rabbi et al. [35], who emphasized the importance of exploring genetic variability to enhance the cassava breeding program.
Contrarily, the zero-inflated traits revealed a more complex pattern of genetic control. The presence component showed a moderate display of heritability on the link scale, which establishes the fact that genetic factors were highly significant to these traits’ expression. Similarly, in the magnitude component, moderate heritability and genetic advance as percentage of mean was equally observed for traits such as height to first branching, implying that such traits can be improved through selection for the phenotypic expression of the traits. However, number of commercial roots per plant reflects the huge influence of environmental factors due to low heritability and genetic advance. These findings for the zero inflated traits further justify the importance of using the hurdle model for such traits. This further implies that gains can be more predictable when breeding emphasis is placed solely on trait presence [36], although breeders must always consider environmental effects, and genotype by environmental interactions for magnitude traits in order to be assured of genomic gains.
The correlation analysis provides critical understanding of the relationships that exist between quantitative traits and their collective influence on overall yield. An understanding of these relationships is significant for effective selection and improvement of cassava collections in the study region. In this study, angle of branching had a positive correlation with height to first branching, implying that plants with wide angles have the likelihood of having a corresponding higher point to first branching. This promotes the interception of light and canopy architecture, thereby facilitating the biosynthesis of assimilates for biomass and root development [37]. Furthermore, findings from this study revealed that there was a greater allocation of biomass to harvestable parts, especially for roots based on the correlation observed between the number of storage roots and number of commercial roots, since increase in these two traits had significant impact on the harvest index. This corroborates the work of Karim et al. [28], who found a significant relationship between number of storage roots and harvest index. Interestingly, plant height had no significant association with harvest index, despite the Harvest index being derived from both weight of roots and aboveground biomass (stems, leaves and branches). This implies that taller plants do not necessarily allocate more assimilates to root production, but for vegetative components this also indicates that, in cassava improvement, plant height is not sufficiently reliable as the basis for selection for improvement of yield and its components, as previously reported by Diaguna et al. [38], who also observed no correlation between height of plant and weight of storage root.
The multiple correspondence analysis of qualitative traits provided some insights into which qualitative traits are closely related. The analysis revealed that the observed diversity is not random but is structured around two primary axes of variation, which effectively separated the traits into two distinct functional groups The proximity of traits in group 1 may suggest that they have shared genetic or phenotypic basis. The traits in group 2 which included such traits as parenchyma and petiole color, are distinctly separate from the others, indicating their strong influence on the overall dimensions of the analysis. The high variation seen in group 2 traits indicates their independence, making them more suitable breeding candidates. Similar findings have also been reported by Brice et al. [39], who also identified petiole color and parenchyma as major contributors to the overall dimensions in Cassava characterization. The PCA helped to identify key traits such as number of storage roots per plant, petiole length, length of leaf lobe, and width of leaf lobe for genotype identification and genetic diversity in cassava. This is consistent with studies by Laila et al. [40] and Daemo et al. [31], who found number of roots per plant to be an important characteristic in cassava improvement.
This study helped to practically classify the entire germplasm collection into a small number of morphologically distinct and agronomically meaningful groups via hierarchical clustering. This data-driven framework moves beyond single-trait assessment and has profound implications for our breeding program. For the qualitative traits, the analysis partitioned the population into two starkly different clusters: a large, core group (Cluster 1, n = 472) exhibiting robust, agronomically desirable characteristics, and a small, unique outlier group (Cluster 2, n = 7) defined by its rare dichotomous branching habit. The identification of this small group is of particular importance; it flags these seven accessions as a valuable genetic resource, potentially harboring unique alleles for plant architecture that could be introgressed into elite backgrounds.
For the quantitative traits, clustering into three groups provides a strategic roadmap for parental selection. For example, the analysis revealed that Cluster 2 was characterized by high yield potential but moderate vegetative growth, while Cluster 3 exhibited moderate vegetative vigor but a lower harvest index. This clear differentiation allows for a targeted hybridization strategy. Crossing elite accessions from Cluster 2 with those from Cluster 3 presents a viable pathway to pyramid desirable traits, potentially breaking unfavorable linkages and creating novel ideotypes that combine high yield with robust plant stature. The accessions identified within these superior clusters are, therefore, recommended as priority candidates for inclusion in the next cycle of genetic improvement.
The partitioning of the accessions into diverse groups based on qualitative and quantitative characters aligns with the findings of Tighankoumi et al. [41], who also identified distinct genotypes among Togo’s germplasm. Similarly, Kouokou et al. [42] reported three major groups for the 200 accessions evaluated, consistent with the present study.
The findings from this study emphasized the relevance of leaf, stem and root characteristics in the understanding of variability and diversity of cassava accessions; it also highlights the importance of each of the traits in varietal identification and overall genetic improvement. The study also shows the validity of using augmented design in the evaluation of accessions whose identity are unknown, as the characteristics observed in the checks used for this study were also observed in majority of the accessions studied, indicating that some of the accession studies might have a historical relationship with the checks.
5. Conclusions
The study has shown the extent of genetic variability within cassava accessions grown in southwest and north central regions of Nigeria using agromorphological markers, providing baseline information required for genetic improvement. High heritability values were identified for petiole length, plant height, number of storage roots per plant, angle of branching, height to first branching, harvest index, and lobe dimensions, which reflect strong genetic control, thereby making these traits reliable for promising selection criteria in breeding programs. In addition, Traits such as number of leaf lobes, petiole color, color of leaf vein, color of root pulp (parenchyma), color of root cortex, color of stem exterior and length of stipule showed significant genetic variability that could be explored for the genetic improvement of cassava and its productivity. Furthermore, accessions in cluster 1 and 2 can be considered potential selections for yield improvement in yield and climate adaptability improvement programs. Therefore, special attention should be given to these traits and clusters in future breeding programs, as improvement of these traits will impact the physiological efficiency, biomass accumulation and partitioning of assimilates, which consequentially affect yield and better adaptation across diverse environments.
Supplementary Materials
The following supporting information can be downloaded at: https://www.mdpi.com/article/10.3390/ijpb16040132/s1, Figure S1: Correlation between quantitative traits; Figure S2: Silhouette score for determining the optimal number of clusters based on qualitative traits; Figure S3: Silhouette score for determining the optimal number of clusters based on quantitative traits; Table S1a: Qualitative Traits and corresponding variations observed among 477 cassava accessions collected from South-West and North Central Nigeria at 3, 6, and 9 months after planting (MAP); Table S1b. Quantitative traits measured at 6 and 12 months after planting (MAP) and their code; Table S2: Frequency distribution of qualitative traits.
Author Contributions
Conceptualization, I.O.A., E.O.I. and A.O.E.; methodology I.O.A., E.O.I. and A.O.E.; formal analysis, I.O.A.; investigation and data curation, I.O.A., O.P.E., O.O.-E. and F.O.; writing—original draft preparation, I.O.A.; writing—review and editing, A.O.E., E.O.I. and O.O.-E.; supervision, O.A.O., T.O.F., T.A. and E.O.I.; funding acquisition, F.T., J.S.P. and A.O.E. All authors have read and agreed to the published version of the manuscript.
Funding
This study was supported by the Central and West African Virus Epidemiology (WAVE) Program for root and tuber crops through funding from the Bill and Melinda Gates Foundation and the UK Foreign, Commonwealth and Development Office, Grant/Award Number: INV-002969 (formerly OPP1212988).
Data Availability Statement
The dataset curated during and/or analyzed in the current study is available from the corresponding author on reasonable request.
Conflicts of Interest
The authors declare no conflicts of interest.
References
- Polthanee, A. Cassava as an insurance crop in a changing climate: The changing role and potential applications of cassava for smallholder farmers in Northeastern Thailand. For. Soc. 2018, 2, 121–137. [Google Scholar] [CrossRef]
- Online Statistical Database: Food Balance. FAOSTAT. Available online: https://www.fao.org/faostat/en/#data/QI (accessed on 1 June 2025).
- Ukpong-Umo, R. Sustained adoption of improved cassava varieties and food security in Nigeria: Implication for rural development. Int. J. Innov. Res. Soc. Sci. Strateg. Manag. Tech. 2022, 9, 1–11. [Google Scholar] [CrossRef]
- Aina, O.O.; Dixon, A.G.O.; Akinrinde, E.A. Genetic variability in cassava as it influences storage root yield in Nigeria. J. Biol. Sci. 2007, 7, 765–770. [Google Scholar] [CrossRef]
- Tumuhimbise, R.; Shanahan, P.; Melis, R.; Kawuki, R. Genetic variation and association among factors influencing storage root bulking in cassava. J. Agric. Sci. 2015, 153, 1267–1280. [Google Scholar] [CrossRef]
- Amelework, A.B.; Bairu, M.W. Advances in Genetic Analysis and Breeding of Cassava (Manihot esculenta Crantz): A Review. Plants 2022, 11, 1617. [Google Scholar] [CrossRef]
- Hoban, S.; Campbell, C.D.; da Silva, J.M.; Ekblom, R.; Funk, W.C.; Garner, B.A.; Godoy, J.A.; Kershaw, F.; MacDonald, A.J.; Joachim, M.; et al. Genetic diversity is considered important but interpreted narrowly in country reports to the Convention on Biological Diversity: Current actions and indicators are insufficient. Biol. Conserv. 2021, 261, 109233. [Google Scholar] [CrossRef]
- De Andrade, C.J.; De Andrade, L.M.; Rocco, S.A.; Sforça, M.L.; Pastore, G.M.; Jauregi, P. A novel approach for the production and purification of mannosylerythritol lipids (MEL) by Pseudozyma tsukubaensis using cassava wastewater as substrate. Sep. Purif. Technol. 2017, 180, 157–167. [Google Scholar] [CrossRef]
- Asare, P.A.; Galyuon, I.K.A.; Sarfo, J.K.; Tetteh, J.P. Morphological and molecular based diversity studies of some cassava (Manihot esculenta Crantz) germplasm in Ghana. Afr. J. Biotechnol. 2011, 10, 13900–13908. [Google Scholar] [CrossRef]
- Yoon, M.S.; Song, Q.J.; Choi, I.Y.; Specht, J.E.; Hyten, D.L.; Cregan, P.B. BARCSoySNP23: A panel of 23 selected SNPs for soybean cultivar identification. Theor. Appl. Genet. 2007, 114, 885–899. [Google Scholar] [CrossRef]
- Souza, D.C.L. Molecular techniques for characterization and conservation of medicinal and aromatic plants: A review. Rev. Bras. Plantas Med. 2015, 17, 495–503. [Google Scholar] [CrossRef]
- Fukuda, W.M.G.; Guevara, C.L.; Kawuki, R.; Ferguson, M.E. Selected Morphological and Agronomic Descriptors for the Characterization of Cassava; IITA: Ibadan, Nigeria, 2010; p. 25. [Google Scholar] [CrossRef]
- Federer, W.T. Augmented (or Hoonuiaku) Designs. Biom. Unit Tech. Rep. 1956, 2, BU-74-M. [Google Scholar]
- Aravind, J.; Mukesh Sankar, S.; Wankhede, D.P.; Kaur, V. augmentedRCBD: Analysis of Augmented Randomised Complete Block Designs. R Package Version 0.1.7. 2023. Available online: https://aravind-j.github.io/augmentedRCBD (accessed on 13 November 2025).
- Brooks, M.E.; Kristensen, K.; Van Benthem, K.J.; Magnusson, A.; Berg, C.W.; Nielsen, A.; Skaug, H.J.; Mächler, M.; Bolker, B.M. GlmmTMB balances speed and flexibility among packages for zero-inflated generalized linear mixed modeling. R J. 2017, 9, 378–400. [Google Scholar] [CrossRef]
- Burton, G.W. Quantitative inheritance in pearl millet (Pennisetum glaucum). Agron. J. 1951, 43, 409–417. [Google Scholar] [CrossRef]
- Burton, G.W. Qualitative inheritance in grasses. In Proceedings of the 6th International Grassland Congress, State College, PA, USA, 17–23 August 1952; Volume 1, pp. 277–283. [Google Scholar]
- Federer, W.T.; Searle, S.R. Model considerations and variance component estimation in augmented completely randomized and randomized complete blocks designs—Preliminary Version. Biom. Unit Tech. Rep. 1976, 8, BU-592-M. [Google Scholar]
- Sivasubramaniam, S.; Madhava Menon, P. Genotypic and phenotypic variability in rice. Madras Agric. J. 1973, 60, 1093–1096. [Google Scholar]
- Lush, J.L. Intra-sire correlations or regressions of offspring on dam as a method of estimating heritability of characteristics. J. Anim. Sci. 1940, 1940, 293–301. [Google Scholar] [CrossRef]
- Robinson, H.F. Quantitative genetics in relation to breeding on the centennial of Mendelism. Ind. J. Genet. Plant Breed. 1966, 26A, 171–187. [Google Scholar]
- Johnson, H.W.; Robinson, H.F.; Comstock, R.E. Estimates of genetic and environmental variability in soybeans. Agronomy 1955, 47, 314–318. [Google Scholar] [CrossRef]
- Lê, S.; Josse, J.; Husson, F. FactoMineR: A Package for Multivariate Analysis. J. Stat. Softw. 2008, 25, 1–18. [Google Scholar] [CrossRef]
- Hair, J.F.; Black, W.C.; Babin, B.J.; Anderson, R.E. Multivariate Data Analysis, 7th ed.; Prentice Hall Pearson: New York, NY, USA, 2010. [Google Scholar]
- Ward, J.H., Jr. Hierarchical grouping to optimize an objective function. J. Am. Stat. Assoc. 1963, 58, 236–244. [Google Scholar] [CrossRef]
- Murtagh, F.; Legendre, P. Ward’s hierarchical agglomerative clustering method: Which algorithms implement Ward’s criterion? J. Classif. 2014, 31, 274–295. [Google Scholar] [CrossRef]
- Rousseeuw, P.J. Silhouettes: A graphical aid to the interpretation and validation of cluster analysis. J. Comput. Appl. Math. 1987, 20, 53–65. [Google Scholar] [CrossRef]
- Karim, K.Y.; Ifie, B.; Dzidzienyo, D.; Danquah, E.Y.; Blay, E.T.; Whyte, J.B.; Kulakow, P.; Rabbi, I.; Parkes, E.; Iluebbey, P.; et al. Genetic characterization of cassava (Manihot esculenta Crantz) genotypes using agro-morphological and single nucleotide polymorphism markers. Physiol. Mol. Biol. Plants 2020, 26, 317–330. [Google Scholar] [CrossRef]
- Wang, W.; Feng, B.; Xiao, J.; Xia, Z.; Zhou, X.; Li, P.; Zhang, W.; Wang, Y.; Lindberg Møller, B.M.; Zhang, P. Cassava genome from a wild ancestor to cultivated varieties. Nat. Commun. 2014, 5, 5110. [Google Scholar] [CrossRef] [PubMed]
- Nadjiam, D.; Sarr, P.S.; Naïtormbaïdé, M.; Mbaïguinam, J.M.M.; Guisse, A. Agro-morphological characterization of cassava (Manihot esculenta Crantz) cultivars from Chad. Agric. Sci. 2016, 7, 479. [Google Scholar] [CrossRef]
- Daemo, B.B.; Yohannes, D.B.; Beyene, T.M.; Abtew, W.G. Genetic variability and divergence analysis in cassava (Manihot esculenta Crantz) accessions for storage root yield and other agronomic characters. J. Agric. Food Res. 2023, 14, 100874. [Google Scholar] [CrossRef]
- Mathew, A.M.; Bahadur, V.; Prasad, V.M.; Ghosh, G.; Mishra, S.; Topno, S.E. Study on genetic variability, heritability and genetic advance in tapioca (Manihot esculenta) under Allahabad Agro-Climatic conditions. J. Pharmacogn. Phytochem. 2017, 6, 1287–1290. [Google Scholar]
- Sivan, S.; Arya, K.; Sheela, M.N.; Revathi, B.S.; Krishnan, P.; Muthusamy, S.K. Genetic diversity analysis of Indian Cassava (Manihot esculenta Crantz) accessions using morphological and molecular markers. S. Afr. J. Bot. 2023, 161, 347–357. [Google Scholar] [CrossRef]
- Jiwuba, L.C. Genetic variability and genetic advance of elite varieties of cassava (Manihot esculenta Crantz). Niger. Agric. J. 2020, 51, 81–84. [Google Scholar]
- Rabbi, I.Y.; Kayondo, S.I.; Bauchet, G.; Yusuf, M.; Aghogho, C.I.; Ogunpaimo, K.; Uwugiaren, R.; Smith, I.A.; Peteti, P.; Agbona, A. Genome-wide association analysis reveals new insights into the genetic architecture of defensive, agro-morphological and quality-related traits in cassava. Plant Mol. Biol. 2022, 109, 195–213. [Google Scholar] [CrossRef]
- Kanaabi, M.; Settumba, M.B.; Nuwamanya, E.; Muhumuza, N.; Iragaba, P.; Ozimati, A.; Namakula, F.B.; Kayondo, I.S.; Baguma, J.K.; Nanyonjo, A.R. Genetic Variation and Heritability for Hydrogen Cyanide in Fresh Cassava Roots: Implications for Low-Cyanide Cassava Breeding. Plants 2024, 13, 1186. [Google Scholar] [CrossRef]
- Mahakosee, S.; Jogloy, S.; Vorasoot, N.; Theerakulpisut, P.; Holbrook, C.C.; Kvien, C.K.; Banterng, P. Seasonal variation in canopy size, light penetration and photosynthesis of three cassava genotypes with different canopy architectures. Agronomy 2020, 10, 1554. [Google Scholar] [CrossRef]
- Diaguna, R.; Suwarto, S.; Santosa, E.; Hartono, A.; Pramuhadi, G.; Nuryartono, N.; Yusfiandayani, R.; Prartono, T. Morphological and Physiological Characterization of Cassava Genotypes on Dry Land of Ultisol Soil in Indonesia. Int. J. Agron. 2022, 2022, 3599272. [Google Scholar] [CrossRef]
- Brice, D.K.E.; Pierre, Z.G.; Sidoine, E.B.; Alexandre, D.A. Morphological characterization of cassava (Manihot esculenta Crantz) accessions collected in the centre-west, south-west and west of Cote d’Ivoire. Greener J. Agric. Sci. 2014, 4, 220–231. [Google Scholar]
- Laila, F.; Zanetta, C.U.; Karuniawan, A.; Waluyo, B. Classifying cassava (Manihot esculenta Crantz.) clones based on principal component analysis of specific characters for use as selection criteria. IOP Conf. Ser. Earth Environ. Sci. 2021, 911, 012007. [Google Scholar] [CrossRef]
- Tighankoumi, G.; Daniel, D.K.; Pangirayi, T.; Kwame, A.I. Phenotypic Variation in a Panel of 149 varieties of Cassava (Manihot esculenta Crantz): A Pre-Breeding Investigation in Togo. Int. J. Plant Soil Sci. 2024, 36, 554–574. [Google Scholar] [CrossRef]
- Kouakou, D.A.; Koffi, K.K.; Angui, C.M.V.; Komenan, A.O.; Bi, A.I.Z. Agro morphological variability of cassava varieties cultivated in five regions of Côte d’Ivoire based on quantitative traits. J. Appl. Biosci. 2023, 181, 18962–18973. [Google Scholar] [CrossRef]
Disclaimer/Publisher’s Note: The statements, opinions and data contained in all publications are solely those of the individual author(s) and contributor(s) and not of MDPI and/or the editor(s). MDPI and/or the editor(s) disclaim responsibility for any injury to people or property resulting from any ideas, methods, instructions or products referred to in the content. |
© 2025 by the authors. Licensee MDPI, Basel, Switzerland. This article is an open access article distributed under the terms and conditions of the Creative Commons Attribution (CC BY) license (https://creativecommons.org/licenses/by/4.0/).