Article

Evaluating the Impact of Mineral Nutrient Concentration and Substrate Volume on the Development of Three Annual Coastal Plant Species

by
Astra Jēkabsone
1,
Una Andersone-Ozola
1,
Lidia Banaszczyk
2 and
Gederts Ievinsh
1,*
1
Department of Ecology, Faculty of Medicine and Life Sciences, University of Latvia, LV-1004 Rīga, Latvia
2
Laboratory of Plant Cytology and Embryology, Department of Plant Experimental Biology and Biotechnology, Faculty of Biology, University of Gdansk, 80-309 Gdansk, Poland
*
Author to whom correspondence should be addressed.
Int. J. Plant Biol. 2025, 16(4), 118; https://doi.org/10.3390/ijpb16040118 (registering DOI)
Submission received: 31 August 2025 / Revised: 17 September 2025 / Accepted: 9 October 2025 / Published: 11 October 2025
(This article belongs to the Section Plant Physiology)

Abstract

Soil mineral nutrient heterogeneity is a distinctive characteristic of coastal habitats, yet its impact on plant growth and development remains uncertain. The objective of the present study was to establish an experimental system for evaluating the influence of mineral nutrient availability on the development of three distinct short-lived wild coastal plant species: Phleum arenarium, Plantago coronopus, and Ranunculus sceleratus. These plants were cultivated in containers of different volumes employing an inert substrate with varying proportions of commercial garden soil in controlled conditions. Low mineral nutrient concentration served as a factor inhibiting plant vegetative growth for both P. arenarium and R. sceleratus plants, albeit with a substrate volume-dependent effect. In contrast, P. coronopus exhibited relatively low root biomass and exhibited minimal susceptibility to alterations in mineral nutrient concentration. Conversely, proportional allocation to roots decreased with increasing mineral nutrient concentration, mirroring the pattern observed for P. arenarium. Notably, for R. sceleratus, this effect was pronounced only at a high substrate volume. Furthermore, allocation to roots decreased with increasing substrate volume, but this occurred only at a high mineral nutrient concentration. The substrate, similar to that in coastal habitats, incorporated quartz sand with varying proportions of mineral-rich organic matter, providing comparable plant-available mineral concentrations for analyzing the effects of nutrient concentration, substrate volume, and genetic variability on plant growth and development. For future experiments, a wider range of mineral concentrations and more individual concentrations should be used to assess mineral availability more realistically.

Graphical Abstract

1. Introduction

Coastal habitats are distinct ecosystems where marine and terrestrial influences converge, resulting in a unique plant community that significantly contributes to ecosystem functioning and services. Annual plant species play a crucial role in coastal vegetation, particularly during the pioneer stages of strandlines and low-salinity marshes [1]. In contrast to population ecology aspects [1], the ecophysiology of coastal annuals has received limited attention [2,3,4], except for studies related to salinity effects [5,6,7]. One intriguing aspect of annual species’ adaptation to coastal habitats is the influence of environmental factors, particularly nutrient status, on their development [3,8]. Resource allocation to reproduction has been extensively studied for annual plant species, as it reflects the success of the adaptive strategy for species survival, contrasting with perennial species that have a relatively large proportion of possible asexual propagation [9].
Mineral nutrient availability and soil nutrient heterogeneity have long been recognized as significant factors influencing plant community structure [10,11,12,13]. However, this aspect has largely been overlooked in ecophysiological research. In coastal habitats, high mineral nutrient heterogeneity is a defining characteristic of the soil [14]. Nevertheless, it has only recently been studied in field [15,16] or laboratory [17,18] conditions. The concentration of individual elements in the rhizosphere of coastal species can fluctuate by as much as several dozen times across different growing locations, and it also undergoes significant changes during the vegetation season [15,16]. These findings demonstrate that coastal plant species have adapted to a diverse range of essential mineral nutrient availability, exhibiting remarkable morphophysiological plasticity. Nevertheless, the potential impact of mineral heterogeneity on the growth and development of annual species, which ensures their generative renewal and distribution, remains unclear.
It is crucial to recognize that mineral nutrient availability is a multifaceted phenomenon. The quantity of minerals accessible to plants is influenced by both the soil mineral concentration and the available soil volume for root development [19]. Numerous plant species naturally thrive in environments characterized by limited soil volume for root establishment, such as alpine and coastal ecosystems. While the length of roots and the volume occupied by an individual’s root system serve as species-specific indicators, it is plausible that plants possess the ability to adjust root and aerial growth in response to the available soil volume [20]. Research suggests that plants possess the capacity to perceive the available space within the substrate for root formation [21]. Conversely, the root/shoot biomass ratio can serve as a significant indicator of a species’ ecological strategy, with higher root partitioning occurring under more challenging conditions [22].
It is evident that the initial concentration of plant-available mineral nutrients in soil is a significant determinant of the initial plant growth rate. It is hypothesized that plants perceive the presence of specific ions in the substrate and internal tissues either through transceptors or transcription factors [23]. However, it is also plausible that the total concentration of soluble ions in the soil (which can be expressed in terms of electrical conductivity) can also be sensed. Obviously, during the later stages of plant development, with the expansion of the root system, the total amount of nutrients in a specific soil volume becomes crucial for further growth. Consequently, the volume of soil accessible to the roots of an individual plant can be considered to be of critical importance in addition to nutrient concentration [24]. To date, only a limited number of studies have addressed the mineral nutrient availability problem in relation to the concentration–volume relationship, which collectively determine the amount of minerals available to an individual plant [25]. One ecological aspect considered in this context is the plant’s response to the presence of neighbors, where both nutrient concentration and soil volume significantly influence the outcome of the relationship [21,24,26].
For annual rosette-forming plants with a limited lifespan, a relatively simple allocation strategy can be proposed [27]. Biomass allocation to roots is essential for efficient nutrient acquisition from the soil. Allocation to leaves enables photosynthetically dependent carbon acquisition, which is necessary for supporting the growth of both roots and generative structures. Conversely, increased biomass to generative structures is associated with the primary biological task, reproduction. It is important to note that biomass allocation to the three sinks does not necessarily need to be tightly controlled for the most efficient reproduction outcome. It appears that soil nutrient availability can be among the most significant environmental cues influencing biomass allocation. Therefore, the following question arises: how does biomass allocation between roots, vegetative parts, and generative structures change in response to changes in soil nutrient concentration and nutrient availability, which are affected by the soil volume available to roots?
It can be hypothesized that there exists an optimal soil volume for a specific species regarding resource allocation to plant reproduction. While low nutrient concentrations can serve as a factor increasing resource allocation for root growth [28], this strategy may only be efficient if there is a concomitant increase in nutrient concentration for newly established roots. However, when soil volume is constrained, newly grown roots are subjected to the same mineral nutrient concentration as older roots, rendering resource allocation in root growth redundant. In this scenario, excessively low concentrations of mineral nutrients could function as environmental cues indicating reduced growth and/or slowed developmental processes.
Three model species were selected for this study, all representing rosette-forming short-lived coastal plants: Ranunculus sceleratus L. (Ranunculaceae), Plantago coronopus L. (Plantaginaceae), and Phleum arenarium L. (Poaceae). P. arenarium is a winter annual species that requires a low-temperature period for induction of tillering and flowering. It is suggested to represent pioneer species of nutrient-poor dry dune grasslands in Germany [29]. Due to a relatively poorly developed root system, P. arenarium exhibits low competitive ability, as roots can only reach up to 8 cm soil depth [3]. Both P. coronopus and P. arenarium appear to be nutrient-limited in natural conditions. However, in contrast to P. arenarium, which is characteristic of dry calcareous sand dune soils, P. coronopus occurs in wetter soils with a low-to-moderate organic matter content and is localized in rock crevices with a small volume of soil [30,31]. It has been suggested that, due to differences in microhabitat conditions, P. coronopus plants may exhibit annual, biennial, or short-lived polycarpic perennial behavior [32]. A wide range of morphological types have been established for the species in natural conditions [33], including reproductive allocation rates [34]. These differences were associated with geographical location and habitat type. However, plants from different P. coronopus populations exhibited variations in leaf water content, reproductive allocation, flowering incidence, and other morphological traits when cultivated in controlled conditions [35]. Consequently, both phenotypic plasticity and genetic differentiation may have contributed to the differences between populations of P. coronopus. In contrast, R. sceleratus can be characterized as semi-aquatic nitrophilous species, which require relatively higher nitrogen levels for optimal growth [36,37]. However, R. sceleratus has also been classified as a ruderal species, representing natural pioneer species exclusively associated with habitats that have been disturbed by natural factors. These species exhibit a high reproductive allocation rate but have low nutrient demand and low competitiveness [38].
The objective of the present study was to establish an experimental system for assessing the impact of mineral nutrient availability on the development of various short-lived wild coastal plant species. The primary function of the model system was to provide evidence for the potential alteration of plant biomass distribution in different parts in response to variations in mineral concentration and available quantity, particularly concerning the contribution to the development of reproductive structures. Considering the ecophysiological heterogeneity among the model species, it is anticipated that there will be distinct responses to substrate mineral nutrient concentration and/or available substrate volume.

2. Materials and Methods

2.1. Experimental System

The experimental approach employed in the research involved altering the mineral availability in the substrate by incorporating commercial garden soil (Biolan, Eura, Finland) into inert quartz sand (Saulkalne S, Saulkalne, Latvia) in specific volume ratios. The experimental settings were tailored to accommodate the unique characteristics of each model plant, as detailed in Table 1. Given the potential for R. sceleratus to exhibit the highest biomass, four distinct substrate volumes were utilized: 0.2, 0.4, 1, and 4 L, each employing three levels of mineral availability. These levels were achieved by amending the quartz sand with garden soil at ratios of 10, 40, and 70% (v/v). In contrast, for P. coronopus, plants from four distinct populations were employed, as genetic variations were anticipated. Due to the species’ likely limited root volume under natural conditions, only a single container volume (0.2 L) was utilized, accompanied by four soil substitution rates: 20, 40, 60, and 80% (v/v) garden soil amendment. For P. arenarium, three substrate volumes (0.2, 0.4, and 1 L) were employed, each featuring four levels of mineral nutrient availability: 10, 40, 70, and 100% garden soil amendment rate (v/v). The characteristics of the garden soil and quartz sand are presented in Table S1 [39]. The soil was made from decomposed peat (fraction < 20 mm), supplemented with ground magnesium limestone (4 kg m−3) and a complex NPK fertilizer (12-14-24 + microelements, 1 kg m−3). It exhibited relatively balanced concentrations of plant-available mineral elements, with notable exceptions for high S and low Zn and B concentrations. The quartz sand (SiO2) was of high purity (>99% silica) and consisted of well-sorted particles (0–1 mm).

2.2. Plant Material and Cultivation

Greenhouse-cultivated plants of R. sceleratus, originally introduced into culture from a seed material collected in a salt-affected, wet sandy beach habitat in Salacgrīva, Latvia [37], were utilized as a source of seeds. Seeds of P. coronopus were collected from four populations on the island of Bornholm, Denmark, in August 2023 (Table S2). Seeds of P. arenarium were initially collected on the outskirts of the coastal road in Ovīši, Latvia, and were subsequently employed plant propagation and seed production in greenhouse environments. All seeds were stored at 4 °C.
Surface sterilization of seeds was conducted using a 50% aqueous solution of household bleach (Ace, Procter & Gamble, Warsaw, Poland) for 10 min, followed by a thorough rinse with sterile deionized water (10 × 2 min). The sterilized seeds were then placed in plastic tissue culture containers (1 L) containing a substrate mixture of quartz sand (Saulkalne S, Saulkalne, Latvia) and autoclaved commercial garden soil (Biolan, Eura, Finland) in a 9:1 (v/v) ratio. These containers were subsequently placed in a plant growth cabinet MLR-352H (Sanyo Electric, Osaka, Japan) with a 40 μmol m−2 s−1 photon flux density of photosynthetically active radiation, a photoperiod of 16 h, and a temperature of 20/15 °C during the day and night, respectively.
After 20 days, when the seedlings of R. sceleratus and P. coronopus reached the second true leaf stage, they were utilized for the establishment of experiments. In contrast, the seedlings of P. arenarium were kept in the same conditions as previously described, but at a temperature of 4 °C for 5 weeks to simulate overwintering. Subsequently, these seedlings were also employed for the establishment of experiments.
Seedlings were individually transplanted into appropriately sized plastic containers filled with a mixture of moistened garden soil and quartz sand in specific proportions (Table 1). For each treatment combination (container volume and soil substitution rate), five individual plants served as replicates. Initially, the containers were placed in closed 48 L plastic boxes and gradually adapted to greenhouse conditions by gradually increasing the duration of ventilation. During the winter-spring season (from February to April), an experimental automated greenhouse (HortiMaX, Maasdijk, The Netherlands) was utilized for plant cultivation. Supplemental lighting was provided by Master SON-TPIA Green Power CG T 400 W (Philips, Amsterdam, The Netherlands) and Powerstar HQI-BT 400 W/D PRO (Osram, Munich, Germany) lamps, which emitted a photon flux density of photosynthetically active radiation of 380 μmol m−2 s−1 at the plant level and maintained a 16 h photoperiod. The day-night temperature was set at 22/15 °C, and the relative air humidity was maintained at 60 to 70%.
Individual containers were randomly positioned on a greenhouse bench and relocated weekly. Substrate water content was individually monitored using a HH2 moisture meter with a WET-2 sensor (Delta-T Devices, Burwell, UK) on a daily basis. Plants were watered with deionized water to maintain substrate water content between 50 and 60%. Electrical conductivity (EC) in the substrate was measured thrice for each experiment, utilizing the HH2 moisture meter with WET-2 sensor: prior to transplanting seedlings and twice during cultivation. Once a week, representative plants from each treatment were photographed to document their development. The experiments were conducted for 57, 60, and 56 days for R. sceleratus, P. coronopus, and P. arenarium, respectively.

2.3. Nondestructive Physiological Measurements

Leaf chlorophyll concentration was determined using a chlorophyll meter (CCM300, Opti-Sciences, Hudson, NH, USA). For R. sceleratus, two measurements were conducted on the 35th and 40th days of cultivation. Similarly, for P. arenarium, two measurements were performed on the 13th and 37th days of cultivation. Chlorophyll a fluorescence was measured using a Handy PEA fluorometer (Hansatech Instruments, King’s Lynn, UK) on the 40th day for R. sceleratus. For each individual plant, two measurements were taken for both chlorophyll concentration and chlorophyll a fluorescence, with a total of 10 independent measurements per treatment. Both measurements were taken at the same time of day, between 9:00 and 11:00. The most important leaves for photosynthesis of each plant were selected for measurements, the condition/age of which was chosen according to preliminary experiments for each species used. Fluorescence measurements were performed on leaves that were previously darkened for at least 20 min using special clips supplied by the equipment manufacturer. An analysis of fluorescence data was conducted using the PEA Plus software (version 3.11, Hansatech Instruments, King’s Lynn, UK). Two fluorescence parameters were utilized to characterize the photochemical activity of photosynthesis: the maximum quantum efficiency of photosystem II (Fv/Fm), calculated as (Fm − F0)/Fm, and the Performance Index Total (PIT) [41]. The PIT combines four function-related (trapping of absorbed exciton, electron transport between the photosystems, reduction in end-electron acceptors, and status of photosystem I) parameters.

2.4. Plant Harvest

Upon the termination of the experiments, individual plants were separated into parts based on their morphological characteristics. These parts encompassed leaves, flower stalks, inflorescences (which include flowers, a portion of stalks, fruits, and seeds), and roots. Prior to and after the drying process, each plant material was weighed separately. The drying procedure was conducted in an oven at a temperature of 60 °C for a duration of 72 h. Subsequently, the tissue water content was calculated as g of H2O per g of dry mass.

2.5. Data Analysis

The data were analyzed by KaleidaGraph (v. 5.0, Synergy Software, Reading, PA, USA). Statistical significance of differences for measured parameters between treatments was evaluated by two-way ANOVA followed by post hoc analysis by Tukey honestly significant difference test. The two factors considered were GS concentration (mineral nutrient concentration) and substrate volume (for R. sceleratus and P. arenarium) or GS concentration and genotype (for P. coronopus). Significant differences were indicated at p < 0.05.

3. Results

3.1. Experiment with Ranunculus sceleratus

In an experiment conducted with R. sceleratus, four distinct container volumes, each with a different level of mineral nutrient availability, were utilized. These levels were achieved by substituting a commercial garden soil (GS) with varying proportions of quartz sand (10, 40, 70%). After replanting the seedlings in the experimental substrates, the plants were cultivated for 57 days, and their developmental status was assessed weekly (Figure 1).
The results demonstrated that both mineral nutrient availability and container volume significantly impacted plant development. At low mineral nutrient availability (10% GS amendment), plant growth exhibited a pronounced decline, irrespective of the container volume. The transition to the generative phase was not observed, except for one individual in a 1 L container, which exhibited floral structure formation without flower stalk development. No visual signs of leaf senescence were evident in these plants.
Conversely, at moderate mineral nutrient availability (40% GS amendment), plants in 1 L containers demonstrated the earliest flower stalk development. The generative phase for plants cultivated in 0.4 L and 4 L containers commenced a week later, while flower stalk development for plants in 0.2 L containers was observed only in the final week of the experiment (Figure 1).
At the highest nutrient availability (70% GS), the generative phase commenced simultaneously for plants cultivated in 0.4 L and 1 L containers, coinciding with flower stalk development in 40% GS plants in 1 L containers. The transition of flowering for 0.2 L plants occurred a week later, and flower stalk development was also observed for plants in 4 L containers a week later (Figure 1).
Initially, according to visual observations, vegetative development was most pronounced for plants in 1 L containers (days 22 and 29, Figure 1). However, further intense leaf growth was evident for plants in 4 L containers (days 36 and 43). For plants at moderate and high nutrient availability, the transition to flowering was accompanied by yellowing of older rosette leaves, with this phenomenon being initially more pronounced for plants cultivated at smaller volumes.
Substrate electrical conductivity (EC) served as an indicator of alterations in the total amount of soluble nutrients. Cultivation under conditions of limited mineral supply prevented their consumption throughout the experiment (Figure 2). At both moderate and high nutrient availability rates, soil soluble mineral content had reached its lowest level by 31 days after the commencement of cultivation for plants in all container volumes except 4 L (Figure 2A), which reached this level by day 40 (Figure 2B).
Upon the termination of the experiment, the biomass of leaves, inflorescences and roots were significantly affected by both nutrient concentration and substrate volume (p < 0.01), and there was a significant interaction between the two factors (p < 0.01), with large effect sizes (ηp2 > 0.14) (Figure 3). The highest leaf biomass was observed in plants subjected to a 70% GS treatment in 4 L containers, followed by these at 70% GS in 1 L and 40% GS in 4 L treatments, with no significant difference between the latter two treatments (Figure 3A). There was a relatively small but statistically significant leaf biomass increase with increase in GS% for plants grown in 0.2 and 0.4 L containers, but a significant difference between the two container volumes was found only at 70% GS. The biomass of generative structures increased with increase in mineral nutrient availability (Figure 3B). Significant differences were found. In general, the effect of mineral nutrient availability and substrate volume on root biomass exhibited a pattern analogous to that observed for leaf biomass, with relatively smaller discrepancies between plants in 1 and 4 L containers between plants in 0.2 and 0.4 L containers, but not between the plants in 1 and 4 L containers. In general, the effect of mineral nutrient availability and substrate volume on root biomass exhibited a pattern analogous to that observed for leaf biomass, with relatively smaller discrepancies between plants in 1 and 4 L containers (Figure 3C).
Among other measured morphological parameters, the number of rosette leaves significantly increased with increase in mineral nutrient availability for R. sceleratus plants in 1 and 4 L containers (Table S3). There were no significant differences between the plants in 0.2 and 0.4 L containers for this parameter. The number of inflorescences significantly increased from 40 to 70% GS for all container volumes, with significant differences between 0.2 and 0.4 L, but not between 1 and 4 L plants. However, differences in flower talk height between different treatments were relatively small, while the biomass of flower stalks varied more. Changes in total dry biomass of plants exhibited a similar pattern as that for leaf biomass. Water content in leaf blades significantly increased only for plants cultivated in 4 L containers at 70% GS. In contrast, water content in roots tended to decrease with increasing mineral nutrient availability only for plants grown in 0.2 and 0.4 L containers.
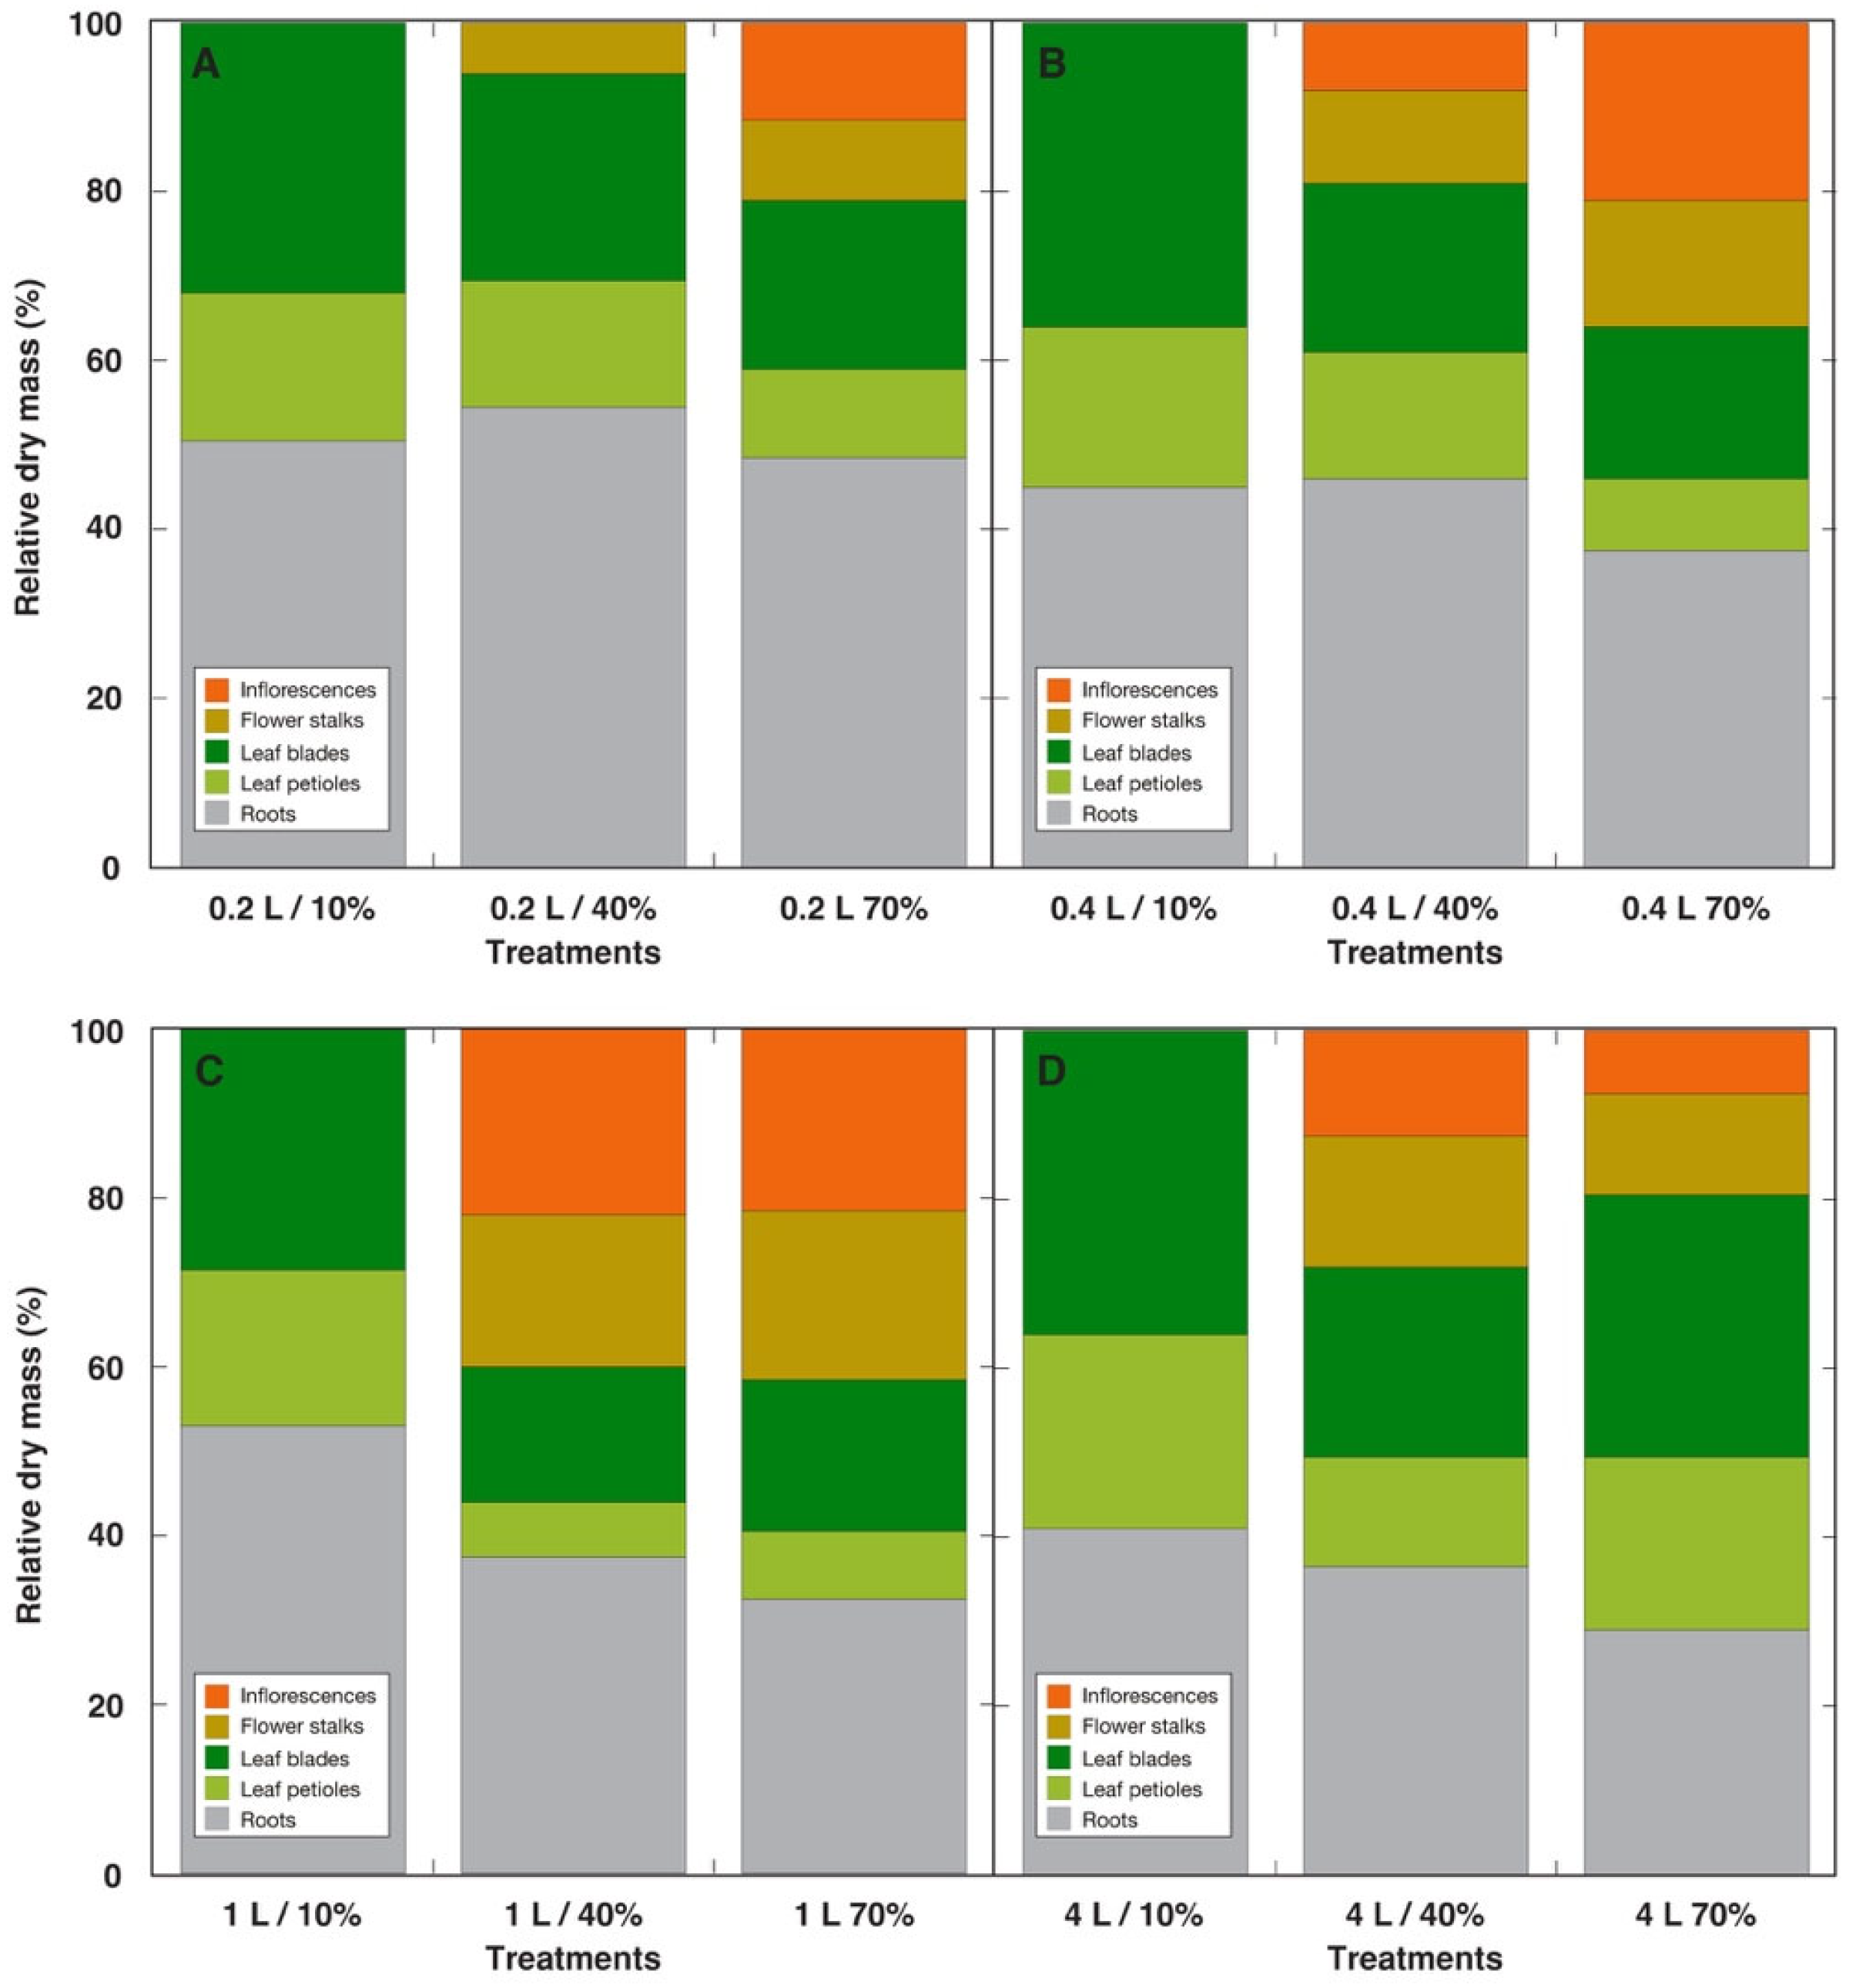
In the context of relative resource allocation to different plant parts, the effect of increasing rate of mineral nutrient availability on the background of different substrate volume was shown (Figure 4). In respect to the increasing substrate volume, it is evident that there were no regular changes in the allocation for plants grown at 10% GS. However, at 40 and 70% GS, allocation to generative structures increased at the expense of roots, but it was maximum only in a specific volume of substrate, which was 1 L at 40% GS and 0.4 and 1 L for 70% GS. When the availability of mineral nutrients was considered, allocation to generative structures increased at the expense of leaves for plants grown in 0.2 L containers (Figure 4A). The response was similar for plants in 0.4 L containers, but with some reduction in allocation to roots (Figure 4B). For plants grown in 1 L containers, the optimal allocation to generative structures was already achieved at 40% GS rate, and both leaf and root allocation decreased (Figure 4C). However, plants in 4 L containers showed low generative allocation, which decreased with increasing GS amendment from 40 to 70% (Figure 4D).
Quantitative estimation of leaf senescence differences across treatments was achieved through the measurement of leaf chlorophyll concentration (Figure 5). At the initial measurement, conducted 35 days after the start of the experiment, container volume appeared to be the primary factor influencing leaf chlorophyll concentration for R. sceleratus plants (p < 0.01, ηp2 = 0.421), while the effect of nutrient concentration was not significant (p = 0.0569, ηp2 = 0.027). However, the observed differences were predominantly not statistically significant due to substantial individual variability (Figure 5A). On the second measurement, conducted on day 40, both factors had significant effect on leaf chlorophyll concentration (p < 0.01), with large effect sizes (ηp2 > 0.14), and there was a significant interaction between them (p < 0.01, ηp2 = 0.133). A significant difference in leaf chlorophyll concentration was observed in plants cultivated at 70% GS across various container volumes on the second measurement, conducted on day 40 (Figure 5B).
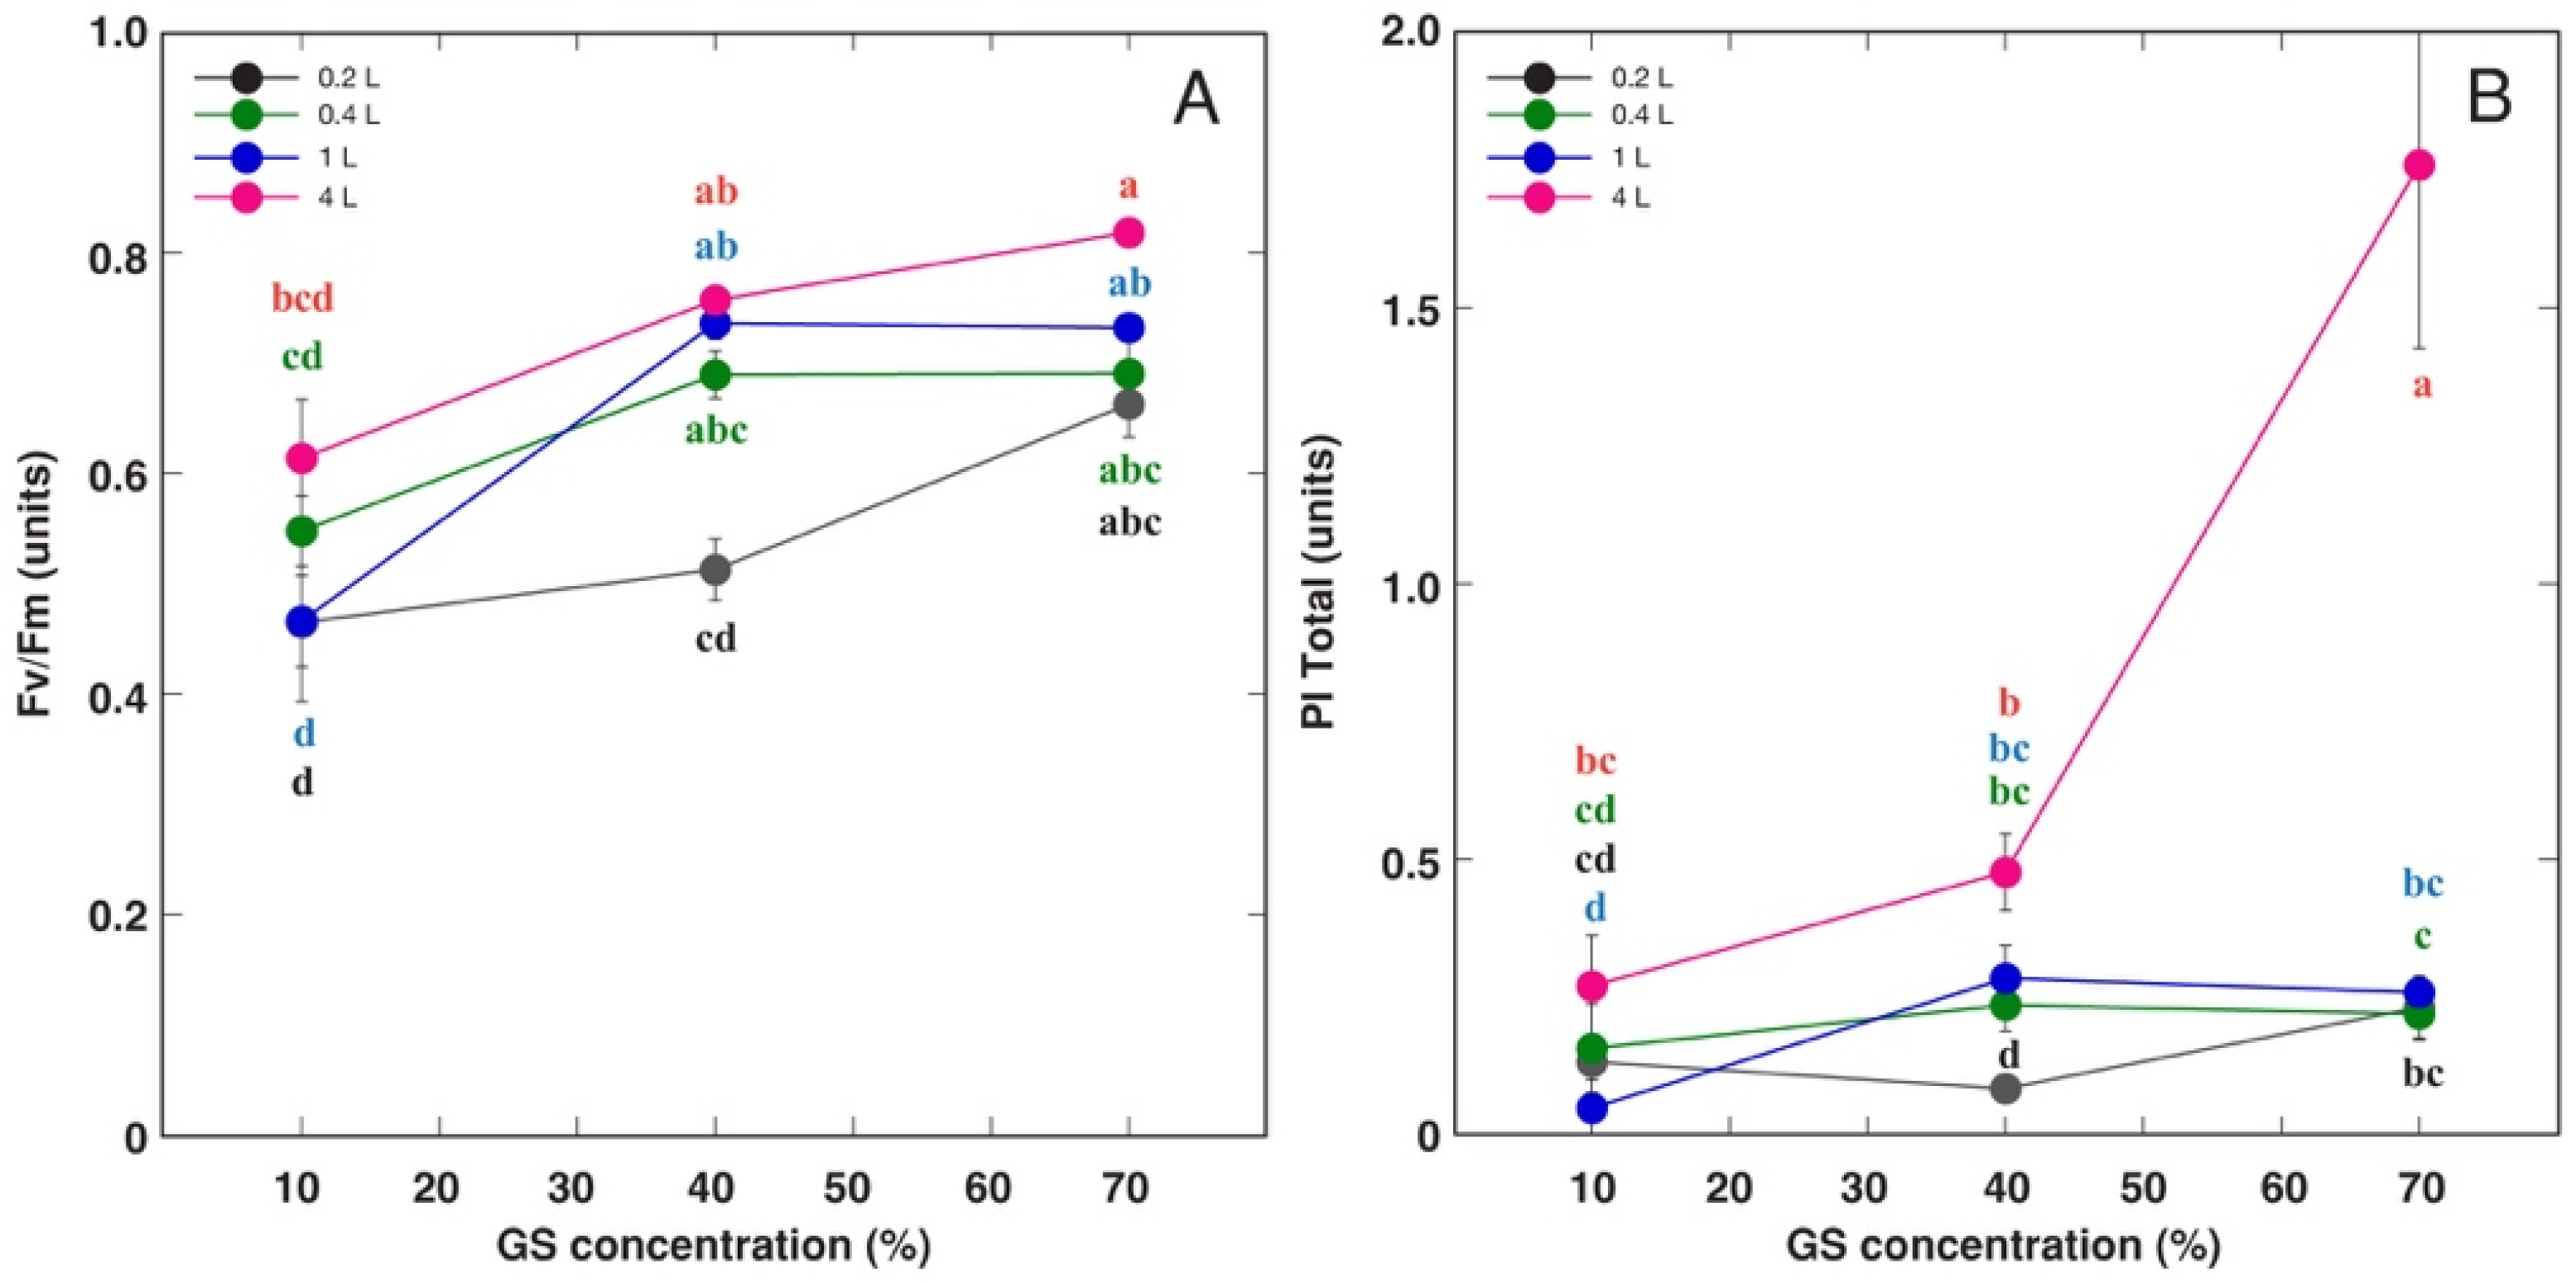
The chlorophyll a fluorescence parameter Fv/Fm, which measures maximum quantum efficiency of photosystem II, was significantly affected by both factors (p < 0.01) with large effect sizes (Figure 6A). There was a significant interaction between the both factors (p = 0.0416), but the effect size was small. Fv/Fm exhibited a highly damaged state for plants cultivated at 10% GS amendment rate. However, there was some improvement observed with increasing substrate volume and mineral availability (Figure 6A). For another fluorescence parameter, Performance Index Total, the effects of both mineral concentration and substrate volume were statistically significant (p < 0.01), with significant interaction between them (p < 0.01) (Figure 6B). The results indicated that significant performance of photosystem II activity was evident only for R. sceleratus plants at 70% GS rate in 4 L containers.

3.2. Experiment with Plantago coronopus

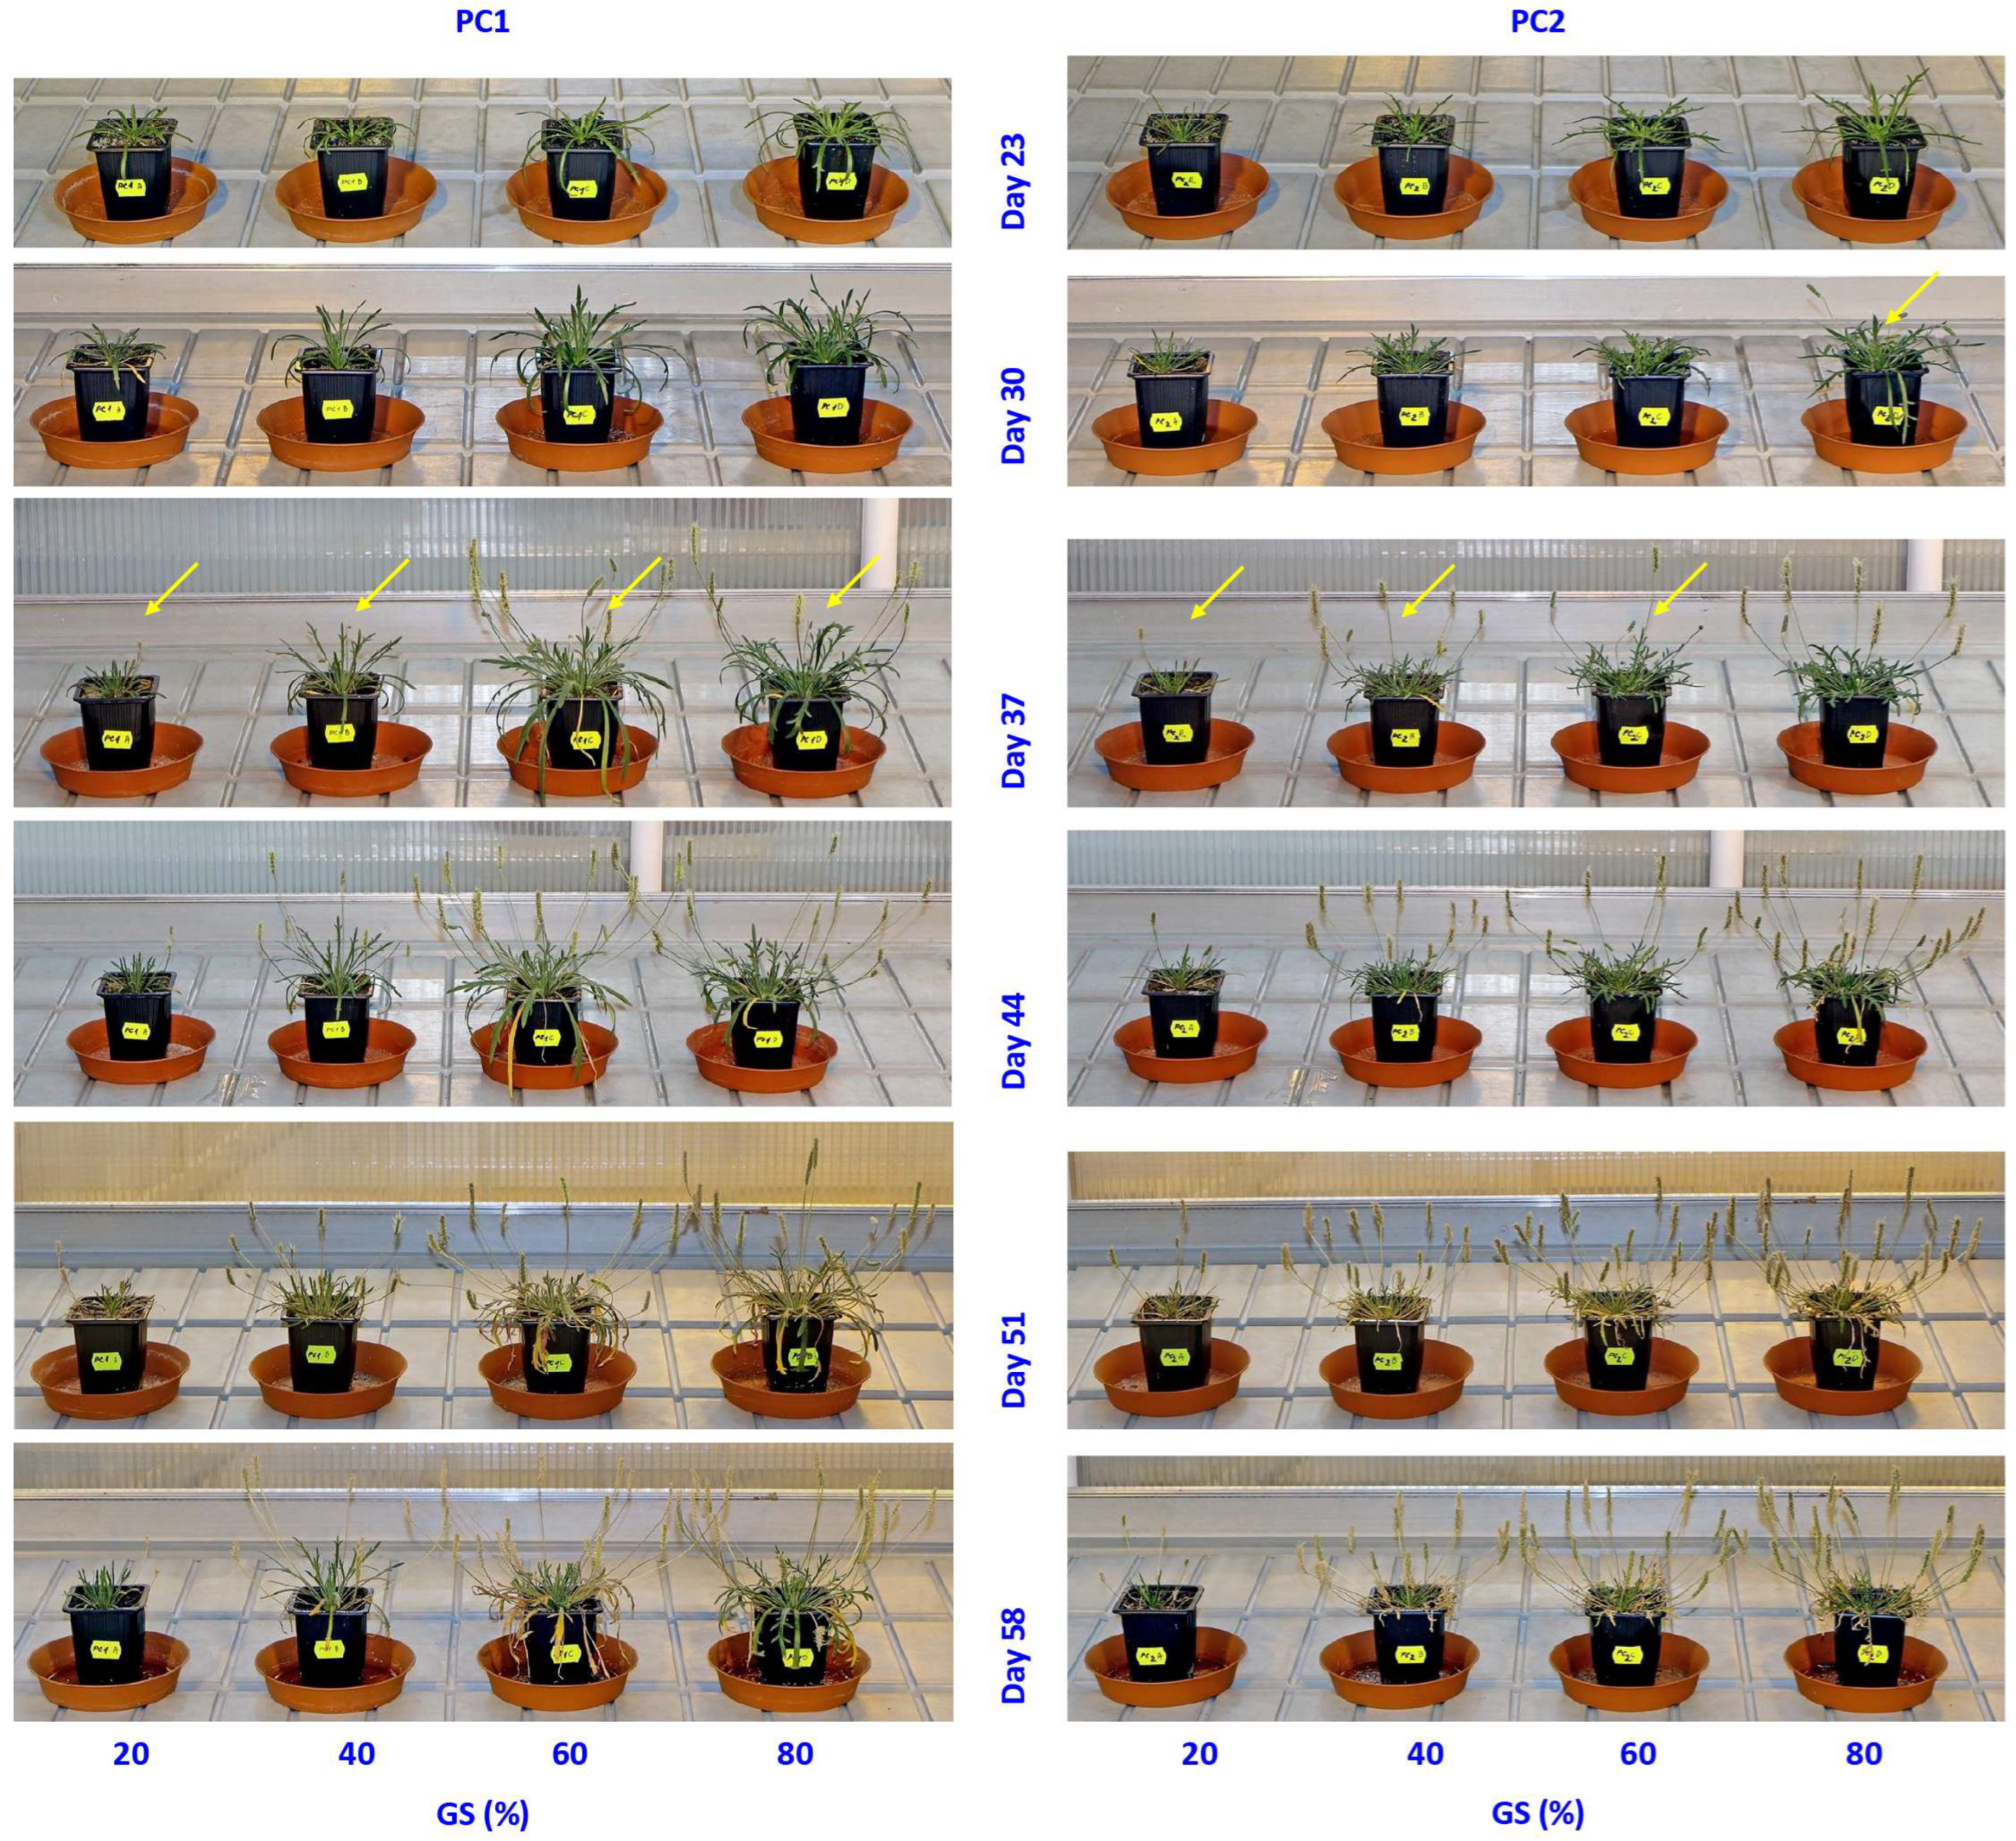
In the experiment with P. coronopus, four different accessions (PS1, PC2, PC3, PC4) from the island of Bornholm were used. These accessions were cultivated in 0.2 L containers, with varying rates of GS amendment (20, 40, 60, and 80%). The plants were cultivated for 60 days after replanting, and their development were monitored weekly (Figure 7). It was observed that the accessions exhibited distinct morphological types, either with prostrate (PC1 and PC3) or erect rosette leaves (PC4), and an intermediate phenotype was seen for PC2. The transition to flowering was both accession-specific and influenced by mineral nutrient availability. PC2 plants cultivated at 80% GS amendment rate exhibited the earliest flowering. One week later, flowering commenced for all other mineral nutrient availability rates for PC2 and all treatments for PC1 plants. At the same time, flower stalk development started for both PC3 and PC4 plants cultivated at all amendment rates except 20% GS. PC4 plants at GS 20% initiated flower development one additional week later, while PC3 plants at GS 20% did not begin generative development until the end of the experiment.
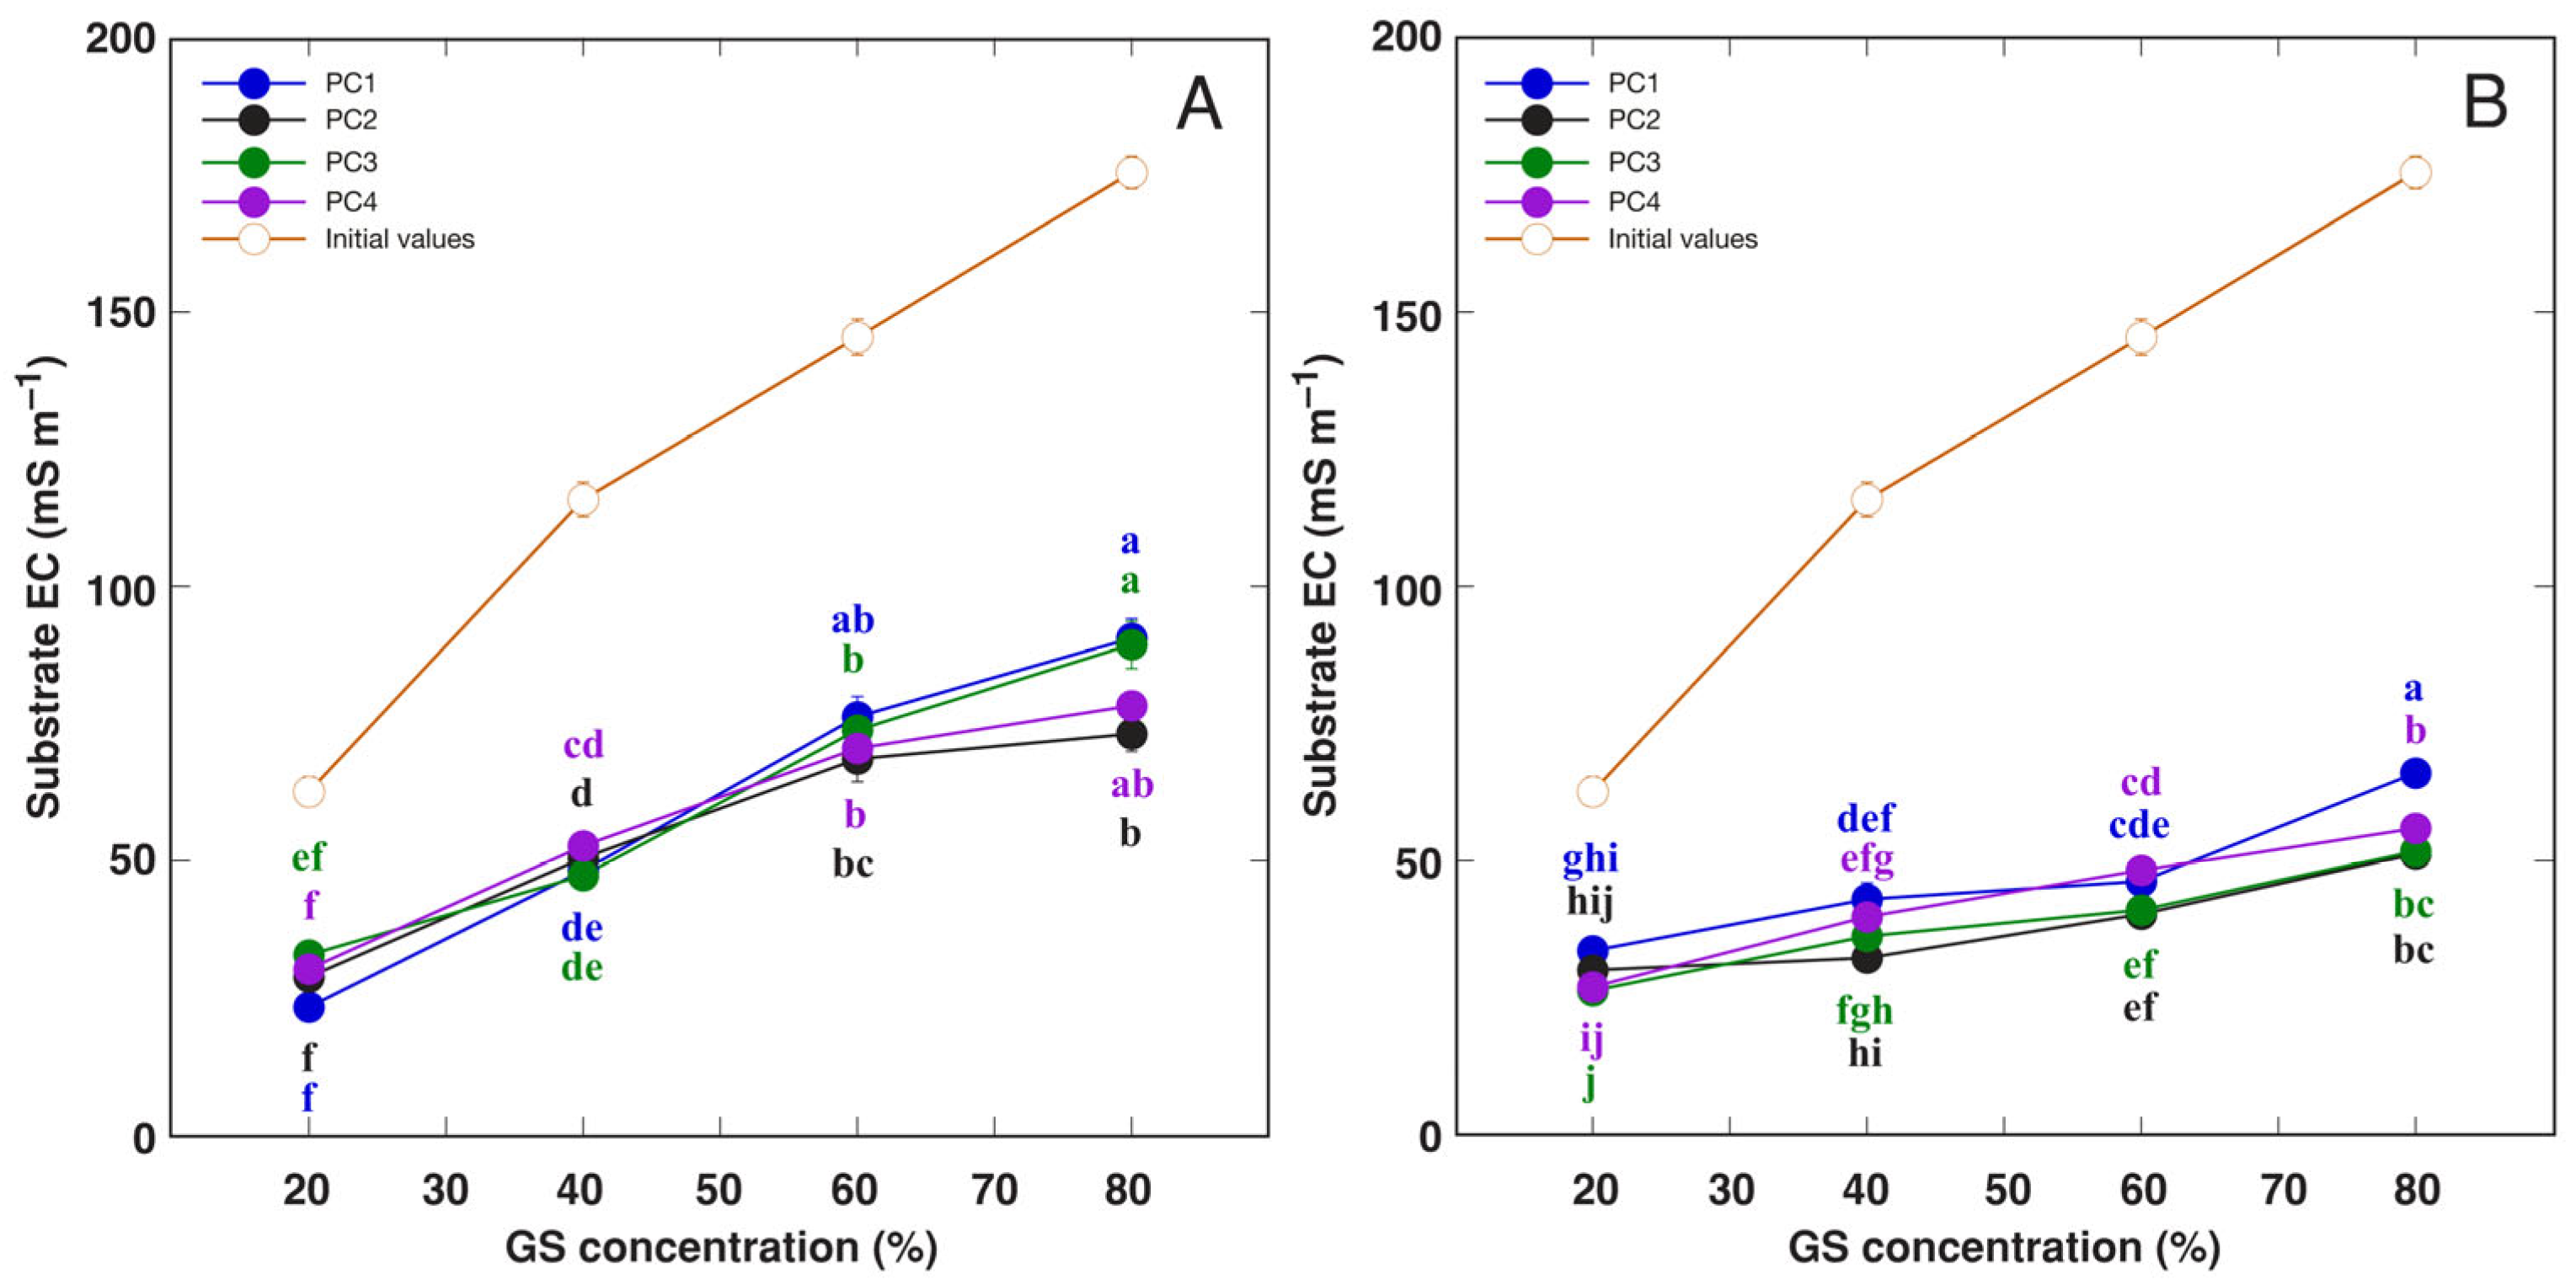
As evidenced by alterations in substrate EC values, the lowest level of soluble nutrient content was attained already at day 29 for P. coronopus plants cultivated at 20% GS (Figure 8). By day 34, nutrient reserves were depleted also for plants at 40 and 60% GS rate. Notably, there were no pronounced differences among the various accessions in this regard.
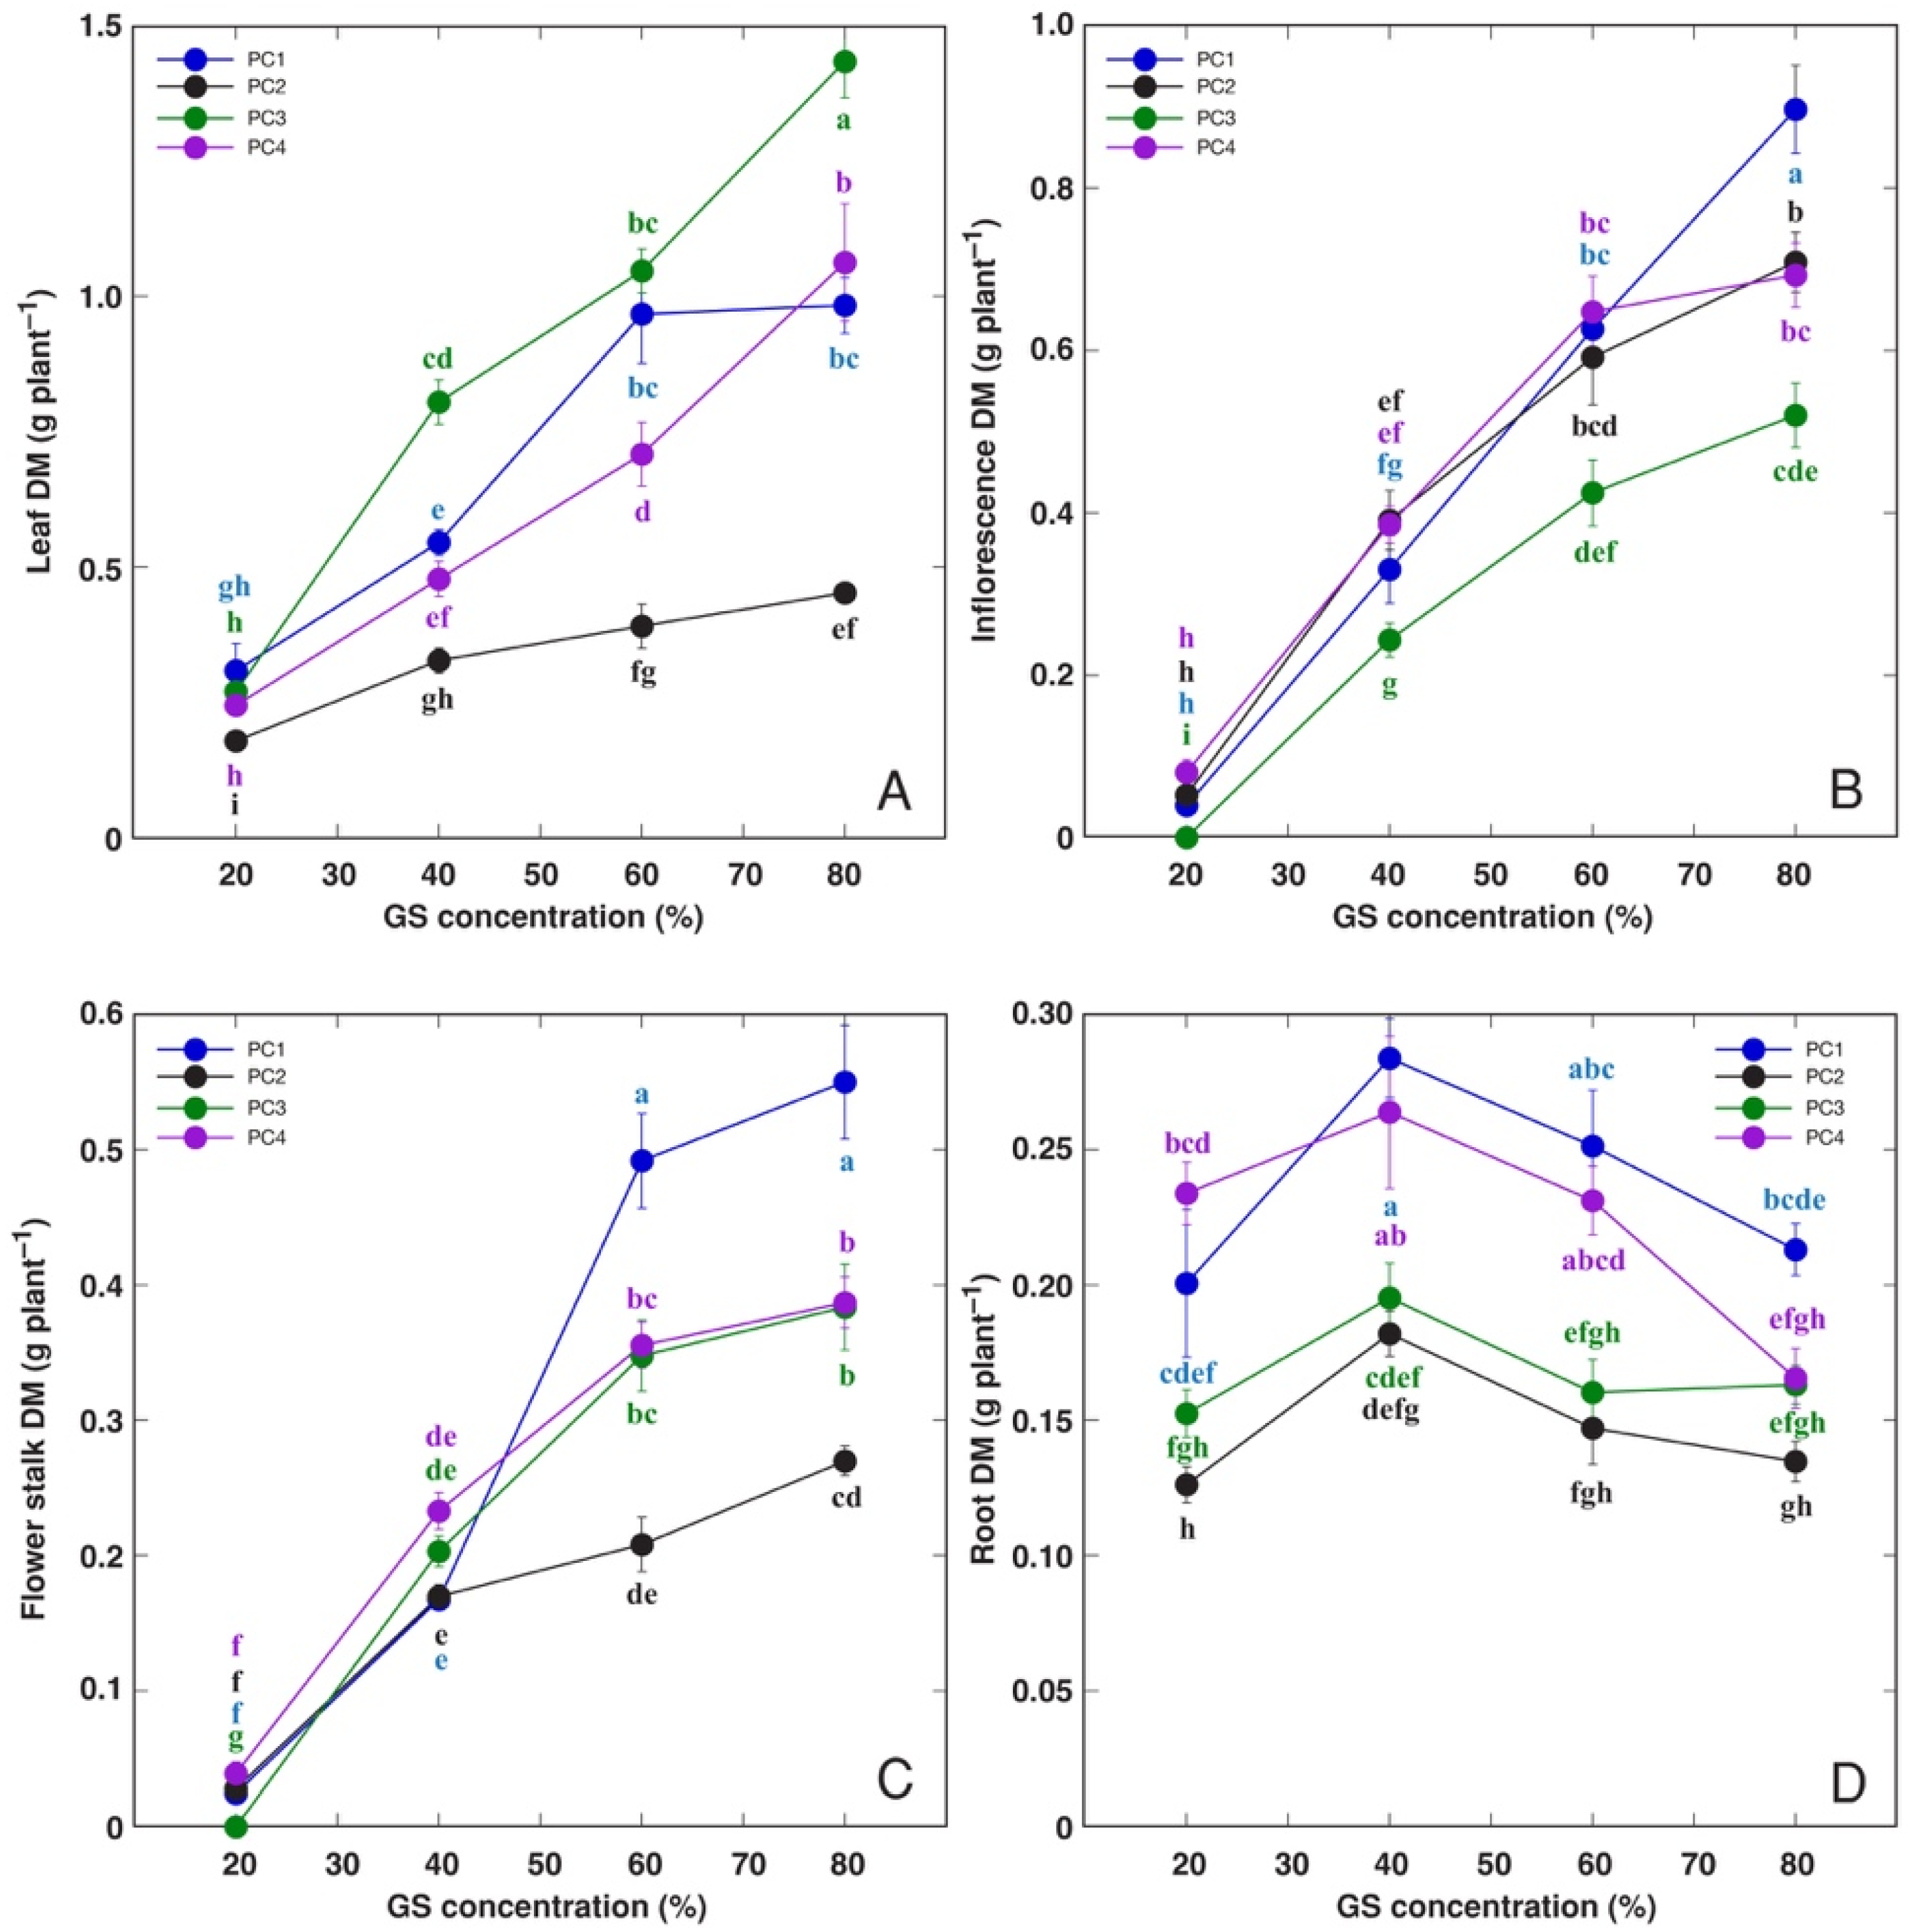
The main effects of mineral nutrient concentration and genotype on the biomass of P. coronopus parts were statistically significant (p < 0.01) (Figure 9). However, the interaction effect was statistically significant for leaves, inflorescences and flower stalks (p < 0.01) but not for roots (p = 0.0520). The biomass of above-ground parts increased for all P. coronopus accessions with an increase in the GS amendment rate (Figure 9). However, changes in root biomass were minor and reached optimum at 40% GS amendment rate (Figure 9D). P. coronopus plants exhibited some accession-specific morphological responses to variations in mineral nutrient availability. For instance, PC2 plants had significantly lower leaf biomass compared to PC1 and PC4 plants, while PC3 plants had significantly higher leaf biomass (Figure 9A). Additionally, PC3 plants had significantly lower biomass of inflorescences (Figure 9B). In contrast, PC1 plants had significantly higher biomass of flower stalks compared to PC2, PC3, and PC4 plants PC1 (Figure 9C). Significant differences were also observed for root biomass, particularly at low and moderate rates of mineral nutrient availability (Figure 9D).
Among other morphological parameters, both the number of leaves and the number of flower stalks increased in response to increased mineral nutrient availability (Table S4). However, the average height of flower stalks increased only up to 60% GS. The differences between the accessions were not statistically significant for these parameters. The changes in total dry biomass were comparable to those observed for leaf biomass.
As mineral nutrient availability increased, the resource allocation pattern underwent a shift (Figure 10). Across all accessions, there was a concomitant rise in resource allocation to generative structures, accompanied by a corresponding decline in resource allocation to roots. Notably the resource share to leaves remained relatively stable. Relative allocation to flowering exhibited the lowest values for PC3 plants, while PC1 and PC4 plants exhibited average values, and PC2 plants had the highest generative allocation.
Both nutrient concentration and genotype significantly affected water content in leaves and roots (p < 0.01), with a significant interaction between the two factors (p < 0.01) (Figure 11). Notably, leaves of PC2 plants exhibited severe dehydration and senescence (Figure 11A). In contrast, less differences were evident for root water content (Figure 11B).

3.3. Experiment with Phleum arenarium

P. arenarium plants were cultivated in 0.2, 0.4 and 1 L containers at four rates of GS amendment (10, 40, 70, 100%). Plant development was monitored for 56 days after the final transplanting (Figure 12). The onset of generative development was not significantly affected by treatment. However, plants in 0.4 L containers grown in the presence of 40% GS exhibited the earliest commencement of flower stalk development, while plants in 0.2 L containers at 20% GS showed a slight delay in generative development.
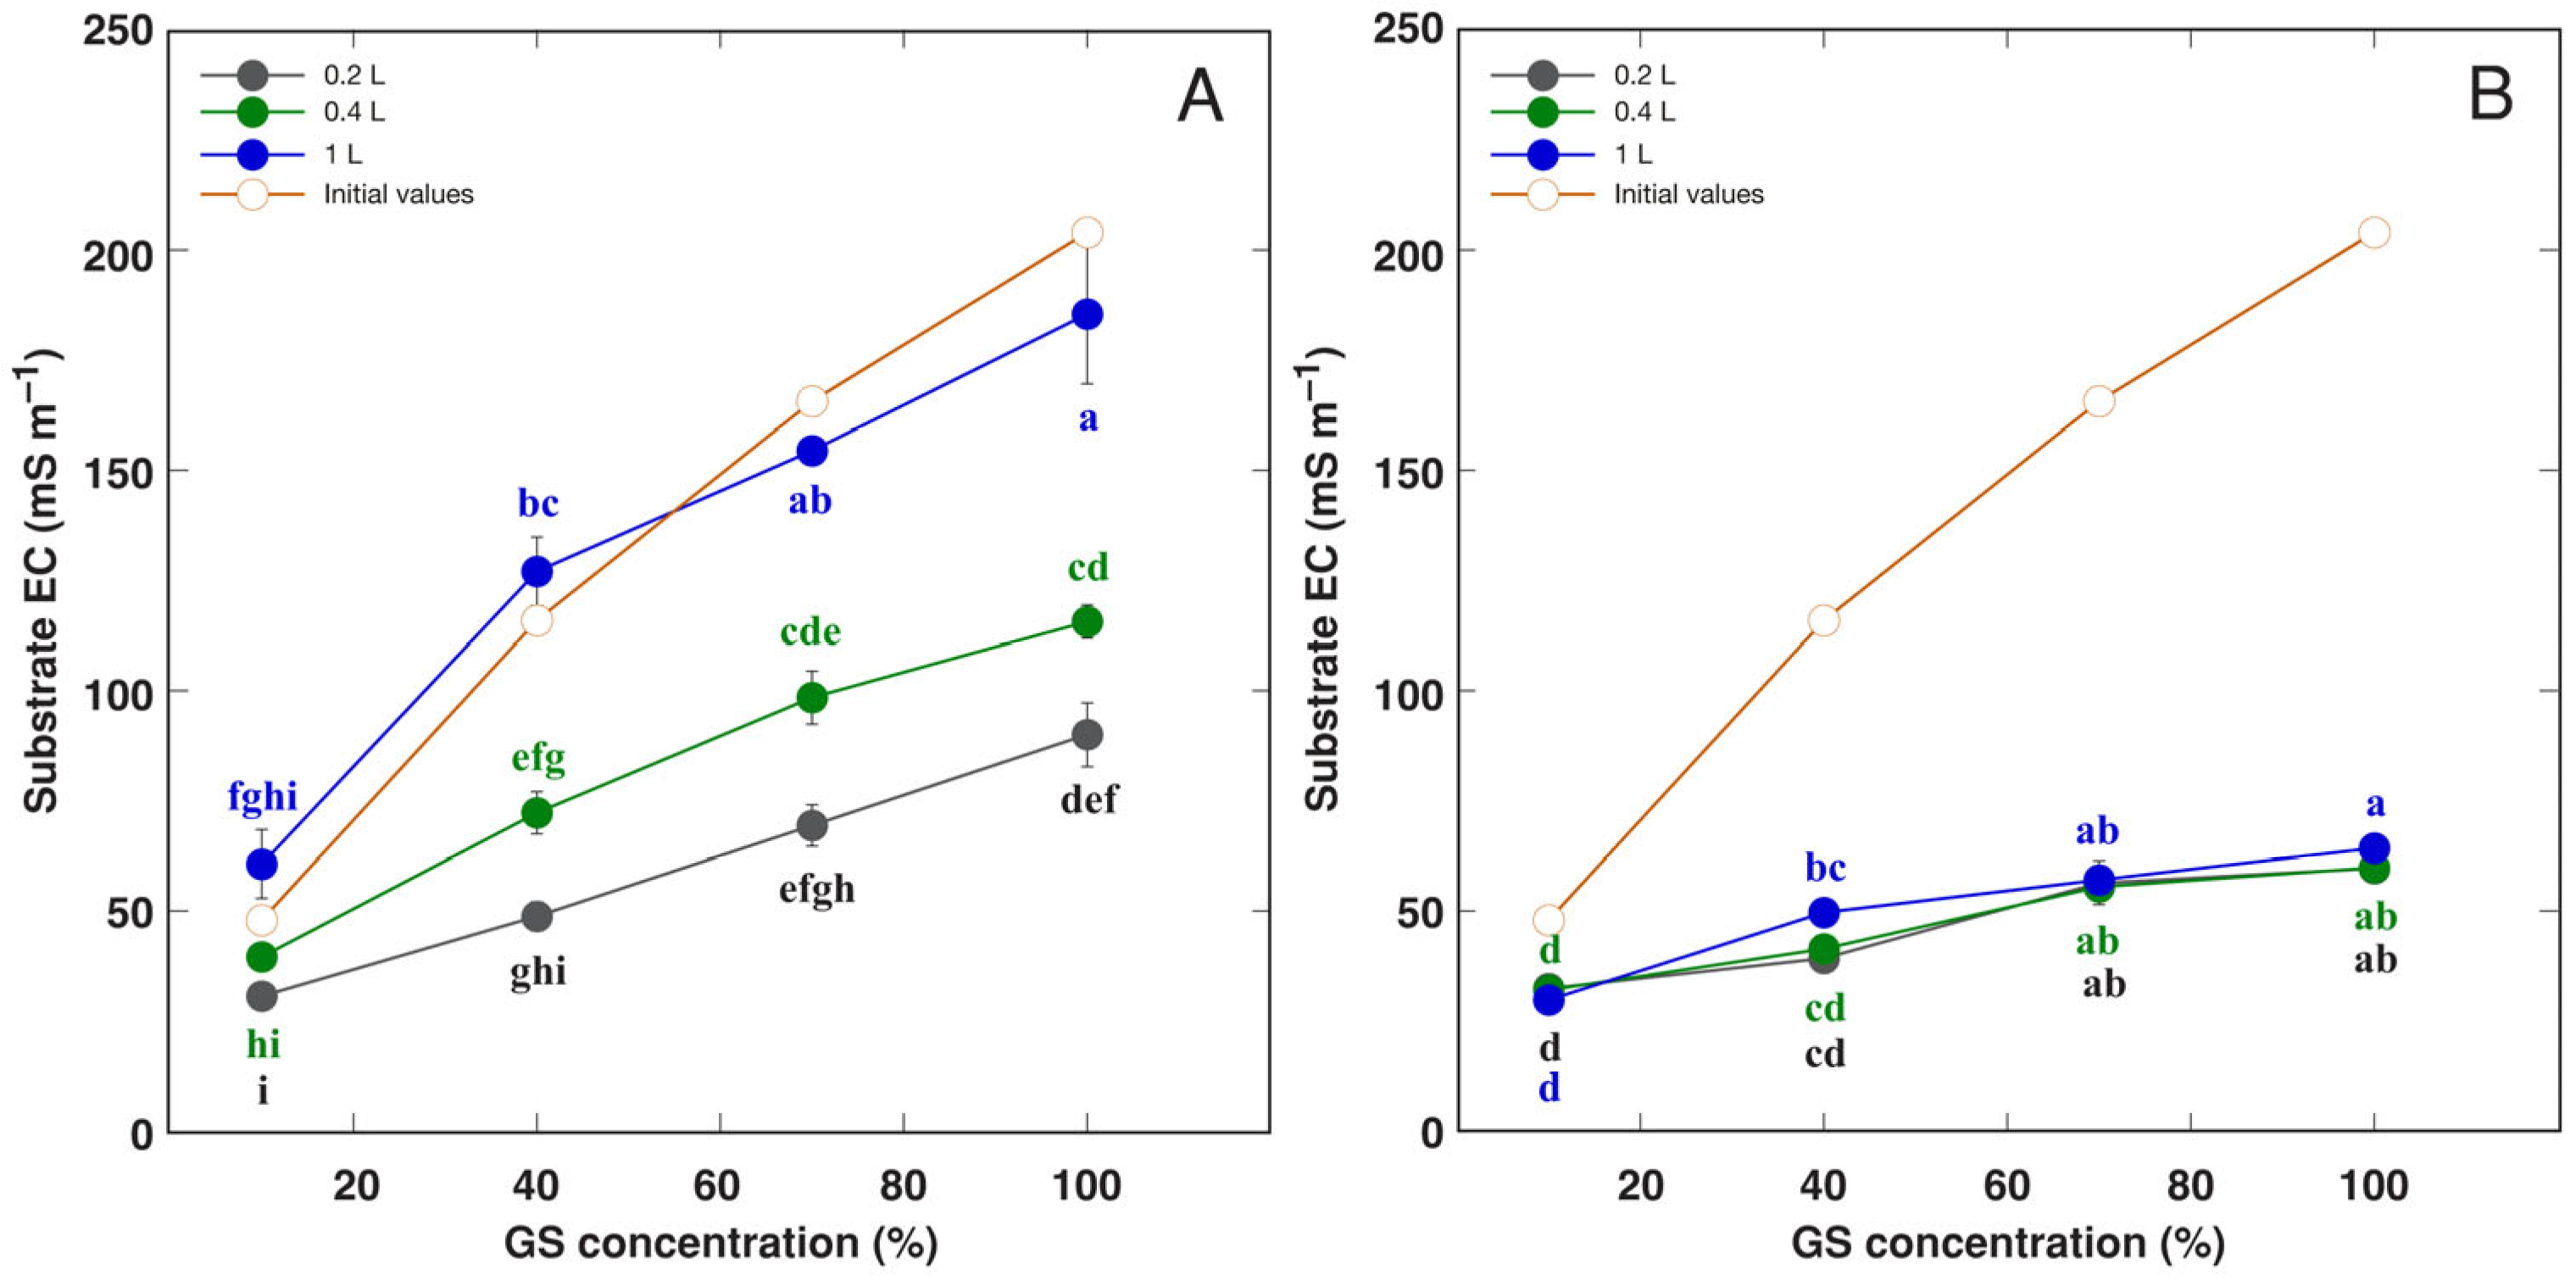
Plants in 1 L containers exhibited a delayed mineral utilization, as evidenced by the absence of substrate EC alterations at day 14 (Figure 13A). A similar delay was observed for plants cultivated in 0.4 L containers. However, these differences between containers with varying volume were eliminated by day 37 (Figure 13B).
The effect of both nutrient concentration and substrate volume on biomass of P. arenarium parts was significant (p < 0.01), with a significant interaction between the factors (p < 0.01) (Figure 14). In general, the effect sizes were large for the main factors (ηp2 > 0.14) but medium for the interactions (ηp2 < 0.14). At a 10% GS amendment rate, the growth of leaves, inflorescences, and roots of P. arenarium was not significantly different between plants in 0.2 and 0.4 L containers (Figure 14). However, further increase in mineral nutrient availability resulted in statistically significant volume-dependent effects. Root growth for plants in 1 L containers reached a peak at 70% GS (Figure 14C).
Among other measured morphological parameters, both biomass and height of flower stalks increased with larger GS substitution rate and increase in container volume (Table S5). However, height of flower stalks was not significantly affected by different treatments. Changes in total dry biomass were comparable to those for root biomass.
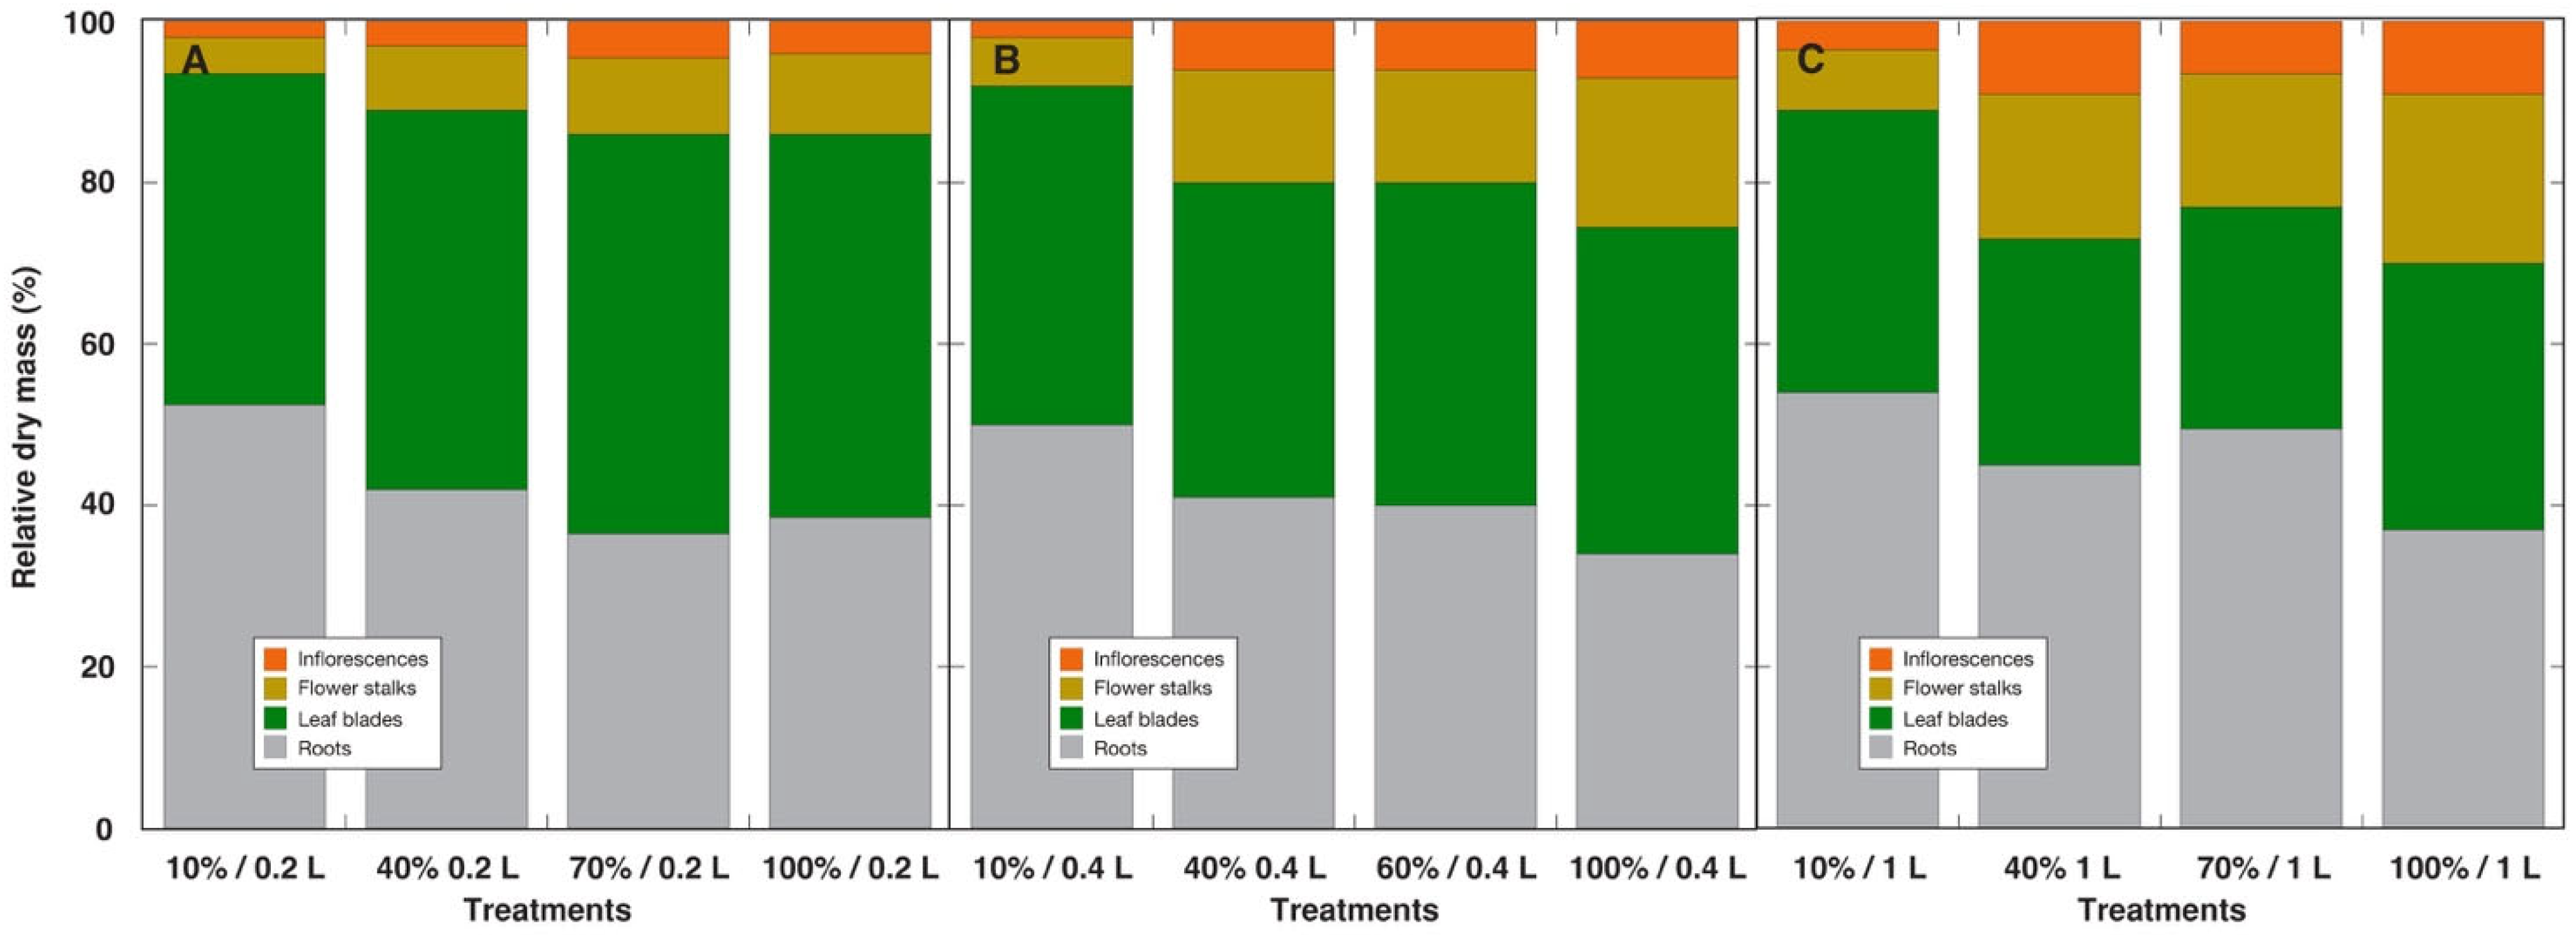
The resource investment in the generative biomass of P. arenarium plants was relatively modest, exhibiting a linear increase with both mineral nutrient availability (at the expense of root development) and substrate volume (at the expense of leaf development) (Figure 15).
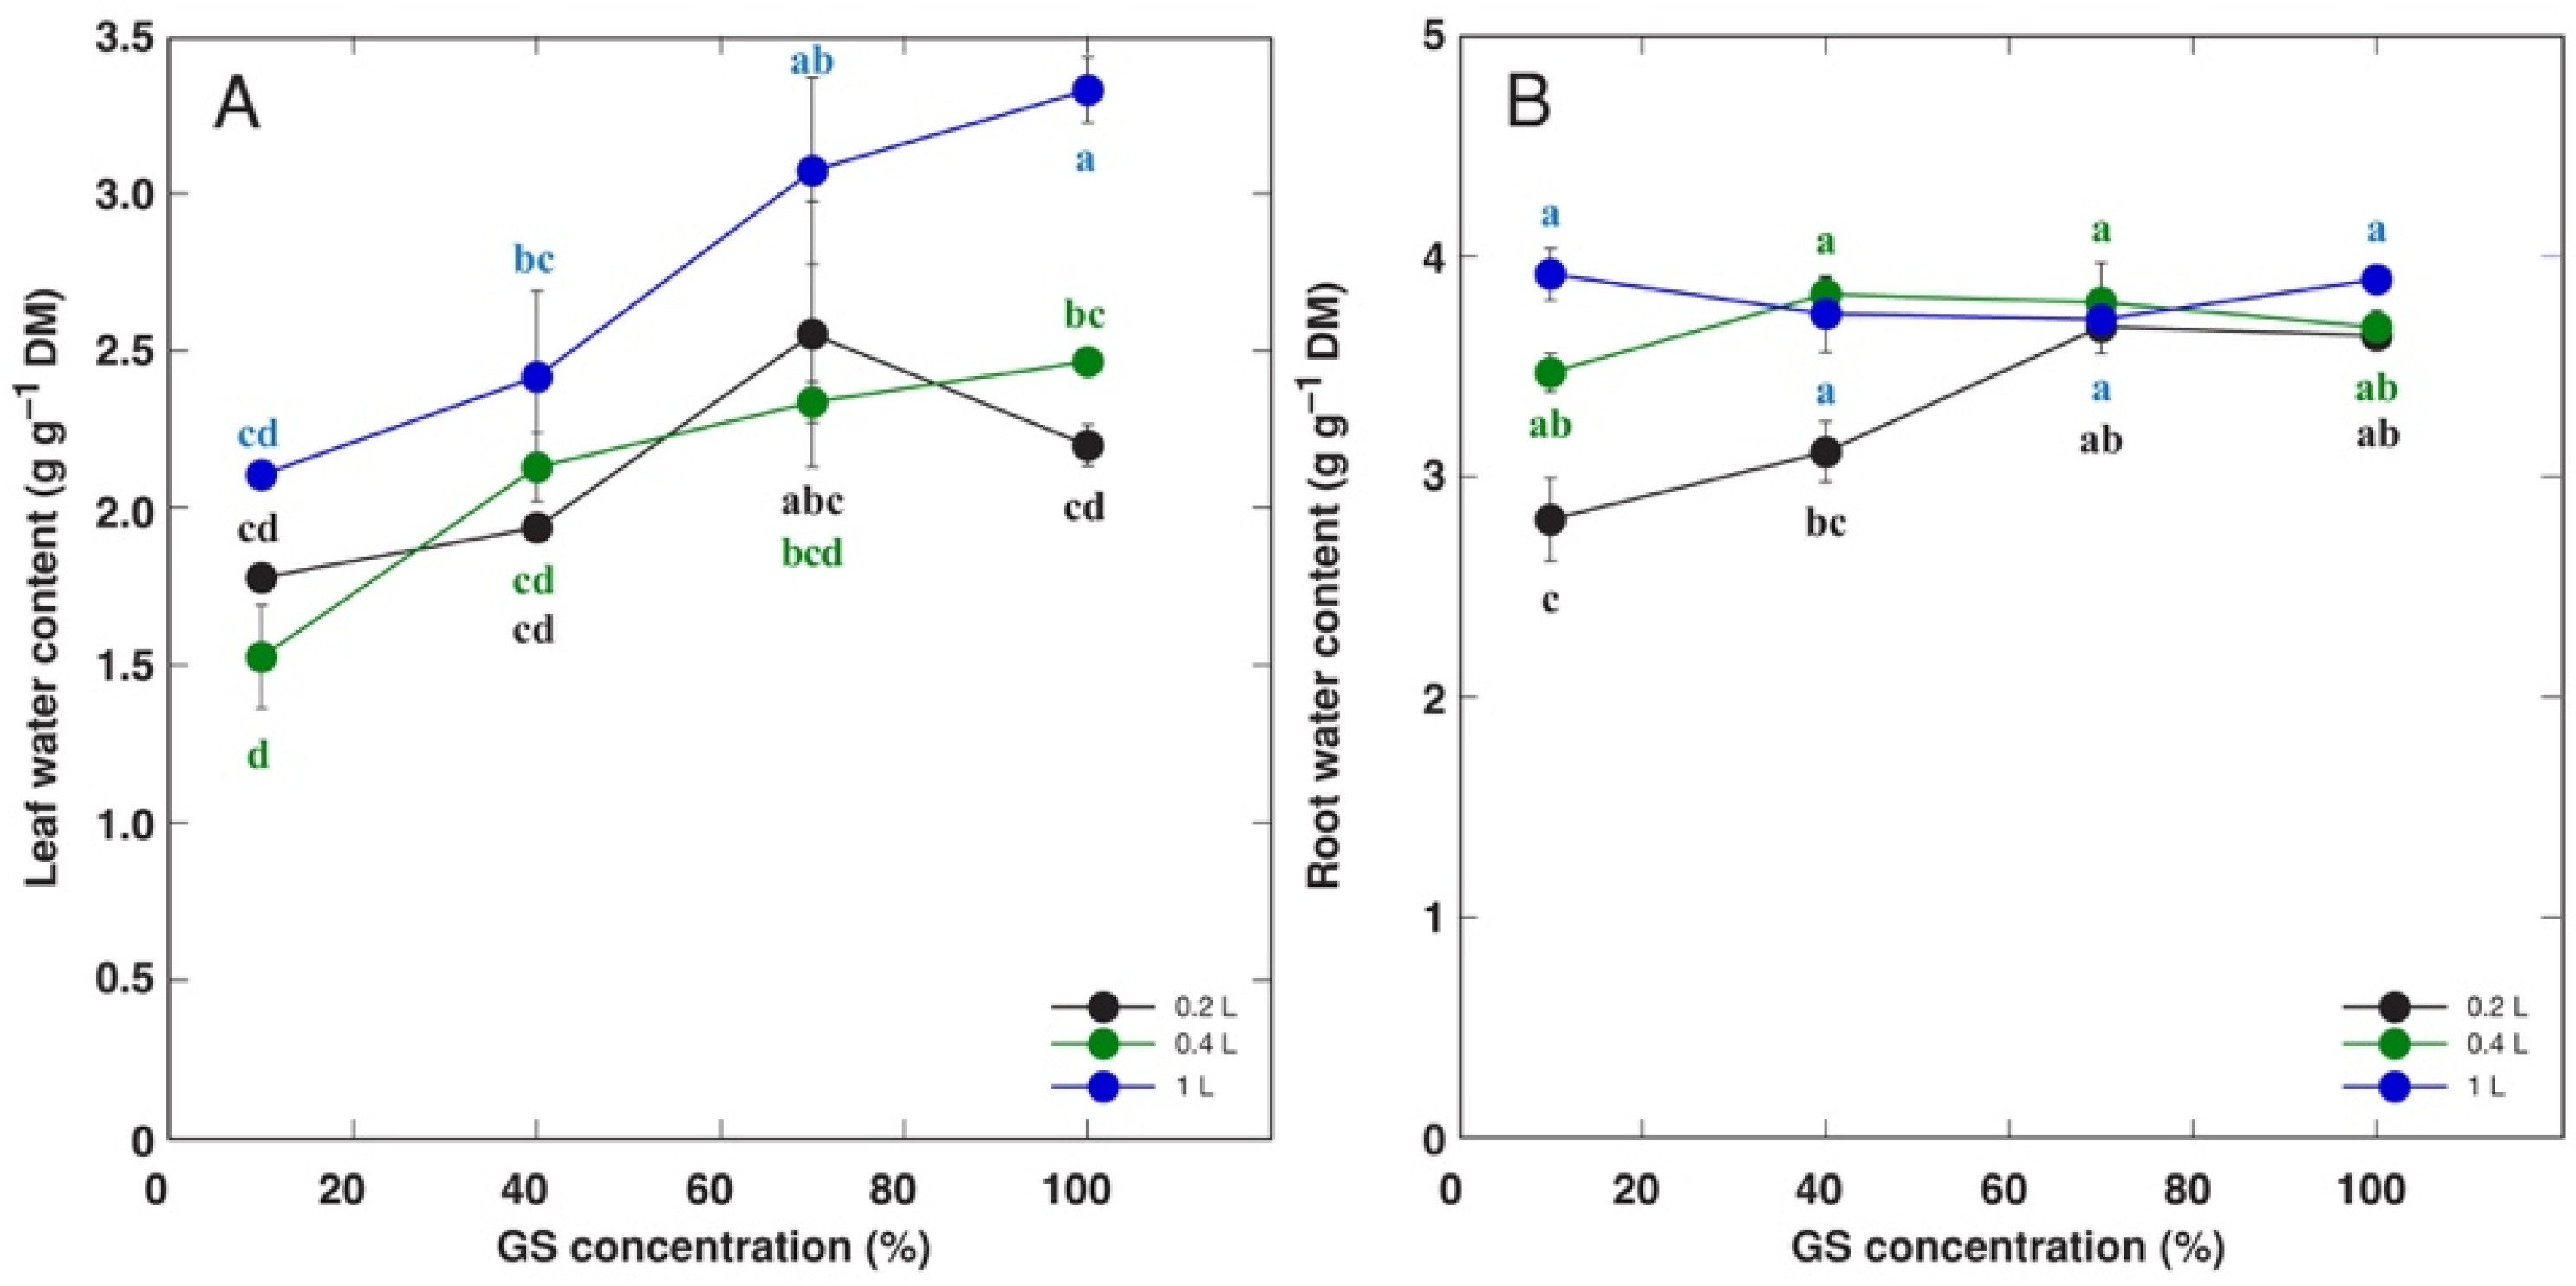
Leaf water content was significantly affected by both factors (p < 0.01) with large effect sizes, but the interaction effect was not statistically significant (p = 0.281) (Figure 16A). Leaf water content increased with increased mineral nutrient availability, and it tended to be higher for plants in 1 L containers. Root water content was significantly affected by both factors (p < 0.01), and there was a significant interaction between them (p < 0.01) (Figure 16B). Significant differences in root water content were observed only between plants in 0.2 and 1 L containers cultivated at 10% GS (Figure 16B).
Leaf chlorophyll concentration was significantly affected by both nutrient concentration and substrate volume (p < 0.01, ηp2 > 0.14), and there was a significant interaction between them (p < 0.01, ηp2 = 0.044) (Figure 17). There was a distinctive increase in leaf chlorophyll concentration between day 13 and day 37. Generally, chlorophyll concentration was higher with increasing substrate volume, but the positive dependence on mineral nutrient availability was more pronounced on day 37.

4. Discussion

4.1. The Model System

Experimental systems assessing the potential effects of nutrient availability and substrate volume often employ relatively inert substrate with varying amounts of water-soluble nutrients (for different concentrations, which precludes distinguishing between concentration and substrate volume effects) or controlled-release fertilizers (for a constant amount per individual plant, enabling the separation of volume-size effects) [25]. However, results from such systems cannot be directly compared, as the mineral concentration will consistently be lower in the second case. Nevertheless, there is reason to believe that, contrary to initial assumptions [19], root mass does not positively correlate with the available substrate volume [25]. Consequently, any positive effect of increased soil volume on plant growth can be attributed to enhanced nutrient availability in the case of identical mineral concentration. In the present study, the substrate was essentially comparable to that found in coastal habitats, with quartz sand replaced in varying proportions with commercial garden soil containing mineral-rich organic matter with a high degree of decomposition. Since quartz sand did not contain significant amounts of minerals, its addition did not change the level of mineral supply to plants. This approach facilitated the attainment of distinct, comparable concentrations of plant-available minerals in a uniform manner. Due to the different physical properties of the two substrates (differences in bulk density), the substrate mixtures exhibited varying water retention capacities; however, a uniform water supply regime was achieved through controlled individual, regular moisture control.
A potential methodological limitation was the discontinuation of experiments until full seed maturity to mitigate the risk of seed loss due to earlier flowering initiation. This seed shedding was particularly pronounced in R. sceleratus plants. Consequently, it is plausible that R. sceleratus plants under conditions of high mineral availability and substantial substrate volume (with a 70% GS amendment rate in 4 L containers) would have persisted in investing biomass in generative development and exhibited relatively higher biomass allocation to reproduction, as observed.
The measurement of substrate EC served as an indicator of the total amount of soluble salts, potentially reflecting the concentration of plant-available mineral nutrients. While this parameter is commonly utilized to control mineral nutrition in hydroponic systems [42], it remains a reliable indicator of alterations in substrate fertilizer levels [43,44]. By monitoring changes in EC over time, it was feasible to compare the actual mineral consumption of various model species against a range of initial concentrations and assess the impact of substrate volume on mineral uptake.
The diverse treatment options employed in individual experiments conducted with distinct model species precluded a direct comparison of all the outcomes obtained. Nevertheless, it provided an opportunity to draw conclusions regarding the potentially most effective experimental setup. In this type of research, it is imperative to restrict the number of individual plants, as this is necessitated by the requirement to maintain the utmost uniformity within the spatial confines of the experiment. Conversely, a broader potential range of mineral concentrations, accompanied by an increased number of individual concentrations, facilitates a more realistic assessment of the effects of mineral availability. However, the utilization of sufficient variation in container volumes is also crucial, which was notably absent in experiments involving P. arenarium and, particularly, P. coronopus. On the contrary, it was precisely within the experiment with P. coronopus that it was discovered that even within the same species, there can be substantial disparities in the physiological response between distinct accessions.

4.2. Physiological Aspects

All model species exhibited substantial plasticity in their physiological responses under the conditions of the present experiment. The main morphological and physiological effects of increasing mineral nutrient concentration and substrate volume in model plants P. arenarium, P. coronopus and R. sceleratus are summarized in Table 2. In respect to vegetative growth, it was observed that low mineral nutrient concentration served as a factor inhibiting plant growth for both P. arenarium and R. sceleratus plants. However, the effect of this factor was substrate volume-dependent. For R. sceleratus cultivated at a 10% GS amendment rate, there were no differences in leaf and root biomass between the plants cultivated in 0.2 and 0.4 L containers, and between 1 and 4 L containers also for root biomass (Figure 3). Soil EC data showed no decrease in initial substrate EC values during cultivation for R. sceleratus plants with 10% GS (Figure 2). For P. arenarium, a similar effect was only observed during the initial stages of the experiment for plants grown in 1 L containers (Figure 13). Based on soil EC changes during plant cultivation, it was observed that EC value of 50 mS m−2 was a critical level for R. sceleratus plants at which growth and development were significantly halted. Conversely, lower substrate EC values (approximately 30 mS m−2) were achieved for P. coronopus and P. arenarium.
One of the fundamental questions in the context of this study is whether the immediate availability of soluble minerals, characterized by their concentration, should be regarded only as a resource or also as a signal? In the first scenario, the growth of plant biomass to an optimal level would be directly proportional to the mineral concentration. In the second scenario, it is possible that low mineral availability inhibits plant growth, acting as a signal for unfavorable conditions. Typically, nutrient availability is considered as resource in plant mineral nutrition studies based on theories such as the “law of the minimum” and the “multiple limitation hypothesis”, which describe plant growth as a function of nutrient supply [45]. However, the results obtained in this study demonstrate that at least some species, such as R. sceleratus, respond to critically low substrate mineral concentrations with growth inhibition and developmental arrest.
Genotype-specific variations in root biomass and allocation to roots in response to mineral nutrient concentration and/or substrate volume were observed in the present study (Table 2). Thus, P. coronopus exhibited relatively low root biomass, and had a weak response to alterations in mineral nutrient concentration, while proportional allocation to roots decreased with increasing concentration, similar to that observed for P. arenarium. In contrast, for R. sceleratus, this effect was pronounced only at high substrate volume. Furthermore, allocation to roots decreased with increasing substrate volume, but only at high mineral nutrient concentration. In contrast to the biomass of aboveground parts, which is generally positively associated with conditions approaching optimality, a decrease in root biomass may not necessarily indicate deteriorating conditions. Plastic responses at root level to changes in nutrient availability have been previously documented. Therefore, in contrast to root foraging behavior in moderate nutrient deficiency conditions, severe deficiency typically results in controlled arrest of lateral root development and elongation [19]. On the other hand, under conditions of high mineral availability, there is no necessity to invest in root growth, which may manifest itself as a decrease in proportional root biomass [46].
According to the prevailing theory, in the case of an optimal allocation to reproduction for annual species, a linear relationship must be observed between the total plant biomass and that of reproductive structures, which is the case for numerous species [47]. Nevertheless, the threshold plant size for reproduction should be taken into account in relation to initial structural resource investments in vegetative growth. In the present study, allocation to generative structures in general increased with increasing mineral nutrient availability, but genotype-specific responses were evident (Table 2). P. arenarium had relatively low biomass of generative structures, and an increase in both mineral nutrient concentration and substrate volume resulted in increased resource allocation to flowering (Figure 15). For P. coronopus, differences in generative allocation were evident only from low-to-moderate mineral nutrient concentration, with a pronounced saturation effect (Figure 10). A more complex response was observed for R. sceleratus, where there was a significant interaction between mineral nutrient concentration and substrate volume: optimum allocation to generative structures was achieved for plants at moderate mineral nutrient concentration cultivated in 1 L containers, and both increases in concentration and substrate volume resulted in decreased resource allocation to flowering (Figure 3 and Figure 4).
To understand the observed differences in generative allocation patterns, it is necessary to analyze the general developmental strategy of annual plant species. During the vegetative phase, resources are distributed between roots and rosette leaves. However, the initiation of flowering predominantly results in the redirection of resources towards the development of generative structures [27]. The growth of reproductive structures is also largely facilitated by the recycling of carbon compounds from the vegetative parts. For instance, in many annual monocarpic species, including P. arenarium, the total plant biomass remains unchanged after the initiation of flowering, which is primarily controlled by nutrient availability [4]. Furthermore, a substantial proportion of essential minerals, such as 57% of K, 44% of P and 20% of N, which were previously at their maxima, were transported from the green leaves of P. arenarium to developing generative structures [3]. Consequently, the relative biomass of reproductive organs exceeded 50% of the total biomass during the fruiting phase [3]. The total biomass of fruits increased from 5.1 mg plant−1 when the plants were grown in a dune sand to 343.6 mg plant−1 when grown in a garden; however, the relative biomass of fruits remained constant despite the increase in soil fertility. Resource allocation to reproduction has also been previously studied with P. coronopus plants [34]. It was determined that larger plants allocate relatively more biomass to reproduction at the expense of a relative decrease in root biomass. In 57 natural populations of P. coronopus in Ireland, reproductive allocation varied from 14 to 64% from above-ground biomass, while the number of inflorescences varied from 8 to 30 [34].
One of the most prominent manifestations of developmental plasticity in this study was the variation in flowering time based on mineral concentration and/or substrate volume (Table 1). Most strikingly, low mineral nutrient concertation completely inhibited flowering of R. sceleratus plants regardless of substrate volume, while high nutrient concentration also delayed flowering (Figure 1). In contrast, the timing of flowering for P. arenarium plants was relatively insensitive to changes in nutrient concentration, and low mineral nutrient concentration only delayed flowering in plants cultivated in 0.2 L containers (Figure 12). Flowering time in P. coronopus was relatively little affected by mineral nutrient concentration, but some genotype-specific effects were observed. Specifically, accelerated flowering in PC2 at 80% GS, delayed flowering in PC4 at 20% GS, and complete inhibition of flowering in PC3 at 20% GS were observed (Figure 7).
The obtained results appear to contradict certain previous observations. Thus, in early studies conducted with P. arenarium, cultivated in greenhouse conditions at different levels of substrate mineral nutrient availability, it was demonstrated that nutrient deficiency accelerated flowering [4]. Using a classical model species, Arabidopis thaliana, it was further established that an abrupt decrease in mineral nutrient availability also accelerated flowering [48]. This suggests that such a strategy may be prevalent among the majority of annual species, as accelerated flowering induction would be advantageous in conditions of limited resources. However, even different ecotypes of the same species can exhibit varying responses to constantly reduced nutrient supply, resulting in delayed, advanced or constant flowering time [49]. It is plausible that nitrogen availability serves as the primary regulator of flowering time, as evidenced by a study conducted with A. thaliana [50]. While optimal nitrate concentrations facilitated flowering, both sub- and supra-optimal concentrations delayed flowering, resulting in an U-shaped relationship between nitrogen availability and flowering time. This effect is comparable to the results obtained for R. sceleratus in the present study.
In the present study, physiological parameters have been used as supplementary indicators. During the transition from vegetative to reproductive growth for annual plants, mineral nutrient reserves from senescing leaves are translocated to developing generative structures, as demonstrated also for P. arenarium [3]. Consequently, a decrease in leaf chlorophyll concentration can be reliably utilized as an indicator of leaf senescence in the conditions of the present experiment [51]. On the other hand, chlorophyll serves as an indicator of the optimal supply of minerals in plants [52], primarily reflecting leaf nitrogen concentration [53]. This correlation was evident for both P. arenarium and R. sceleratus plants during the initial phase of cultivation (Table 2).
Chlorophyll a fluorescence was measured only for R. sceleratus plants, and it was observed that plants grown in conditions of low mineral nutrient availability exhibited reduced values of Fv/Fm, the maximum quantum efficiency of photosystem II. This observation suggests a severe stress situation for all plants at 10% GS as well as for plants in 0.2 L containers at 40% GS (Figure 6A) [41]. Furthermore, low values of another fluorescence parameter, Performance Index Total, were observed in all treatments except plants in 4 L containers at 70% GS. These low values likely reflected a senescent state of the leaves associated with a deficiency of electron transfer at the photosystem I side [54]. Several previous studies have also confirmed the utility of chlorophyll a fluorescence parameters as indicators of mineral nutrient availability [55,56].
Alterations in the water content of plant tissues have been associated with distinct adaptation mechanisms, including mineral nutrient availability and salt tolerance, as well as senescence [57]. However, conflicting results were observed regarding water content in various model species due to variation in mineral nutrient concentration and substrate volume (Table 2). In the case of P. coronopus, accession-specific changes in leaf water content were observed, potentially reflecting diverse degrees of resources reuse to establish generative structures. While typically changes in plant mineral nutrition status towards optimality are associated with an increase in tissue water content [57], the findings obtained in this study do not permit a general conclusion regarding changes in water content in relation to alterations in the concentration of substrate minerals and substrate volume.

4.3. Ecological Relevance

From an evolutionary ecology perspective, annuality is proposed as an adaptive response to spatial environmental heterogeneity [58]. Consequently, the capacity of annual plant species to alter phenological characteristics in response to environmental factors could serve as a manifestation of their plasticity. Within the context of this study, the spatial heterogeneity of mineral substances in the soil may also be a contributing factor to the development process of annual plants.
All studied coastal species exhibited remarkable morphological, physiological and phenological plasticity in response to variations in mineral concentration and substrate volume. This observation generally supports previously formulated assumptions regarding the pivotal role of phenotypic plasticity in the adaptation of coastal species to highly heterogeneous coastal conditions [14,59,60,61]. Empirical evidence have demonstrated that high morphological plasticity of coastal species can be attributed to fluctuations in nutrient availability or other factors. Thus, exceptionally high plasticity has been documented for P. arenarium [4,62]. Considering the extreme spatial and temporal heterogeneity in mineral nutrient availability within coastal habitats, it is imperative to delve into broader ecological significance of the observed results.
Considering the extreme heterogeneity of mineral elements in coastal habitats, it is plausible that many plant species, even those specific to the coastal regions, experience suboptimal mineral supply conditions throughout their life cycles. Consequently, the occurrence of these species in environments that do not align with their potential for biomass production and reproduction raises a pertinent question. A well-established phenomenon is the discrepancy between the ecological optimum of an environmental factor (the distribution of individuals of a species) and the physiological optimum of the intensity of this factor for the cultivation of species individuals under controlled conditions (niche optima) [63,64]. The presence of this phenomenon is attributed to the influence of additional factors in natural habitats, particularly the impact of biotic (interspecific) interactions. However, experimental evidence supporting this hypothesis remains elusive. To date, it has been hypothesized that the maximum occurrence of individuals in physiologically suboptimal conditions is linked to the low competitiveness of the species. At the community level, the inability of a species to effectively compete for resources is often associated with either a ruderal or stress-tolerator strategy [40]. Such characteristics may be pertinent to P. arenarium (Table 1). Notably, this species exhibits significant variations in biomass under natural conditions and under enhanced mineral supply, as evidenced by the current study.
The question of the other two model species presents a more intricate scenario. According to the leaf trait-based functional strategy calculation method, R. sceleratus is a typical competitor/ruderal species, while P. coronopus exhibits characteristics of both competitor and a ruderal species [65]. However, this division may not be entirely precise. Thus, coastal accessions of P. coronopus demonstrate remarkable tolerance to soil salinity [66,67], whereas those of R. sceleratus exhibit tolerance to salinity and heavy metals [37]. In contrast to P. coronopus plants, which can attain significantly reduced sizes in natural conditions [62], R. sceleratus plants typically exhibit relatively high biomass, often associated with exceptionally nitrogen-rich soils [36].
This study provided evidence for the potential existence and significance of ecotypic variations in coastal annual plant species. One of the most prominent morphological phenotype distinctions in P. coronopus plants is the orientation of the leaves forming the rosette, either erect or prostrate [30]. These morphotypes were also observed in the present study, where PC2 plants exhibited an erect type, while PC1 and PC3 plants were of prostrate in nature, with an intermediate phenotype for PC2 plants (Figure 8). Additionally, there were other significant differences between the various accessions of P. coronopus, including genotype-dependent variation in leaf, inflorescence and flower stalk biomass, particularly pronounced at high mineral nutrient availability (Figure 9). Leaf water content exhibited differential responses to increasing mineral nutrient availability, with PC2 plants demonstrating accelerated leaf senescence, as evidenced by leaf drying (Figure 12). Furthermore, the developmental differences were evident, as PC3 plants were unable to initiate the generative phase when cultivated at low mineral nutrient availability (Figure 8).

5. Conclusions

All model plant species exhibited remarkable morphological plasticity in response to alterations in mineral nutrient concentration and substrate volume. This transformation extended beyond individual biomass, impacting allocation patterns towards roots and generative reproduction. The conducted experiments demonstrated that both low and high mineral nutrient availability can adversely affect vegetative growth and development of annual coastal plant species. This effect was particularly pronounced for R. sceleratus, where both low nutrient concentration and high nutrient concentration at high substrate volume available for roots hindered the plant’s transition to reproduction. The substrate used in the present study closely resembled that found in coastal habitats, with varying proportions of quartz sand replaced by soil containing mineral-rich organic matter. This approach facilitated the acquisition of distinct, comparable concentrations of plant-available minerals, enabling the analysis of the effects of nutrient concentration, substrate volume, and genetic variability on plant growth and development. For future experiments, a wider range of mineral concentrations and more individual concentrations should be used to assess mineral availability more realistically.

Supplementary Materials

The following supporting information can be downloaded at: https://www.mdpi.com/article/10.3390/ijpb16040118/s1, Table S1: Plant-available mineral nutrient concentrations and other characteristics of commercial garden soil used in the study Neiceniece et al. 2025 [39]; Table S2: Accessions of Plantago coronopus used in the study; Table S3: Morphological parameters and water content in Ranunculus sceleratus plants cultivated at different mineral nutrient availability rates (GS concentration) in containers of various volumes; Table S4: Morphological parameters of different accessions of Plantago coronopus plants cultivated at different mineral nutrient availability rates (GS concentration); Table S5: Morphological parameters and water content in Phleum arenarium plants cultivated at different mineral nutrient availability rates (GS concentration) in containers of various volumes.

Author Contributions

Conceptualization, G.I.; methodology, G.I. and U.A.-O.; investigation, U.A.-O., L.B. and A.J.; writing—original draft preparation, G.I.; writing—review and editing, A.J. All authors have read and agreed to the published version of the manuscript.

Funding

This research received no external funding.

Data Availability Statement

The original contributions presented in this study are included in the article/Supplementary Material. Further inquiries can be directed to the corresponding author.

Acknowledgments

L.B. conducted this research while supported by the Erasmus+ Scholarship for PhD Students (grant number: 503-4220-0861-23). We are grateful to Anita Osvalde and Andis Karlsons (Institute of Biology, University of Latvia) for substrate characterization.

Conflicts of Interest

The authors declare no conflicts of interest. The funders had no role in the design of the study; in the collection, analyses, or interpretation of data; in the writing of the manuscript; or in the decision to publish the results.

Abbreviations

The following abbreviations are used in this manuscript:
DMDry mass
ECElectrical conductivity
Fv/FmMaximum quantum efficiency of photosystem II
GSGarden soil
MNCMineral nutrient concentration
PC1Plantago coronopus accession 1
PC2Plantago coronopus accession 2
PC3Plantago coronopus accession 3
PC4Plantago coronopus accession 4
PITPerformance Index Total
SVSubstrate volume

References

  1. Watkinson, A.R.; Davy, A.J. Population biology of salt marsh and sand dune annuals. Vegetatio 1985, 62, 487–497. [Google Scholar] [CrossRef]
  2. Pemadasa, M.A.; Lovell, P.H. Effects of the timing of the life cycle on the vegetative growth of some dune annuals. J. Ecol. 1976, 64, 213–222. [Google Scholar] [CrossRef]
  3. Ernst, W.H.O. Element nutrition of two contrasted dune annuals. J. Ecol. 1983, 71, 197–209. [Google Scholar] [CrossRef]
  4. Ernst, W.H.O. Some considerations of and perspectives in coastal ecology. Vegetatio 1985, 62, 533–545. [Google Scholar] [CrossRef]
  5. Lee, J.A.; Ignaciuk, R. The physiological ecology of strandline plants. Vegetatio 1985, 62, 319–326. [Google Scholar] [CrossRef]
  6. He, Q.; Silliman, B.R.; Cui, B. Incorporating thresholds into understanding salinity tolerance: A study using salt-tolerant plants in salt marshes. Ecol. Evol. 2017, 7, 6326–6333. [Google Scholar] [CrossRef]
  7. Arbelet-Bonnin, D.; Ben-Hamed-Louati, I.; Laurenti, P.; Abdelly, C.; Ben-Hamed, K.; Bouteau, F. Cakile maritima, a promising model for halophyte studies and a putative cash crop for saline agriculture. Adv. Agron. 2019, 155, 45–78. [Google Scholar]
  8. Pemadasa, M.A.; Lovell, P.H. The mineral nutrition of some dune annuals. J. Ecol. 1974, 62, 647–657. [Google Scholar] [CrossRef]
  9. Madsen, J.D. Resource allocation at the individual plant level. Aquat. Bot. 1991, 41, 67–86. [Google Scholar] [CrossRef]
  10. Fitter, A.H. Influence of soil heterogeneity on the coexistence of grassland species. J. Ecol. 1982, 70, 139–148. [Google Scholar] [CrossRef]
  11. Fransen, B.; de Kroon, H.; Berendse, F. Root morphological plasticity and nutrient acquisition of perennial grass species from habitats of different nutrient availability. Oecologia 1998, 11, 351–358. [Google Scholar] [CrossRef]
  12. Hinsinger, P.; Gobran, G.R.; Gregory, P.J.; Wenzel, W.W. Rhizosphere geometry and heterogeneity arising from root-mediated physical and chemical processes. New Phytol. 2005, 168, 293–303. [Google Scholar] [CrossRef]
  13. Wijesinghe, D.K.; John, E.A.; Hutchings, M.J. Does pattern of soil resource heterogeneity determine plant community structure? An experimental investigation. J. Ecol. 2005, 93, 99–112. [Google Scholar] [CrossRef]
  14. Ievinsh, G. Biological basis of biological diversity: Physiological adaptations of plants to heterogeneous habitats along a sea coast. Acta Univ. Latv. 2006, 710, 53–79. [Google Scholar]
  15. Karlsons, A.; Druva-Lusite, I.; Osvalde, A.; Necajeva, J.; Andersone-Ozola, U.; Samsone, I.; Ievinsh, G. Adaptation strategies of rare plant species to heterogeneous soil conditions on a coast of a lagoon lake as revealed by analysis of mycorrhizal symbiosis and mineral constituent dynamics. Environ. Exp. Biol. 2017, 15, 113–126. [Google Scholar]
  16. Druva-Lusite, I.; Karlsons, A.; Andersone-Ozola, U.; Ievina, B.; Necajeva, J.; Samsone, I.; Ievinsh, G. Physiological performance of a coastal marsh plant Hydrocotyle vulgaris in natural conditions in relation to mineral nutrition and mycorrhizal symbiosis. Proc. Latv. Acad. Sci. B 2020, 74, 252–262. [Google Scholar] [CrossRef]
  17. Karlsons, A.; Osvalde, A.; Ievinsh, G. Growth and mineral nutrition of two Triglochin species from saline wetlands: Adaptation strategies to conditions of heterogeneous mineral supply. Environ. Exp. Biol. 2011, 9, 83–90. [Google Scholar]
  18. Andersone-Ozola, U.; Gaile, L.; Ievinsh, G. Physiological responses of rare coastal salt marsh species Triglochin maritima L. to soil chemical heterogeneity. Acta Biol. Univ. Daugavp. 2017, 17, 149–155. [Google Scholar]
  19. Giehl, R.F.H.; von Wirén, N. Root nutrient foraging. Plant Physiol. 2014, 166, 509–517. [Google Scholar] [CrossRef]
  20. Tumber-Dávila, S.J.; Schenk, H.J.; Du, E.; Jackson, R.B. Plant sizes and shapes above and belowground and their interactions with climate. New Phytol. 2022, 235, 1032–1056. [Google Scholar] [CrossRef]
  21. Hess, L.; de Kroon, H. Effects of rooting volume and nutrient availability as an alternative explanation for root self/non-self discrimination. J. Ecol. 2007, 95, 241–251. [Google Scholar] [CrossRef]
  22. Qi, Y.; Wei, W.; Chen, C.; Chen, L. Plant root-shoot biomass allocation over diverse biomes: A global synthesis. Glob. Ecol. Conserv. 2019, 18, e00606. [Google Scholar] [CrossRef]
  23. Podar, D.; Maathuis, F.J.M. Primary nutrient sensors in plants. iScience 2022, 25, 104029. [Google Scholar] [CrossRef]
  24. Chen, J.W.; During, H.J.; Vermeulen, P.J.; de Kroon, H.; Poorter, H.; Anten, N.P.R. The analysis of plant root responses to nutrient concentration, soil volume and neighbour presence: Different statistical approaches reflect different underlying basic questions. Funct. Ecol. 2020, 34, 2210–2217. [Google Scholar] [CrossRef]
  25. Murphy, G.P.; File, A.I.; Dudley, S.A. Differentiating the effects of pot size and nutrient availability on plant biomass and allocation. Botany 2013, 91, 799–803. [Google Scholar] [CrossRef]
  26. O’Brien, E.E.; Brown, J.S. Games roots play: Effects of soil volume and nutrients. J. Ecol. 2008, 96, 438–446. [Google Scholar] [CrossRef]
  27. Bonser, S.P. High reproductive efficiency as an adaptive strategy in competitive environments. Funct. Ecol. 2013, 27, 876–885. [Google Scholar] [CrossRef]
  28. Chapin, F.S. The mineral nutrition of wild plants. Ann. Rev. Ecol. Syst. 1980, 11, 233–260. [Google Scholar] [CrossRef]
  29. Storm, C.; Süs, K. Are low-productive plant communities responsive to nutrient addition? Evidence from sand pioneer grassland. J. Veget. Sci. 2008, 19, 343–354. [Google Scholar] [CrossRef]
  30. Dodds, J.G. Plantago coronopus L. J. Ecol. 1953, 41, 467–478. [Google Scholar] [CrossRef]
  31. Noë, R.; Blom, C.W.P.M. Occurrence of three Plantago species in coastal dune grasslands in relation to pore-volume and organic matter content of the soil. J. Appl. Ecol. 1981, 19, 177–182. [Google Scholar] [CrossRef]
  32. Waite, S.; Hutchings, M.J. Plastic energy allocation patterns in Plantago coronopus. Oikos 1982, 38, 333–342. [Google Scholar]
  33. Rushton, B.S. Morphological variation in some populations of Plantago coronopus. Ir. Nat. J. 1977, 19, 61–66. [Google Scholar]
  34. Rushton, B.S. Variation in reproductive allocation of Plantago coronopus L. related to habitat type and geographical location. Proc. R. Ir. Acad. Sect. B Biol. Geol. Chem. Sci. 1990, 90B, 175–192. [Google Scholar]
  35. Smekens, M.J.; van Tienderen, P.H. Genetic variation and plasticity of Plantago coronopus under saline conditions. Acta Oecol. 2001, 22, 187–200. [Google Scholar] [CrossRef]
  36. Tyler, T.; Herbertsson, L.; Olofsson, J.; Olsson, P.A. Ecological indicator and traits values for Swedish vascular plants. Ecol. Indic. 2021, 120, 106923. [Google Scholar] [CrossRef]
  37. Ievinsh, G.; Landorfa-Svalbe, Z.; Andersone-Ozola, U.; Karlsons, A.; Osvalde, A. Salinity and heavy metal tolerance, and phytoextraction potential of Ranunculus sceleratus plants from a sandy coastal beach. Life 2022, 12, 1959. [Google Scholar] [CrossRef]
  38. Borhidi, A. Social behaviour types, the naturalness and relative ecological indicator values of the higher plants in the Hungarian flora. Acta Bot. Hung. 1995, 39, 97–181. [Google Scholar]
  39. Neiceniece, L.; Jēkabsone, A.; Andersone-Ozola, U.; Banaszczyk, L.; Osvalde, A.; Karlsons, A.; Ievinsh, G. Effect of salinity and nitrogen on heavy metal tolerance and accumulation potential in Rumex maritimus. Stresses 2025, 5, 29. [Google Scholar] [CrossRef]
  40. Pierce, S.; Negreiros, D.; Cerabolini, B.E.L.; Kattge, J.; Diaz, S.; Kleyer, M.; Shipley, B.; Wright, S.J.; Soudzilovskaia, N.A.; Onipchenko, V.G.; et al. A global method for calculating plant CSR ecological strategies applied across biomes world-wide. Funct. Ecol. 2017, 31, 444–457. [Google Scholar] [CrossRef]
  41. Tsimilli-Michael, M. Revisiting JIP-test: An educative review on concepts, assumptions, approximations, definitions and terminology. Photosynthetica 2020, 58, 275–292. [Google Scholar] [CrossRef]
  42. Yang, T.; Samarakoon, U.; Altland, J.; Ling, P. Influence of electrical conductivity on plant growth, nutritional quality, and phytochemical properties of kale (Brassica napus) and collard (Brassica oleracea) grown using hydroponics. Agronomy 2024, 14, 2704. [Google Scholar] [CrossRef]
  43. Scoggins, H.L.; van Iersel, M.W. In situ probes for measurement of electrical conductivity of soilless substrates: Effects of temperature and substrate moisture content. HortScience 2006, 41, 210–214. [Google Scholar] [CrossRef]
  44. Rhoades, J.D. Salinity, electrical conductivity and total dissolved solids. In Methods of Soil Analysis, Part 3, Chemical Methods; Soil Science Society of America: Madison, WI, USA, 1996; Volume 5, pp. 417–435. [Google Scholar]
  45. Rubio, G.; Zhu, J.; Lynch, J.P. A critical test of the two prevailing theories of plant response to nutrient availability. Amer. J. Botany 2003, 90, 143–152. [Google Scholar] [CrossRef] [PubMed]
  46. Poorter, H.; Niklas, K.J.; Reich, P.B.; Oleksyn, J.; Poot, P.; Mommer, L. Biomass allocation to leaves, stems and roots: Meta-analyses of interspecific variation and environmental control. New Phytol. 2012, 193, 30–50. [Google Scholar] [CrossRef] [PubMed]
  47. Weiner, J.; Campbell, L.G.; Pino, J.; Echarte, L. The allometry of reproduction within plant populations. J. Ecol. 2009, 97, 1220–1233. [Google Scholar] [CrossRef]
  48. Kolář, J.; Seňková, J. Reduction of mineral nutrient availability accelerates flowering of Arabidopsis thaliana. J. Plant Physiol. 2008, 165, 1601–1609. [Google Scholar] [CrossRef]
  49. Pigliucci, M.; Schlichting, C.D. Reaction norms of Arabidopsis (Brassicaceae). III. Response to nutrients in 26 populations from a worldwide collection. Am. J. Bot. 1995, 82, 1117–1125. [Google Scholar] [CrossRef]
  50. Lin, Y.-L.; Tsay, Y.-F. Influence of differing nitrate and nitrogen availability on flowering control in Arabidopsis. J. Exp. Bot. 2017, 68, 2603–2609. [Google Scholar] [CrossRef]
  51. Bresson, J.; Bieker, S.; Riester, L.; Doll, J.; Zentgraf, U. A guideline for leaf senescence analyses: From quantification to physiological and molecular investigations. J. Exp. Bot. 2018, 69, 769–786. [Google Scholar] [CrossRef]
  52. Li, Z.; Liu, H.; Zhang, Y. A review on chlorophyll meter application on nitrogen fertilizer recommendation. Plant Nutr. Fert. Sci. 2006, 1, 125–132. [Google Scholar]
  53. Wang, S.; Guan, K.; Wang, Z.; Ainsworth, E.A.; Zheng, T.; Townsend, P.A.; Li, K.; Moller, C.; Wu, G.; Jiang, C. Unique contributions of chlorophyll and nitrogen to predict crop photosynthetic capacity from leaf spectroscopy. J. Exp. Bot. 2018, 72, 341–354. [Google Scholar] [CrossRef] [PubMed]
  54. Vuletić, M.V.; Španić, V. Characterization of photosynthetic performance during natural leaf senescence in winter wheat: Multivariate analysis as a tool for phenotypic characterization. Photosynthetica 2020, 58, 301–313. [Google Scholar] [CrossRef]
  55. Kalaji, H.M.; Bąba, W.; Gediga, K.; Goltsev, V.; Samborska, I.A.; Cetner, M.D.; Dimitrova, S.; Piszcz, U.; Bielecki, K.; Karmowska, K.; et al. Chlorophyll fluorescence as a tool for nutrient status identification in rapeseed plants. Photosynth. Res. 2018, 136, 329–343. [Google Scholar] [CrossRef]
  56. Ose, A.; Andersone-Ozola, U.; Ievinsh, G. Substrate-dependent effect of vermicompost on yield and physiological indices of container-grown Dracocephalum moldavica plants. Agriculture 2021, 11, 1231. [Google Scholar] [CrossRef]
  57. Ievinsh, G. Water content of plant tissues: So simple that almost forgotten? Plants 2023, 12, 1238. [Google Scholar] [CrossRef]
  58. Friedman, J. The evolution of annual and perennial plant life histories: Ecological correlated and genetic mechanisms. Annu. Rev. Ecol. Evol. Syst. 2020, 51, 461–481. [Google Scholar] [CrossRef]
  59. Gormally, C.L.; Donovan, L.A. No evidence of local adaptation in Uniola paniculata L. (Poaceae), a coastal dune grass. Southeast. Nat. 2011, 10, 751–760. [Google Scholar] [CrossRef]
  60. Castillo, J.M.; Grewell, B.J.; Pickart, A.; Bortolus, A.; Peña, C.; Figueroa, E.; Sytsma, M. Phenotypic plasticity of invasive Spartina densiflora (Poaceae) along a broad latitudinal gradient on the Pacific coast of North America. Am. J. Bot. 2014, 101, 448–458. [Google Scholar] [CrossRef]
  61. Gratani, L. Plant phenotypic plasticity in response to environmental factors. Adv. Bot. 2014, 2014, 208747. [Google Scholar] [CrossRef]
  62. Kohn, D.; Murrell, G.; Parker, J.; Whitehorn, M. What Henslow taught Darwin. How a herbarium helped to lay the foundations of evolutionary thinking. Nature 2005, 436, 643–645. [Google Scholar] [CrossRef] [PubMed]
  63. Pagel, J.; Treurnicht, M.; Bond, W.J.; Kraaij, T.; Nottebrock, H.; Schutte-Vlok, A.; Tonnabel, J.; Esler, K.J.; Schurr, F.M. Mismatches between demographic niches and geographic distributions are strongest in poorly dispersed and highly persistent plant species. Proc. Natl. Acad. Sci. USA 2020, 117, 3663–3669. [Google Scholar] [CrossRef]
  64. Sporbert, M.; Keil, P.; Seidler, G.; Bruelheide, H.; Jandt, U.; Aćić, S.; Biurrun, I.; Campos, J.A.; Čarni, A.; Chytrý, M.; et al. Testing macroecological abundance patterns: The relationship between local abundance and range size, range position and climatic suitability among European vascular plants. J. Biogeogr. 2020, 47, 2210–2222. [Google Scholar] [CrossRef]
  65. Wilson, J.B.; Lee, W.G. C-S-R triangle theory: Community-level predictions, tests, evaluation of criticisms, and relation to other theories. Oikos 2000, 91, 77–96. [Google Scholar] [CrossRef]
  66. Koyro, H.-W. Effect of salinity on growth, photosynthesis, water relations and solute composition of the potential cash crop halophyte Plantago coronopus (L.). Environ. Exp. Bot. 2006, 56, 136–146. [Google Scholar] [CrossRef]
  67. Ltaeif, H.B.; Sakhraoui, A.; González-Orenga, S.; Faz, A.L.; Boscaiu, M.; Vicente, O.; Rouz, S. Responses to salinity in four Plantago species from Tunisia. Plants 2021, 10, 1392. [Google Scholar] [CrossRef]
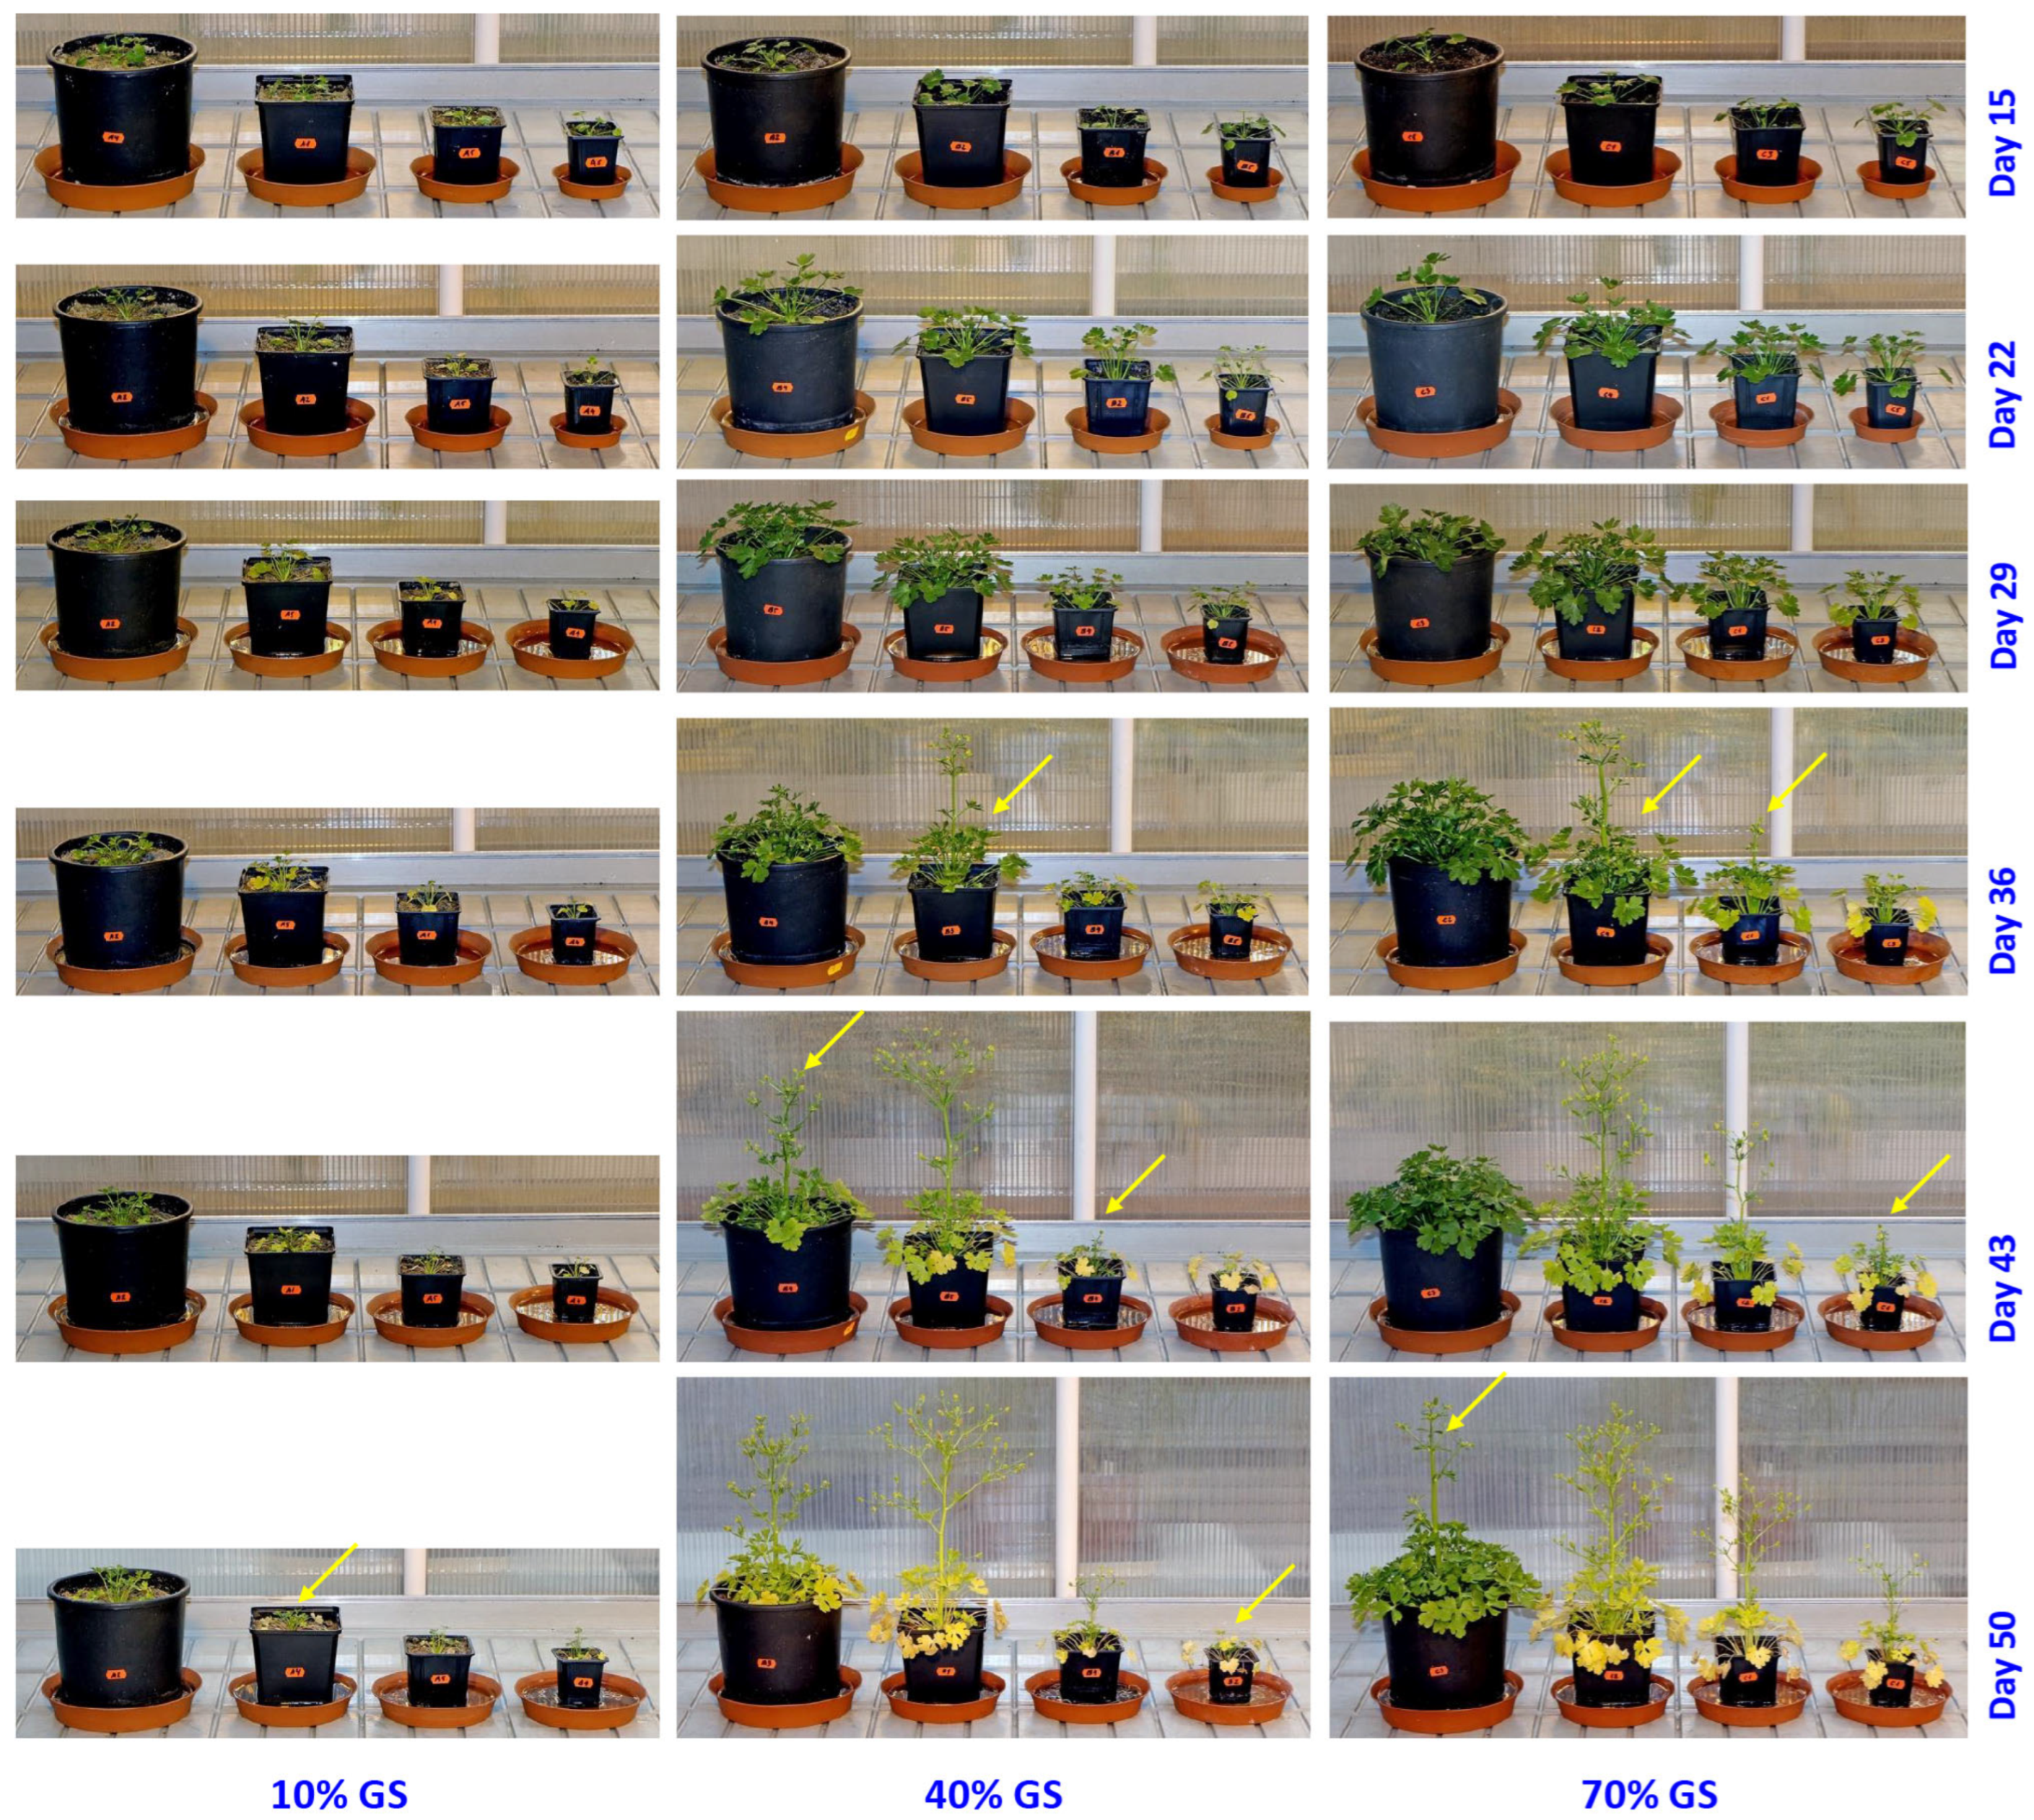
Figure 1. Effect of various rates of mineral nutrient availability (GS %) and container volume on growth and development of Ranunculus sceleratus plants. Plants were cultivated in 0.2, 0.4, 1 and 4 L containers in substrate made from quartz sand and commercial garden soil at different rates of amendment (% v/v). Arrows indicate start of flower stalk development. GS, garden soil. The distance between the vertical marks on the greenhouse bench corresponds to 7 cm.
Ijpb 16 00118 g001
Figure 2. Changes in electrical conductivity (EC) in substrate with different rates of mineral nutrient availability (GS concentration) and substrate volume during cultivation of Ranunculus sceleratus plants. (A), day 31; (B), day 40. Data are means ± SE from four individual measurements in five replicates for each point. Initial values show substrate EC before plant cultivation. Means followed by the same letter are not significantly different according to the Tukey HSD test (p < 0.05). GS, garden soil.
Ijpb 16 00118 g002
Figure 3. Effect of different rates of mineral nutrient availability (GS concentration) and substrate volume on dry biomass of leaves (A), dry biomass of inflorescences (B), and dry biomass of roots (C) of Ranunculus sceleratus plants after 57 days of cultivation. Data are means ± SE from five replicates. Means followed by the same letter are not significantly different according to the Tukey HSD test (p < 0.05). GS, garden soil.
Ijpb 16 00118 g003
Figure 4. Relative dry biomass distribution in different parts of Ranunculus sceleratus plants as affected by the rate of mineral nutrient availability (GS concentration) on the background of different substrate volume: (A), 0.2 L; (B), 0.4 L; (C), 1 L; (D), 4 L. The mass of each plant parts is expressed as a percentage of the total mass of the individual. GS, garden soil.
Ijpb 16 00118 g004
Figure 5. Effect of different rates of mineral nutrient availability (GS concentration) and substrate volume on leaf chlorophyll concentration of Ranunculus sceleratus plants. (A), day 35; (B), day 40. Data are means ± SE from 10 individual measurements for each point. Means followed by the same letter are not significantly different according to the Tukey HSD test (p < 0.05). GS, garden soil.
Ijpb 16 00118 g005
Figure 6. Effect of different rates of mineral nutrient availability (GS concentration) and substrate volume on chlorophyll a fluorescence parameters Fv/Fm (A) and Performance Index Total (B) of Ranunculus sceleratus plants on day 40. Data are means ± SE from 10 individual measurements for each point. Means followed by the same letter are not significantly different according to the Tukey HSD test (p < 0.05). GS, garden soil.
Ijpb 16 00118 g006
Figure 7. Effect of various rates of mineral nutrient availability (GS %) on growth and development of different accessions of Plantago coronopus plants (PC1, PC2, PC3, PC4). Plants were cultivated in 0.2 L containers in substrate made from quartz sand and commercial garden soil at different rates of amendment (% v/v). Arrows indicate start of flower stalk development. GS, garden soil. The distance between the vertical marks on the greenhouse bench corresponds to 7 cm.
Ijpb 16 00118 g007aIjpb 16 00118 g007b
Figure 8. Changes in electrical conductivity (EC) in substrate with different rates of mineral nutrient availability (GS concentration) during cultivation of Plantago coronopus plants. (A), day 29; (B), day 34. Data are means ± SE from four individual measurements in five replicates for each point. Initial values show substrate EC before plant cultivation. Means followed by the same letter are not significantly different according to the Tukey HSD test (p < 0.05). GS, garden soil.
Ijpb 16 00118 g008
Figure 9. Effect of different rates of mineral nutrient availability (GS concentration) on dry biomass of leaves (A), dry biomass of inflorescences (B), dry biomass of flower stalks (C) and dry biomass of roots (D) of Plantago coronopus plants from different accessions after 60 days of cultivation. Data are means ± SE from five replicates. Means followed by the same letter are not significantly different according to the Tukey HSD test (p < 0.05). GS, garden soil.
Ijpb 16 00118 g009
Figure 10. Relative dry biomass distribution in different parts of Plantago coronopus plants as affected by different rates of mineral nutrient availability (GS concentration). Different accessions of P. coronopus PC1 (A), PC2 (B), PC3 (C), PC4 (D) are shown separately. GS, garden soil.
Ijpb 16 00118 g010
Figure 11. Effect of different rates of mineral nutrient availability (GS concentration) on leaf (A) and root (B) water content of Plantago coronopus plants from different accessions. Data are means ± SE from 5 replicates. Means followed by the same letter are not significantly different according to the Tukey HSD test (p < 0.05). GS, garden soil.
Ijpb 16 00118 g011
Figure 12. Effect of various rates of mineral nutrient availability (GS%) and container volume on growth and development of Phleum arenarium plants. Plants were cultivated in 0.2, 0.4 and 1 L containers in substrate made from quartz sand and commercial garden soil at different rates of amendment (% v/v). Arrows indicate start of flower stalk development. GS, garden soil. The distance between the vertical marks on the greenhouse bench corresponds to 7 cm.
Ijpb 16 00118 g012
Figure 13. Changes in electrical conductivity (EC) in substrate with different rates of mineral nutrient availability (GS concentration) and volume during cultivation of Phleum arenarium plants. (A), day 14; (B), day 37. Data are means ± SE from four individual measurements in five replicates for each point. Initial values show substrate EC before plant cultivation. Means followed by the same letter are not significantly different according to the Tukey HSD test (p < 0.05). GS, garden soil.
Ijpb 16 00118 g013
Figure 14. Effect of different rates of mineral nutrient availability (GS concentration) and substrate volume on dry biomass of leaves (A), dry biomass of inflorescences (B), and dry biomass of roots (C) of Phleum arenarium plants after 56 days of cultivation. Data are means ± SE from five replicates. Means followed by the same letter are not significantly different according to the Tukey HSD test (p < 0.05). GS, garden soil.
Ijpb 16 00118 g014
Figure 15. Relative dry biomass distribution in different parts of Phleum arenarium plants as affected by increasing rates of mineral nutrient availability (GS concentration) on the background of different substrate volume: (A), 0.2 L; (B), 0.4 L; (C), 1 L. GS, garden soil.
Ijpb 16 00118 g015
Figure 16. Effect of different rates of mineral nutrient availability (GS concentration) and substrate volume on leaf (A) and root (B) water content of Phleum arenarium plants. Data are means ± SE from 5 replicates. Means followed by the same letter are not significantly different according to the Tukey HSD test (p < 0.05). GS, garden soil.
Ijpb 16 00118 g016
Figure 17. Effect of different rates of mineral nutrient availability (GS concentration) and substrate volume on leaf chlorophyll concentration of Phleum arenarium plants. (A), day 13, (B), day 37. Data are means ± SE from 10 individual measurements for each point. Means followed by the same letter are not significantly different according to the Tukey HSD test (p < 0.05). GS, garden soil.
Ijpb 16 00118 g017
Table 1. Functional strategy characteristics [40] of the model species and the performed experiments.
SpeciesCompetitor (%)Stress Tolerator (%)Ruderal (%)StrategyGS Substitution Rate (%)Container Volume (L)
Phleum arenarium5.4975.1519.37S/SR10, 40, 70, 1000.2, 0.4, 1
Plantago coronopus32.35067.65R/CR20, 40, 60, 800.2
Ranunculus sceleratus46.32053.68CR10, 40, 700.2, 0.4, 1, 4
GS, commercial garden soil; S, stress-tolerator; R, ruderal; C, competitor.
Table 2. The main morphological and physiological effects of differences in mineral nutrient concentration (MNC) and substrate volume (SV) on growth, allocation and flowering of the model species.
ResponsePhleum arenariumPlantago coronopusRanunculus sceleratus
Relative root biomass (% DM)34–547–3829–55
Relative biomass of generative structures (% DM)2–300–500–40
Vegetative growthGrowth inhibited by low MNC, more at higher SVGrowth inhibited by low MNC and by low SV
Changes in root biomassIncreases by increasing MNC, lower at high SVWeakly affected by MNCIncreases both by MNC and SV
Allocation to rootsDecreases with increasing MNCDecreases with increasing MNCDecreases with increasing MNC at high SV, decreases with SV at high MNC
Allocation to generative structuresIncreases with increasing both MNC and SVIncreases by increasing MNC up to saturationDecreases with increasing MNC at high SV, decreases with SV
Flowering and flowering timeLow MNC at low SV delays floweringLow MNC inhibits flowering in a genotype-specific mannerLow MNC inhibits flowering irrespective of SV, high MNC delays flowering
Chlorophyll concentration during the first measurementIncreases with increasing MNC, in part by SVIncreases with increasing MNC, no changes with increasing SV
Chlorophyll concentration during the second measurementIncreases with increasing both MNC and SVIndicates differences in leaf senescence
Leaf water contentIncreases with increasing MNCDecreases with increasing MNC in a genotype-specific mannerLow water content indicates leaf senescence
Root water contentIncreases with increasing SV only at low MNCNo significant changesDecreases with increasing MNC only at low SV
DM, dry mass.
Disclaimer/Publisher’s Note: The statements, opinions and data contained in all publications are solely those of the individual author(s) and contributor(s) and not of MDPI and/or the editor(s). MDPI and/or the editor(s) disclaim responsibility for any injury to people or property resulting from any ideas, methods, instructions or products referred to in the content.