Abstract
The valid deciduous Quercus L. species from North Africa have been largely discussed by many authors. The current species remain yet uncertain. In this study, we compare several populations of presumably Q. canariensis Willd. and Q. faginea Lam. from Algeria with pure populations of these species from the northeast of the Iberian Peninsula. Different morphological characters from leaves have been analyzed. Principal components analysis and a canonical analysis of principal coordinates have been used to observe the relationship between samples, groups and the seven quantitative variables. Distances among centroids have been reported and a SIMPER procedure has also been executed to better explain the different variability within and between groups. PERMANOVA has been applied to test for significant differences between the groups. For the trichomes study, ANOVA models have been used. From our analysis, we conclude that in Algeria, we have a single Q. canariensis Willd. population, different from the Iberian population we examined. It probably corresponds morphologically to Q. mirbeckii Durieu, currently considered a synonymy of Q. canariensis Willd., and for the “Q. faginea” group we have two Algerian populations: Q. faginea Lam. subsp. faginea, found in the northeast Iberian Peninsula, and Q. tlemcenensis (A.DC.) Maire and Weiller ex Greuter and Burdet. Previous results from other authors have also been discussed.
1. Introduction
Quercus L.(Fagaceae) is widely distributed throughout the Northern Hemisphere, both in the Holarctic (Nearctic and Palaearctic), the Neotropics (with the southern limit found in Colombia, where a single species, Q. humboldtii Bonpl., is known), and some parts of the Oriental region, almost overlapping the Fagaceae distribution [1]. Currently, it includes more than 400 species, although less conservative authors suggest there could be more than 500 or 600 [2,3]. The current consensus [4] shows that Quercus is divided into two subgenera: Quercus and Cerris. The subgenus Quercus is divided into five sections (Protobalanus, Ponticae, Virentes, Lobatae, and Quercus) and the subgenus Cerris includes three sections (Cyclobalanopsis, Ilex,and Cerris). The genus Quercus L. (Fagaceae) is known for its complexity, and the difficulty that taxonomists face in classifying the taxa they observe [5]. This is not only related to its plasticity but also to the existence of interspecific hybridizations [6,7] and introgressions [7,8,9]. This is the reason why the list of synonyms is very long in many species.
Among the oaks mentioned throughout history in the Maghreb countries and especially in Algeria, very little is known about them, and this makes it difficult to distinguish them and compare with the European taxa. Different organs are used to classify the genus Quercus according to the taxonomic level [10]. Thus, floral organs are useful for the recognition of subgenera or sections [11], while leaves (morphoanatomical and biometric) are used at the species and subspecies level [12,13]. Finally, acorns and the flours (catkins) can be used to recognize the taxa of the genus at different levels, but above all they help to delimit sections or complexes of species [5,13].
In Algeria, Quercus genus is represented by the following species [14,15,16] Q. ilex L., Q. coccifera L., Q. suber L., Q. afares Pomel (belonging to Cerris section), Q. faginea Lam. (with several subspecies) and Q. canariensis Wills. (belonging to Quercus section); Q. afares originates from hybridisation between Q. suber and Q. canariensis [17] but recently, Simeone et al. [18] found no evidence for this.
Around the denomination, Quercus faginea Lam. are grouped into deciduous or semideciduous trees or shrubs, endemic to the Ibero–Maghreb region (Spain, Portugal, Morocco, Algeria, Tunisia), with a very remarkable foliar polymorphism. This has led to the description of numerous subspecies with a highly variable leaf morphology that is sometimes incompatible with the type form. To further complicate the problem of specific adjudication, Q. faginea is able to hybridize with several species of two different sections [19]; of the Quercus section (Q. petraea (Matt.) Liebl, Q. lusitanica Lam., Q. pubescens Willd., Q. pyrenaica Willd. and Q. robur L.) and of the Cerris section (Q. ilex L., Q. coccifera L., Q. suber L., Q. afares Pomel.). This fact causes the taxonomic delimitation to be delicate and unstable [20,21,22]. The result of all this is the difficulty of relating inter-individual phenotypic variability to populations or even to coherent geographical subsets, both in the Iberian Peninsula and in North African distribution.
Within the annotations to the nomenclature of the genus Quercus L. (Fagaceae), in the Iberian Peninsula and NW Africa of Vázquez et al. [23], the following subspecies of Q. faginea were recognized: subsp. faginea Lam. 1783, subsp. maroccana (Braun-Blanq. and Maire) [24], present only in Morocco, and the subsp. oscensis (P. Monts) FM Vázquez [23], exclusively found in the north of the Iberian Peninsula (Eurosiberian region), which probably originated from an hybridization between the populations of Q. faginea Lam. (sub. Q. lusitanica) and Q. robur L. On the other hand, Vázquez et al. [23] consider that Q. broteroi (Cout.) [25] and Q. broteroi subsp. tlemcenensis (A.DC.) [24], are synonymous with Q. tlemcenensis Trab. Battandier and Trabut [26] and Aissi et al. [5] affirm that Q. broteroi subsp. oscensis hardly differs from Q. tlemcenensis, because apart from its branchlets, it quickly becomes hairless over the course of the year. According to the data, the following species are present in Algeria: Q. canariensis and Q. tlemcenensis (=Q. faginea subsp. broteroi from Aissi et al. [5]), because Q. faginea subsp. baetica is considered a synonymy of Q. tlemcenensis by Vázquez et al. [23]. Nevertheless, some authors affirm that Q. faginea subsp. faginea is also present [5], and some others consider Q. faginea subsp. broteroi as a valid species ([5,27], for example).
Concerning Q. canariensis, it is classified as a semi-evergreen tree, endemic to the Ibero–Maghreb region (eastern and southern Spain, Algeria, Morocco and Tunisia), with a remarkable foliar polymorphism. There are also several synonyms included in this denomination [19]. The most interesting is Q. nordafricana [28], reported from Algeria and considered as Q. canariensis by Vázquez et al. [23]. Quercus nordafricana has also been named as Q. canariensis Willd. var. mirbeckii (Durieu) [29] and Q. faginea Lam. var. mirbeckii (Durieu) [30]. According to Quezel and Santa [15], Q. canariensis corresponds to Q. faginea subsp. baetica.
In view of the above findings, the aim of this study is to assess the taxonomic status of these complexes of species (Q. faginea and Q. canariensis from Algeria) by statistically analyzing the morphological variability of the Algerian populations compared to those already known in the Iberian Northeast, in order to re-evaluate its taxonomic–morphological definition, to know what is in Algeria.
2. Material and Methods
2.1. Sampling Quercus
In Algeria, the populations of Q. faginea are located in the northwest, while those of Q. canariensis are located in the east (Figure 1); two localities were sectioned in three stations for Q. faginea and five for Q. canariensis (Figure 1 and Table 1).
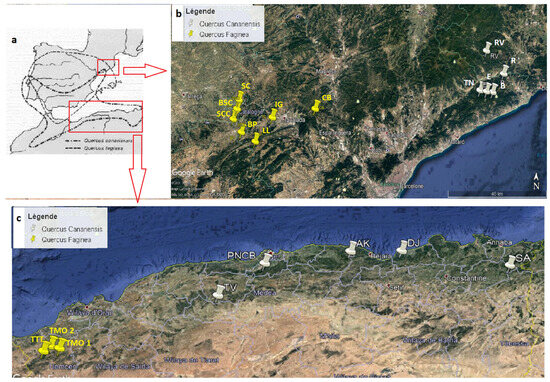
Figure 1.
Location of study stations in Algeria and Catalonia. Images obtained from (a): Quezel and Bonin [31], (b,c): Google Earth.

Table 1.
Ecological characteristics and sampling details of the different oak populations studied.
In order to carry out the study, pure populations of both species were chosen, all of them located in the Iberian Northeast (Figure 1). The Quercus canariensis pure population distribution is very local in this area; five stations were used for the collection (Figure 1 and Table 1). Quercus faginea pure populations are widely distributed in the province of Lleida (Catalonia) and neighboring areas, so a total of seven localities have been chosen (Figure 1 and Table 1).
Samples were collected in June and July (2019–2020) to ensure that the leaves are mature and healthy since the species are deciduous or semi-deciduous. Once the leaves were collected from Catalonia, they were analyzed by Dr. Llorenç Saez, who eliminated those samples that were suspected to have hybrid characteristics with other species of Quercus. For this, leaf sampling, at each study location, was carried out on a variable number of trees, usually between 8 and 16 (rarely a smaller number), representing an average of nine trees per sampling point (Table 1). The trees were randomly selected, and each was separated from the other by at least a distance of 5 m, to minimize the risk of clones. Once the trees had been chosen, two branches located in different orientations were randomly selected. The collected leaves were matured and whole, so that all the morphological values needed to carry out the analysis could be studied. Leaf collection was carried out at random, taking into account the variability shown in the chosen branches. From each tree, we collected usually between 12 and 15 leaves per chosen branch (rarely a smaller or larger number), which means that from each locality, we collected an average of 112 leaves per species of oak in the same station. The total number of leaves collected for this study was 1955 (414 in Algeria and 609 in Catalonia from Q. faginea, 617 in Algeria and 315 in Catalonia from Q. canariensis, respectively). The leaf samples of each tree were placed in a suitably labeled paper envelope and all samples were taken to the laboratory for biometric and morphological measurements.
2.2. Study of Leaves
For the study of the distribution and appearance of pubescence, we observed the leaf samples with a stereomicroscope (OLYMPUS SC30, Tokyo, Japan). The biometric study was performed on the leaves after they were scanned. Each of the leaves was scanned individually on both the upper and lower face. Image analysis and processing software “ImageJ” (Version 1.53) was used to calculate all different morphological parameters, especially for perimeter and surface.
A total of nine features were studied, covering the maximum of the leaf morphology characteristics: two qualitative and seven quantitative (Table 2 and Figure 2).

Table 2.
Morphological parameters studied of the tree leaves.
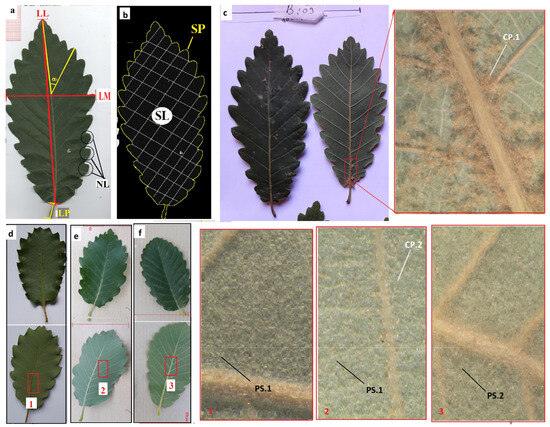
Figure 2.
Morphological characters studied in leaves (see the abbreviations in Table 2). (a) The color of the leaf pubescence; (b) Leafpubescence shape; (c) Length of leaf; (d) Maximal width of leaf; (e) Length of petiole; (f) Surface of leaf.
The sampled trees from Algeria were assigned to three groups, according to the color and density of the pubescence of the leaves (Table 1):
- Leaves with brown pubescence (B) from stations PNCB, TV, AK, DJ and SA.
- Leaves with white and scattered pubescence (WS) from stations TMO1, TMO2, and TTT.
- Leaves with white and dense pubescence (WD) from stations TMO1, TMO2, and TTT.
We observed that groups WS and WD were sampled from the same stations; in other words, WS and WD share their geographical distribution. Besides the three groups from Algeria, we had the two pure populations sampled in Catalonia (Table 1): Quercus canariensis (C) and Quercus faginea (F).
Apart from the seven leaf morphology variables, the radius of the trichomes was measured at nine stations: TMO2, TTT (both from Algeria, sharing groups WS and WD), IG, LL, SC, BSC, SCC, BP, CB (the latter seven correspond to populations of Quercus faginea from Catalonia). For each station, some trees were chosen at random, specifically: 8 WS and 4 WD from TMO2, 5 WS and 3 WD from TTT, 4 from IG, 5 from LL, 4 from SC, 5 from BSC, 5 from SCC, 5 from BP and 5 from CB. To study the leaf hairiness, the lower part of the leaf was rubbed with a needle so that the trichomes fell onto a slide; after this, immersion oil was added, before placing the coverslip over them, and examining all samples (Figure 3). The dimensions and the typology of the trichomes were analyzed with a screen optical microscope (OLYMPUS SC30, Tokyo, Japan) and ZEISS Lab 1 (ZEISS, Jena, Germany), and we took a photo for each observation that would later be used to measure the length of the rays of the trichomes using software ImageJ (Version 1.53).Five leaves were chosen at random from each tree, measuring the mean radius of the trichomes (average of 9 measurements per leaf).
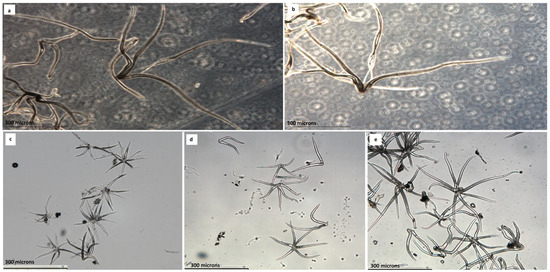
Figure 3.
Leaf trichomes of: (a) Q. canariensis from Catalonia, (b) Q. canariensis from Algeria, (c) Q. faginea ssp faginea from Catalonia, (d) Q. faginea ssp faginea from Algeria and (e) Q. themcenensis from Algeria. Scale 300 µm.
Vázquez et al. [23] assessed the range of variability in the length of the trichomes as follows: rays (160) 180–250 (280) microns; this means that 160 is the minimum value, 280 the maximum value, and 180–250 the most frequent values. This nomenclature is mentioned in the discussion.
2.3. Statistical Analysis
In addition to the usual summary statistics and boxplots to represent the variables distribution, we performed multivariate techniques, with the aim of visualizing and comparing the stated groups. Principal components analysis (PCA) and a canonical analysis of principal coordinates (CAP) were used to observe the relationship between samples, groups, and the seven quantitative variables. CAP is a technique that searches for the canonical axes (that is, the directions in the multivariate space that maximize the explained variation among groups), taking a matrix of proximities as the input data. The distances among centroids have been reported, and a SIMPER procedure has also been executed to better explain the different variability within and between groups. PERMANOVA (permutational multivariate analysis of variance) was applied to test for significant differences between the groups. The designs were created, including three factors: groups, stations and trees. Prior to the calculation of the matrix of the Euclidean distances between samples, the variables were normalized. The election of PERMANOVA instead of doing classical MANOVA (or ANOVA, in the case of a single variable) is due to the non-normal distribution of some variables. All the analyses were performed using the software PRIMER 7 and PERMANOVA.
For the study of the radius of the trichomes, ANOVA models were used to compare stations and groups. The descriptive analysis and test results were obtained using STATGRAPHICS Centurion 18 and SPSS 27.
3. Results
Mean and standard deviation for each quantitative variable and group can be found in Table 3. Some evident differences are revealed between groups, although that is not the case between WS and WD: their means and standard deviations are very similar (see column W, which shows the conjoint or pooled results from WS and WD), but clearly differentiated from B and C, which is not quite different from F in some variables. On the other hand, the groups B and C show some similar values, though not for all the variables.

Table 3.
Mean ± SD (standard deviation) for each group and quantitative variable. The column W shows the results of pooling WS and WD.
In Figure 4, we can see the plot of the two first principal components obtained from a PCA, performed with the observations of groups WS and WD. We do not observe evident differences between the distributions of the two groups in these two axes. Nevertheless, can we affirm that the two groups are not significantly different? To answer this question, we performed a three-factor PERMANOVA design, including group (WS and WD), station (TMO1, TMO2 and TTT) and tree as factors. All quantitative variables were included, calculating the matrix of Euclidean distances between samples after normalizing the variables. As mentioned earlier, groups WS and WD share the same stations, so the factors group and station were crossed, whereas tree (stated as a random effect factor) was nested within the interaction group x station. The results were crystal clear: no significant differences between groups WS and WD (p = 0.7724), but significant differences between stations (p = 0.0001) and variability (as was expected) among trees (p = 0.0001). No interaction was detected between groups and stations (p = 0.6982). In addition, we performed the same PERMANOVA design for each of the quantitative variables separately (in fact, a permutational ANOVA for each variable), and the results confirmed the diagnostic: no significant differences for any of the seven variables between WS and WD (the smaller p-value for group is p = 0.2493 in the case of variable LP). In summary, we can accept that groups WS and WD are very close in terms of these quantitative variables, so we can consider pooling the groups WS and WD (labeled W) for the purposes of the analysis.
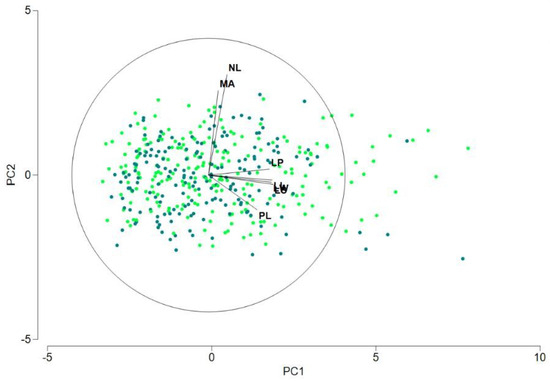
Figure 4.
Representation of the results of a PCA performed with groups WS and WD, including the seven quantitative variables in the analysis. The two first principal components account for 60.3% and 14.9% of the total variation, respectively.
After pooling the groups WS and WD in a new group labeled W, we show the boxplots for every variable and group in Figure 5. In addition, we performed a CAP (canonical analysis of principal coordinates). Previously, to execute the analysis, all the seven variables were normalized and the matrix of Euclidean distances between all samples was calculated. In Figure 6, we can observe the results of plotting the two first axes (canonical variates). Besides the graphic, we calculated the distances between the centroids (Table 4). From our calculations, the minimum distance was 0.997 between the centroids F and W. On the other hand, centroid C was the closest to centroid B, but the distance was 1.733.
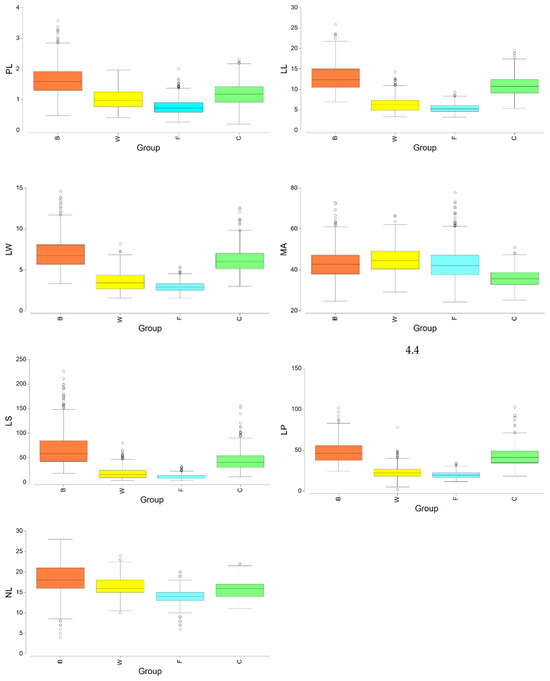
Figure 5.
Boxplots for every variable and group. W is the group obtained after pooling WS and WD.
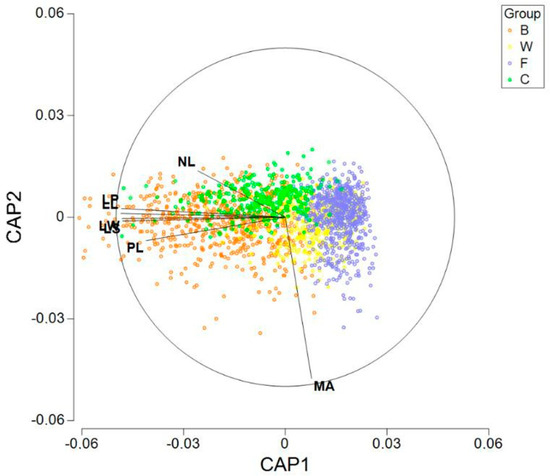
Figure 6.
Representation of the two first axes obtained with CAP (canonical analysis of principal coordinates), denoting the samples that belong to each group.

Table 4.
Euclidean distances between the centroids of the four groups (B, W, C and F).
Using the procedure SIMPER from PRIMER 7, the average squared distance between observations has been calculated and reported in Table 5. This measure is an estimate of dispersion or variability within and between groups. Clearly, group B has the highest variability (the average squared distance within the group is equal to 6.39), while group F has the lowest dispersion (average of 2.03). It is remarkable that group W (average of 2.45) has less variability than group C (average of 3.33) and group B. On the other hand, observing the average square distances between groups, we can confirm that group F appears to be close to group W (the average square distance is 5.46), whereas group B is close to C (average of 12.71). Nevertheless, it is to be noted that the average square distance between groups W and C (average of 12.13) is less than 12.71, but this result is probably due to the high variability within group B.

Table 5.
Average squared distances between observations, within and between the four groups (B, W, C and F).
With the aim to test for significant differences between the four groups, we performed another PERMANOVA design with three factors, but now completely nested: tree (stated as a random factor) is nested to the station, and the station is nested to the group (recall that now there are no shared stations between groups). The results show significant differences between groups (p = 0.0001), between stations (p = 0.0001) and, as was clearly expected, variability among trees (p = 0.0001). Post hoc pairwise comparisons were also performed and the results revealed significant differences between all groups (p = 0.0001 for all pairwise comparisons). In addition to these results, we executed the same PERMANOVA design for each one of the quantitative variables separately, confirming significant differences in all cases (so we reject the seven null hypothesis of no differences between groups; p = 0.0001 in all cases) A summary of the significant pairwise comparisons for each single variable can be observed in Table 6.

Table 6.
Pairwise comparisons of the four groups for each one of the seven quantitative variables. ***, ** and * indicate, respectively, a p-value below the thresholds p = 0.00017, p = 0.00167 and p = 0.00833 (the values actually correspond to p = 0.001, p = 0.01 and p = 0.05 after applying the Bonferroni correction). No significance differences were denoted with ns.
The SIMPER analysis reveals some additional results. Three variables (MA, NL and PL) jointly explain 76% of the square distances between W and F, the two closest groups. Nevertheless, no significant differences for MA was detected in the post hoc comparisons between W and F (very likely due to the high variability of this variable), so interpreting this variable must be carried out with caution. Perhaps the focus should be on LS, NL and PL when assessing the differences between W and F.
Recall that group B has shown the highest within-group variability, being in this way the most heterogeneous, and it appears to be closer to C than to the other groups. Despite this relative proximity, significant differences between B and C were detected for all the seven variables. The SIMPER results agree, showing that all variables have relevant contributions to the square distances between the two groups.
Concerning the analysis of the radius of the trichomes, we initially focused on the Algerian data. The descriptive results for all groups and stations can be observed in Table 7. The differences between the stations TMO2 and TTT seem obvious, but not between groups WS and WD. To test this hypothesis, a three factor ANOVA model was performed: group (WS and WD), station (TMO2 and TTT) and tree, with the last stated as a random factor nested to the interaction between group and station. Group and station are crossed factors, and the interaction term was included in the model. The results are clear: no significant differences between WS and WD (p = 0.4510), significant differences between TMO2 and TTT (p < 0.0001), but no interaction detected (p = 0.1929). As was expected, tree variability is significant (p < 0.0001). The dot-plot (Figure 7) shows the evident differences between the leaves of the two stations. It can be noted that the radius in TMO2 is higher, but also more variable. Due to the homoscedasticity condition of the ANOVA models, we performed separate models for each station (ANOVA nested design, tree nested to the group) No significant differences between groups WS and WD were detected in TMO2 (p = 0.1934) neither in TTT (p = 0.5322), so it seems reasonable that WS and WD can be pooled (group W).

Table 7.
Mean ± SD (standard deviation) for the trichome radius of seven stations from Catalonia (BP, BSC, CB, IG, LL, SC and SCC) and two stations from Algeria (TMO2 and TTT). The columns indicate the group; W shows the results of pooling WS and WD.
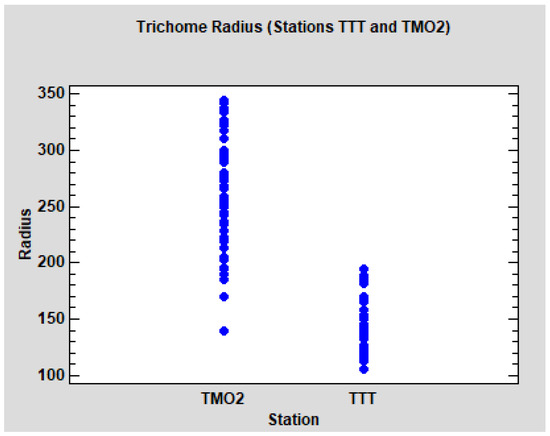
Figure 7.
Dot-plot of the trichome radius from the Algerian stations TMO2 and TTT. Each point represents the mean trichome radius of a leaf.
On the other hand, we analyzed the trichome radius of Quercus faginea in Catalonia (see the descriptive results in Table 6). A nested design was devised(now tree is nested to station), and no significant differences between the stations were detected (p = 0.1586), only variability among trees (p < 0.0001).
With the aim to compare the trichome radius of TMO2 and TTT with the stations from Catalonia, we reran the last ANOVA design (tree nested to station), this time including the Algerian stations. When we added TTT into the analysis, the result showed no significant differences between stations (p = 0.1296). Finally, we reran the analysis, adding TTT and TMO2;a significant difference among stations was detected this time (p < 0.0001). As could be expected, post hoc pairwise comparisons (Tukey HSD method, α = 5%) revealed that solely TMO2 is significantly different from the others (TTT and the seven Catalonian stations). Tukey HSD confidence intervals for each station are plotted in Figure 8.
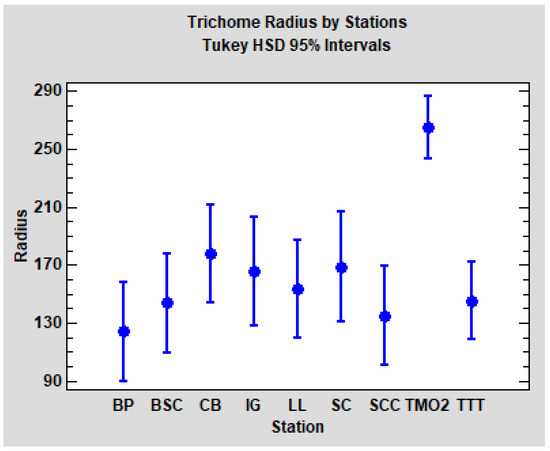
Figure 8.
Mean and Tukey HSD confidence intervals (95%) for the trichome radius of the seven stations from Catalonia (BP, BSC, CB, IG, LL, SC and SCC) and two stations from Algeria (TMO2 and TTT).
In summary, in relation to the radius of the trichomes, we found evident differences between the stations TMO2 and TTT, but no significant differences between the groups WS and WD. TTT seems to be comparable to Quercus faginea populations from Catalonia, but TMO2 is clearly differentiated.
4. Discussion
The identification of Quercus species at the specific level, both in the Iberian Peninsula and North Africa, has always been complex and challenging. The reasons for this lie in the plasticity of the trees as well as in the high level of hybridization of the neighboring species. In North Africa, this confusion is exacerbated because the vernacular name of all deciduous species is ‘Chëne Zéen’, also known as chêne zang, remarkable for its density in the forest. This effect increases the confusion regarding taxonomic identification, and sometimes contradictory published morphological names and descriptions from North Africa are observed. The consequence of all this has been that, in different monographies, botanists consider different classifications or taxonomies belonging to the Chêne Zéen denomination.
One of the first classifications of the North African Quercus [32] considered no less than six species of “Chêne Zéen”: Q. faginea Lamk, Q. mirbekki Durieu, Q. alpestris Boiss, Q. maroccana (Br.-Bl. and Maire) Villar, Q. baetica (Weeb) Huguet and Q. tlemcenensis (A.DC.) Trabut. In the same period, Camus [33] distinguished three species: Q. mirbeckii (with two varieties, tlemcenensis and maroccana), Q. alpestris and Q. faginea, and Quezel and Santa [15] only a single species: Q. faginea, with two subspecies (bateica and tlemcenensis). Later on, Quezel [34], Achhal et al. [35] and Benabid [36] considered two valid taxa: Q. canariensis Willd and Q. faginea, and this was more or less the principal denomination of the species from Algeria named Chêne Zéen until the early 21st century. Nevertheless, Naima et al. [27] incomprehensibly considered, again, the classification from Quezel and Santa [15] from Algerian Chêne Zéen species. Concerning Q. canariensis, a series of different names has been attributed to the species in the Iberian Peninsula and in North Africa. In the last revision [23], the authors concluded that there exist a single species related to Q. canariensis: Q. canariensis s.l. When Villar [28] described Quercus nordafricana Villar, he relied on a group of materials distributed by different enclaves of North Africa, where there was evidence of the presence of Q. canariensis Willd., usually called Q. mirbeckii Durieu [23,26,37]. Quercus nordafricana is identified as a specimens of Q. canariensis Willd., with medium to small leaves, with short petioles, usually partially depilated when the leaves mature, with an ovate–lanceolate outline which can become oblong–lanceolate. Vázquez et al. [23] considered this species a synonym of Q. canariensis. Quercus nordafricana is also related to the taxon Q. salzmanniana (Webb) Coutinho, currently also synonymous with Q. canariensis according to Vázquez et al. [23]. However, these authors mentioned that Q. nordafricana Villar and Q. salzmaniana (Webb) Coutinho differ fundamentally in the presence of leaves with non-flocculous pubescence in the case of Q. salzmaniana, with persistent short trichomes of less than 240 microns, against the leaves with flocculent trichomes of more than 300 microns, those non-persistent of Q. nordafricana on the surface of the blade. Quercus mirbeckii Dur., also called Q. lusitanica var. baetica Webb., is considered synonymous with Q. canariensis by Vázquez et al. [23]; it is characterized by presenting a drooping pubescence, but usually remains especially in the midrib, with medium-sized leaves with a crenate margin. On the other hand, multiple subspecies or varieties (such as angustifolia, brevipetiolata, fagifolia, microphylla, subpedunculata and typica) of Q. Mirbeki have been described, none of which will be considered valid after Vázquez et al. [23]. Overall, Q. canariensis is considered as a single species with several varieties [19], but our results do not support this possibility.
The statistical analysis shows the existence of two morphologically different populations of Q. canariensis; one of them is found in the northeast of the peninsula (corresponding to the typical form of Q. canariensis) and the other one in Algeria. Both populations have significant differences for all the seven quantitative variables (Table 6). Morphologically, both populations differ (Figure 5). In terms of petiole length, it is less than 23.2 mm in Catalan populations but it reaches a length of up to 35.6 mm in Algerian populations; the shapes of the lobes are deeper and bigger in Catalan populations, and shallower and smaller in Algerian populations; leaves from Algerian populations can be bigger (up to 25 cm) than in Catalan populations (less than 19 cm); the angle of secondary nervation can also be bigger in Algerian populations (less than 50° in Catalan populations, but it could reach 72° in Algerian populations); something similar could be said about the width, surface and perimeter of the leaf. Concerning the pilosity, no difference has been observed in both populations; the trichomes are non-persistent, with 300–800 microns in length. According to all of this, we probably have two different species or varieties belonging to the canariensis group and, in this sense, from Algeria, mirbeckii may have to be considered as a valid name, because the Algerian specimens correspond morphologically to this denomination. This population cannot be Q. nordafricana, because this species has short leaves and a short petiole (Vázquez et al. [23]), and the studied Algerian population has large leaves and long petioles.
Concerning Quercus faginea, it is a very plastic species, so the number of synonyms and combinations of species, subspecies and varieties has been huge [19,23,24,27].
In Algeria, Camus [38] distinguishes different taxonomic series, where the tlemcenensis, and maroccana taxa are attached to Quercus mirbeckii; this species, Q. mirbeckii, is now a synonym of Q. canariensis (see above). Later, Quezel and Santa [15] consider two Algerian subspecies of Q. faginea: baetica and tlemcenensis, and Babali et al. [39] mentions that Q. faginea would be represented in the Tlemcen Mountains (Algeria) by the subspecies tlemcenensis, as the subspecies broteroi is considered synonymous with tlemcenensis.
Concerning the denominations mentioned, Vázquez and Coombes [24] differentiated two taxa of the faginea group: Q. faginea (including the subspecies faginea and maroccana) and Q. broteroi (with the subspecies broteroi and tlenceniensis). Nevertheless, Vázquez et al. [23] concluded that Q. tlemcenensis is a valid species (=Q. faginea Lam. subsp. broteroi (Coutinho) A. Camus = Q. broteroi (Coutinho) [25]) for taxonomical reasons (see Vázquez et al. [23], for example). Recently, Aissi et al. [5] reported two faginea subspecies from Morocco (faginea and maroccana) and another from Algeria (broteroi), but there is no doubt that the broteroi from Aissi et al. [5] corresponds to Q. tlemcenensis from Vázquez et al. [23].
Finally, according to Vázquez et al. [23], Q. faginea subsp. maroccana is considered a valid subspecies; however, it may also has to be considered as a hybrid between Q. canariensis and Q. tlemcenensis (=Q. x maroccana Villar 1943). In the Algerian “Q. faginea” group, Q. tlemcenensis is mentioned as single species. The differences are mentioned in Vázquez and Coombes [24]. Nevertheless, Vázquez et al. [23] found that the most notable characteristics to discriminate this taxon from the rest of the Q. faginea s.l. group are not the dimensions of its leaves, the morphology of the blade or its margin, but the dimensions and typology of the foliar trichomes that are deposited in greater or lesser intensity on the underside of the lamina, since they are multi-starred, mixed with starlets and pedicels, with rays that exceed 200 microns. Berrichi and Bouazzaoui [40], studying the dendrometry of Q. faginea from Moutas (Themcen), concluded that the leaves collected from the southern trees have the lowest vegetative values, while the leaves collected from eastern trees have large leaves with developed vegetative characteristics. These results confirm the plasticity of Q. faginea, and this poses challenges to historically recognizing the Algerian populations.
According to our results, the differences in the distribution of hairiness (dense vs. sparse) in the Algerian populations of Q. faginea s.l. are not significant in the examined samples (WS and WD); the PERMANOVA results between the WS and WD groups confirm this hypothesis (p = 0.7724), as well as the PERMANOVA design for each of the quantitative variables separately. Therefore, since no significant difference was found, we can accept that the WS and WD groups are the same.
In addition, our study shows the existence of two different Algerian populations of Q. faginea s.l.: one with a typology which statistically coincides with the population of Catalonia (Q. faginea ssp faginea), and another similar to the Q. themcenensis concept. According to Vázquez et al. [23] the principal characteristic for recognizing Q. tlemcenensis is the length of the pilosity: the multi-stellate leaf trichomes have rays of (180) 210–350(420) microns in Q. themcenensis and shorter in Q. faginea ssp faginea, which have rays of (160) 180–250 (280) microns. In our study, the trichomes of the examined Q. themcelensis can be a little longer (can reach almost 470 microns) and for the examined Q. faginea population, the rays are often less than 200 microns in length, but they can reach almost 300 microns; these values agree with the definition of Q. faginea ssp faginea and Q. tlemcenensis reported by Vázquez et al. [23]. In addition, the TTT (Q. faginea ssp faginea) and TMO2 (Q. themcenensis) populations statistically have almost the same foliar characters (no significant statistical differences detected; Figure 7 and Figure 8) and this also concurs with the conclusions of Vázquez et al. [23] about these species. Nevertheless, the results by Amaral Franco [21] concerning the foliar pubescence, and Tschan and Denk [41] concluded that this characteristic seems insufficient in itself to differentiate populations, due to the superposition of values between the two Algerian populations studied by Amaral Franco [21], an aspect that does not agree with our results (Figure 7), where the supposition is really minimal. The reason for this is that Amaral Franco included hybrids forms in his study.
In summary, in Algeria we have a single Q. canariensis population, which is different from the Iberian population examined. It corresponds morphologically probably to Q. mirbeckii, which is currently considered a synonym of Q. canariensis. For the faginea group, we have two Algerian populations, Q. faginea spp faginea and Q. tlemcenensis, as reported by Vázquez et al. [23]. Our results do not completely harmonize with the current knowledge from Algeria [5,23]; therefore, a phylogenetic study would be required to clarify the borderline populations of Q. canariensis and Q. faginea in North Africa, as well as new sampling in other North African areas for a new data analysis.
Author Contributions
A.B. collected leaf specimens from the field, carried out the morphological and comparative study of the specimen interpreted the data, and prepared the manuscript. L.B.-G. guided this research and conceived the plan of work. She also interpreted the data and prepared selected parts of the manuscript. F.O. carried out the statistical part and discussed the results. B.S.G.S. contributes on data interpretation. K.B. collected leaf specimens from the field in Algeria. F.M.V.P., revision of the manuscript. J.P.-V., sampling in Spain, carried out the morphological and comparative study of the specimen, prepared selected parts of the manuscript, and discussed the results. All authors have read and agreed to the published version of the manuscript.
Funding
This research received no external funding.
Institutional Review Board Statement
Not applicable.
Informed Consent Statement
Not applicable.
Data Availability Statement
The datasets used or analyzed during the current study are available from the corresponding author on reasonable request.
Acknowledgments
The first author is a recipient of the grant PNE-2019/2020 (Programme National Exceptionnel) by the Ministry of Higher Education and Scientific Research, (Algeria). We thank the Ministry of Higher Education and Scientific Research for the financial support. We also thank Llorenç Sáez Gunyalons (Universitat Autònoma de Bellaterra, Catalonia) for checking all the Catalan samples included in this study and Martí Boada I Juncà (Universitat Autònoma de Bellaterra) for helping us with Q. canariensis samples from Catalonia. We also acknowledge the support of the forest conservation (Tlemcen, Souk Ahras, Bejaia, Jijel and Blida) and the national park of Theniet El Had. Finally, we thank Allen Coombes (Herbario y Jardín Botánico de Puebla, Mexico) for his comments regarding Q. afares. We also want to thank Bright Danso for translating this manuscript into English.
Conflicts of Interest
The authors declare no conflicts of interest.
References
- Stevens, P.F. Angiosperm Phylogeny Website 2001. Version 14. July 2017. Available online: http://www.mobot.org/MOBOT/research/APweb/ (accessed on 10 February 2021).
- Nixon, K.C. Fagaceae. In Flora of North America: North of Mexico; Oxford University Press: New York, NY, USA, 1997; pp. 436–537. [Google Scholar]
- Valencia, S. Diversidad del Género Quercus (Fagaceae) en México; Botanical Sciences: Pooler, GA, USA, 2004; Volume 75, pp. 33–53. [Google Scholar]
- Denk, T.; Grimm, G.W.; Manos, P.S.; Deng, M.; Hipp, A.L. An updated infrageneric classification of the oaks: Review of previous taxonomic schemes and synthesis of evolutionary patterns, In Oaks Physiological Ecology. Exploring the Functional Diversity of Genus Quercus L.; Gil-Pelegrín, E., Peguero-Pina, J., Sancho-Knapik, D., Eds.; Tree Physiology; Springer International Publishing: New York, NY, USA, 2017; Volume 7, pp. 13–38. [Google Scholar]
- Aissi, A.; Beghami, Y.; Lepais, O.; Véla, E. Analyse morphologique et taxonomique du complexe Quercus faginea (Fagaceae) en Algérie. Botany 2021, 99, 99–113. [Google Scholar] [CrossRef]
- Müller, C.H. Ecological control of hybridization in Quercus: A factor in the mechanism of evolution. Evolution 1952, 6, 147–161. [Google Scholar] [CrossRef]
- Rushton, B.S. Natural hybridization within the genus Quercus L. Ann. For. Sci. 1993, 50, 73s–790s. [Google Scholar] [CrossRef]
- Hardin, J.W. Hybridization and introgression in Quercus alba. J. Arnold Arbor. 1975, 56, 336–363. [Google Scholar] [CrossRef]
- Leroy, T.; Roux, C.; Villate, L.; Bodénès, C.; Romiguier, J.; Paiva, A.P.J.; Dossat, C.; Aury, J.-M.; Phlomion, C.; Kremer, A. Extensive recent secondary contacts between four European white oak species. New Phytol. 2017, 214, 865–878. [Google Scholar] [CrossRef] [PubMed]
- Vázquez, F.M. Micromorphological and Anatomical Characters Used to Differentiate Mediterranean Oaks. Int. Oak Soc. J. 2013, 24, 122–129. [Google Scholar]
- Maire, R. Flore de l’Afrique du Nord; (Tome 6); Lechevalier: Paris, France, 1961; pp. 97–105. [Google Scholar]
- Cristofolini, G.; Crema, S. A morphometric study of the Quercus crenata species complex (Fagaceae). Bot. Helv. 2005, 115, 155–167. [Google Scholar] [CrossRef]
- Romero-Rangel, S.; Rojas-Zenteno, E.C.; y Rubio-Licona, L.E. Encinos de México (Quercus, Fagaceae) 100 Especies; de la Universidad Nacional Autónoma de México, Iztacala: Tlalnepantla, Mexico, 2015; p. 239. [Google Scholar]
- Battandier, J.-A. Flore de l’Algérie: Ancienne Flore d‘Alger Transformée, Contenant la Description de Toutes les Plantes Signalées Jusqu’à ce jour Comme Spontanées en Algérie; Battandier, J.-A., Trabut, L.-C., Eds.; Libraire A. Jourdan: Alger, Algeria; Libraire F. Savy: Paris, France, 1888; Volume 1, pp. 819–825. [Google Scholar]
- Quezel, P.; Santa, S. Nouvelle Flore de l‘Algérie et des Régions Désertiques Méridionales; C.N.R.S.: Paris, France, 1962; p. 1170. [Google Scholar]
- Dobignard, A.; Chatelain, C. Index Synonymique et Bibliographique de la Flore d’Afrique du Nord. Vol. 4: Dicotyledoneae: Fabaceae—Nymphaceae; Conservatoire et Jardin Botanique Ville de Genève: Genève, Switzerland, 2012; p. 455. [Google Scholar]
- Mir, C.; Toumi, L.; Jarne, P.; Sarda, V.; di Giust, F.; Lumaret, R. Endemic North African Quercus afares Pomel originates from hybridisation between two genetically very distant oak species (Q. suber L. and Q. canariensis Willd.): Evidence from nuclear and cytoplasmic markers. Heredity 2006, 96, 175–184. [Google Scholar] [CrossRef][Green Version]
- Simeone, M.C.; Cardoni, S.; Piredda, R.; Imperatori, F.; Avishai, M.; Grimm, G.W.; Denk, T. Comparative systematics and phylogeography of Quercus Section Cerris in western Eurasia: Inferences from plastid and nuclear DNA variation. PeerJ–Life Environ. 2018, 6, e5793. [Google Scholar] [CrossRef]
- Hélardot, J.L. Oaks of the World: Description of All Species, Subspecies and Varieties of Oaks in the World. Available online: http://oaks.of.the.world.free.fr/index.htm (accessed on 10 February 2021).
- Trabut, L. Sur les variations du Quercus mirbeckii Durieuen Algérie. J. Bot. 1892, 4, 1–6. [Google Scholar]
- Amaral Franco, J. Quercus L. In Flora Ibérica. Plantas vasculares de la Península Ibérica e Islas Baleares; Castroviejo, S., Laínz, M., López González, G., Montserrat, P., Muñoz Garmendia, F., Paiva, J., Villar, L., Eds.; Vol. II. Platanaceae-Plumbaginaceae (partim); Real Jardín Botánico, CSIC: Madrid, Spain, 1990; pp. 15–36. Available online: https://www.torrossa.com/en/resources/an/4778334 (accessed on 10 February 2021).
- Bussotti, F.; Grossoni, P. Des problèmes dans la classification des chênes. Taxonomie en Europe et région méditerranéenne. Forêt Méditerranéenne 1998, 19, 267–278. [Google Scholar]
- Vázquez, F.M.; Coombes, A.J.; García, D.; Márquez, F.; Meireles, C.; Guerra, M.J.; Vilaviçosa, C. Anotaciones a la nomenclatura del género Quercus L. (Fagaceae), en la Península Ibérica y NW de África. Folia Bot. Extrem. 2018, 12, 5–79. [Google Scholar]
- Vázquez, F.M.; Coombes, A. Aproximación al conocimiento del género Quercus L. Sect. Gallifera Spach (Fagaceae) en Extremadura (España). Folia Bot. Extrem. 2016, 9, 25–34. [Google Scholar]
- Rivas-Martínez, S.; Sáenz Laín, C. Enumeración de los Quercus de la Península Ibérica. Rivasgodaya 1991, 6, 101–110. [Google Scholar]
- Battendier, J.A.; Trabut, L.C. Flore Analytique et Synoptique de L’Algérie et de la Tunisie; Giralt: Alger, Algeria, 1905; p. 460. [Google Scholar]
- Naima, B.; Kouider, C.; Brahim, B. Quercus faginea subsp. tlemcenensis Stands in the Moutas Reserve (Tlemcen, Northwest Algeria). Am. J. Plant Sci. 2020, 11, 80–90. [Google Scholar] [CrossRef]
- Villar, E.H. Les Quercus de L’Herbier d’Alger. Bull. Société Bot. L‘Afr. Nord. 1938, 28, 432–478. [Google Scholar]
- Vicioso, C. Revision of the genus Quercus in Spain. Bol. Inst. For. Invest. Exp. Madrid 1950, 21, 51. [Google Scholar]
- Maire, V. Etud sur les especes d Ammonites de l Oxfordien inferieur de Franche-Comte, appurtenant aux genres Perinsphinctes, Aspidoceras, Peltoceras. Bull. Soc. Geol. France 1932, 5, 21–51. [Google Scholar]
- Quezel, P.; Bonin, G. Deciduous Forests around the Mediterranean: Constitution, Ecology, Current Situation, Prospects. RFF 1980, XXXII, 253–268. [Google Scholar] [CrossRef]
- Villar, E.H. Les Quercus de la Section Galliferae de L‘Afrique du Nord. Travaux Dedique a Rene Maire. 1949, pp. 165–171. Available online: https://funci.org/benumeya/bny-48310/ (accessed on 10 February 2021).
- Camus, A. Les Chênes: Monographie du Genre Quercus. 3, Genre Quercus, sous-Genre Euquercus (Sections Protobalanus et Erythrobalanus), Monographie du Genre Lithocarpus et Addenda aux Tomes 1, 2, 3. Vol. III; Paul Lechevalier & Filséd: Paris, France, 1952; p. 1314. [Google Scholar]
- Quezel, P. Les Forêsts du Mediterranéen. Ecologie, Conservation et Aménagement; UNESCO: Paris, France, 1976; pp. 9–33. [Google Scholar]
- Achhal, A.; Barbero, M.; Benabid, A.; Mhirit, O.; Peyere, C.; Quezel, P.; Rivas-Martinez, S. About the Bioclimatic and Dynamic Value of Some Forest Species in Morocco. Ecol. Mediterr. 1980, 5, 211–249. [Google Scholar] [CrossRef]
- Benabid, A. Etudes Phytoécologique, Biogéographique et Dinamique des Associations et Séries Sylvatiques du Rif Occidental (Maroc). Ph.D. Thesis, Faculté des Sciences et Techniques St. Jerôme, Université de Droit, d‘Economie et des Sciences d‘Aix-Marseille, Aix-en-Provence, France, 1982; p. 199. [Google Scholar]
- Maire, R.; Weiller, M. Quercus L. In Flore Afrique du Nord; Lechevalier: Paris, France, 1961; Volume VII, pp. 90–134. [Google Scholar]
- Camus, A. Les Chênes. Monographie du Genre Quercus. Tome I. Genre Quercus, Sous Genre Cyclobalanopsis, sous-Genre Euquercus (Sections Cerris et Mesobalanus); Texte; Paul Lechevalier: Paris, France, 1938. [Google Scholar]
- Babali, B.; Hasnaoui, O.; Bouazza, M. Note on the Vegetation of the Mounts of Tlemcen (Western): Floristic and Phytoecological Aspects. Open J. Ecol. 2013, 3, 370–381. [Google Scholar] [CrossRef][Green Version]
- Berrichi, M.; Bouazzaoui, A. Quercus faginea in the Mounts of Tlemcen (North-west Algeria): State of Knoledge. Ecol. Balk. 2015, 7, 21–28. [Google Scholar]
- Tschan, G.F.; Denk, T. Trichome types, foliar indumentums and epicuticular wax in the Mediterranean gall oaks, Quercus subsection Galliferae (Fagaceae): Implications for taxonomy, ecology and evolution. Bot. J. Linn. Soc. 2012, 169, 611–644. [Google Scholar] [CrossRef]
Disclaimer/Publisher’s Note: The statements, opinions and data contained in all publications are solely those of the individual author(s) and contributor(s) and not of MDPI and/or the editor(s). MDPI and/or the editor(s) disclaim responsibility for any injury to people or property resulting from any ideas, methods, instructions or products referred to in the content. |
© 2024 by the authors. Licensee MDPI, Basel, Switzerland. This article is an open access article distributed under the terms and conditions of the Creative Commons Attribution (CC BY) license (https://creativecommons.org/licenses/by/4.0/).