Article

Morphological and Genetic Diversity of Scutellaria tuvensis Juz., an Endemic of Desert Steppes

Central Siberian Botanical Garden, Siberian Branch of RAS, Novosibirsk 630090, Russia
*
Author to whom correspondence should be addressed.
Int. J. Plant Biol. 2022, 13(4), 473-484; https://doi.org/10.3390/ijpb13040038
Submission received: 21 September 2022 / Revised: 12 October 2022 / Accepted: 20 October 2022 / Published: 24 October 2022
(This article belongs to the Section Plant Ecology and Biodiversity)

Abstract

:
For the first time, an assessment of phenotypic variability and genetic polymorphism was performed on endemic plants Scutellaria tuvensis Juz. growing in Tuva (five populations; Russia). Based on morphological traits of individuals, principal component analysis clustered the individuals into three groups depending on characteristics of their habitats: group 1 turned out to be sampled from beach gravel, group 2 from a detrital cone, and group 3 from coarse rock fragments; this finding was confirmed by specific features of the development of the individuals in these habitats. Using inter-simple sequence repeat markers, high genetic polymorphism was identified at the population level: the proportion of polymorphic loci was 95%, expected heterozygosity 0.221, the absolute number of alleles 1.533, and the effective number of alleles 1.376. Population 3 (P 3) was the most genetically homogeneous; P 5 was characterized by the highest genetic diversity. In an unweighted pair group method with arithmetic mean dendrogram, the studied populations formed two major groups: the first cluster included P 4 and P 5, and the second cluster contained plants collected in P 1, P 2, and P 3. An analysis of the population structure using the STRUCTURE software showed the same result, dividing the sample under study into two subpopulations. The genetic differentiation index among populations was 0.232, and gene flow 1.655. According to analysis of molecular variance, intrapopulation differences accounted for 73% of total genetic diversity.

1. Introduction

The International Union for Conservation of Nature and Natural Resources (IUCN) has highlighted the importance of genetic factors in the planning and implementation of conservation programs along with the study of species diversity and the diversity of ecological systems [1]. The development of a conservation strategy for rare and/or endemic species requires complete information on the levels of genetic variability and differentiation in populations of studied taxa.
Scutellaria L. is a large polymorphic genus from the family Lamiaceae, section Lupulinaria. Among the species of the section, there are many endemic poorly studied species [2]. One of these is Scutellaria tuvensis Juz., which has a narrow endemic range and occurs in the southeastern part of Tuva (Russia) and the north-western territory of Mongolia [3,4,5]. The development of individuals and demographic structure of populations of this species in the Republic of Tuva have been studied previously [6,7]. Under various habitat conditions, changes in the demographic and spatial structure of populations as well as changes in ecological density and rates of development of individuals have been revealed. Population genetic surveys have never been reported for this endemic species. In general, species of the genus Scutellaria are poorly studied in terms of morphology and population biology, even though many Scutellaria species have found medicinal uses [8,9,10,11]. The development of individuals has been researched mainly in the species growing on the territory of Russia and Central Asia [12,13,14,15,16,17]. We are aware of a few reports on the genetic diversity of this genus [18,19,20,21,22].
In our study, inter-simple sequence repeat (ISSR) markers were employed to assess the genetic diversity in five natural populations of S. tuvensis. ISSR markers have several advantages, e.g., a low required amount of template DNA, a random distribution of the markers throughout a plant genome, acceptable reliability, and high reproducibility of results, and their application does not require any prior information about the target sequences in the genome [23,24]. These properties explain the widespread use of ISSR markers in studies on genetic diversity and for the identification of taxa at various levels [25,26,27,28,29].
This study was aimed at estimating morphological and genetic diversity of S. tuvensis endemic to desert steppes.

2. Materials and Methods

2.1. Plant Materials

Scutellaria tuvensis Juz. (Lamiaceae) has a narrow endemic range (Figure 1). In Tuva (Russia), the species occurs in Central Tuva and Uvs Nuur depressions as well as in the southwestern part of the Sangilen Upland. The presence of the species is associated with dry and desert steppes, common in depressions and the low mountains surrounding them in the southeast. S. tuvensis grows on stony-gravelly soil; the latter is common on pebbles and large-stony taluses. In communities, it acts as an assembler but can dominate and form an aspect.
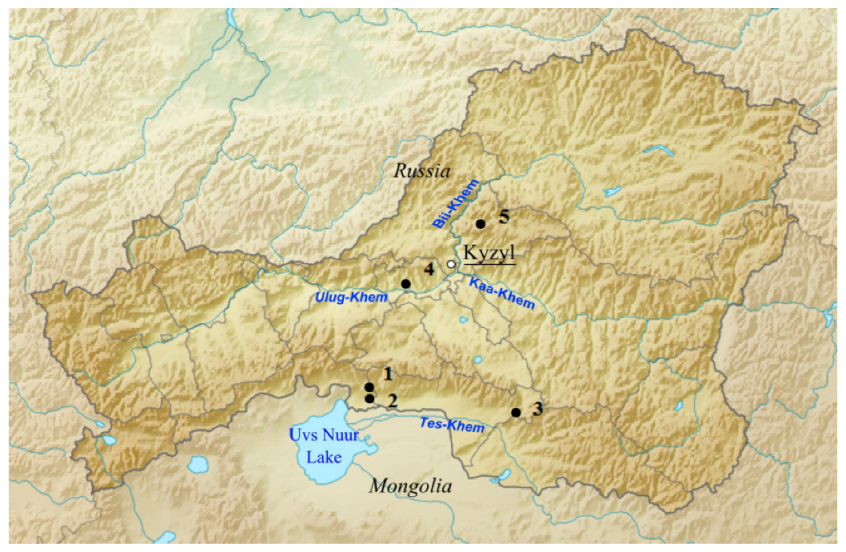
The study material was collected in five habitats in the Republic of Tuva. Populations (P) 1, 2, and 3 are located on the southern slope on the foothills of East Tannu-Ola, in the valleys of the Hoolu and Tes-Khem rivers (Figure 2). Here S. tuvensis occurs in the sub-belt of desert steppes (800–1200 m above sea level) and is part of the desert steppes lying along the gravel trails of East Tannu-Ola; it also occurs in unformed communities on gravel in river valleys.
To be precise, P 1 is situated in the Tes-Khem region, Uvs Nuur depression, on gravel in the valley of the Hoolu river (50°42′9″ N, 093°20′53″ E, altitude 805 m above sea level). The unformed community contains 10 species (Scutellaria tuvensis, Yougia tenuicaulis (Babc. et Stebb.) Czer., Heteropappus altaicus (Willd.) Novopokr., Vincetoxicum sibiricum (L.) Decne., singly meet Cleistogenes squarrosa (Trin.) Keng, Ephedra regeliana Florin.).
P 2 in the Tes-Khem region, Uvs Nuur depression, on gravel in the valley of the Hoolu river (50°42′18″ N, 093°21′46″ E, altitude 878 m above sea level). An unformed community of 13 species (Caragana bungei Ledeb., Asterothamnus polifolius Novopokr., Youngia tenuicaulis, Vincetoxicum sibiricum, Scutellaria tuvensis, Panzerina lanata (L.) Sojak).
P 3 in the Tes-Khem region, 35 km from the Erzin village, the right bank of the Tes-Khem river, detrital cone mountain ranges (50°28′33.7″ N, 094°55′26.7″ E, altitude 1134 m above sea level). Steppe with Stipa and Artemisia (Stipa orientalis Trin., Artemisia frigida Willd., Agropyron cristatum (L.) Beauv., Cymbaria daurica L., Vicia costata Ledeb., Youngia tenuifolia Willd., Allium austrosibiricum N.V. Friesen).
Populations 4 and 5 are located in the northeast of the Central Tuva depression in the steppe belt on flat hills (5°–10°), where desert and dry steppe communities are widespread; on steep slopes (35°–50°) in petrophytic steppes; and on screes. Desert communities with the participation of S. tuvensis are characterized by a thin grass cover amounting to 20–30%.
To be precise, P 4 is situated in the Kyzyl region, 19 km from the village of Eerbek, at the foot of the southwestern slope in the valley of the Ulug-Khem river, with a slope steepness of 30° (51°34′34.8″ N, 094°03′31.5″ E, altitude 607 m above sea level). Desert steppe with Artemisia (Caragana pygmaea (L.) DC. s. str., Caragana bungei, Atraphaxis laetevirens (Ledeb.) Jaub. et Spach, Ephedra monosperma C.A. Mey, Artemisia frigida, Vicia costata, Allium tuvinicum (N.V. Friesen) N.V. Friesen).
P 5 in the Kyzyl region, Bolshoi Terektig-Khem river, the southern slope with outcrops of rocks and large detrital stones, with slope steepness 10° (51°50′12.5″ N, 094°36′32.9″ E, altitude 920 m above sea level). Bushy steppe with Artemisia (Caragana pygmaea, Spiraea hypericifolia L., Artemisia frigida, Atraphaxis pungens (Bieb.) Jaub. et Spach, Stipa orientalis, Elytrigia gmelinii (Trin.) Nevski.).

2.2. Morphological Analysis

We previously described the morphogenesis of S. tuvensis individuals [6]. Based on the biological characteristics of the species (it reproduces only by seed; individuals develop rapidly before flowering; before the first flowering, individuals develop without wizening parts of shoots; and the structure of adults consists of branched skeletal axes), the most informative parameters of morphological traits were selected: the length of the primary shoot, the number of primary-shoot metameres, the length of the primary-shoot remainder after the first flowering, the number of metameres of the primary-shoot remainder, the number of generative shoots, generative-shoot height, the diameter of the bushes, and the number, length, and age of the axes.
Because in individuals of this species, the primary shoot blooms first, measurements of the primary-shoot length and of the number of primary-shoot metameres were performed on individuals flowering for the first year (25 randomly chosen individuals from each population). The rest of the traits were estimated on plants in a mature reproductive state (25 randomly chosen individuals from each population). The mature state was defined according to the concept of discrete ontogeny developed by T.A. Rabotnov and A.A. Uranov [30,31] as well as previously obtained data on the ontogeny of S. tuvensis [6].

2.3. Molecular Analysis

To assess genetic diversity, leaves were collected from 19 plants randomly chosen in each population. The plant material was dried in the dark at room temperature. DNA was extracted with the Diamond DNA Kit (ABT, Russia). The purity (the ratio of optical density at 260 and 280 nm) and the concentration (ng/μL) of the extracted DNA were determined on a BioSpectrometer kinetic spectrophotometer (Eppendorf, Germany). For PCR, the DNA concentration of each sample was adjusted to 10.0 ng/μL. Twenty-two ISSR primers were screened, and 10 most informative ones were selected [32].
The PCR was conducted on a BIS cycler (BIS-N, Russia); a mix for HSTaq DNA polymerase was used. All reagents for the PCR were purchased from Evrogen (Russia). The reaction mixture of 15.0 μL consisted of 8.6 μL of sterile H2O, 1 unit of HSTaq DNA polymerase, 0.4 mM primers, 2.5 mM MgCl2, 1× Taq buffer, 1.0 mM dNTP mixture, and 2.0 μL of a DNA template. As negative controls, we carried out PCRs with all the ingredients except for sterile H2O instead of a DNA template. The amplification program was as follows: initial DNA denaturation for 5 min at 95 °C; next, 40 amplification cycles (denaturation for 1 min at 95 °C, primer annealing for 1 min and elongation for 2 min at 72 °C), followed by final elongation for 10 min at 72 °C. The annealing temperatures, depending on the primer, varied from 49 to 57 °C. To check the reliability of the obtained ISSR spectra, the experiment was conducted at least two times. Amplification products were stained with SYBR-Green (Medigen, Russia) and separated by electrophoresis in a 1.5% agarose gel in 1× TBE buffer. The size of ISSR fragments was estimated by comparison with molecular weight markers (100 bp + DNA Ladder; Evrogen, Moscow, Russia). The ISSR profile was visualized using the GelDoc XR+ (Bio-Rad Laboratories, USA) and analyzed in the Image Lab Software (Bio-Rad Laboratories, Hercules, CA, USA).
The amplicon patterns were scored as either the presence (1) or absence (0) of homologous bands and were then transformed into a binary matrix. Differences in the intensity of bands of amplicons having the same size among the compared DNA samples were disregarded in this analysis.

2.4. Data Analysis

Microsoft Excel was used to calculate the arithmetic mean and error of the mean. Morphological data were log-transformed to improve normality and homoscedasticity. Principal component analysis (PCA) was performed to compare biometric parameters among individuals from different habitats. PAST version 3.16 [33] was utilized for statistical analysis.
The analysis of genetic polymorphism was performed using GenAlEx 6.5 software [34,35] for Microsoft Excel. For each population, the following metrics were computed: the percentage of polymorphic loci, the absolute number of alleles per locus (na), the effective number of alleles per locus (ne), and expected heterozygosity (He). For each primer, the level of polymorphism was determined as the proportion of polymorphic loci among all loci per primer, expressed as a percentage. Polymorphism within each population was defined as the proportion of the polymorphic loci identified in this separate population among all loci. To evaluate interpopulation differentiation, Nei’s genetic distances (D) [36] were calculated, analysis of molecular variance (AMOVA) was performed, and genetic differentiation index among populations (GST) and gene flow (Nm) were determined. These parameters were estimated by means of GenAlEx 6.5 and POPGEN 1.32 [37]. Dice’s coefficient of similarity was calculated based on the binary matrices in PAST 3.16, then PCA was carried out. Clustering was performed in PAST 3.16 by the unweighted pair-group method with arithmetic mean (UPGMA) with bootstrap estimates of the reliability degree of the branching order (1000 replications), and a dendrogram reflecting the degree of similarity based on the obtained ISSR profile was constructed. The significance of the correlation between Nei’s genetic distances and geographic distances (in kilometers) was evaluated by Mantel’s test [38] with 999 random permutations using GenAlEx 6.5.
To identify the population structure of genotypes by ISSR marker data was used STRUCTURE version 2.3.4 [39]. To select the optimal levels of K, for each K was first performed the 10,000 iterations followed by 100,000 Markov chain Monte Carlo (MCMC) repetitions based on the admixture model from K = 2 to K = 10 with 10 repetitions. Then, the best K were detected by using STRUCTURE HARVESTER [40] based on ΔK method of Evanno et al. [41].

3. Results and Discussion

3.1. Morphological Diversity

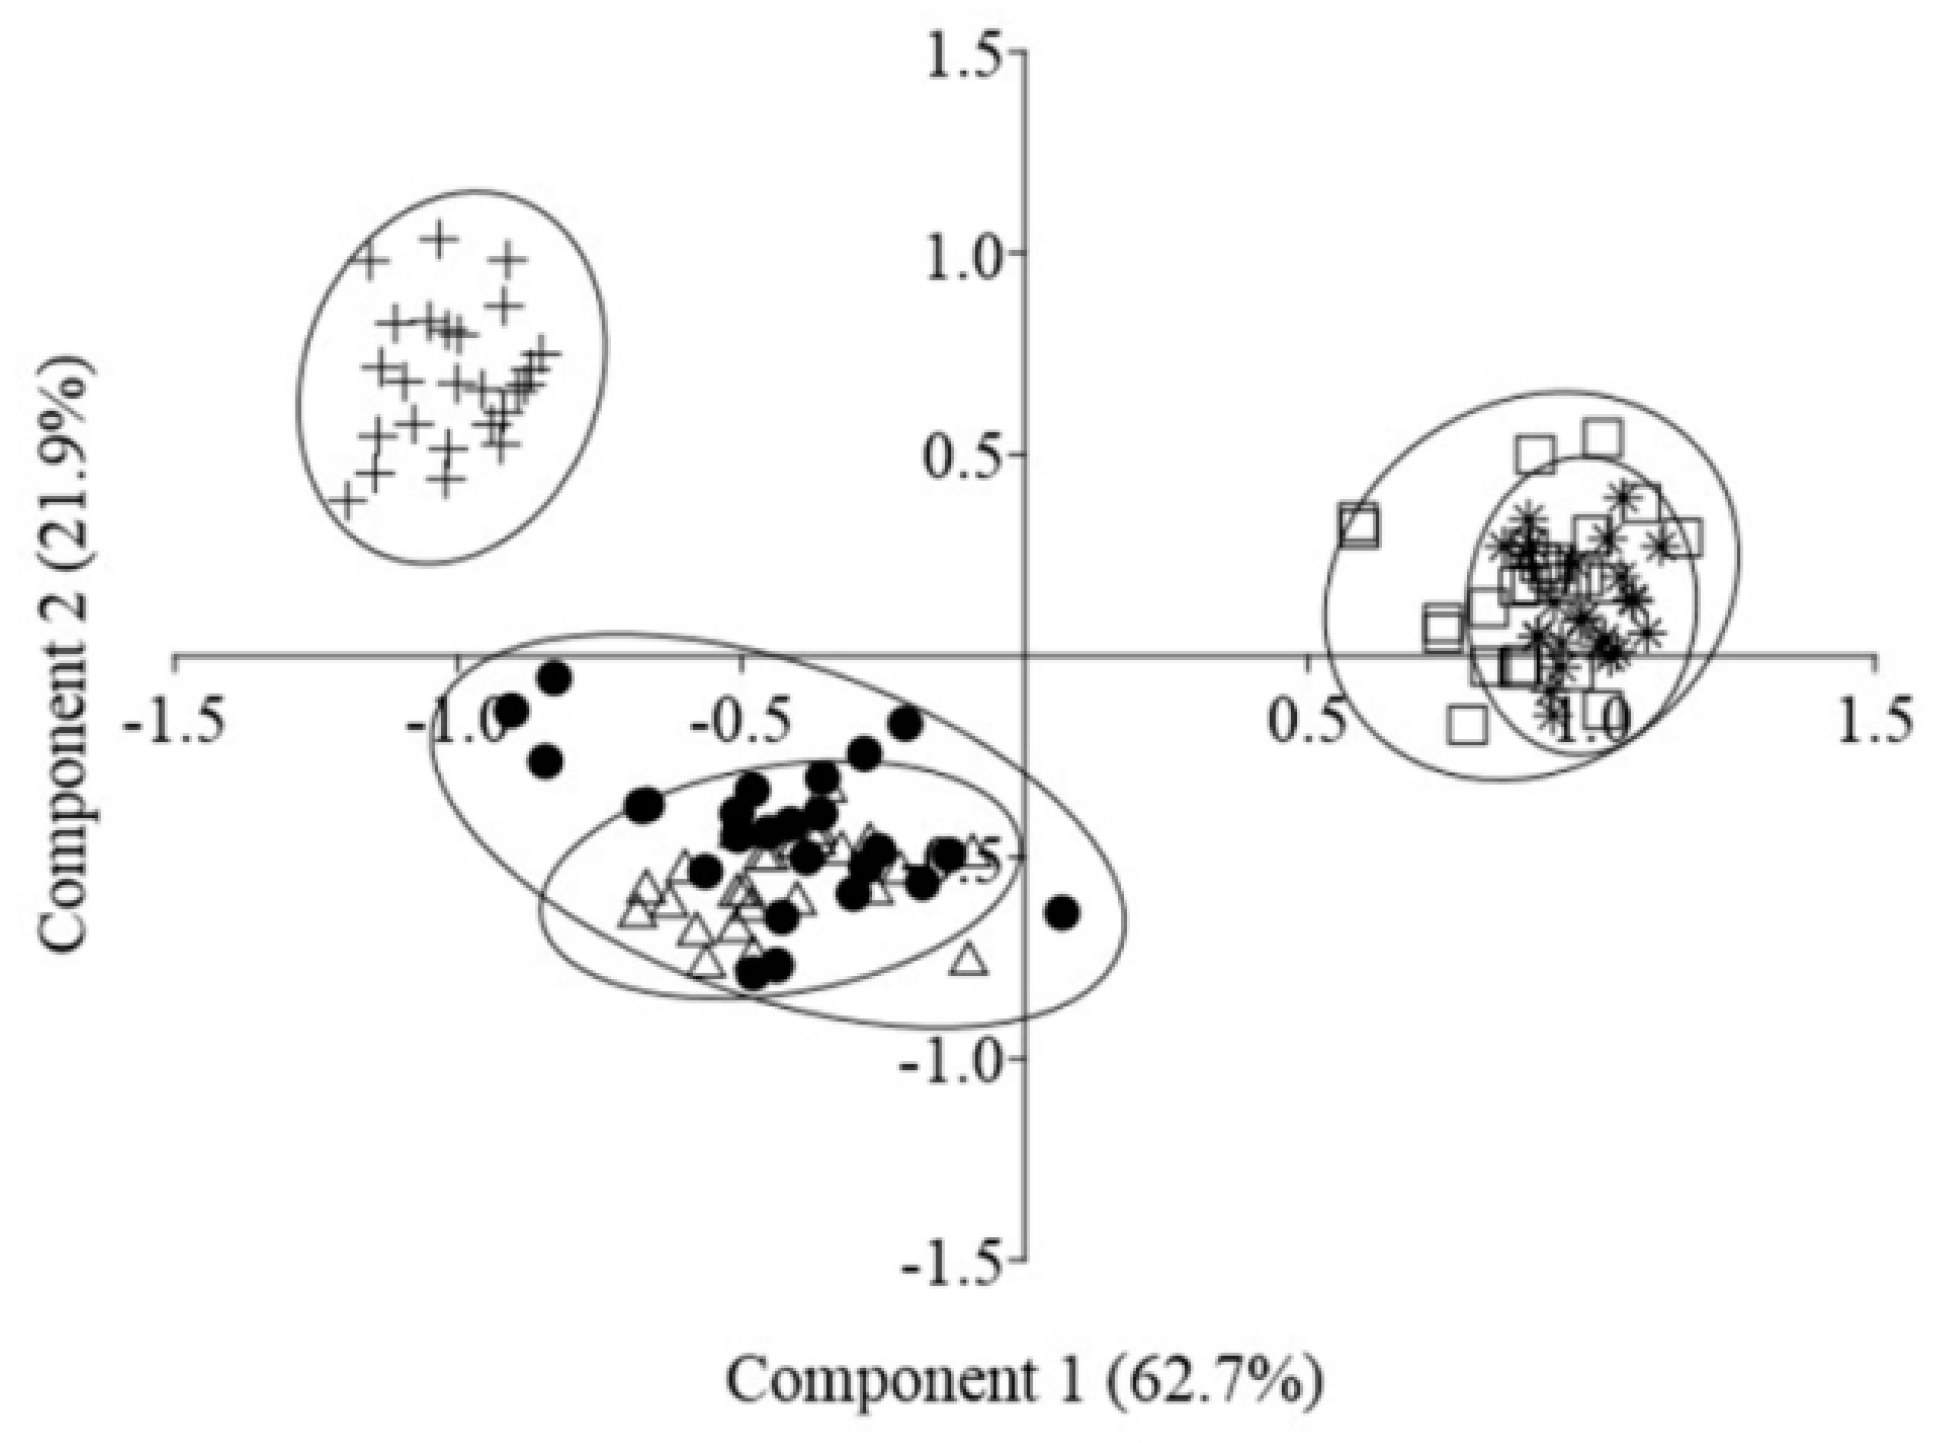
In a heterogeneous habitat, in the course of morphogenesis, there are changes in the development of individual shoots, shoot systems, and individuals in general, and new morphological structures form. We studied 10 morphological traits of S. tuvensis individuals in the five populations (Table 1). In the principal-component plot built by means of the morphological parameters of individuals, the specimens formed three groups: the first group includes individuals from P 1 and P 2, the second from P 3, and the third group from P 4 and P 5 (Figure 3). The PCA revealed that the first two principal components explained 84.6% of total variance. The first principal component (62.7%) corresponds to the long-surviving part of the primary shoot. Along the second principal component (21.9%), there were changes in the length of the primary shoot before the dying off and in the length of the axes of adult plants. The identified groups matched the types of habitat: group 1 proved to be sampled from beach gravel, group 2 from a detrital cone, and group 3 from steep slopes with coarse rock fragments.
The clustering of individuals into three groups revealed by PCA depending on characteristics of a habitat can be explained by specific features of the development of individuals. Under dissimilar conditions, development differed already at initial stages: the length of the primary shoot strongly depended on the substrate: this length increased due to the length of the internode; the number of metameres varied only slightly (7.9–12.1). On coarse rock fragments, the shoot length reached 11.3 cm, whereas on beach gravel, 1.9 cm. In all habitats, the primary shoot was the first to bloom, and the length of its remaining part after flowering depended on the habitat (Table 1). In the plants growing on beach gravel (P 1 and P 2), its length reached 1.1–1.4 cm (the average number of metameres was 5.9–8.5). In the plants growing on steep slopes (P 4 and P 5) with coarse rock fragments, 8.6 to 9.5 cm of a shoot consisting of 7.3–10.2 metameres was found to be preserved. In the plants growing on the detrital cone (P 3), the shoot dies off almost completely (0.2 cm), only the node with buds in the axils of the cotyledon leaves gets preserved.
The structure of adults was found to consist of a system of lignified branched composite skeletal axes. The number of branches and the degree of branching of the axes of an individual depended on the habitat. In the plants growing on the detrital cone (P 3), only two composite skeletal axes develop in the bush, they are highly branched and, due to the immobility of the substrate, persist until the end of the individual’s life. They slowly begin to die off from the apical end only at the end of ontogenesis.
In the plants growing on steep slopes (P 4 and P 5) covered with large stones, skeletal axes of varied thickness, differing in the degree of branching, develop within the bush. The closer the skeletal axis to the base of the bush, the more branched it is and the longer it persists in the bush. The degree of branching and lifespan decrease with the increasing distance between the bush base and the site of formation of the skeletal axis.
In the plants growing on beach gravel (P 1 and P 2), 35 composite skeletal axes can simultaneously originate from the center of the bush, they have the same thickness, and their lifespan is no more than 2–3 years. They completely die off leaving a short basal part. Due to the short lifespan of the composite skeletal axes in the bush, they change often. A large number of short metameres in the basal part of the forming shoots and the branching of the buds provide a reserve of buds necessary for the constant renewal of the bush structure.
Therefore, the morphological diversity of S. tuvensis individuals ensures the heterogeneity of populations, which increases their resistance to various ecological and phytocenotic conditions.

3.2. Evaluation of Intrapopulation Polymorphism

The genetic diversity of the endemic species S. tuvensis growing in Tuva was analyzed using multilocus dominant ISSR markers. In the studied populations, 141 genetic loci were identified, with 95% of them being polymorphic. The polymorphism in the total study population ranged from 86% to 100% depending on the primer. The proportion of polymorphic loci turned out to be the highest in P 5 (90%) and the lowest in P 3 (70%). Depending on the primer, five (UBC 840) to 18 (UBC 826) DNA fragments were amplified, and their size varied from 250 to 2000 bp (Table 2). On average, one primer amplified 14 DNA fragments.
At the population level, expected heterozygosity was 0.221, the absolute number of alleles 1.533, and the effective number of alleles 1.376. The most genetically homogeneous of all the analyzed populations was P 3 (HE = 0.189, na = 1.461, ne = 1.321; Table 3). P 5, which is the most isolated from the other studied populations, featured the highest values of intrapopulation genetic diversity (HE = 0.266, na = 1.638, and ne = 1.459).
The observed level of polymorphism in the total study population of S. tuvensis (95%) is comparable to the polymorphism of other endemic and rare species: Oxytropis chankaensis Jurtz. (72.9%) [42], Hedysarum chaiyrakanicum Kurbatsky (98%) [26] and Parrotia subaequalis (Hung T. Chang) R.M. Hao & H.T. Wei (68.52%) [25]. Our results contradict the claim of Hamrick and Godt [43] about reduced genetic polymorphism of populations in species with a limited geographic range. According to Artyukova et al. [42], the size of a population’s geographic range has less influence on genetic diversity of individuals than the species’ reproductive strategy does. Perennial cross-pollinated plants, characterized by an early generative state and long reproductive period, exhibit great genetic variability regardless of geographic-range size [44,45]. Consequently, the high polymorphism of the populations in question (Table 2) points to considerable genetic diversity of this species owing to cross-pollination and entomophily.

3.3. Quantitation of Interpopulation Differences

Next, Nei’s genetic distances were estimated (Table 4) among the five populations: the lowest genetic distance was found between P 1 and P 3 (D = 0.049), and the highest between P 3 and P 5 (D = 0.173). The genetic distance between P 3 and P 5 was consistent with the longest geographic distance between them (155 km). The positioning of P 3 plants is noteworthy; geographically, this population is equidistant from P 1 and P 2 (~116 km), but the divergence between them is insignificant (Table 4). P 5, which is the most geographically isolated from the other studied populations (separated by a mountain ridge and two large rivers), is the most dissimilar to all the other populations (genetic distance ranging from 0.102 to 0.173).
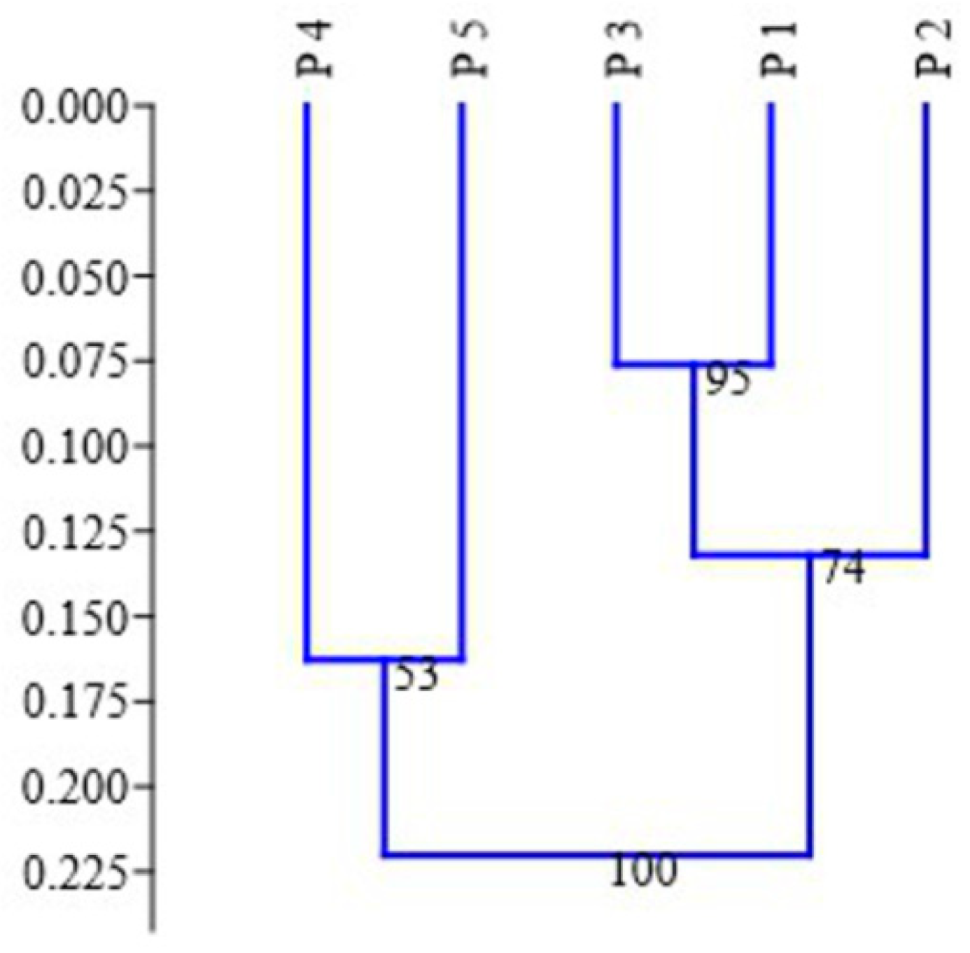
In the dendrogram constructed by the UPGMA, the studied populations formed two major groups with strong bootstrap support: the first cluster included P 5 and individuals from P 4, whereas the second cluster was composed of two subclusters: individuals collected in P 2 and individuals from P 1 and P 3 (Figure 4). This distribution of individual samples was consistent with the geographical location of the studied populations. At the same time, geographical proximity of P 1 and P 2 (2 km) was accompanied by a low genetic distance, D = 0.071; however, the UPGMA clustering, which shows genetic relations among populations, revealed certain isolation of these populations from one another.
In the PCA plot, individuals from P 1, P 2, and P 3 clustered into one group in agreement with the UPGMA dendrogram based on Nei’s genetic distances (Figure 5). A more isolated group was formed by plants from P 5. Nevertheless, the boundaries between the groups were indistinct. The first two principal components accounted for 45.6% (Axis 1) and 12.1% (Axis 2) of the total variance among the populations, respectively.
Further analysis of the five populations showed that the expected proportion of gene diversity within the populations (HS) was 0.220, and expected total gene diversity (HT) 0.286. The genetic differentiation index among the populations (GST) was 0.232. Based on GST, the estimated number of migrants per generation (Nm) was 1.655.
The AMOVA revealed that 27% of total variance was attributable to differences among the five populations, and 73% was contributed by differences within the populations.
The studied populations of S. tuvensis are characterized by moderate differentiation among themselves (GST = 0.232); it was also revealed that interpopulation variability accounts for no more than 27% of total variance (AMOVA). Genetic differentiation among populations of other species that are rare and/or endemic is comparable with our data and in some cases even lower. For instance, for Centaurea wiedemanniana Fisch. & C.A.Mey., which is endemic to Turkey, genetic differentiation among populations is 0.223 [46], for Fritillaria tubiformis subsp. moggridgei Rix., which is a rare alpine geophyte, GST = 0.135, and for F. tubiformis var. burnatii, GST = 0.117 [47]. For the endangered species Thuja sutchuenensis Franch., endemic to the North-East China, GST is reported to be 0.102 [48]. At the same time, the high GST values documented for a number of species are naturally accompanied by low polymorphism and gene flow between populations [20,49].
The results of the Mantel test after 9999 permutations confirmed that there was a significant correlation (r = 0.616, p = 0.04) between Nei’s genetic distances and geographical distances among the five populations. This result suggested that the differentiation observed among the populations directly matched the geographic distances.
Population structure was analyzed for 95 genotypes according to ISSR data and evaluated with STRUCTURE HARVESTER software. According to Evanno’s method, the maximum peak of ΔK was observed at K = 2. This result indicates that two subpopulations were formed in Tuva (Figure 6).
After examination of the data from the UPGMA clustering, PCA and as well as the Bayesian statistical method using STRUCTURE software it can be concluded that the studied populations can be subdivided into two groups supporting each other; a relation between the molecular grouping of the populations and their geographical positioning is notable and confirmed by the Mantel test (r = 0.616, p = 0.04). An interesting finding is the clustering of populations 1, 2, and 3 into one group despite the substantial geographical distance to P 3 (Table 4; Figure 4 and Figure 5). A likely reason is gene flow between these populations because these populations are located on the southern slope on the foothills of East Tannu-Ola; this arrangement facilitates connectivity via pollination and seed dispersion. Accordingly, gene flow was found to be 1.655, which exceeds the critical value (Nm = 1.0) and suggests that the gene flow among the studied populations is strong enough to prevent population differentiation through genetic drift [50]. This conclusion can explain the relatively low GST.

4. Conclusions

Our results provide new information on current genetic and morphological diversity in five natural populations of S. tuvensis in Tuva. The observed morphological diversity of this species ensures its stability in phytocenoses and helps to maintain a large population size, even under constantly changing living conditions. These properties of the species lead to a wide variety of combinations of free crosses and genetic heterogeneity, which represents a significant reserve of hereditary variation. The chosen ISSR markers enabled us to discriminate polymorphism patterns among individuals belonging to different populations and to distinguish intra- and interpopulation diversity of S. tuvensis. The data suggest that the studied individuals of S. tuvensis are divided into two subpopulations, which is determined by the geographical location of the studied individuals. The high polymorphism of morphological traits and genetic markers increases the plasticity of the species as a whole, thereby allowing it to adapt to constantly changing environmental conditions and to occupy a stable niche under various ecological and phytocenotic conditions.
When researchers develop in situ conservation strategies, first of all, it is necessary to reduce the anthropogenic impact on the studied populations. Concerning ex situ conservation of the species in question, one of possible approaches is the creation of an in vitro collection. Currently, the selection of the most representative individuals for inclusion in the in vitro collection is underway. Considering the observed high genetic polymorphism within the populations, programs for the protection of the genetic diversity of endemic S. tuvensis ex situ and thus in vitro should focus on the most heterogeneous populations (e.g., P 5) as well as on populations with low diversity, such as more vulnerable P 3.
The next stage of this research is to assess the genetic structure of S. tuvensis populations in Mongolia for designing effective protective measures for this endemic taxon.

Author Contributions

Conceptualization, A.G. and D.M.; methodology, A.G., D.M. and V.C.; data acquisition and analysis, A.G., D.M. and V.C.; validation, V.C.; formal analysis, A.G. and D.M.; writing—original draft preparation, A.G. and D.M.; writing—review and editing, A.G., D.M. and V.C. All authors have read and agreed to the published version of the manuscript.

Funding

This work was done within the framework of a state assignment of the Central Siberian Botanical Garden (the Siberian Branch of the Russian Academy of Sciences) No. AAAA-A21-121011290026-9 and AAAA-A21-121011290025-2.

Institutional Review Board Statement

Not applicable.

Informed Consent Statement

Not applicable.

Data Availability Statement

Not applicable.

Acknowledgments

The authors are grateful to O.V. Dorogina (Central Siberian Botanical Garden, the Laboratory of the Introduction of Rare and Endangered Plants) for the opportunity to conduct the molecular analysis.

Conflicts of Interest

The authors have no conflict of interest to declare.

References

  1. Frankel, O.H. Genetic Conservation: Our Evolutionary Responsibility. Genetics 1974, 78, 53–65. [Google Scholar] [CrossRef] [PubMed]
  2. Paton, A.J. The phytogeography of Scutellaria L. Notes R. Bot. Gard. 1990, 46, 345–359. [Google Scholar]
  3. Yuzepchuk, S.V. Genus Scutellaria L. In Flora SSSR; Komarov, V.L., Ed.; AN SSSR: Saint Petersburg, Russia, 1954; Volume 20, pp. 183–184. (In Russian) [Google Scholar]
  4. Kamelin, R.V.; Gubanov, I.A. Scutellaria grandiflora Sims S. L. in Mongolia. Byull. MOIP. Otd. Biol. 1989, 94, 109–111. (In Russian) [Google Scholar]
  5. Zuev, V.V. Scutellaria L. Flora of Siberia; Malyshev, L.I., Ed.; Nauka: Novosibirsk, Russia, 1997; Volume 11, pp. 161–165. (In Russian) [Google Scholar]
  6. Guseva, A.A.; Cheryomushkina, V.A. Morphogenesis and state of coenopopulations of the endemic species Scutellaria tuvensis (Lamiaceae). Byull. MOIP. Otd. Biol. 2017, 122, 68–77. (In Russian) [Google Scholar]
  7. Guseva, A.; Cheryomushkina, V. Polyvariation of the development Scutellaria L. species and the structure of their populations in Siberia. BIO Web Conf. 2019, 16, 00010. [Google Scholar] [CrossRef] [Green Version]
  8. Awad, R.; Arnason, J.; Trudeau, V.; Bergeron, C.; Budzinski, J.; Foster, B.; Merali, Z. Phytochemical and biological analysis of Skullcap (Scutellaria lateriflora L.): A medicinal plant with anxiolytic properties. Phytomedicine 2003, 10, 640–649. [Google Scholar] [CrossRef]
  9. Sonoda, M.; Nishiyama, T.; Matsukawa, Y.; Moriyasu, M. Cytotoxic activities of flavonoids from two Scutellaria plants in Chinese medicine. J. Ethnopharmacol. 2004, 91, 65–68. [Google Scholar] [CrossRef]
  10. Bardakci, H.; Skaltsa, H.; Milosevic-Ifantis, T.; Lazari, D.; Hadjipavlou-Litina, D.; Yeşilada, E.; Kırmızıbekmez, H. Antioxidant activities of several Scutellaria taxa and bioactive phytoconstituents from Scutellaria hastifolia L. Ind. Crops Prod. 2015, 77, 196–203. [Google Scholar] [CrossRef]
  11. Han, Q.-T.; Ren, Y.; Li, G.-S.; Xiang, K.-L.; Dai, S.-J. Flavonoid alkaloids from Scutellaria moniliorrhiza with anti-inflammatory activities and inhibitory activities against aldose reductase. Phytochemistry 2018, 152, 91–96. [Google Scholar] [CrossRef]
  12. Nukhimovskiy, E.L. Osnovy Biomorfologii Semennykh Rasteniy; Overlay: Moscow, Russia, 2002; Volume 2, p. 458. (In Russian) [Google Scholar]
  13. Nedosekina, T.V.; Agafonov, V.A. Morphogenesis and age stages of Scutellaria supina L. (Lamiaceae) in the conditions of middle-russia upland. Byull. MOIP. Otd. Biol. 2006, 111, 89–94. (In Russian) [Google Scholar]
  14. Cheryomushkina, V.A.; Guseva, A.A. Life forms of Scutellaria supina L. (Lamiaceae). Contemp. Probl. Ecol. 2015, 8, 624–635. [Google Scholar] [CrossRef]
  15. Cheryomushkina, V.A.; Guseva, A.A. Morhogenesis of Scutellaria grandiflora (Lamiaceae) and ontogenetic structure of its coenopopulations. Rastit. Resur. 2017, 53, 380–393. (In Russian) [Google Scholar]
  16. Guseva, A.A.; Cheryomushkina, V.A. Special development and condition of the Scutellaria sieversii (Lamiaceae) coenopopulations in Chu-Ilyisk mountains (Medium Asia). Plant Life Asian Russ. 2019, 3, 47–52. (In Russian) [Google Scholar]
  17. Cheryomushkina, V.A.; Astashenkov, A.Y. Scutellaria oreophila (Lamiaceae): Life form, shoot formation, ontogenesis. Bot. Zhurnal 2021, 106, 229–238. (In Russian) [Google Scholar]
  18. Olmstead, R. Phylogeny, Phenotypic Evolution, and Biogeography of the Scutellaria angustifolia Complex (Lamiaceae): Inference from Morphological and Molecular Data. Syst. Bot. 1989, 14, 320. [Google Scholar] [CrossRef]
  19. Olmstead, R.G. Biological and Historical Factors Influencing Genetic Diversity in the Scutellaria angustifolia complex (labiatae). Evolution 1990, 44, 54–70. [Google Scholar] [CrossRef] [Green Version]
  20. Yuan, Q.-J.; Zhang, Z.-Y.; Hu, J.; Guo, L.-P.; Shao, A.-J.; Huang, L.-Q. Impacts of recent cultivation on genetic diversity pattern of a medicinal plant, Scutellaria baicalensis (Lamiaceae). BMC Genet. 2010, 11, 29. [Google Scholar] [CrossRef]
  21. Chiang, Y.-C.; Huang, B.-H.; Liao, P.-C. Diversification, Biogeographic Pattern, and Demographic History of Taiwanese Scutellaria Species Inferred from Nuclear and Chloroplast DNA. PLoS ONE 2012, 7, e50844. [Google Scholar] [CrossRef] [Green Version]
  22. Bai, C.; Wen, M.; Zhang, L.; Li, G. Genetic diversity and sampling strategy of Scutellaria baicalensis germplasm resources based on ISSR. Genet. Resour. Crop Evol. 2013, 60, 1673–1685. [Google Scholar] [CrossRef]
  23. Zietkiewicz, E.; Rafalski, A.; Labuda, D. Genome Fingerprinting by Simple Sequence Repeat (SSR)-Anchored Polymerase Chain Reaction Amplification. Genomics 1994, 20, 176–183. [Google Scholar] [CrossRef]
  24. Nagaoka, T.; Ogihara, Y. Applicability of inter-simple sequence repeat polymorphisms in wheat for use as DNA markers in comparison to RFLP and RAPD markers. Theor. Appl. Genet. 1997, 94, 597–602. [Google Scholar] [CrossRef]
  25. Geng, L.; Xu, J.; Ye, L.; Zhou, W.; Zhou, K. Connections with Nature and Environmental Behaviors. PLoS ONE 2015, 10, e0127247. [Google Scholar] [CrossRef] [PubMed]
  26. Zvyagina, N.S.; Dorogina, O.V.; A Krasnikov, A. Genetic differentiation and karyotype variation in Hedysarum chaiyrakanicum, an endemic species of Tuva Republic, Russia. Indian J. Exp. Biol. 2016, 54, 338–344. [Google Scholar] [PubMed]
  27. Bozchaloyi, S.E.; Sheidai, M. Molecular diversity and genetic relationships among Geranium pusillum and G. pyrenaicum with inter simple sequence repeat (ISSR) regions. Caryologia 2018, 71, 457–470. [Google Scholar] [CrossRef]
  28. dos Santos, J.O.; Mayo, S.J.; Bittencourt, C.B.; de Andrade, I.M. Genetic diversity in wild populations of the restinga ecotype of the cashew (Anacardium occidentale) in coastal Piauí, Brazil. Oesterreichische Bot. Z. 2019, 305, 913–924. [Google Scholar] [CrossRef] [Green Version]
  29. Valuyskikh, O.E.; Shadrin, D.M. Population and molecular datasets for Gymnadenia conopsea (Orchidaceae). Data Brief 2019, 25, 104161. [Google Scholar] [CrossRef]
  30. Gatsuk, L.E.; Smirnova, O.V.; Vorontzova, L.I.; Zhukova, L.B.Z.A. Age States of Plants of Various Growth Forms: A Review. J. Ecol. 1980, 68, 675. [Google Scholar] [CrossRef]
  31. Smirnova, O.V.; Palenova, M.M.; Komarov, A.S. Ontogeny of Different Life Forms of Plants and Specific Features of Age and Spatial Structure of Their Populations. Russ. J. Dev. Biol. 2002, 33, 1–10. [Google Scholar] [CrossRef]
  32. Muraseva, D.S.; Guseva, A.A. ISSR primer screening for analysis of genetic diversity among Scutellaria tuvensis (Lamiaceae) populations. BIO Web Conf. 2021, 38, 00082. [Google Scholar] [CrossRef]
  33. Hammer, Ø.; Harper, D.A.T.; Ryan, P.D. Past: Paleontological statistics software package for education and data analysis. Palaeontol. Electron. 2001, 4, 9. [Google Scholar]
  34. Peakall, R.O.D.; Smouse, P.E. GENAlEX 6: Genetic analysis in Excel. Population genetic software for teaching and research. Mol. Ecol. Notes 2006, 6, 288–295. [Google Scholar] [CrossRef]
  35. Peakall, R.; Smouse, P.E. GenAlEx 6.5: Genetic analysis in Excel. Population genetic software for teaching and research—An update. Bioinformatics 2012, 28, 2537–2539. [Google Scholar] [CrossRef] [Green Version]
  36. Nei, M. Genetic Distance between Populations. Am. Nat. 1972, 106, 283–292. [Google Scholar] [CrossRef]
  37. Yeh, F.; Yang, R.; Boyle, T. Popgene Version 1.32 Microsoft Windows-Based Freeware for Populations Genetic Analysis; University of Alberta: Edmonton, AB, Canada, 1999. [Google Scholar]
  38. Mantel, N. The detection of disease clustering and a generalized regression approach. Cancer Res. 1967, 27, 209–220. [Google Scholar]
  39. Pritchard, J.K.; Stephens, M.; Donnelly, P. Inference of population structure using multilocus genotype data. Genetics 2000, 155, 945–959. [Google Scholar] [CrossRef] [PubMed]
  40. Earl, D.A.; vonHoldt, B.M. Structure Harvester: A website and program for visualizing structure output and implementing the Evanno method. Conserv. Genet. Resour. 2012, 4, 359–361. [Google Scholar] [CrossRef]
  41. Evanno, G.; Regnaut, S.; Goudet, J. Detecting the number of clusters of individuals using the software structure: A simulation study. Mol. Ecol. 2005, 14, 2611–2620. [Google Scholar] [CrossRef] [Green Version]
  42. Artyukova, E.V.; Kholina, A.B.; Kozyrenko, M.M.; Zhuravlev, Y.N. Analysis of Genetic Variation in Rare Endemic Species Oxytropis chankaensis Jurtz. (Fabaceae) Using RAPD Markers. Russ. J. Genet. 2004, 40, 710–716. [Google Scholar] [CrossRef]
  43. Hamrick, J.L.; Godt, M.J. Allozyme diversity in plant species. In Plant Population Genetics, Breeding and Germplasm Resources; Brown, A.H.D., Clegg, M.T., Kahler, A.L., Weir, B.S., Eds.; Sinauer: Sunderland, MA, USA, 1989; pp. 43–63. [Google Scholar]
  44. Boronnikova, S.V.; Kokaeva, Z.G.; Gostimsky, S.A.; Dribnokhodova, O.P.; Tikhomirova, N.N. Analysis of DNA polymorphism in a relict Uralian species, large-flowered foxglove (Digitalis grandiflora mill.), using RAPD and ISSR markers. Russ. J. Genet. 2007, 43, 530–535. [Google Scholar] [CrossRef]
  45. Selyutina, I.Y.; Konichenko, E.S.; Dorogina, O.V. Variability and interpopulation differentiation of the rare species Gueldenstaedtia monophylla Fisch. (Fabaceae). Vavilovskii Zhurnal Genet. Sel. 2017, 21, 354–359. [Google Scholar] [CrossRef] [Green Version]
  46. Sözen, E.; Ozaydın, B. A study of genetic variation in endemic plant Centaurea wiedemanniana by using RAPD markers. Ekoloji 2010, 19, 1–8. [Google Scholar] [CrossRef]
  47. Mucciarelli, M.; Ferrazzini, D.; Belletti, P. Genetic Variability and Population Divergence in the Rare Fritillaria tubiformis subsp. moggridgei Rix (Liliaceae) as Revealed by RAPD Analysis. PLoS ONE 2014, 9, e101967. [Google Scholar] [CrossRef] [PubMed] [Green Version]
  48. Liu, J.; Shi, S.; Chang, E.; Yang, W.; Jiang, Z. Genetic Diversity of the Critically Endangered Thuja sutchuenensis Revealed by ISSR Markers and the Implications for Conservation. Int. J. Mol. Sci. 2013, 14, 14860–14871. [Google Scholar] [CrossRef] [PubMed] [Green Version]
  49. Gholami, S.; Vafaee, Y.; Nazari, F.; Ghorbani, A. Molecular characterization of endangered Iranian terrestrial orchids using ISSR markers and association with floral and tuber-related phenotypic traits. Physiol. Mol. Biol. Plants 2021, 27, 53–68. [Google Scholar] [CrossRef] [PubMed]
  50. Slatkin, M. Gene Flow and the Geographic Structure of Natural Populations. Science 1987, 236, 787–792. [Google Scholar] [CrossRef] [PubMed]
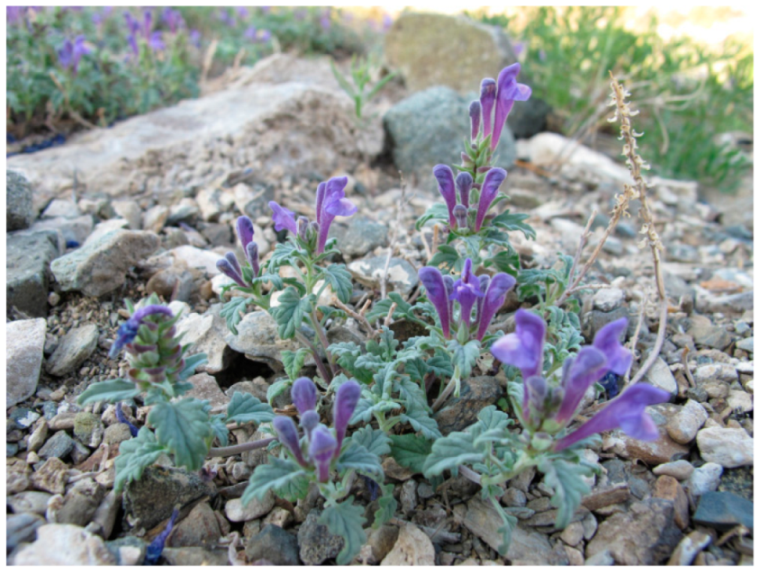
Figure 1. Scutellaria tuvensis in the steppes of the Republic of Tuva.
Ijpb 13 00038 g001
Figure 2. Specimen collection sites along with the geographic distribution of Scutellaria tuvensis in the Republic of Tuva. 1–5: The studied populations.
Ijpb 13 00038 g002
Figure 3. The two-dimensional PCA plot for morphological traits of the five populations of Scutellaria tuvensis: ● P 1, Δ P 2, + P 3, □ P 4, and ∗ P 5.
Ijpb 13 00038 g003
Figure 4. The UPGMA dendrogram of the genetic relations among the plants from the five populations of Scutellaria tuvensis (P 1–5). The numbers indicate clustering robustness (bootstrap index).
Ijpb 13 00038 g004
Figure 5. PCA using Dice’s coefficient of similarity derived from the ISSR data on 95 individuals of Scutellaria tuvensis: ● P 1, Δ P 2, + P 3, □ P 4, and ∗ P 5.
Ijpb 13 00038 g005
Figure 6. Population structure of Scutellaria tuvensis genotypes analyzed by using Bayesian clustering approach by STRUCTURE software.
Ijpb 13 00038 g006
Table 1. Morphological traits of Scutellaria tuvensis individuals in different habitats.
Morphological TraitHabitat
Beach GravelDetrital ConeSteep Slopes with Coarse Rock Fragments
P 1P 2P 3P 4P 5
Primary-shoot length, cm1.9 ± 0.11.6 ± 0.15.1 ± 0.311.3 ± 0.410.9 ± 0.3
Number of primary-shoot metameres10.4 ± 0.39.6 ± 0.37.9 ± 0.29.5 ± 0.312.1 ± 0.5
Length of primary-shoot remainder, cm1.4 ± 0.11.1 ± 0.10.2 ± 0.018.6 ± 0.59.5 ± 0.3
Number of metameres of primary-shoot remainder5.9 ± 0.48.5 ± 0.21.4 ± 0.17.3 ± 0.310.2 ± 0.6
Number of generative shoots12.9 ± 0.613 ± 0.522.7 ± 2.056.2 ± 5.242.1 ± 3.8
Length of generative shoots, cm6.5 ± 0.46 ± 0.26.9 ± 0.36.9 ± 0.611.1 ± 0.3
Number of axes3.3 ± 0.54.1 ± 0.31.8 ± 0.16.7 ± 0.65.2 ± 0.4
Length of axis, cm2.0 ± 0.22.0 ± 0.15.1 ± 0.58.2 ± 0.810.5 ± 0.5
Age of axis, y3.3 ± 0.13.5 ± 0.18.4 ± 0.45 ± 0.34.1 ± 0.2
Bush diameter, cm17.4 ± 0.918.4 ± 0.813.3 ± 1.122.6 ± 1.418.4 ± 0.9
Table 2. Genetic variation detected by the ISSR primers used for the analysis of the five Scutellaria tuvensis populations.
PrimerSequence
(5′→3′)
Band Size, bpNumber of Loci in Population
P 1P 2P 3P 4P 5Total Study Population
1 *2 **1212121212
UBC 811(GA)8C450–16501191313119141314131616 (100)
UBC 825(AC)8T300–130017141411151115131191716 (94)
UBC 826(AC)8C470–2000171417161816171617142019 (95)
UBC 830(TG)8G250–16001110119117111015141615 (94)
UBC 834(AG)8Y*T300–1400139139127131115151515 (100)
UBC 836(AG)8YA300–1200647563767476 (86)
UBC 840(GA)8YT300–900536463636566 (100)
UBC 855(AC)8YT400–1500138139151112715101513 (87)
UBC 856(AC)8YA450–170014813111391391261413 (93)
UBC 857(AC)8YG350–16501410129149141313131515 (100)
Total12190 (74)11996 (81)12185 (70)121102 (84)125112 (90)141134 (95)
* Total number ** Polymorphic. Y = C or T. Percentages of polymorphic loci are shown in parentheses.
Table 3. Genetic diversity detected by the ISSR analysis within the populations of Scutellaria tuvensis.
PopulationHEnane
P 10.2021.4681.342
P 20.2131.5181.354
P 30.1891.4611.321
P 40.2361.5821.407
P 50.2661.6381.459
Notes: HE: expected heterozygosity, na: the absolute number of alleles, ne: the effective number of alleles.
Table 4. Genetic and geographic distances among the populations of Scutellaria tuvensis according to the ISSR analysis.
PopulationP 1P 2P 3P 4P 5
P 1 2115110154
P 20.071 117110154
P 30.0490.098 137153
P 40.1150.0990.128 48
P 50.1630.1360.1730.102
Notes: geographic distances (in kilometers) are above the diagonal, and Nei’s genetic distances (D) are below the diagonal.
Publisher’s Note: MDPI stays neutral with regard to jurisdictional claims in published maps and institutional affiliations.