Article

Transcriptomic Analysis of the CM-334/P. capsici/N. aberrans Pathosystem to Identify Components in Plant Resistance and Resistance-Breaking Responses

by
Olivia Nabor-Romero
1,
Reyna Isabel Rojas-Martínez
1,
Emma Zavaleta-Mejía
1,
Julio Vega-Arreguin
2,
Daniel Ochoa-Martínez
1,
Alejandro Sánchez-Flores
3 and
Mariana Romo-Castillo
4,*
1
Posgrado en Fitosanidad-Fitopatología, Colegio de Postgraduados, Texcoco CP 56230, Estado de Mexico, Mexico
2
Ciencias Agrogenómicas, Escuela Nacional de Estudios Superiores, UNAM, Leoín CP 37684, Guanajuato, Mexico
3
Unidad Universitaria de Secuenciación Masiva y Bioinformática, Instituto de Biotecnología, UNAM, Cuernavaca CP 62210, Morelos, Mexico
4
Cátedras de Consejo Nacional de Ciencia y Tecnología (CONACYT), Posgrado en Fitosanidad-Fitopatología, Colegio de Postgraduados, Texcoco CP 56230, Estado de Mexico, Mexico
*
Author to whom correspondence should be addressed.
Int. J. Plant Biol. 2022, 13(2), 151-162; https://doi.org/10.3390/ijpb13020015
Submission received: 12 April 2022 / Revised: 18 May 2022 / Accepted: 23 May 2022 / Published: 10 June 2022

Abstract

:
Phytophthora capsici is an important pathogen worldwide because its spread affects pepper production globally. The “Criollo de Morelos” pepper 334 (CM-334) is resistant to P. capsici strains, regardless of the aggressiveness of the strain or the environmental conditions. However, when the nematode Nacobbus aberrans infects peppers, they lose this resistance by a process defined as “Resistance-breaking”. Breakdown of resistance results from a transcriptomic reconfiguration of the pepper that induces some defense genes, such as WRKY-a, POX, and EAS. The interest in identifying and describing the resistance process to P. capsici, and the breakdown that occurs by N. aberrans, has allowed us to establish a model in which we can analyze the modulation process in both scenarios and identify this transcriptomic modulation. The objective of the present work is to carry out a transcriptomic analysis that demonstrates the modulation of resistance and resistance-breaking processes. It would allow us to identify relevant genes in the early (12 h) and late (24 h) stages in these processes of the CM-334 pepper. Our findings demonstrate that modulation of resistance and resistance-breaking are independent processes that depend on the presence of both pathogens (P. capsici and N. aberrans) and that their timing modulation is dynamic.

1. Introduction

Phytophthora capsici is one of the most devastating pathogens to pepper production worldwide. With its fast spread and its cause of economic losses, studying the interactome of this pathogen is necessary. Despite the advances in and knowledge generated about the molecular mechanisms that participate in the host’s defense against this pathogen and the structural changes in the plant, genetic and molecular interaction has not been fully understood. P. capsici is the oomycete responsible for pepper wilt, inducing leaf and plant root blight at any phenological stage. Genetic resistance against P. capsici isolates was identified in the “Criollo de Morelos 334” pepper (CM-334), which is not a commercial variety. CM-334 resistance is not related to the aggressiveness of the oomycete strain or environmental conditions [1,2]. P. capsici can penetrate CM-334 roots, but its colonization is inhibited 3–4 days after the infection, without symptoms [3]. The mechanisms involved in resistance activate genes that induce de novo synthesis of various proteins and antimicrobe compounds. An example of this modification is the production of HMG, SC, and EAS that produce an hydroxymethylglutaryl-CoA reductase, a sesquiterpene cyclase, and a 5-epiaristolochene, respectively. These proteins are involved in phytoalexin synthesis such as capsidiol [4,5]. Resistance to P. capsici is also associated with increasing phenylalanine ammonia-lyase (PAL) activity. This enzyme is essential in the phenylpropanoid pathway and pathogenicity-related proteins (PRs) such as β-1,3-Glucanase [6]. A quantitative trait loci (QTL) analysis identifies that resistance machinery is encoded principally in chromosome five, identifying mainly genes overexpressed [7]. A previous study on CM-334/P. capsici interaction demonstrates an alteration of 168 genes, principally PRs, catalases, and asparagine [8].
Despite the investigations, the genetic basis in the CM-334 material that confers resistance to P. capsici is not fully understood. However, the detection of QTLs determined that the host defense response is polygenic. The principal aim of this work is to obtain a complete transcriptome analysis that lets us integrate previous studies and identify new issues to understand the whole process of the resistance of CM-334 to P. capsici and the resistance-breaking caused by N. aberrans. This analysis was essential to design experiments that led us to explore the resistance for future applications.

2. Materials and Methods

2.1. Experiment Design

Samples were obtained as previously reported [9]. Briefly, seeds of pepper CM-334 were germinated at 28 °C. Seedlings were incubated at 28 °C under a 14/10 light/dark photoperiod. Seedlings were watered every day and fertilized once a week with Nitrofoska (2 g/L). Once plants were at the six-leaf stage, they were subject to treatments. Sixty-six-leaf-stage plants were inoculated for each treatment, and a pool of 10 roots was used for each sample, having three samples for each time (12 and 24 h) and each treatment (control, Na, Pc, and NaPc). Inoculums from each treatment were prepared as previously reported by Trujillo-Viramontes [10]. The first group, called control (C), was treated with sterile water. The group called Pc was inoculated with 3 × 10⁵ zoospores P. capsici strain 6305. Na treated plants were inoculated with 2000 J2 N. aberrans nematodes per plant. The last group, called NaPc, was first inoculated with 2000 J2 N. aberrans nematodes and 21 days after with 3 × 10⁵ zoospores P. capsici strain 6305.

2.2. RNA Extraction

For each sample, we used the roots from 10 plants of each treatment (C, Na, Pc, NaPc) and each time (12 and 24 h). Roots pools were ground into powder, and then RNA isolation was performed using a RNeasy Plant Mini Kit (QIAgen, Hilden, Germany), following the manufacturer’s instructions. Then, RNA was digested with DNase Max Kit (QIAgen, Manchester, UK). The purity and integrity of RNA were analyzed by electrophoresis and in an Agilent Bioanalyzer (Agilent, Santa Clara, CA, USA). All samples had RNA integrity of at least 7.2, which means they qualified for sequencing assay. Samples were used for library construction using the Illumina MiSeq sequencing platform (Illumina, San Diego, CA, USA). Three pool samples for each treatment (C, Na, Pc, and NaPc) at each time (12 and 24 h) were used to construct the libraries, obtaining 24 libraries total.

2.3. Bioinformatic Analysis

Sequence quality was analyzed in FastQC version 0.11.9 (https://www.bioinformatics.babraham.ac.uk/projects/fastqc/, accessed on 8 January 2020), then filtered by removing adaptor and low-quality reads (Qphred < 20) by Trimmomatic version 0.39 [11] with TRAILING, LEADING, and AVGQUAL parameters. The remaining clean reads were mapped to the Capsicum annum CM-334 genome (https://www.ncbi.nlm.nih.gov/genome/10896, accessed on 8 January 2020) using Hisat2 version 2.2.1 [12] assembled with prepDE. Fragments per Kilobase per million (FPKM) were calculated with HTSeq version 0.12.3 (https://htseq.readthedocs.io/en/master/, accessed on 18 April 2020) to quantify expression levels. Differential expression levels were identified by DEseq2 software version 1.36.0 [13] with an adjusted p-value of 0.01. Then, the Gene Ontology was identified using Panther Database version 17.0 (http://www.pantherdb.org, accessed on 2 March 2021). Finally, graphs were constructed using the Plotly library version 2.0 (https://plotly.com, accessed on 3 June 2021) to create Venn diagrams, heatmaps, volcano plots, and GO graphs. If a given gene matched with multiple protein sequences, the protein with the highest similarity was considered for the annotation. Expression levels were compared of treatments (Na, Pc, or NaPc) against control (C) samples at 12 and 24 h, respectively. For convenience, genes with a Log2 ratio ≥ 2 and p < 0.01 were designated as “upregulated”, while genes with Log2 ratio ≤−2 and p < 0.01 were selected as “downregulated.” The transcriptomic data created from this project will be available at NCBI Bioproject PRJNA713806.

3. Results

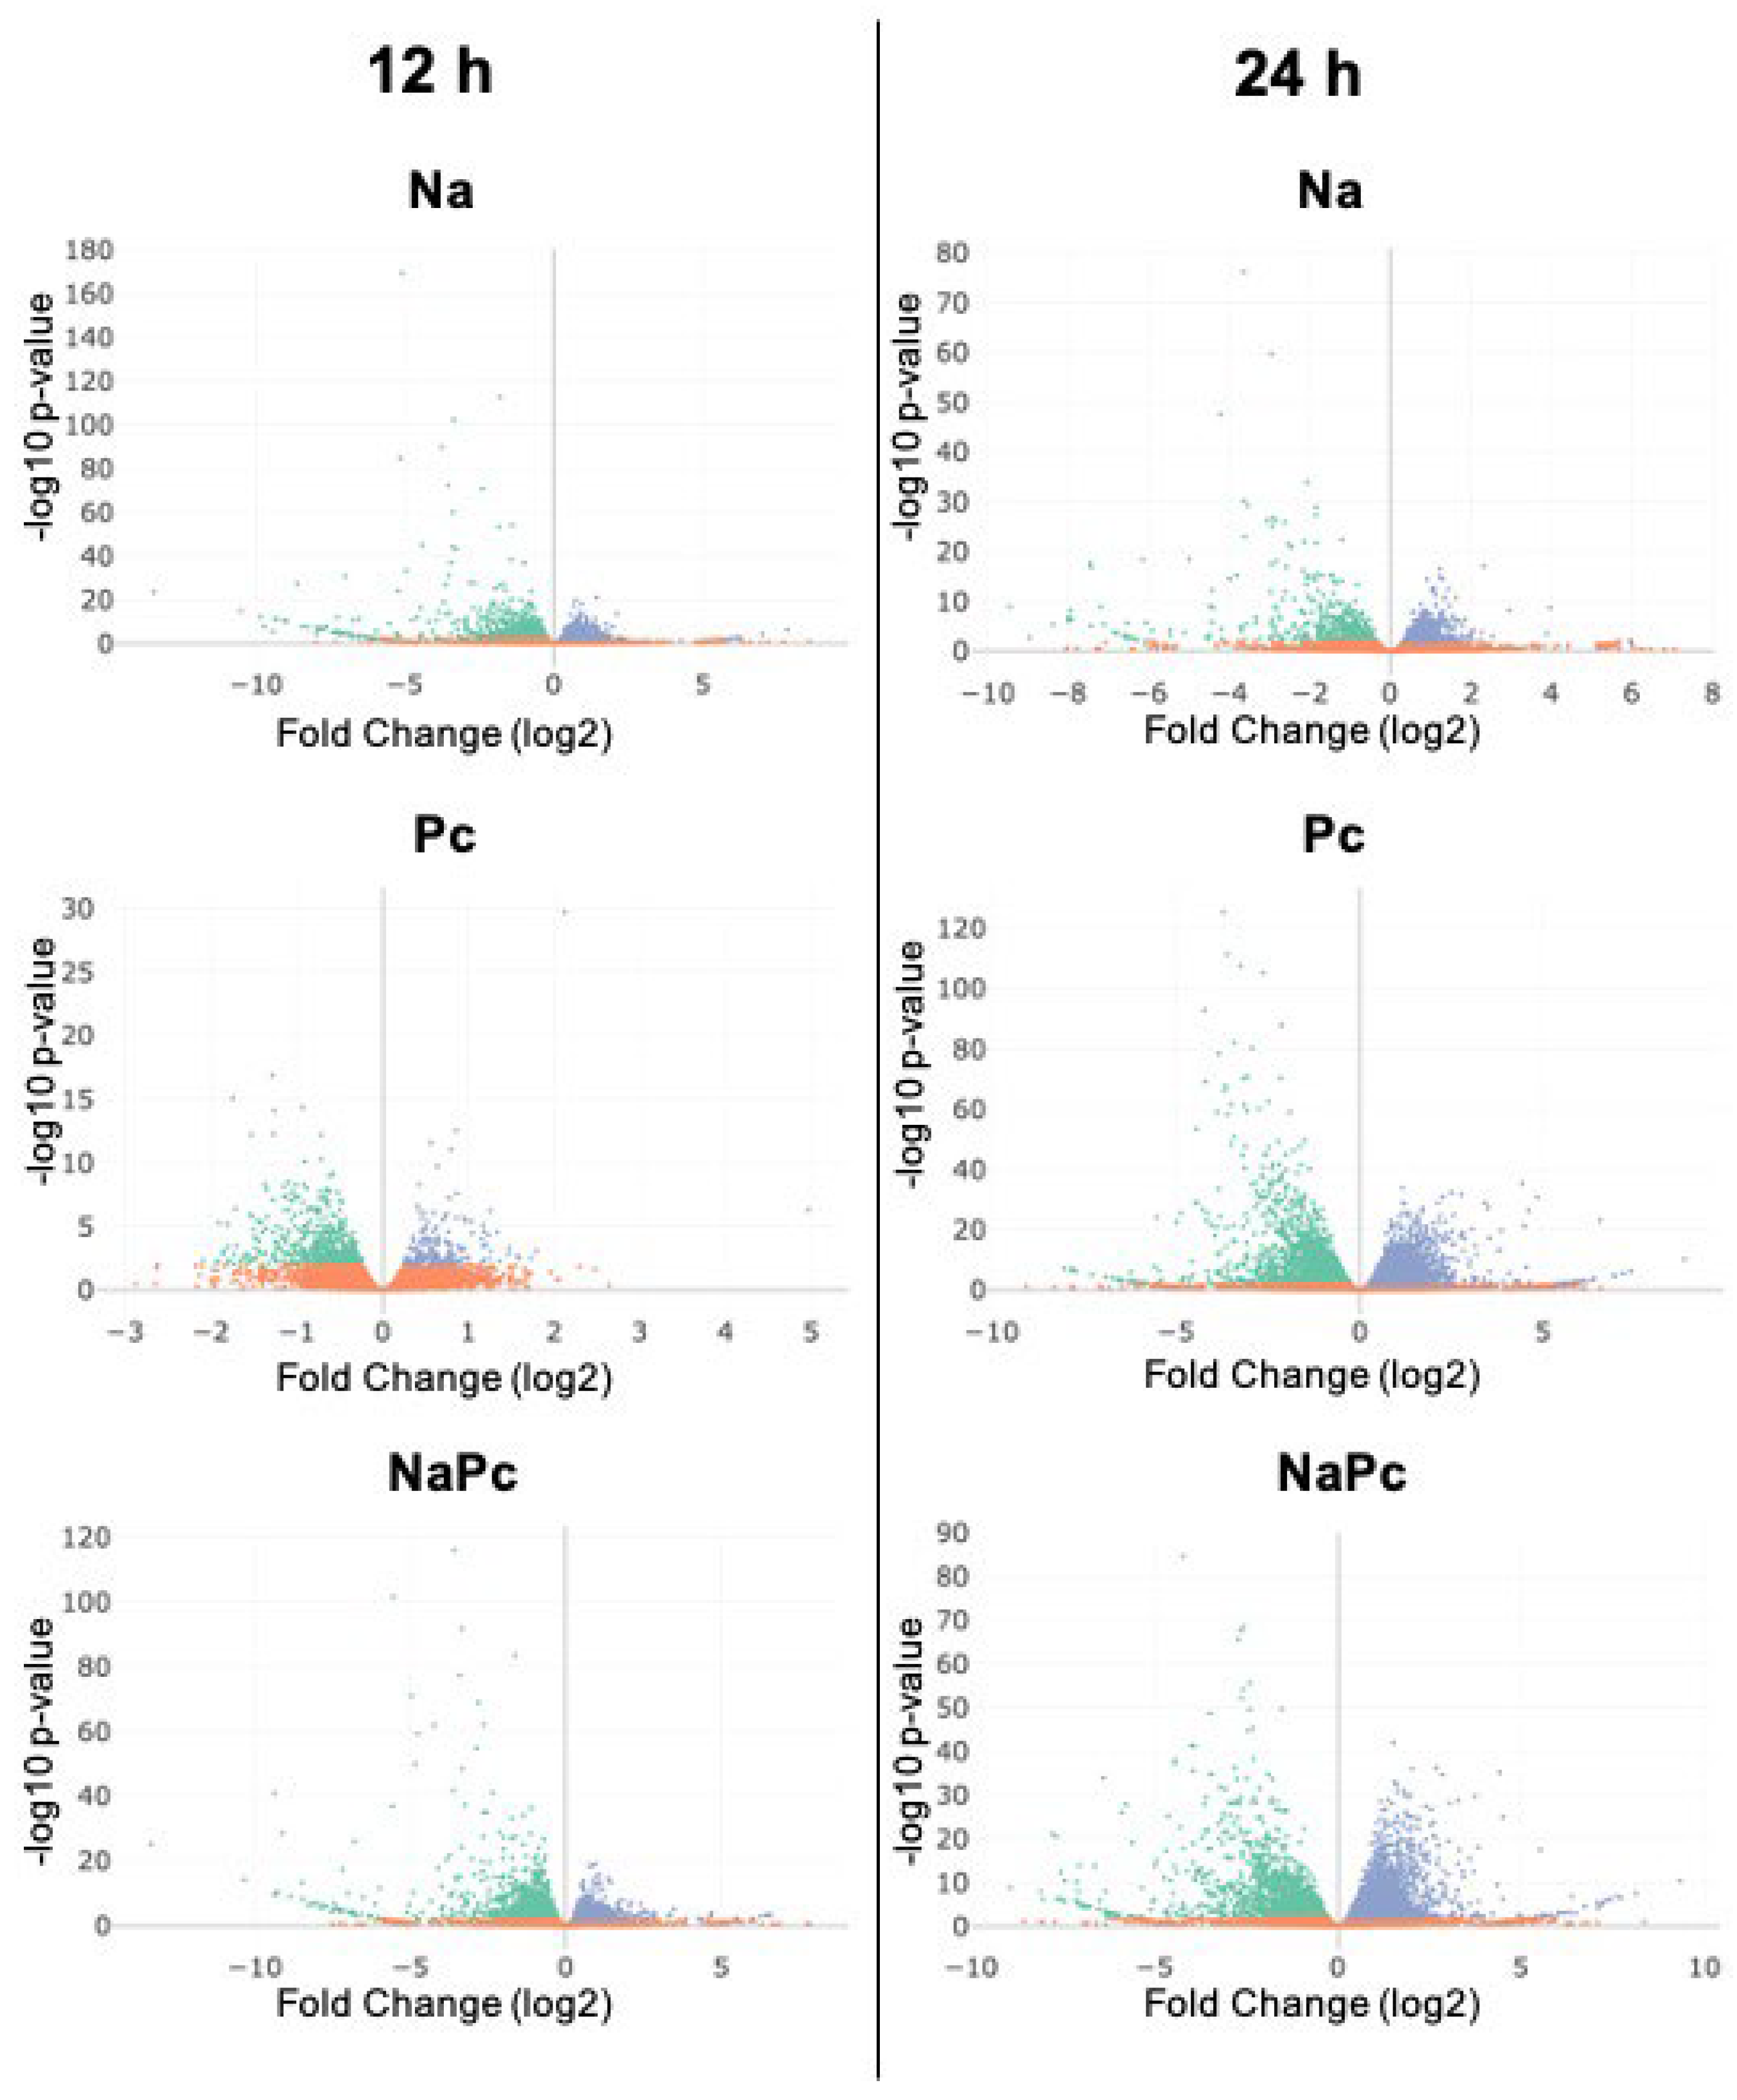
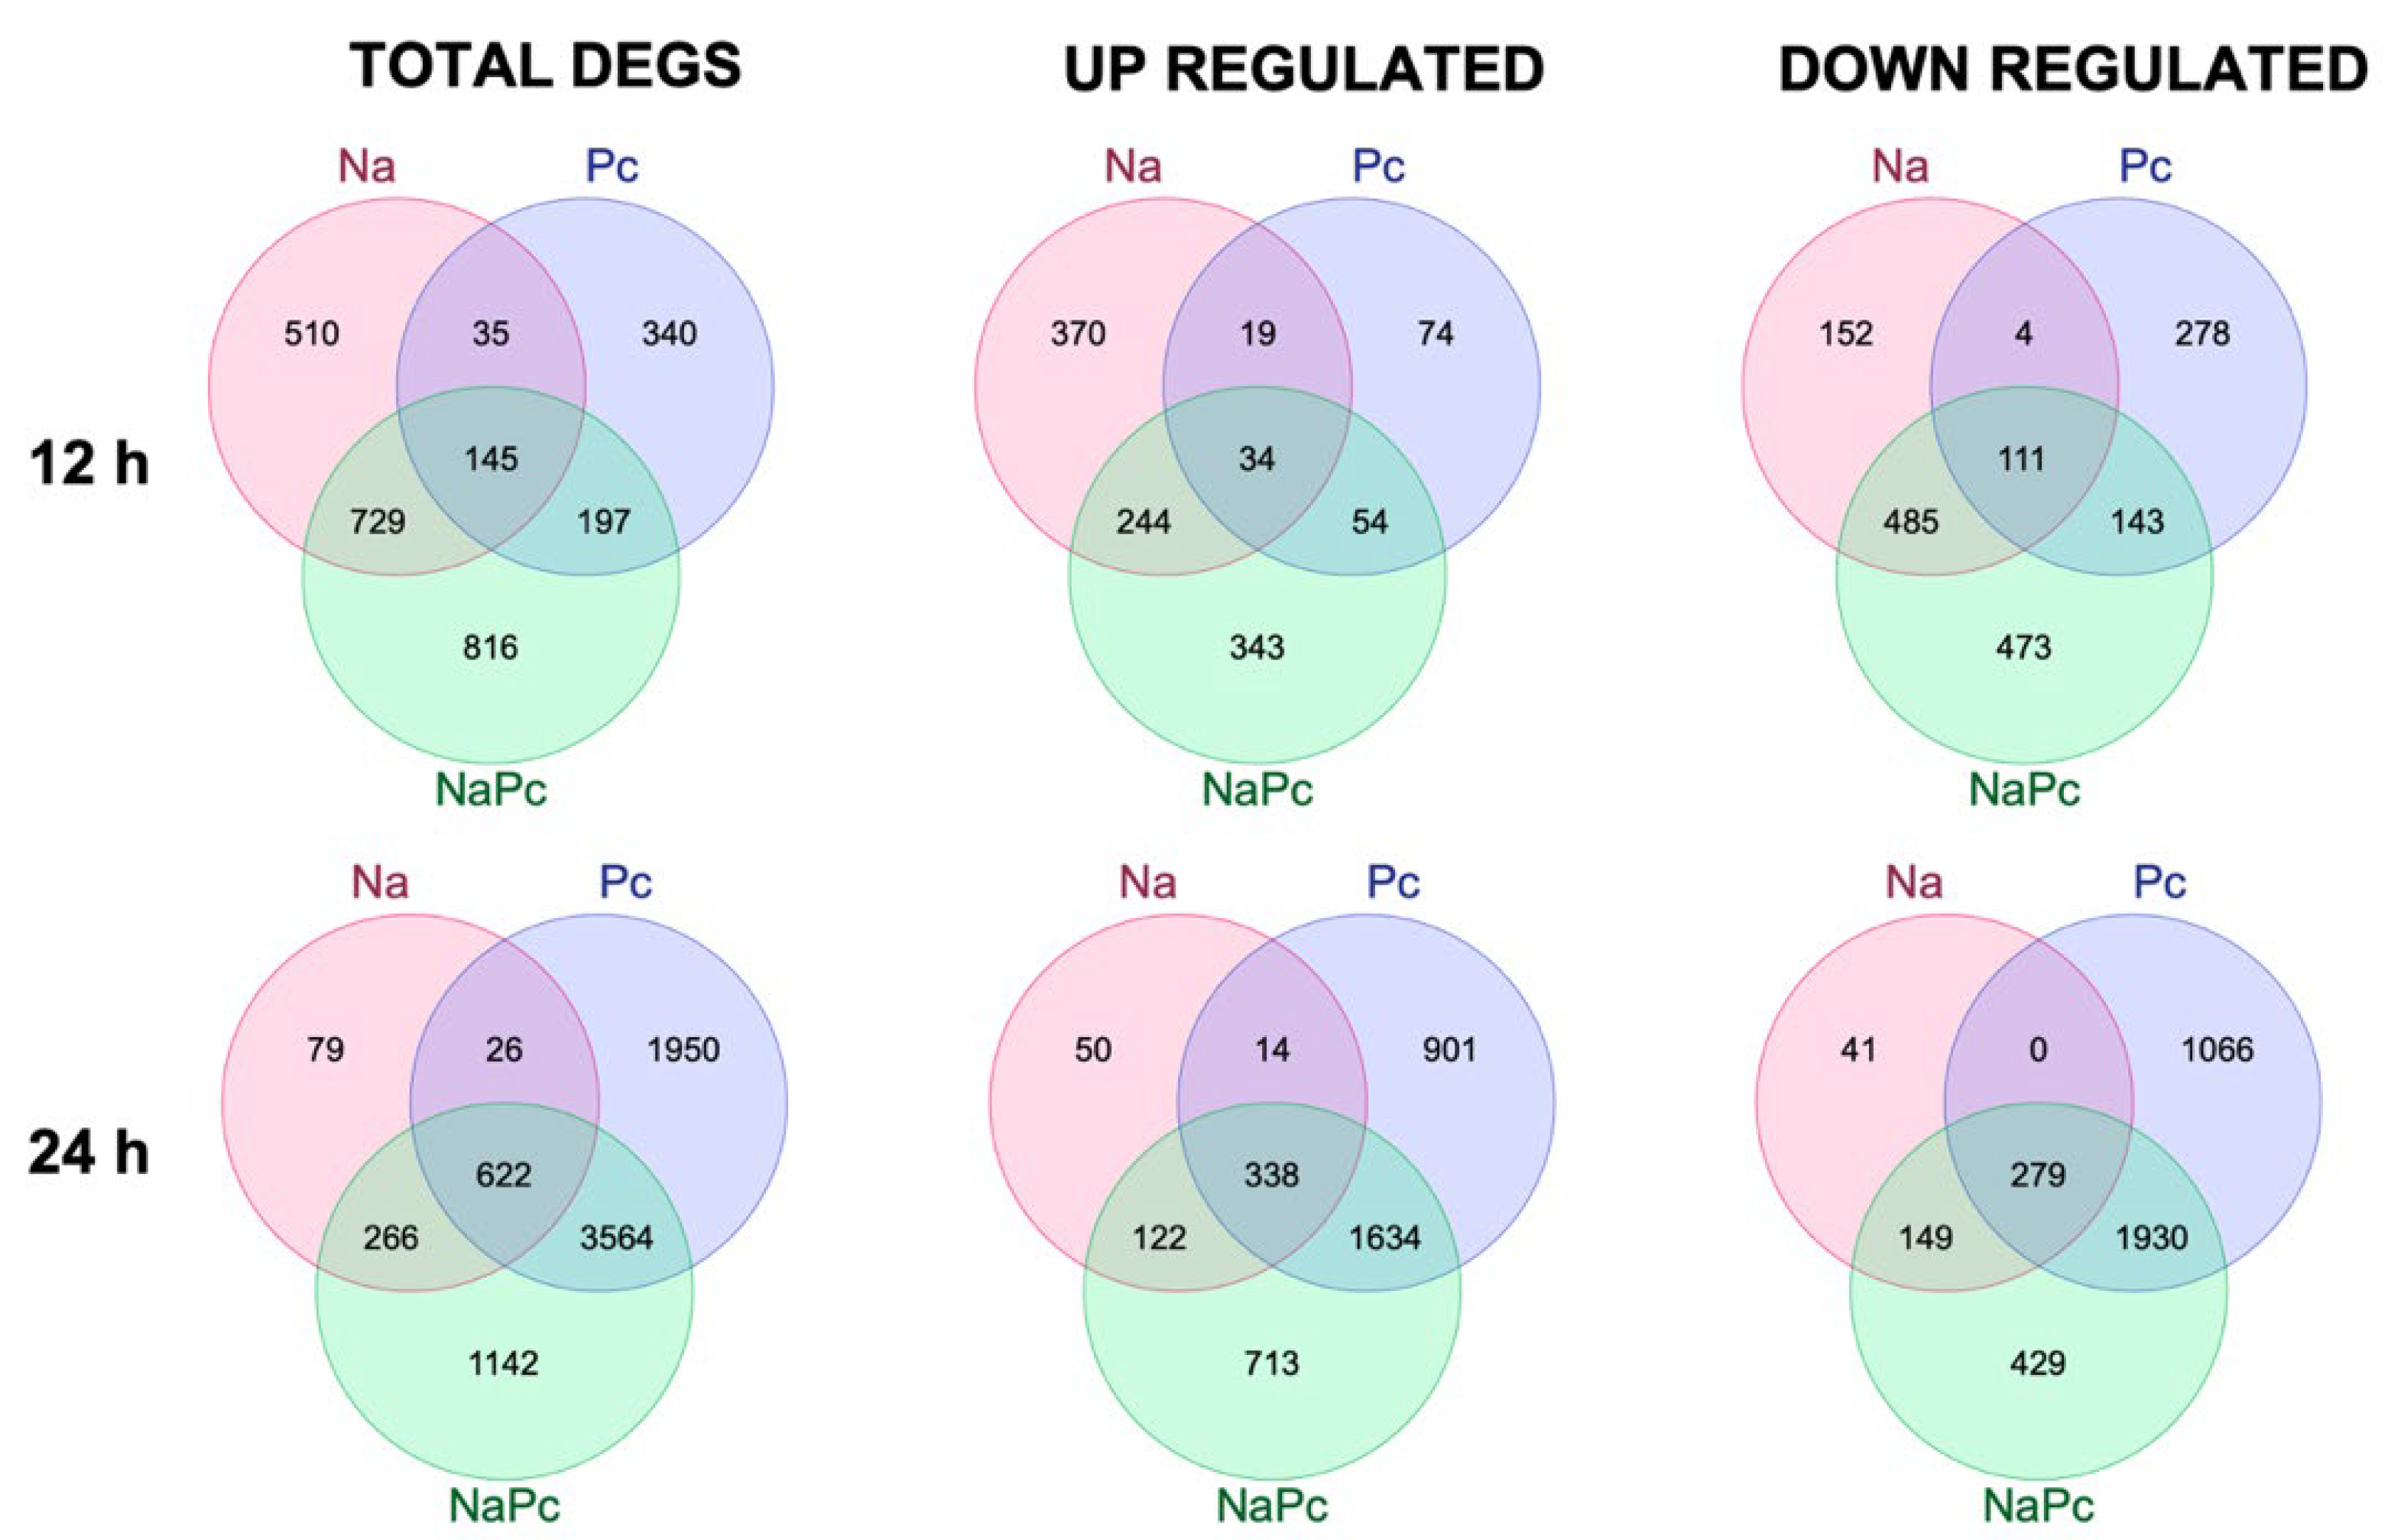
3.1. Differentially Expressed Genes of CM-334 Pepper to P. capsici and N. aberrans

Differential Expressed Genes (DEGs) are shown in Venn diagrams at 12 and 24 h (Figure 1). Plants inoculated with N. aberrans (Na) showed 1419 DEGs at 12 h and 993 at 24 h. Plants inoculated with P. capsici (Pc) showed 717 DEGs at 12 h and 6162 genes at 24 h. Finally, plants inoculated with N. aberrans and then with P. capsici (NaPc) showed 1887 DEGs at 12 h and 5595 at 24 h. We suggest that common DEGs between Pc and NaPc treatments are not responsible for resistance or resistance-breaking processes. The DEGs identified in all the conditions could be part of the normal pathogenic responses of the plant. Instead, some of the DEGs detected in Na and NaPc treatments could be part of the resistance and resistance-breaking regulation. Interestingly, we identified 816 and 1142 DEGs at 12 and 24 h, respectably, present only in NaPc treatment. Analyzing these genes and their role in metabolism and defense action is essential to identifying candidates participating in resistance and resistance-breaking. We analyzed the transcriptional dynamic for every treatment and showed it in volcano plots (Figure 2). A higher variation was detected at 24 h compared with plots obtained at 12 h. Heatmaps of the top 25 upregulated and downregulated genes (Figure 3) are shown to identify gene cluster patterns specific for each treatment. Upregulated DEGs are highlighted in yellow, whereas downregulated DEGs are shown in purple, with an adjusted p-value < 0.01 and FC > |2|. We identified specific patterns in the modulation of gene regulation in each condition that demonstrated that a particular modulation of C. annuum in each condition was present and that this modulation was responsible for the resistance of the pepper to pathogens. Interestingly, no downregulated clusters were identified at 12 h with Pc treatment (Log2 ratio ≤ −2 and p < 0.01), suggesting that genetic downregulation could be essential to identifying genes responsible for early resistance-breaking.

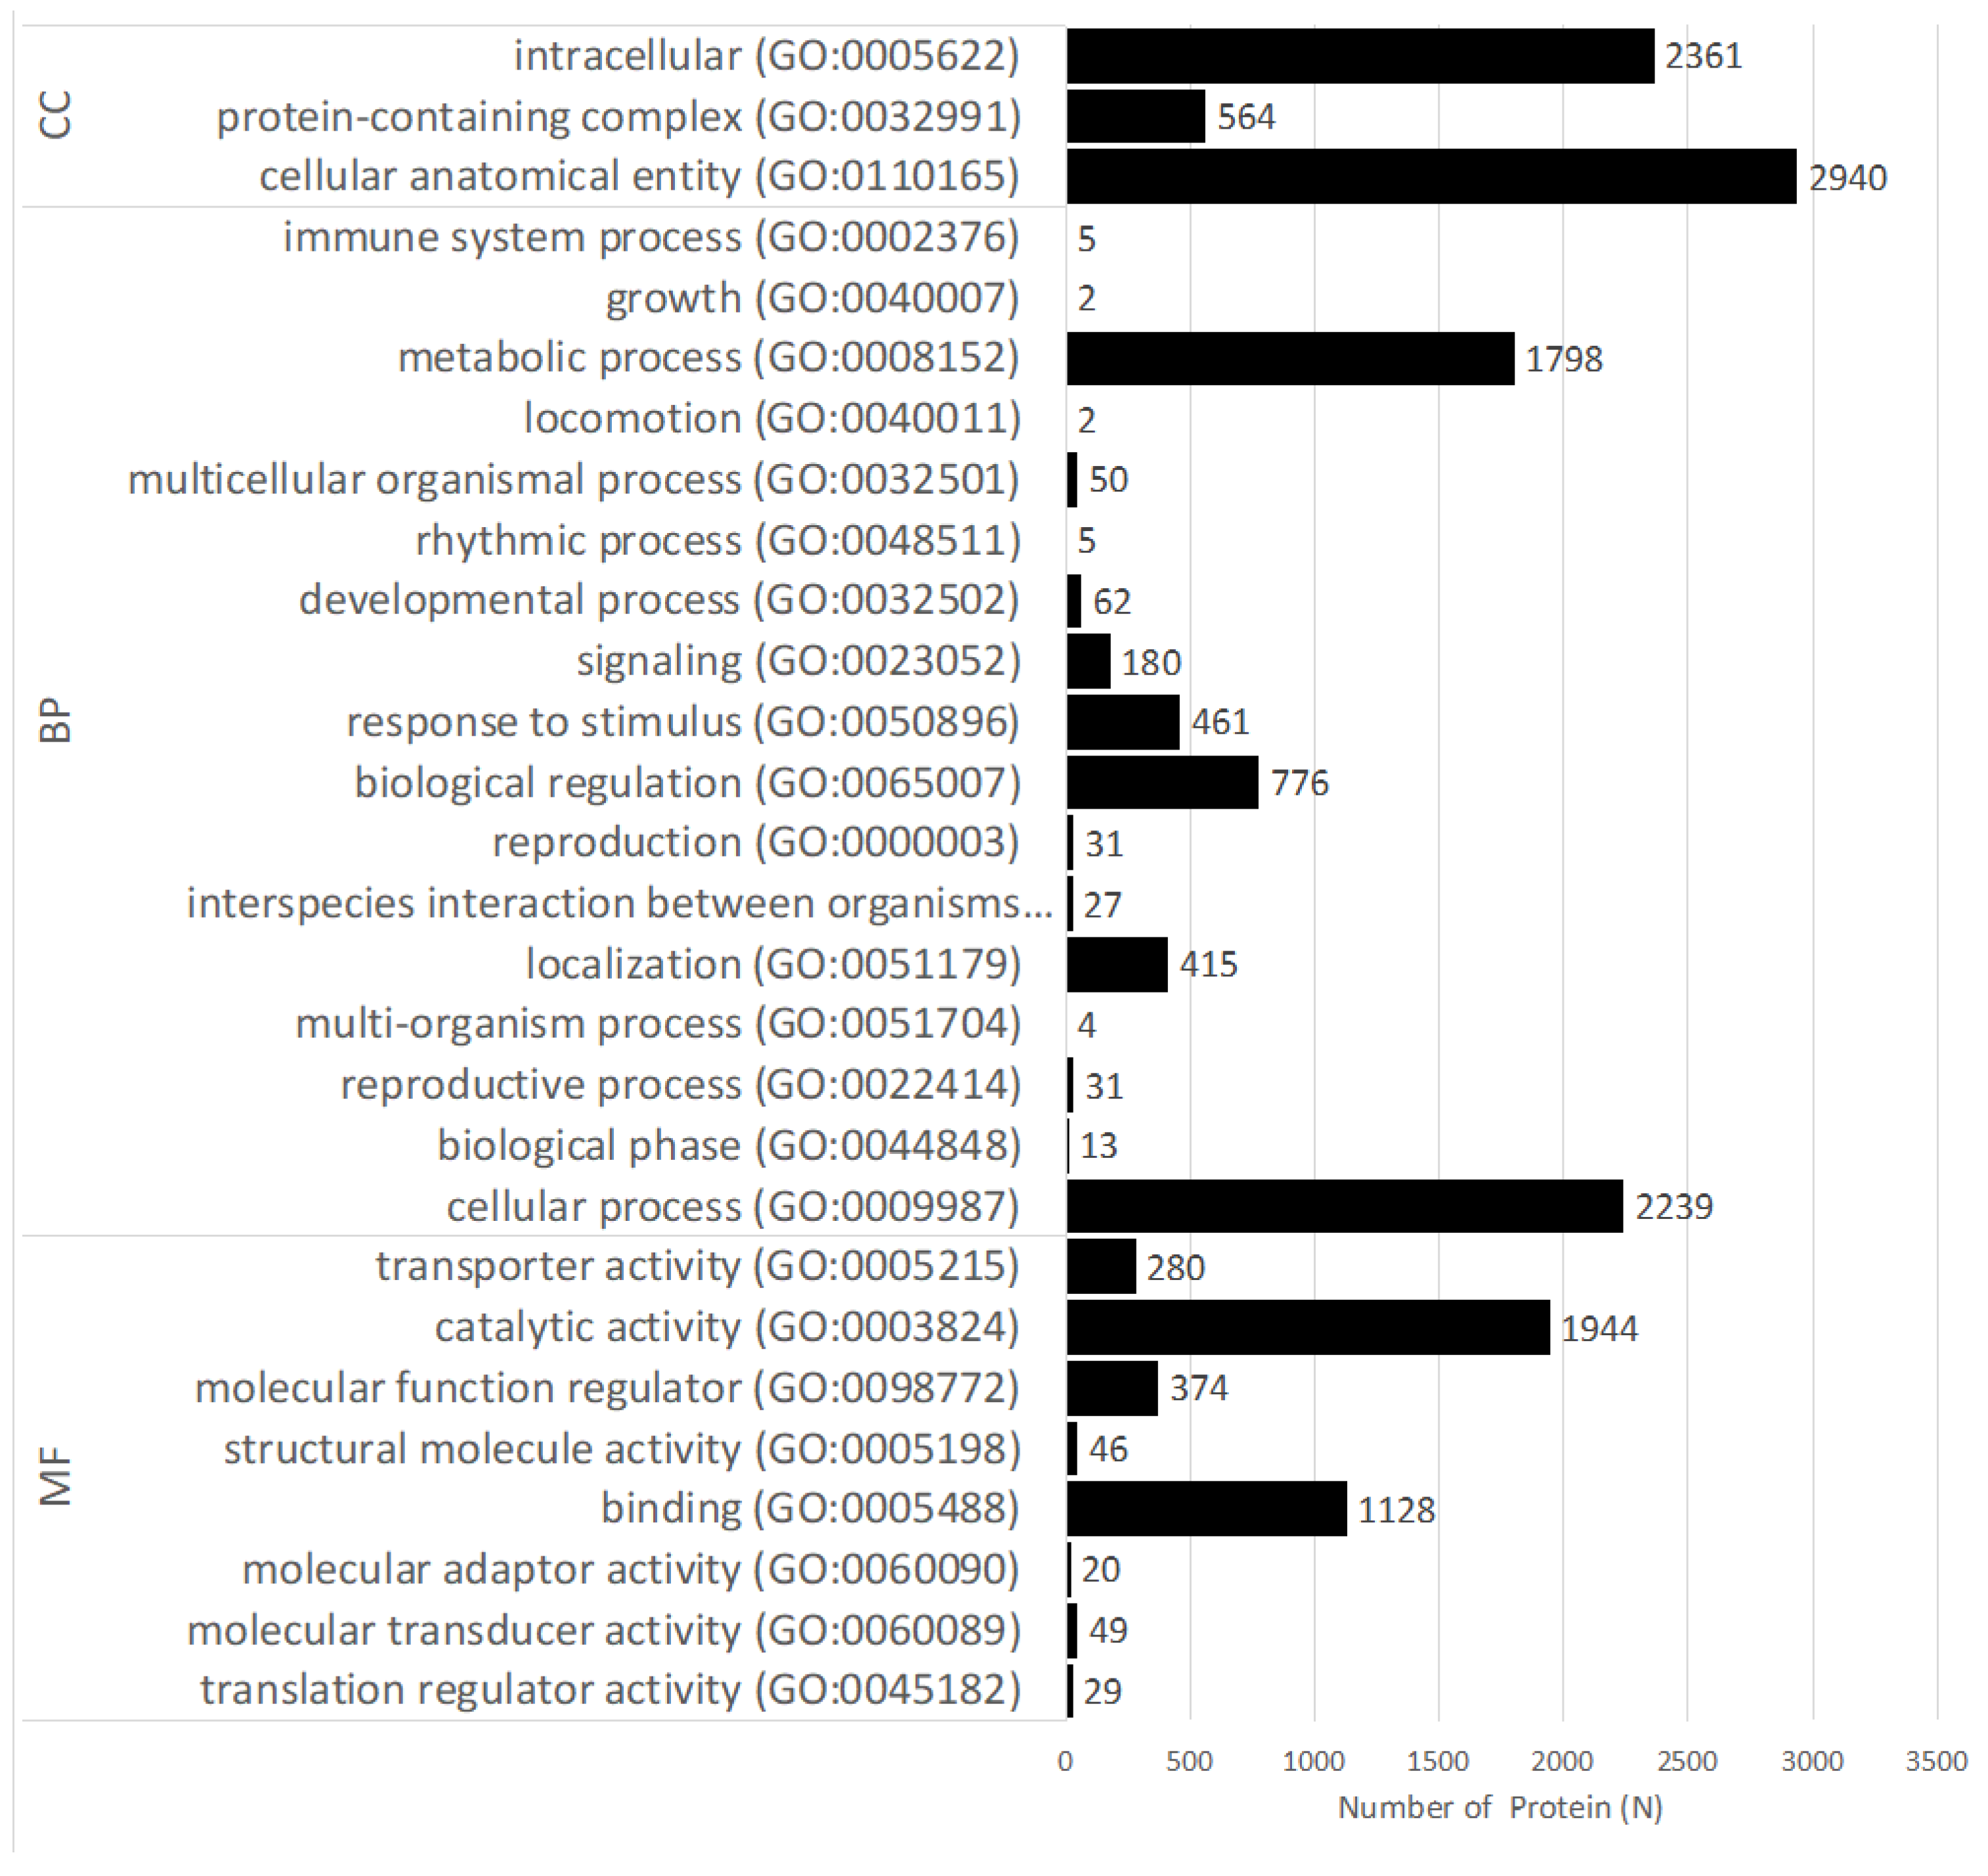
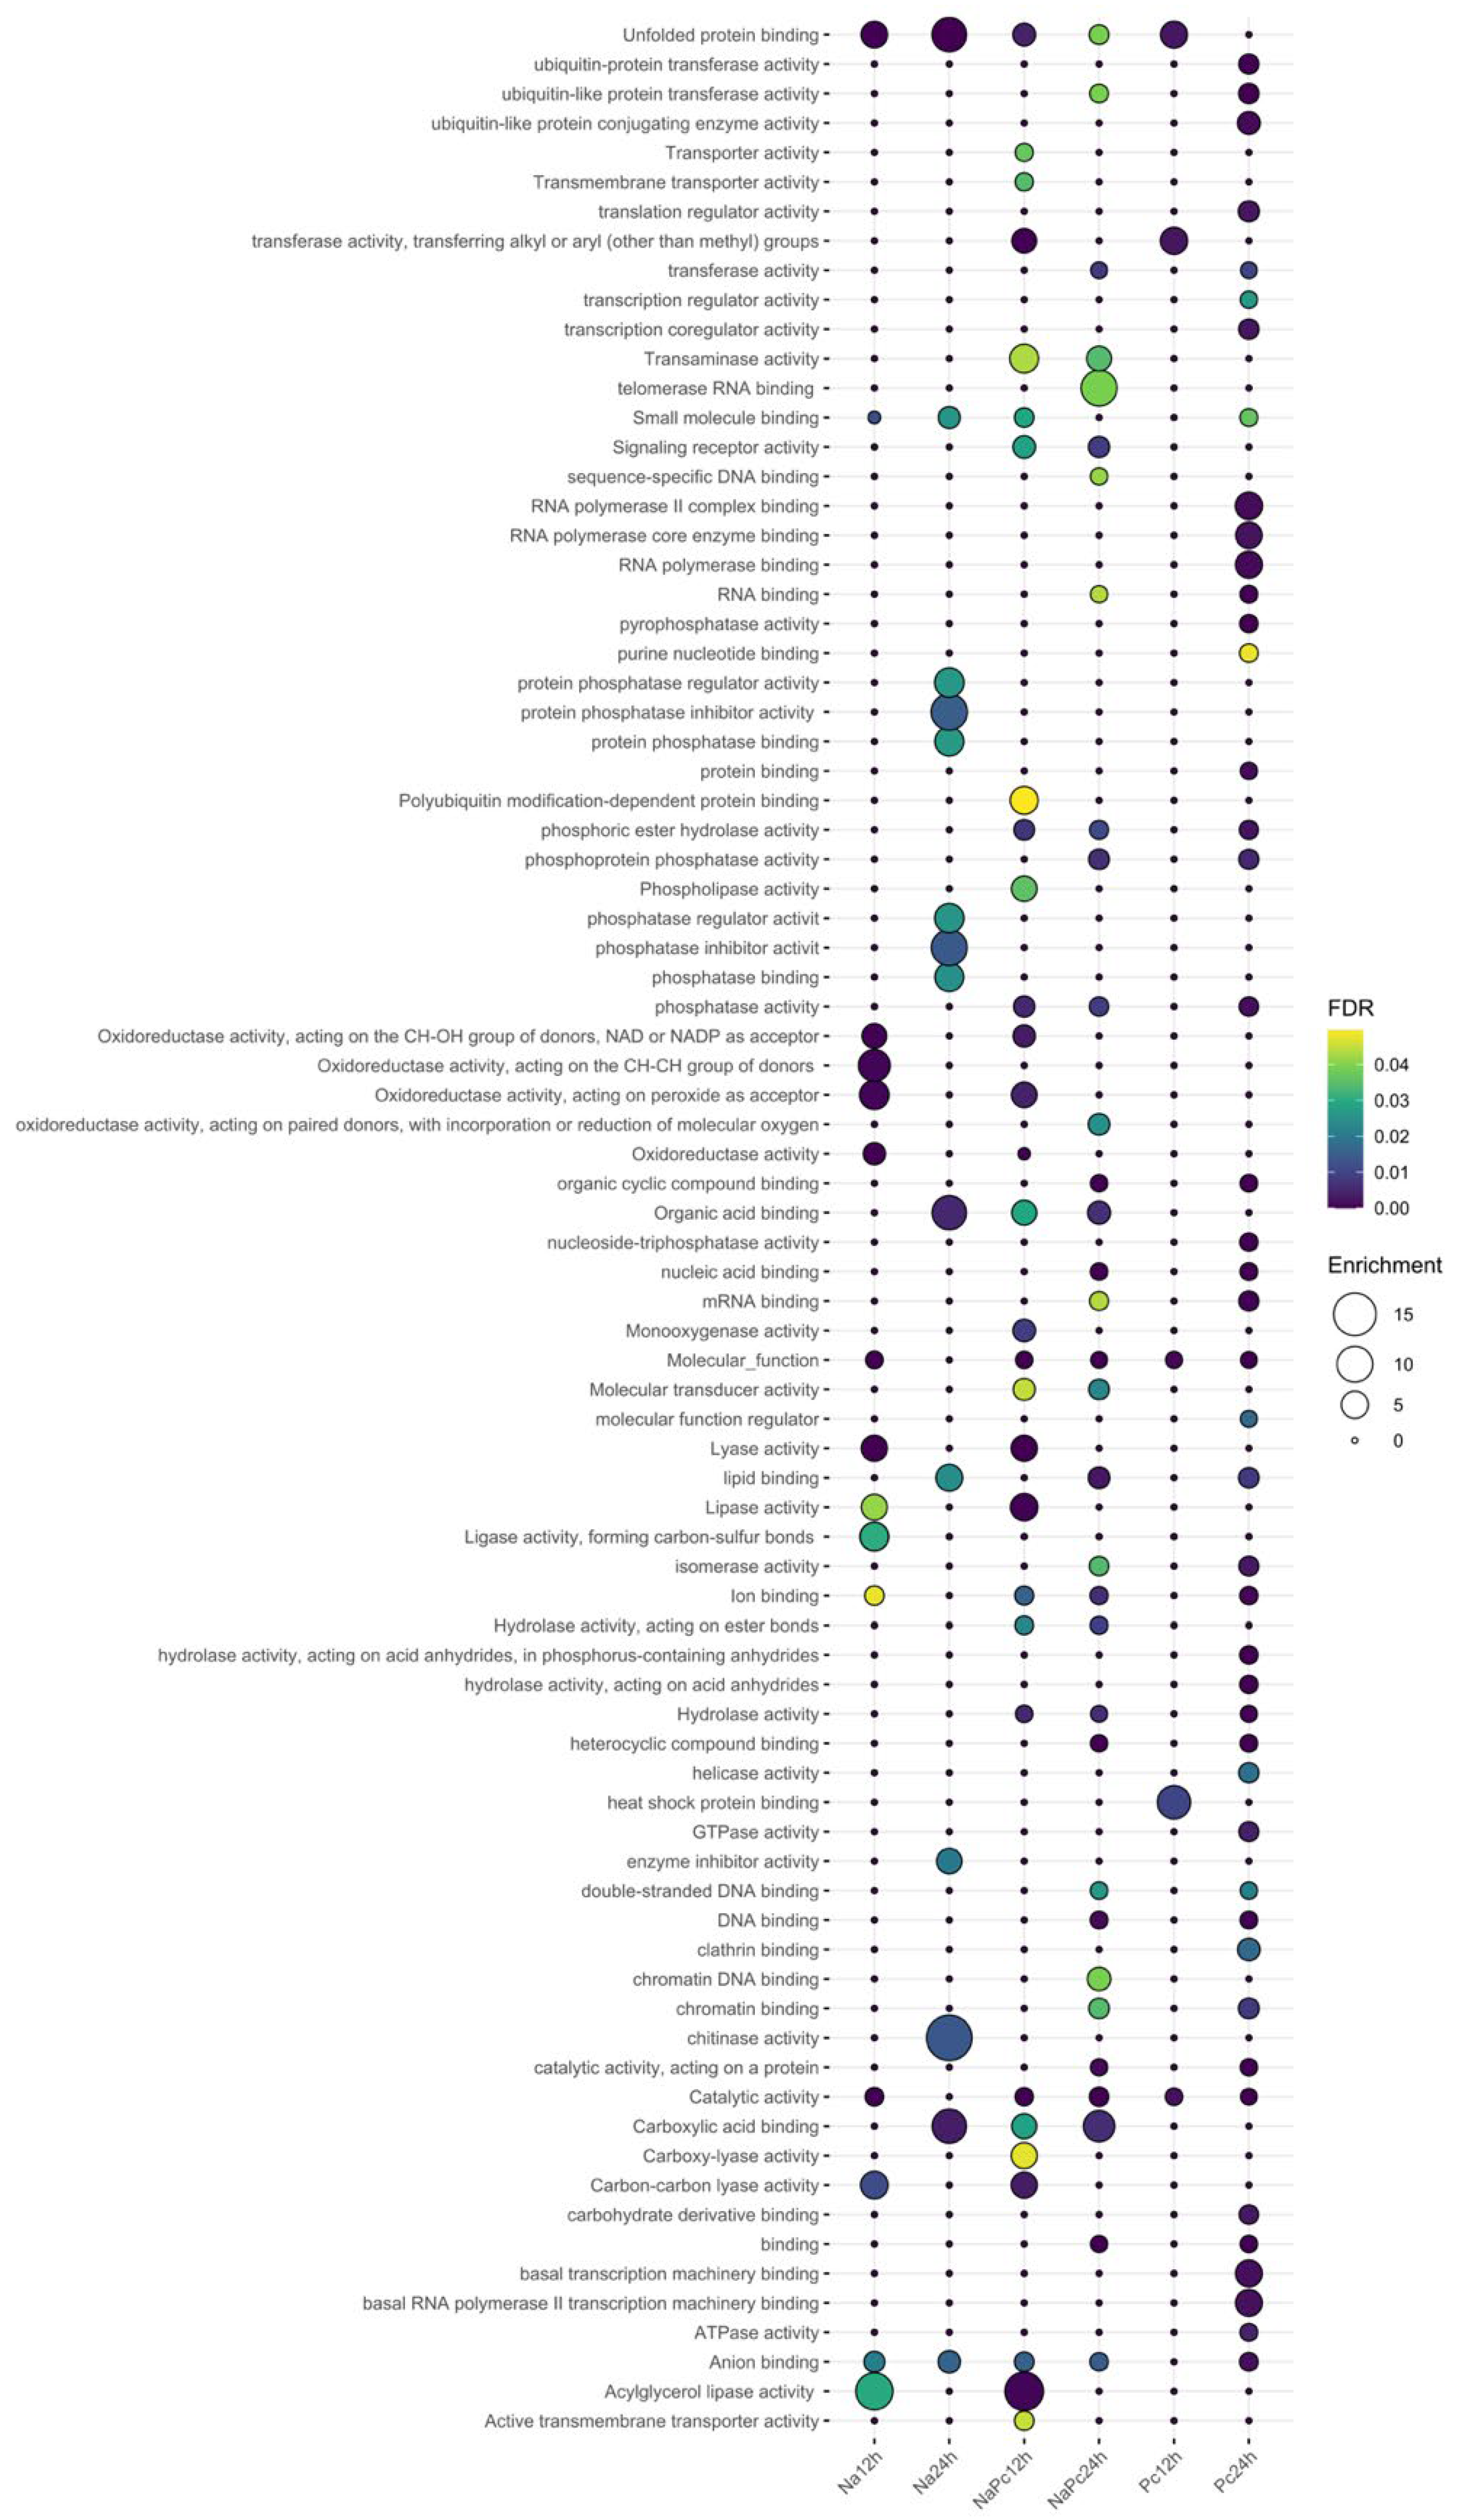
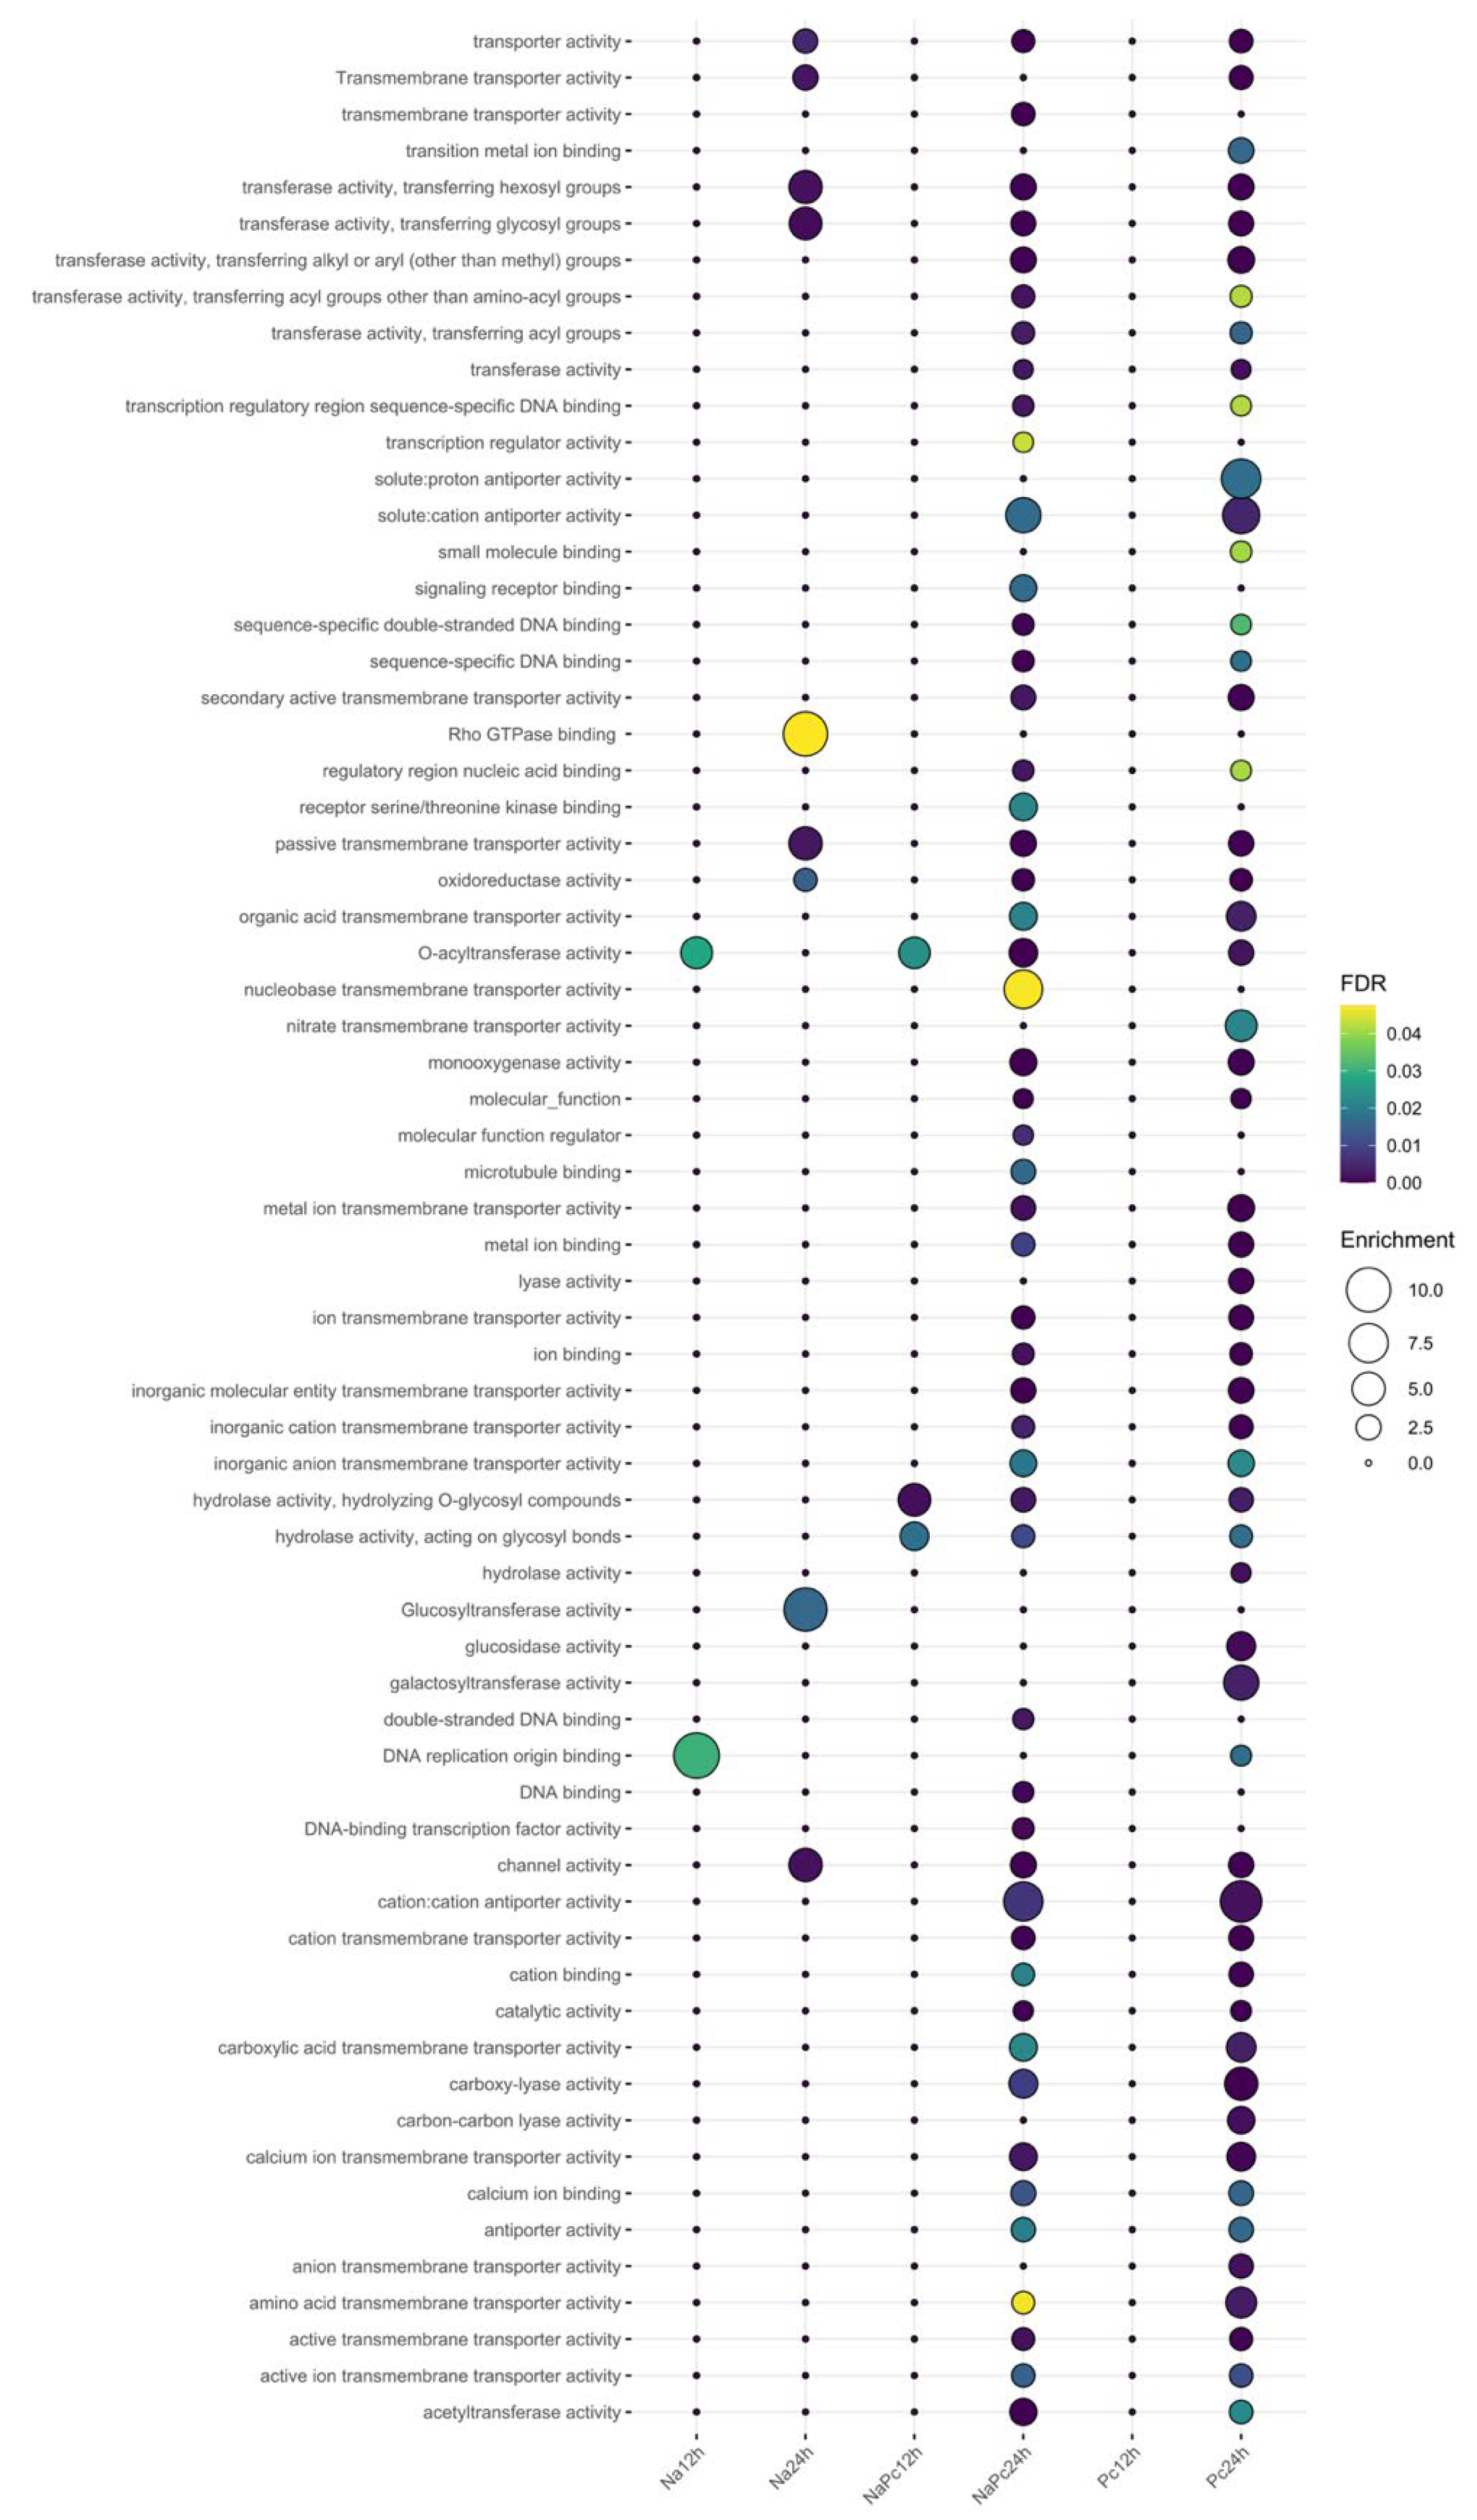
3.2. Functional Annotation of Genes Expressed Differentially

To determine the biological functions of the DEGs between the control and treatments, genes were annotated using the Gene Ontology (GO) database and divided into three major functional categories: molecular function (MF), cellular (CC), and biological process (BP). A total of 8591 genes were found expressed differentially, but only 3870 genes reported MF, 6101 for BP, and 5865 genes for CC (Figure 3). Analyzing the MF of the genes, 50.2% corresponded to catalytic activity (GO: 0003824), 29.1% corresponded to binding proteins (GO:0005488), and 9.7% corresponded to molecular function regulator (GO: 0098772). The principal groups of BP were cellular process (GO: 0009987, 36.7%), metabolic process (GO: 0008152, 29.5%), and biological regulation (GO: 0065007, 12.7%). The CC genes were formed by 50.1% cellular anatomical entity (GO:0110165), 40.3% intracellular (GO: 0005622), and 9.6% protein-containing complex (GO 0032991).
GO enrichment analysis elucidated the overexpression’s biological implications (Figure 4) and compared GO terms to control DEGs. We identified that DEGs of NaPc treated plants showed more GOs than the other treatments, suggesting that break resistance in these plants involves many pathways and is a complex process. DEGs of plants with Na treatment showed different metabolic processes and oxidate-reduction processes as main GO terms. In contrast, DEGs of Pc and NaPc treatments showed a difference in the Phosphate metabolic process. Pc treatment at 24 h increased translation activity function. NaPc DEGs treatment increased binding receptors at 12 and 24 h (Figure 5). Hydrolase activity decreased in Na DEGs treatment, and transporter and transmembrane activity decreased mainly in Pc and NaPc DEGs treatments. In addition, we analyzed the GO terms of downregulated genes (Figure 6). It is important to remember that if there were no significant downregulated DEGs at 12 h, we cannot identify GO terms in this case. Interestingly, we identified many GO terms that were only present in NaPc treatment DEGs, such as the upregulation of transmembrane transporter activity, transaminase activity, transporter activity, telomerase RNA binding, and sequence-specific DNA binding; or the downregulation of transcription regulator activity, signaling receptor binding, receptor serine/threonine kinase binding, microtube binding, double-stranded DNA binding, DNA binding, and DNA-binding transcription activity. These results support the hypothesis that resistance-breaking is a fine transcriptional regulation that needs the presence of N. aberrans and P. capsici.

3.3. Resistance Genes Expressed Differentially

We looked for genes expressed differentially that codified defense responses for each treatment. Table 1 shows some genes that could participate in resistance and resistance-breaking processes. Interestingly, we identified some genes that were only affected by one of the treatments at one time, such as T459_00160, T459_00863, and T459_11521. We saw those dynamics during early (12 h) and late (24 h) defense responses, which varied significantly. For example, T459_05748 was overexpressed at 24 h in Pc treatments, while at 12 h, its expression levels were the same as control. It could suggest those genes with this pattern are part of broken resistance caused by N. aberrans at early stages.
In some cases, such as T459_10498 and T459_22749, which were overexpressed at 12 h NaPc treatment, expression suffered a delay in Na treatments, suggesting that timing alteration plays an essential role during resistance-breaking. Furthermore, differential expression of genes such as T459_05984 or T459_14119 in NaPc treatment means that the combination of the nematode and the oomycete in the plant is necessary for the resistance-breaking process. Instead, a deeper analysis is needed to understand the relevance of this transcriptional reconfiguration in CM-334. We included other DEGs that showed upregulated (Log2 ratio ≥ 2) and downregulated patterns in Table S1.

4. Discussion

P. capsici is an aggressive pathogen that causes root, crown, foliar, and fruit rot on many vegetables [14]. P. capsici resistance has been reported in various Solanaceous, such as the pepper CM-334. However, CM-334 is not a commercial variety, and research on this resistance is necessary. Previously, differential expression in roots of resistant (CM-334 pepper) and susceptible pepper NMCA10399 plants was reported, identifying an earlier response in resistant CM-334 pepper, suggesting that the activation of the response on time is essential to disease resistance [15]. Pathways involved in the synthesis of secondary metabolites are the most representative modified pathways, based on the DEGs identified in CM-334 plants in the presence of P. capsici. Cinnamaldehyde, lignin, caffeoylquinic acid, and capsidiol are plant defenses against pathogens. Phenylpropanoid biosynthesis pathways, especially cinnamaldehyde and lignin, were proposed to play essential roles in pepper root defense against P. capsici [15]. The participation of other elements critical in resistance and resistance-breaking is still unknown. Many proteins such as MYC2, Phenylalanine ammonia-lyase, WRKY transcription factors, Chitinases, LRR proteins, and Kunitz proteins were previously described as elements of the resistance of CM-334 [4,16,17,18,19]. However, the analysis of resistance-breaking is yet undescribed. We identified 8591 genes that responded under the treatments analyzed. It is important to remark that 3478 genes were hypothetical proteins without a defined function. We determined the GO terms differentially expressed in our study. Still, only 3870 had a reported Molecular Function GO term, 6101 had a reported biological process GO term, and 5865 genes had a reported Cellular Competent GO term. More molecular and biochemical studies are needed to characterize all the genes we identified and establish pathways to participate in resistance and communication.
We identified a differential expression in some transcription genes such as MYC transcription factors (Table 1 and Table S1). In Arabidopsis thaliana, MYC2 upregulates the expression of genes such as VSP and LOX [20]. In Medicago truncatula, MYC2 enhances the production of flavonoids; MYC2 binds to Jasmonates (JA)-responsive elements in the promoters of JA-regulated genes [21]. JA mediated root and trichome formation, flower development, leaf senescence, and plant responses to various biotic and abiotic stresses [21,22,23,24,25]. Our analysis identified three MYC2 factors expressed differentially (T459_00863, T459_04029, and T459_25133). Differential expression of these three transcription factors between treatments and times suggests that the regulation of JA is also different during resistance and resistance-breaking. For example, the peroxidase gene T4549_06392 called our attention because it was upregulated during resistance (Pc treatment). Still, it was downregulated in the presence of N. aberrans (Na and NaPc treatments). The fascinating recodification of the host during defense and broken defense transition is very clear. Salicylic acid (SA) signaling was the second defense response necessary to analyze in this study. SA is synthesized from phenylalanine via phenylalanine ammonia-lyase (PAL). We identified at least seven PALs that were expressed differentially. Moreover, WRKY proteins, Chitinases, AP2/ERF proteins, and serine/threonine proteins, among others, were expressed differentially. An immediate analysis of the pathways and crosstalk between them is required to understand the defense and resistance-breaking process. These outcomes clarify the design for further experiments and provide the basic knowledge to explore the role of natural resistance against P. capsici and the resistance-breaking in the presence of N. aberrans. It is important to remark that this study’s main objective was to obtain the transcriptome profile of the complete pathosystem to make a deeper analysis to clarify the resistance and resistance-breaking processes. Identification and experimental investigation of the pathways involved in those processes are in progress. We considered that this study is essential to demonstrate a differential gene expression between resistance and resistance-breaking at the early (12 h) and late (24 h) stages. Identifying transcription patterns exclusive of NaPc treatment potentially indicated that resistance-breaking is a complex process that requires the presence of the nematode N. aberrans and the oomycete P. capsici.

5. Conclusions

In this study, we provided evidence of a transcriptional reprogramming on C. annuum CM-334 that occurs in the presence of the oomycete P. capsici and the nematode N. aberrans. This analysis provides essential information about how resistance and resistance-breaking occur. We offer the complete transcriptome of the CM-334/P. capsici/N. aberrans pathosystem that is available at NCBI Bioproject PRJNA713806. Future analyses are in progress to obtain deep and refined details on the pathways participating in these events.

Supplementary Materials

The following supporting information can be downloaded at: https://www.mdpi.com/article/10.3390/ijpb13020015/s1, Table S1: Differentially expressed genes with a Log2 fold >1.0. Green: upregulated genes. Red: downregulated genes. Genes with no differential expression significant (when p > 0.01) was indicated with a dash (―).

Author Contributions

R.I.R.-M. and E.Z.-M. conceived of the present idea and designed the experiments. R.I.R.-M. and O.N.-R. contributed to sample preparation. J.V.-A., D.O.-M. and A.S.-F. supervised the project. M.R.-C. performed the analysis and verified the analytical methods. All authors have read and agreed to the published version of the manuscript.

Funding

This research received no external funding.

Institutional Review Board Statement

Not applicable.

Informed Consent Statement

Not applicable.

Data Availability Statement

Datasets will be able in NCBI Bioproject PRJNA713806.

Acknowledgments

The editing service provided by Alejandra Ibáñez Contreras (UAM-Iztapalapa) was greatly appreciated. The authors acknowledge help from Solaria Biodata, especially to Luis Cruz-Jaramillo, for their technical support.

Conflicts of Interest

The authors declare no conflict of interest.

References

  1. Palloix, A.; Daubeze, A.M.; Pochard, E. Phytophthora Root Rot of Pepper Influence of Host Genotype and Pathogen Strain on the Inoculum Density-Disease Severity Relationships. J. Phytopathol. 1988, 123, 25–33. [Google Scholar] [CrossRef]
  2. Sarath Babu, B.; Pandravada, S.R.; Prasada Rao, R.D.V.J.; Anitha, K.; Chakrabarty, S.K.; Varaprasad, K.S. Global Sources of Pepper Genetic Resources against Arthropods, Nematodes and Pathogens. Crop Prot. 2011, 30, 389–400. [Google Scholar] [CrossRef]
  3. Fernandez-Pavia, S.P. Host-Pathogen Interactions in the Root Rot Phytophthora capsici/Capsicum annuum Resistant CM-334 Pathosystem; New Mexico State University: Las Cruces, NM, USA, 1997. [Google Scholar]
  4. Fernández-Herrera, E.; Rojas-Martínez, R.I.; Gómez-Rodríguez, O.; Guevara-Olvera, L.; Rivas-Dávila, M.E.; Valadez-Moctezuma, E.; Zavaleta-Mejía, E. Defense Genes, Enzymatic Activity and Capsidiol Content in CM-334 Chilli Pepper inoculated with Phytophthora capsici. Interciencia 2012, 37, 370–376. [Google Scholar]
  5. Villar-Luna, H.; Reyes-Trejo, B.; Gómez-Rodríguez, O.; Villar-Luna, E.; Zavaleta-Mejía, E. Expression of Defense Genes and Accumulation of Capsidiol in the Compatible Interaction CM334/Nacobbus aberrans and Incompatible CM334/Meloidogyne incognita. Nematropica 2015, 45, 9–19. [Google Scholar]
  6. Egea, C.; Dickinson, M.J.; Candela, M.; Candela, M.E. β-1,3-Glucanase Isoenzymes and Genes in Resistant and Susceptible Pepper (Capsicum annuum) Cultivars Infected with Phytophthora capsici. Physiol. Plant. 1999, 107, 312–318. [Google Scholar] [CrossRef]
  7. Siddique, M.I.; Lee, H.Y.; Ro, N.Y.; Han, K.; Venkatesh, J.; Solomon, A.M.; Patil, A.S.; Changkwian, A.; Kwon, J.K.; Kang, B.C. Identifying Candidate Genes for Phytophthora capsici Resistance in Pepper (Capsicum annuum) via Genotyping-by-Sequencing-Based QTL Mapping and Genome-Wide Association Study. Sci. Rep. 2019, 9, 9962. [Google Scholar] [CrossRef]
  8. Richins, R.D.; Micheletto, S.; O’Connell, M.A. Gene Expression Profiles Unique to Chile (Capsicum annuum L.) Resistant to Phytophthora Root Rot. Plant Sci. 2010, 178, 192–201. [Google Scholar] [CrossRef]
  9. Nabor-Romero, O. Análisis del Transcriptoma de Chile CM-334 en el Rompimiento de Resistencia A Phytophthora capsici por Nacobbus aberrans; Colegio de Postgraduados: Texcoco, Mexico, 2020. [Google Scholar]
  10. Trujillo-Viramontes, F.; Zavaleta-Mejía, E.; Rojas-Martínez, R.I.; Lara, J. Tiempo de Inoculación y Nivel de Inóculo, Factores Determinantes Para el Rompimiento de Resistencia a Phytophthora capsici Inducido Por Nacobbus aberrans en Chile (Capsicum annuum). Nematropica 2005, 35, 2114–2120. [Google Scholar]
  11. Bolger, A.M.; Lohse, M.; Usadel, B. Trimmomatic: A Flexible Trimmer for Illumina Sequence Data. Bioinformatics 2014, 30, 2114–2120. [Google Scholar] [CrossRef] [Green Version]
  12. Kim, D.; Langmead, B.; Salzberg, S.L. Hisat2. Nat. Methods 2015, 12, 357–360. [Google Scholar] [CrossRef] [Green Version]
  13. Love, M.I.; Huber, W.; Anders, S. Moderated Estimation of Fold Change and Dispersion for RNA-Seq Data with DESeq2. Genome Biol. 2014, 15, 550. [Google Scholar] [CrossRef] [PubMed] [Green Version]
  14. Lamour, K.H.; Stam, R.; Jupe, J.; Huitema, E. The Oomycete Broad-Host-Range Pathogen Phytophthora capsici. Mol. Plant Pathol. 2012, 13, 329–337. [Google Scholar] [CrossRef]
  15. Li, Y.; Yu, T.; Wu, T.; Wang, R.; Wang, H.; Du, H.; Xu, X.; Xie, D.; Xu, X.M. The Dynamic Transcriptome of Pepper (Capsicum annuum) Whole Roots Reveals an Important Role for the Phenylpropanoid Biosynthesis Pathway in Root Resistance to Phytophthora capsici. Gene 2020, 728, 144288. [Google Scholar] [CrossRef] [PubMed]
  16. Zhang, H.X.; Ali, M.; Feng, X.H.; Jin, J.H.; Huang, L.J.; Khan, A.; Lv, J.G.; Gao, S.Y.; Luo, D.X.; Gong, Z.H. A Novel Transcription Factor CaSBP12 Gene Negatively Regulates the Defense Response against Phytophthora capsici in Pepper (Capsicum annuum L.). Int. J. Mol. Sci. 2019, 20, 48. [Google Scholar] [CrossRef] [PubMed] [Green Version]
  17. Wang, J.E.; Liu, K.K.; Li, D.W.; Zhang, Y.L.; Zhao, Q.; He, Y.M.; Gong, Z.H. A Novel Peroxidase CanPOD Gene of Pepper Is Involved in Defense Responses to Phytophthora capsici Infection as well as Abiotic Stress Tolerance. Int. J. Mol. Sci. 2013, 14, 3158–3177. [Google Scholar] [CrossRef]
  18. Alcázar, M.D.; Egea, C.; Espín, A.; Candela, M.E. Peroxidase Isoenzymes in the Defense Response of Capsicum annuum to Phytophthora capsici. Physiol. Plant. 1995, 94, 736–742. [Google Scholar] [CrossRef]
  19. Jin, J.H.; Zhang, H.X.; Tan, J.Y.; Ming-Jia, Y.; Li, D.W.; Khan, A.; Gong, Z.H. A New Ethylene-Responsive Factor CaPTI1 Gene of Pepper (Capsicum annuum L.) Involved in the Regulation of Defense Response to Phytophthora capsici. Front. Plant Sci. 2016, 6, 1217. [Google Scholar] [CrossRef]
  20. Yong, H.C.; Chang, H.S.; Gupta, R.; Wang, X.; Zhu, T.; Luan, S. Transcriptional Profiling Reveals Novel Interactions between Wounding, Pathogen, Abiotic Stress, and Hormonal Responses in Arabidopsis. Plant Physiol. 2002, 129, 661–677. [Google Scholar] [CrossRef] [Green Version]
  21. Kazan, K.; Manners, J.M. MYC2: The Master in Action. Mol. Plant 2013, 6, 686–703. [Google Scholar] [CrossRef] [Green Version]
  22. Fernández-Calvo, P.; Chini, A.; Fernández-Barbero, G.; Chico, J.M.; Gimenez-Ibanez, S.; Geerinck, J.; Eeckhout, D.; Schweizer, F.; Godoy, M.; Franco-Zorrilla, J.M.; et al. The Arabidopsis BHLH Transcription Factors MYC3 and MYC4 Are Targets of JAZ Repressors and Act Additively with MYC2 in the Activation of Jasmonate Responses. Plant Cell 2011, 23, 701–715. [Google Scholar] [CrossRef] [Green Version]
  23. Wasternack, C. Jasmonates in Plant Growth and Stress Responses. In Phytohormones: A Window to Metabolism, Signaling and Biotechnological Applications; Springer: Berlin/Heidelberg, Germany, 2014; ISBN 9781493904914. [Google Scholar]
  24. Zhang, H.; Memelink, J. Regulation of Secondary Metabolism by Jasmonate Hormones. In Plant-Derived Natural Products: Synthesis, Function, and Application; Springer: Berlin/Heidelberg, Germany, 2009. [Google Scholar]
  25. Pauwels, L.; Barbero, G.F.; Geerinck, J.; Tilleman, S.; Grunewald, W.; Pérez, A.C.; Chico, J.M.; Bossche, R.V.; Sewell, J.; Gil, E.; et al. NINJA Connects the Co-Repressor TOPLESS to Jasmonate Signalling. Nature 2010, 464, 788–791. [Google Scholar] [CrossRef] [PubMed] [Green Version]
Figure 1. Venn diagrams display the overlapping of differential expressed genes (DEGs) identified at 12 and 24 h with each treatment. Na: Nacobbus aberrans treatment. Pc: Phytophthora capsici treatment. NaPc: Phytophthora capsici treatment after Nacobbus aberrans treatment. Numbers represent the total genes for each group.
Ijpb 13 00015 g001
Figure 2. Differential gene expression of treatments with N. aberrans and Phytophthora capsici against control plants at 12 and 24 h. Na: Nacobbus aberrans treatment. Pc: Phytophthora capsici treatment. NaPc: Phytophthora capsici treatment after Nacobbus aberrans treatment. C: Control plants. Green: downregulated genes. Blue: upregulated genes. Orange: Mean genes. p < 0.01.
Ijpb 13 00015 g002
Figure 3. Genes expressed differentially in each condition. Heatmap of top 25 genes expressed differentially in Na (Nacobbus aberrans), Pc (Phytophthora capsici), and NaPc (Nacobbus aberrans /Phytophthora capsici) treatments versus control (C). S1–S3: Samples analyzed. Identification of upregulated (yellow) and downregulated (purple) gene clusters.
Ijpb 13 00015 g003
Figure 4. Gene ontology analysis of total differentially expressed genes. GO terms from differentially expressed genes were identified in all the conditions obtained by Panther Analysis.
Ijpb 13 00015 g004
Figure 5. GO enrichment analysis from top 25 upregulated genes. FDR analysis in yellow/purple gradient being darker closer to 0. Fold enrichment (bubble size) is assigned to each KEGG pathway. p < 0.05.
Ijpb 13 00015 g005
Figure 6. GO enrichment analysis from top 25 downregulated genes. FDR analysis in yellow/purple gradient being darker closer to 0. Fold enrichment (bubble size) is assigned to each KEGG pathway. p < 0.05.
Ijpb 13 00015 g006
Table 1. Defense response-related genes expressed differentially with the treatments. Log2 fold change gene expression of upregulated (green) and downregulated (red) genes. Genes with no significant differential expression (when p > 0.01) were indicated with a dash (―).
Gene IDProduct12 h24 h
NAPcNaPcNaPcNaPc
T459_00160Putative WRKY transcription factor 46−1.07
T459_00863Transcription factor MYC2 −0.42
T459_01614Lignin-forming anionic peroxidase−1.62
T459_04029Transcription factor MYC2 0.78
T459_05301Putative WRKY transcription factor 71−1.34−1.08
T459_05748G-type lectin S-receptor-like serine/threonine-protein kinase RKS12.83
T459_05984Peroxidase 71.36
T459_06293Homeobox-leucine zipper protein ATHB-210.780.72−0.55
T459_06371Galactinol synthase 2−5.17−4.85−2.531.63−2.81
T459_10498Late embryogenesis abundant protein Dc3 −7.82−7.95 −7.12
T459_10725Pathogenesis-related protein PR-51.080.881.19
T459_11521Caffeoyl-CoA O-methyltransferase0.49
T459_14119SAR8.2 precursor−1.02
T459_14236Inactive leucine-rich repeat receptor-like serine/threonine-protein kinase0.84
T459_14243Leucine-rich repeat receptor-like protein kinase−0.44−1.54−1.23
T459_14321Trypsin and protease inhibitor1.511.692.12
T459_20142Protochlorophyllide reductase 1.01 0.00
T459_21467Putative WRKY transcription factor 13−3.69
T459_22169Pathogenesis-related protein PR-4B−3.70−4.63
T459_22749Pathogenesis-related protein 1B−3.29−3.03−3.95
T459_25133Transcription factor MYC2−3.69−3.34−1.671.69
T459_25133Transcription factor MYC3−3.69 −3.34−1.671.69
T459_30069Putative WRKY transcription factor 56−2.98−3.24
T459_31175Pathogenesis-related protein STH-21−2.25−2.19
T459_31889Pathogenesis-related protein 1B1.12
T459_332831,4-Dihydroxy-2-naphthoyl-CoA synthase 1.80 0.00
T459_33509Putative cinnamyl alcohol dehydrogenase 10.300.80
Publisher’s Note: MDPI stays neutral with regard to jurisdictional claims in published maps and institutional affiliations.

