1. Introduction
Tropical coral reefs are complex holobiont systems, or metaorganisms, composed of the cnidarian host and a diverse consortium of symbiotic algae (Symbiodiniaceae), bacteria, archaea, fungi, and viruses [
1,
2,
3,
4]. This integrated biological unit relies on tightly coupled metabolic interactions that sustain high productivity in nutrient-poor (oligotrophic) marine environments [
5,
6,
7]. While photosynthetic endosymbionts provide most of the host’s energetic requirements through carbon translocation, the associated prokaryotic microbiome plays a critical role in maintaining holobiont health, stability, and resilience [
3,
4,
8]. These microbial symbionts contribute to key biogeochemical processes, including nitrogen fixation, carbon cycling, and sulfur metabolism, and can enhance host defense through the production of antimicrobial compounds and the competitive exclusion of pathogens [
8,
9,
10].
The coral microbiome is highly diverse and structured, often comprising thousands of bacterial taxa that differ markedly from surrounding seawater communities and are shaped by host identity and microhabitat [
1,
11,
12]. Microbial assemblages are spatially organized across distinct coral compartments, including the surface mucus layer, host tissues, and the calcium carbonate skeleton, each representing unique physicochemical niches [
2,
3,
13]. This compartmentalization promotes functional specialization; for example, diazotrophic bacteria supplement nitrogen-limited environments, while mucus-associated communities act as a first line of defense against opportunistic pathogens [
9,
14,
15,
16].
Increasing evidence supports the existence of a core microbiome, defined as a subset of stable and persistent microbial taxa consistently associated with a given host [
11,
17,
18,
19]. These microbial associations are often host-specific, with distinct bacterial signatures observed even among closely related coral taxa [
1,
17]. A well-characterized example is the genus
Endozoicomonas, frequently dominant within coral tissues and implicated in nutrient exchange and host homeostasis [
18,
20]. Such stable microbial partnerships underpin coral resilience and adaptability, supporting frameworks such as the Coral Probiotic Hypothesis, which proposes that dynamic shifts in microbial communities can enhance holobiont acclimatization to environmental stress [
21,
22,
23].
Despite these advances, important knowledge gaps remain regarding coral microbiomes across different geographic regions. Most studies have focused on reef systems in the Indo-Pacific and Caribbean [
24], whereas the Eastern Pacific, including the Gulf of California, remains comparatively understudied and is characterized by distinct environmental conditions and reduced coral diversity. These unique environmental gradients may strongly influence both host-associated microbial communities and their functional potential. The study of coral-associated microbial communities has advanced substantially with the development of high-throughput sequencing technologies, particularly 16S rRNA gene amplicon sequencing [
2,
25,
26]. In parallel, modern bioinformatic approaches, such as the DADA2 algorithm, enable high-resolution inference of exact amplicon sequence variants (ASVs), thereby improving taxonomic resolution and reproducibility compared with traditional operational taxonomic units (OTUs) [
27]. Additionally, predictive metagenomic tools such as PICRUSt and PICRUSt2 make it possible to infer functional potential from marker gene data, providing insight into the metabolic pathways associated with microbial communities [
17,
28,
29]. Together, these approaches have significantly improved our understanding of microbial community structure and function, although they remain limited by the coverage of reference databases and the accuracy of functional predictions.
Therefore, the present study aims to characterize the taxonomic composition, community structure, and predicted functional profiles of bacterial communities associated with multiple coral genera in the Gulf of California using 16S rRNA amplicon sequencing and predictive metagenomic approaches. Additionally, we evaluate the existence of a core microbiome and assess host-specific patterns in microbial assemblages, contributing to a broader understanding of coral–microbe interactions in this ecologically distinct region.
2. Materials and Methods
2.1. Sample Collection
Samples from the coral genera
Pocillopora,
Pavona, and
Porites, together with surrounding seawater samples, were collected between 17 and 18 August 2016, from three reef-associated locations within the Gulf of California, Baja California Sur, Mexico: La Gaviota (24°17′19″ N, 110°19′56″ W), Punta Arena (24°03′40″ N, 109°49′52″ W), and Cabo Pulmo National Park (23°22′40″ N, 109°28′03″ W to 23°05′00″ N, 109°05′00″ W). The sampled coral genera comprise five, three, and two described species in the Gulf of California, respectively [
30].
At each location, coral colonies without visible signs of disease, tissue damage, or epiphytic algal overgrowth were randomly selected within an approximately 100 m
2 area. One coral fragment (~30 g) was collected from each of three independent colonies per host genus whenever possible [
31].
Immediately after collection, coral fragments were individually wrapped in sterile aluminum foil, placed into sterile bags, transported on ice to the Laboratorio de Ciencia y Tecnología de Alimentos (LABCyTA, Universidad Autónoma de Baja California Sur), and stored at −85 °C until DNA extraction.
For seawater-associated microbial communities, 20 L of seawater was collected at distances of approximately 1–3 m from each coral colony. In the laboratory, 5 L per sample was processed for microbial biomass recovery and downstream DNA extraction. At the time of collecting the biological material, at each of the sites, the following physicochemical parameters of water were recorded: temperature, pH (Oakton pH tester 10 Eutech instrument, Thermo Fisher Scientific Inc., Waltham, MA, USA), dissolved O2, ammonia, nitrites, nitrates, and phosphates, the latter of which were determined with a commercial spectrophotometric kit (Laboratorios y Servicios Ambientales, Mazatlán Sinaloa, México).
2.2. DNA Extraction and Sequencing
Coral-associated microbial biomass was recovered from coral tissue homogenates using phosphate-buffered saline (PBS) and mechanical disruption following previously described procedures adapted for coral microbiome studies [
31]. Briefly, coral tissue was separated from the skeleton by homogenization, followed by sequential centrifugation steps to remove calcium carbonate debris, host tissue, and algal material. Microbial pellets were subjected to enzymatic lysis using lysozyme and proteinase K prior to DNA purification using the PowerLyzer
® PowerSoil
® DNA Isolation Kit (Mo Bio Laboratories, Carlsbad, CA, USA) according to the manufacturer’s instructions.
For seawater samples, microbial biomass was collected by filtration through 0.22 μm membranes, followed by DNA extraction using the Wizard® Genomic DNA Purification Kit (Promega Corporation, Madison, WI, USA). DNA quality and concentration were evaluated by agarose gel electrophoresis and spectrophotometric quantification prior to library preparation.
Genomic DNA from coral and seawater samples was sent to Argonne National Laboratory (Argonne, IL, USA) for 16S rRNA gene sequencing. The V4 region of the 16S rRNA gene was amplified using the primer pair 515F (5′-GTGCCAGCMGCCGCGGTAA-3′) and 806R (5′-GGACTACHVGGGTWTCTAAT-3′), following the protocol described by Kozich et al. (2013) [
32]. Amplicons were sequenced using a MiSeq 500-cycle Kit (Illumina Inc., San Diego, CA, USA) on an Illumina MiSeq platform (Illumina Inc., San Diego, CA, USA), generating paired-end reads (2 × 150 bp).
2.3. Sequence Processing and Quality Control
Raw paired-end reads were processed using the QIIME2 platform (version 2025.7) [
33]. Quality filtering, denoising, merging of paired reads, and chimera removal were performed using the DADA2 algorithm [
26], enabling high-resolution inference of exact amplicon sequence variants (ASVs). Truncation parameters were selected based on quality score profiles (forward: 145 bp; reverse: 145 bp) to ensure sufficient overlap between reads while maximizing sequence retention. Sequences assigned to mitochondria, chloroplasts, and non-bacterial taxa were removed. Additional filtering of host-derived sequences was performed using VSEARCH [
34] against a curated reference database containing mitochondrial sequences from representative coral genera, constructed from publicly available NCBI sequences. Final curation and data handling were performed in R (version 4.4.1) using the phyloseq package [
35]. Feature tables and representative sequences were generated, and sequencing statistics were evaluated to confirm overall data quality. The resulting ASVs had a mean length of approximately 252 bp, consistent with the expected size of the 16S rRNA gene V4 region.
2.4. Taxonomic Classification
Taxonomic classification of ASVs was performed using a naïve Bayes classifier implemented in QIIME2 [
36], trained against the SILVA ribosomal RNA gene database (release 138) [
37]. Because the V4 region of the 16S rRNA gene was amplified using primers 515F/806R, reference sequences were trimmed to the corresponding amplified region prior to classifier training to improve classification accuracy. The classifier was trained using the QIIME2 feature-classifier fit-classifier-naive-bayes plugin and applied to representative sequences using classify-sklearn. Taxonomic assignments were generated across multiple hierarchical levels (phylum to genus) for downstream ecological and statistical analyses.
2.5. Diversity Analyses
2.5.1. Alpha Diversity
Within-sample diversity was assessed using observed richness, Shannon diversity [
38], Simpson diversity [
39], and Pielou’s evenness [
40].
Statistical differences among groups were evaluated using the Kruskal–Wallis test. When significant differences were detected, pairwise comparisons were performed using Dunn’s test with Benjamini–Hochberg correction.
2.5.2. Beta Diversity
Between-sample diversity was evaluated using Bray–Curtis dissimilarity [
41] and weighted UniFrac distances [
42]. Principal coordinates analysis (PCoA) was used to visualize patterns in microbial community composition.
Differences in community structure among groups were tested using permutational multivariate analysis of variance (PERMANOVA) implemented in the adonis2 function. Homogeneity of group dispersions was assessed using PERMDISP [
43] to ensure that observed differences were not driven by differences in dispersion.
2.6. Statistical Analyses and Visualization
All statistical analyses and visualizations were performed in R (version 4.4.1) within a reproducible analytical workflow. Microbial community analyses were conducted primarily using the phyloseq package [
34] and the vegan package [
44]. Data manipulation and visualization were performed using the ggplot2 [
45], dplyr, and microbiome R packages [
46].
2.7. Taxonomic Composition and Core Bacteriome
Relative abundance analyses were performed to characterize taxonomic composition across samples. Taxa were summarized at the genus level and visualized as bar plots of mean relative abundance. The core bacteriome was defined independently for each coral host genus as taxa present in at least 70% of samples with a mean relative abundance of at least 0.1%. This approach allowed the identification of consistently associated microbial taxa across host-specific communities.
2.8. Differential Abundance Analysis
Differentially abundant bacterial taxa among host genera were identified using ANCOM-BC, which accounts for compositional biases inherent to microbiome data [
47]. Analyses were performed at the genus level, with the host genus included as the main explanatory variable.
p-values were adjusted using the Benjamini–Hochberg procedure, and taxa with q < 0.05 were considered significantly differentially abundant. Structural zeros were handled using the default parameters implemented in ANCOM-BC.
2.9. Functional Prediction (PICRUSt2)
The functional potential of microbial communities was inferred using PICRUSt2 [
28] based on ASV sequences and abundance tables exported from QIIME2. The PICRUSt2 pipeline was run using default parameters to predict gene family abundances, which were subsequently collapsed into MetaCyc pathways. Nearest Sequenced Taxon Index (NSTI) values were calculated to assess the reliability of functional predictions.
Both unstratified and stratified pathway abundance tables were generated. Stratified outputs were used to link predicted metabolic pathways to contributing taxa, enabling the identification of potential taxonomic drivers of functional variation among host-associated bacterial microbiomes.
Predicted pathway abundances were normalized to relative abundance prior to downstream analyses. Differences in pathway abundance among host genera were evaluated using ANCOM-BC with Benjamini–Hochberg correction (q < 0.05). Multivariate patterns in predicted functional profiles were explored using Bray–Curtis dissimilarity and principal coordinates analysis (PCoA). Because PICRUSt2 predictions are derived from 16S rRNA gene data, functional interpretations were considered as inferred metabolic potential rather than direct measurements of microbial activity.
3. Results
3.1. Physicochemical Parameters Across Study Sites
The measured physicochemical parameters showed no marked differences among the study sites. Overall, water conditions remained within narrow ranges across locations.
The physicochemical parameters were recorded during sampling and are summarized in
Table S14 as supplementary descriptive information to contextualize the environmental conditions of the studied sites, including temperature, salinity, pH, dissolved oxygen, nitrates, nitrites, and phosphates. Although slight differences were observed between locations in variables such as salinity, temperature, and nutrients, the microbial composition analyses indicated that geographic location did not have a significant effect on the structure of the bacterial communities (PERMANOVA, R
2 = 0.068,
p = 0.276). In contrast, host identity explained a considerably larger proportion of the observed variation (R
2 = 0.321,
p = 0.001).
3.2. Sequencing Output and Dataset Structure
A total of 1,133,801 raw reads were obtained across all samples. After quality filtering, denoising, merging, and chimera removal, 978,568 high-quality reads were retained, representing 86.3% of the initial dataset. Subsequent taxonomic filtering and removal of host-derived mitochondrial sequences resulted in 2937 ASVs. Additional curation in R further reduced the dataset to 2629 ASVs prior to sample filtering. After excluding low-depth samples (<4000 reads) and applying rarefaction to 4000 reads per sample, the final dataset used for downstream ecological analyses consisted of 2181 ASVs across 35 samples. Overall, the processing pipeline maintained high data quality while preserving sufficient sequencing depth and sample representation for downstream ecological analyses (
Tables S1 and S2; Figure S1). BioProject accession number (PRJNA1467001) and associated sequence data are publicly available through the NCBI Sequence Read Archive (SRA):
https://www.ncbi.nlm.nih.gov/sra/PRJNA1467001 (accessed on 15 May 2026).
3.3. Alpha Diversity Patterns
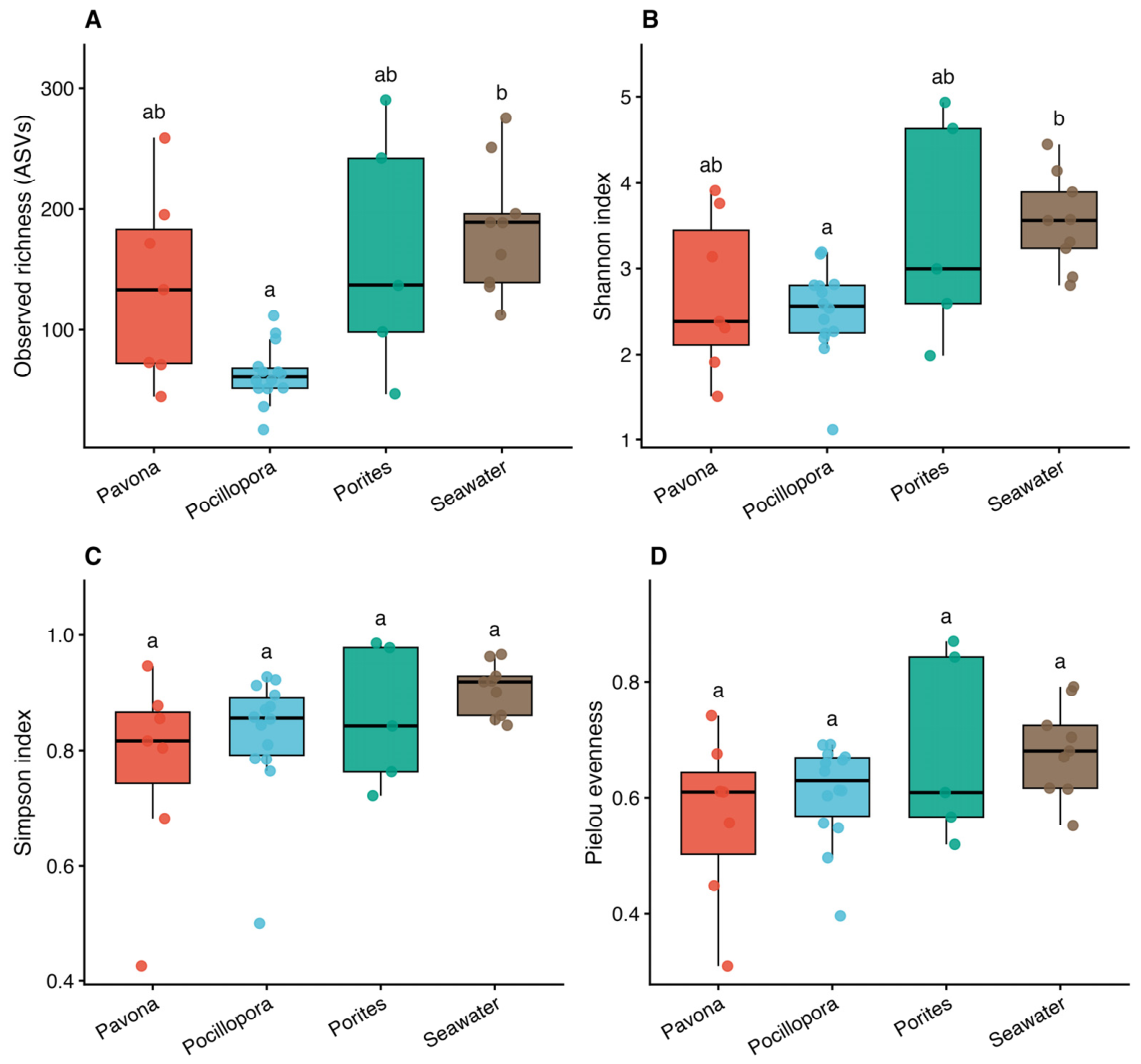
Alpha diversity differed significantly among groups (
Figure 1). Observed richness varied across host genera and seawater samples (Kruskal–Wallis,
p < 0.001), with seawater samples exhibiting higher richness compared to coral-associated bacteriomes, while
Pocillopora showed the lowest number of ASVs. Shannon diversity also differed significantly among groups (
p < 0.01), reflecting variation in both richness and evenness. In contrast, Simpson diversity and Pielou’s evenness showed less pronounced variation, although trends across groups were consistent with those observed for Shannon diversity. Overall, these results indicate differences in within-sample diversity between coral-associated and seawater bacterial communities (see also
Figures S2 and S3; Tables S3–S5).
3.4. Beta Diversity and Community Structure
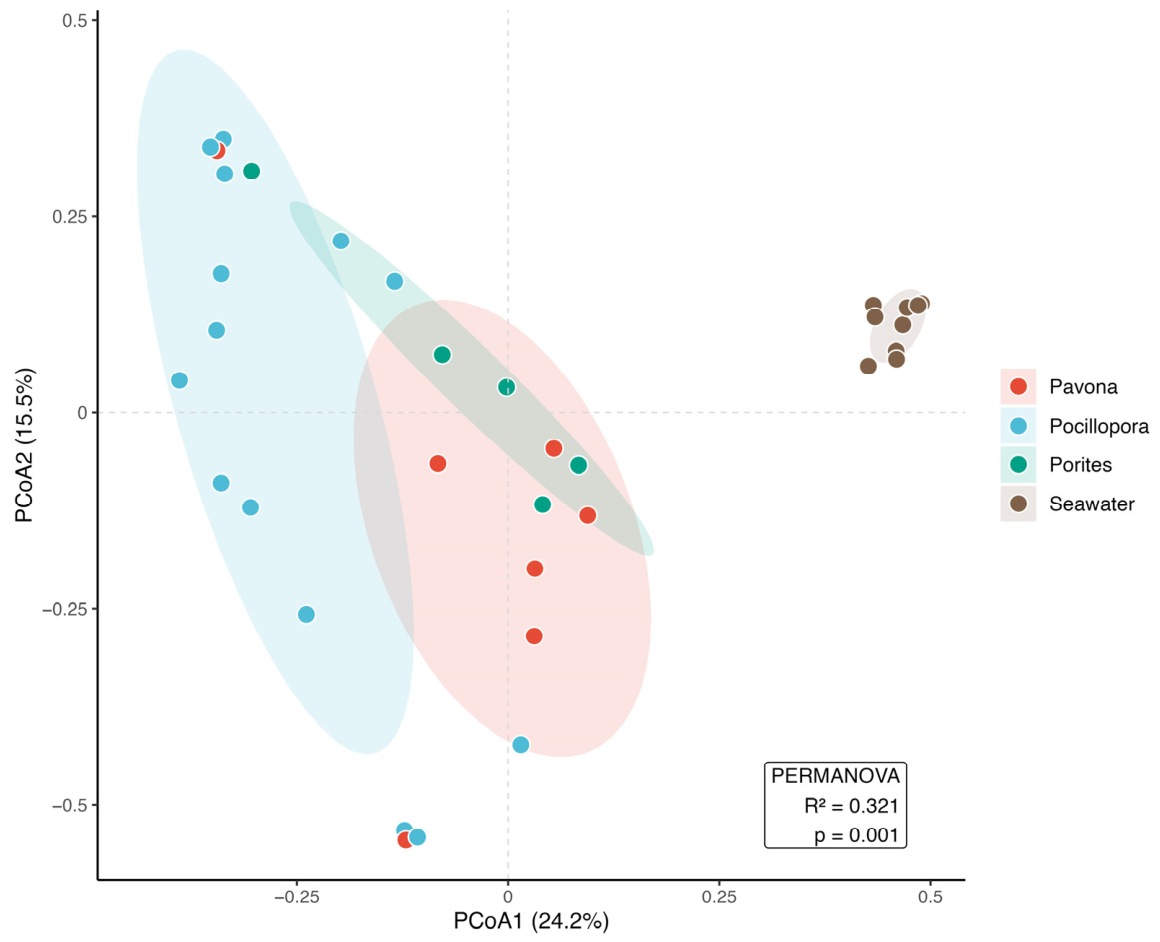
Microbial community composition differed significantly among host genera (PERMANOVA, R
2 = 0.321,
p = 0.001;
Table 1;
Figure 2;
Table S6). Sample type (coral vs. seawater) also explained a significant proportion of the variation (R
2 = 0.215,
p = 0.001), whereas sampling location had no significant effect (R
2 = 0.068,
p = 0.276). Principal coordinates analysis (PCoA) based on Bray–Curtis dissimilarity revealed clear separation of samples according to host genus, including distinct clustering of seawater samples relative to coral-associated bacteriomes (
Figure 2; see also
Figures S4 and S5).
PERMDISP analysis showed no significant differences in dispersion among host genera (
Table S7), indicating that the observed differences in community composition were driven by shifts in centroid position rather than differences in within-group variability. Together, these results indicate that host identity is the primary factor structuring microbial community composition.
3.5. Taxonomic Composition
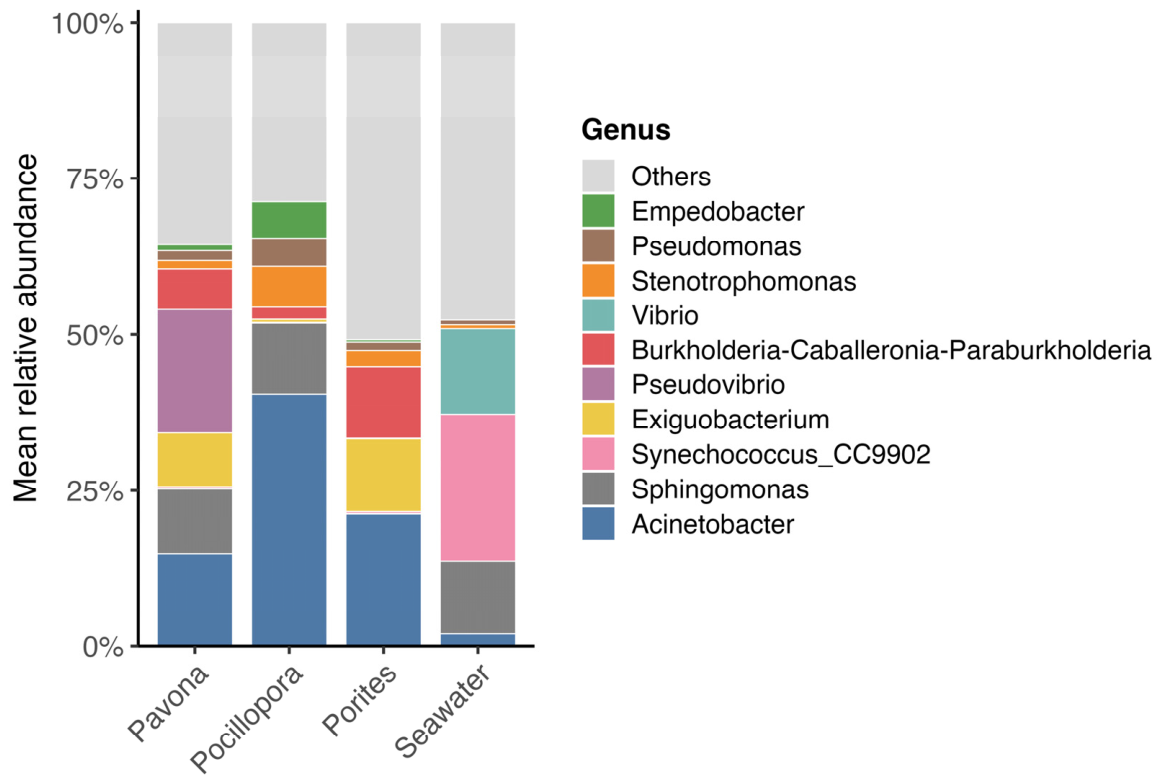
The taxonomic composition of microbial communities varied markedly across coral host genera and seawater samples (
Figure 3). At the genus level, communities were dominated by a set of recurrent taxa, including
Acinetobacter,
Sphingomonas,
Pseudomonas, and
Stenotrophomonas. Despite being shared across hosts, the relative abundance of these genera differed substantially among groups. For instance,
Pseudomonas and
Acinetobacter were more abundant in seawater samples, whereas coral-associated bacteriomes exhibited a more even distribution of dominant taxa. These patterns indicate that, while a common pool of bacterial taxa is present across environments, their relative abundances are structured by host identity, leading to distinct microbial assemblages associated with each coral genus. Similar trends were observed at higher taxonomic levels, with Proteobacteria dominating across all groups, although the relative contributions of other phyla varied among hosts (
Figure S6). Greater variability at the individual-sample level further highlights within-group heterogeneity (
Figures S7 and S8).
3.6. Core Bacteriome
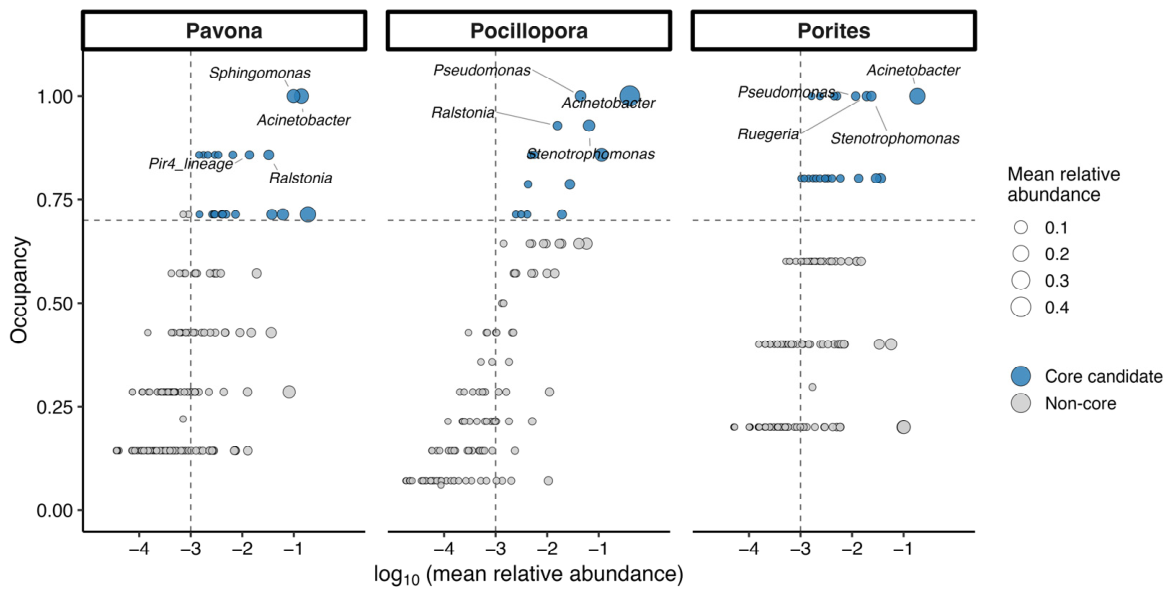
Core bacterial microbiome analysis revealed both shared and host-specific bacterial taxa across coral genera (
Figure 4;
Table S8). A subset of genera was consistently detected across all hosts, with
Acinetobacter exhibiting 100% prevalence in all coral genera and the highest relative abundance, particularly in
Pocillopora, indicating a strong and conserved association.
In contrast, several genera displayed host-specific patterns. Pseudovibrio was exclusively detected in Pavona, whereas Ruegeria and Subgroup_10 were restricted to Porites. Stenotrophomonas showed high prevalence in both Pocillopora and Porites but was absent from Pavona. Similarly, Sphingomonas was present across hosts but exhibited higher abundance in Pavona and Pocillopora.
Overall, while a conserved microbial core is present across coral genera, substantial differences in taxon composition and relative abundance indicate host-specific structuring of the core bacteriome. Core bacteriome composition varied not only in relative abundance but also in taxonomic membership across hosts, reflecting both stability and host-driven differentiation in microbial associations.
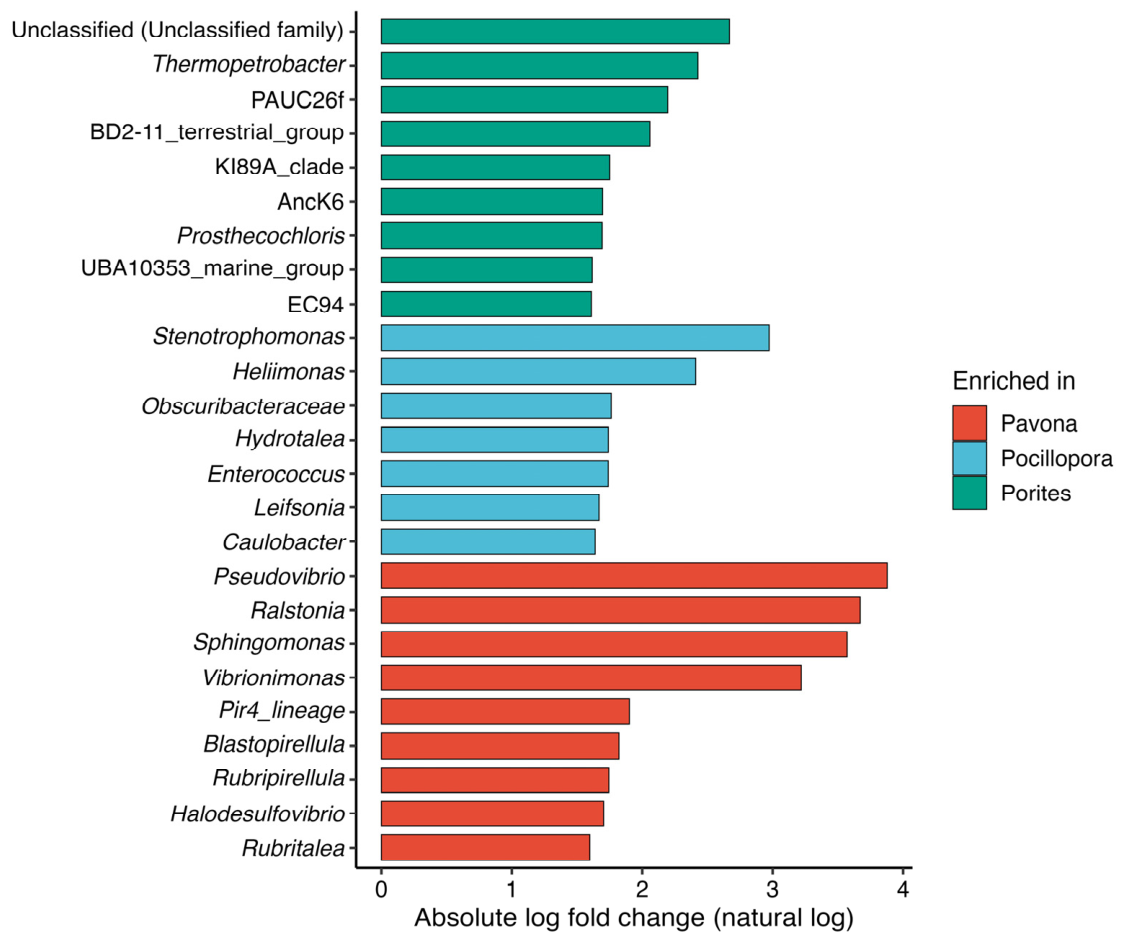
3.7. Differentially Abundant Taxa
Differential abundance analysis identified multiple bacterial genera that varied significantly among coral host genera (ANCOM-BC, q < 0.05;
Figure 5;
Table S9). Distinct microbial signatures were observed across hosts, with several taxa showing consistent enrichment or depletion relative to
Pavona.
Notably, genera such as Stenotrophomonas and Subgroup_10 were enriched in Porites, whereas Pseudovibrio showed higher abundance in Pocillopora. Conversely, taxa including Ralstonia and Sphingomonas exhibited reduced abundance in specific host comparisons, indicating differential host-associated selection patterns.
These patterns are consistent with the taxonomic composition and core bacteriome analyses, reinforcing the role of host identity as a key driver of bacterial community differentiation and highlighting consistent host-associated shifts in bacterial composition.
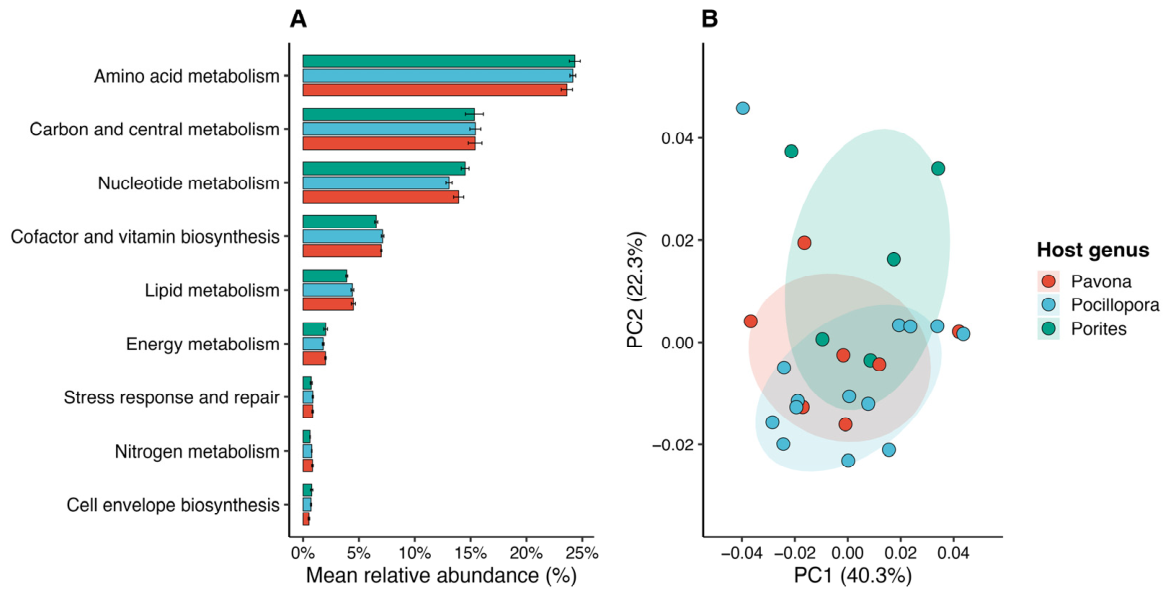
3.8. Functional Potential of Microbial Communities
Predicted functional profiles differed among coral host genera (
Figure 6). The most abundant predicted pathways were primarily associated with central metabolic functions, including amino acid biosynthesis, cofactor and vitamin biosynthesis, carbohydrate metabolism, energy metabolism, lipid metabolism, and nucleotide metabolism. These broad functional categories were consistently detected across coral-associated bacteriomes, suggesting the presence of a conserved functional core. Complete MetaCyc pathway descriptions and functional category assignments are provided in
Table S10, while summary abundance values for functional categories are provided in
Table S11.
Principal coordinates analysis (PCoA) based on Bray–Curtis dissimilarity revealed clustering patterns associated with host identity, indicating that taxonomic differences among coral-associated bacterial communities were accompanied by shifts in predicted functional potential.
Functional composition differed significantly among coral host genera (PERMANOVA, R
2 = 0.152,
p = 0.023;
Table S12), whereas no significant differences in dispersion were detected (PERMDISP,
p = 0.748;
Table S13). These results indicate that differences in predicted functional profiles were driven by shifts in bacterial community structure rather than by within-group variability.
3.9. Differential Metabolic Pathways
Differential abundance analysis of PICRUSt2-predicted MetaCyc pathways identified multiple pathways that varied significantly among coral host genera (ANCOM-BC, q < 0.05;
Figures S9–S13; Table S10). Although these differences suggest host-associated shifts in inferred metabolic potential, the overall functional repertoire remained largely conserved across hosts. Because these functional profiles were inferred from 16S rRNA gene data, the results should be interpreted as predicted metabolic potential rather than direct measurements of microbial activity.
3.10. Taxonomic Associations with Predicted Metabolic Pathways
PICRUSt2 stratified analyses indicated that similar predicted metabolic pathways were associated with different bacterial genera across coral hosts (
Figure S14). Although broad functional categories remained relatively conserved, the relative taxonomic associations varied among host genera, suggesting that distinct microbial assemblages may be linked to comparable inferred metabolic profiles. These patterns are consistent with the concept of functional redundancy within coral-associated microbiomes.
4. Discussion
The present study demonstrates that coral host identity is the primary driver of bacterial community structure in Scleractinia corals from the Gulf of California, whereas geographic location had no significant influence. This pattern is consistent with the concept of host filtering and microbial selection, whereby the physiological and biochemical environment of the coral host shapes its associated microbiota [
1,
2,
3]. In contrast, surrounding seawater exhibited higher alpha diversity and distinct taxonomic composition, while coral-associated bacterial communities were characterized by a more constrained and specialized set of taxa. This clear separation from environmental microbial pools indicates that coral genera in this region maintain distinct microbial signatures [
2]. The lack of a significant geographic effect observed in the beta-diversity analyses suggests that host-associated selective processes outweigh local environmental variability at the spatial scale examined. Coral-associated bacteriomes likely originate from environmental microbial pools but are subsequently structured by host-associated selection, as coral tissues and mucus create selective microenvironments that promote the establishment of specific microbial assemblages [
3,
48,
49]. These results were consistently observed across multiple analytical levels, including diversity metrics, taxonomic composition, core microbiome structure, and predicted functional profiles, reinforcing the central role of host identity. Overall, these findings are consistent with previous studies reporting strong host-associated structuring of coral microbiomes across diverse reef systems [
1,
2,
3,
13,
50].
Host identity influenced bacterial community structure across multiple levels of organization. In particular, the lower observed richness in
Pocillopora compared to other genera and seawater may reflect stronger host-associated filtering or the dominance of specific taxa within this host. This pattern likely reflects selective processes within the coral holobiont, where only a subset of environmentally available bacteria can successfully establish and persist [
3]. The clear clustering of
Pavona,
Pocillopora, and
Porites in beta-diversity analyses further supports host-driven structuring. This pattern is consistent with phylosymbiosis, where microbial community composition reflects host identity, and it has been reported in other coral systems [
13,
50]. The consistency of these patterns across sampling locations suggests that host-associated selective processes are maintained despite environmental variability in the Gulf of California. Although the mechanisms underlying this structuring remain unresolved, differences in host physiology, mucus composition, surface microhabitats, and host–microbe interactions may contribute to the selection of distinct bacterial assemblages among coral genera [
3,
48]. Given the important roles that coral-associated microorganisms play in holobiont functioning, nutrient cycling, and stress resilience, variation in microbial assemblages among coral hosts may reflect differences in the ecological niches provided by each host species [
3,
48].
Core bacteriome analysis revealed the coexistence of ubiquitous and host-specific taxa, highlighting a balance between stability and differentiation. The genus
Acinetobacter was consistently detected across all coral genera with high prevalence, indicating a stable association within the coral microbiome, as reported in previous studies [
11,
51]. In contrast, other taxa showed clear host-specific patterns, such as
Pseudovibrio in
Pavona and
Ruegeria in
Porites. Additional genera, including
Stenotrophomonas and
Sphingomonas, exhibited differential prevalence and abundance among hosts. These patterns indicate that the coral microbiome is not composed of a fixed set of taxa but rather a combination of conserved and host-associated components [
17]. This pattern supports the concept of a flexible core microbiome, in which stability and host specificity coexist within coral-associated microbial communities. This interpretation is further supported by the differential abundance analysis, which identified distinct bacterial signatures across coral genera.
Functional predictions based on PICRUSt2 suggested that taxonomic differences among coral hosts were accompanied by differences in inferred metabolic profiles. However, these predictions should be interpreted cautiously, as they represent potential functions derived from reference genomes rather than direct measurements of microbial activity [
28]. The dominance of pathways related to central metabolism across all hosts likely reflects a conserved predicted functional core common to bacterial communities. At the same time, variation in predicted pathway composition among hosts suggests that different microbial assemblages may be associated with broadly similar inferred functional profiles. This pattern is consistent with functional redundancy, where distinct taxa may be linked to comparable metabolic capabilities [
52]. These findings suggest that different coral hosts may harbor distinct bacterial assemblages while maintaining broadly similar predicted metabolic functions. This interpretation is consistent with the Coral Probiotic Hypothesis, which proposes that shifts in microbial community composition may help maintain host-associated functions under changing conditions [
21,
22]. For instance, the association of genera such as
Pseudovibrio with multiple predicted pathways may reflect potential involvement in host-associated interactions [
53], although functional validation is required. Importantly, the observed variation in taxonomic composition and functional predictions together indicates that microbial community structure and inferred function are related, although not necessarily in a one-to-one manner.
These findings have important ecological implications for coral reef systems in the Gulf of California, a region characterized by strong environmental variability and comparatively limited microbiome data [
29]. The stability of host-specific microbial patterns across locations suggests that these associations are relatively robust under local environmental conditions. In the context of the Coral Probiotic Hypothesis, such patterns may indicate that microbiome flexibility operates within host-defined boundaries rather than through unrestricted shifts in community composition [
21,
22]. Overall, the combination of a conserved microbial and functional core with host-specific differentiation highlights the coexistence of stability and flexibility within the coral holobiont. These host-specific microbial associations may be relevant for conservation and restoration initiatives, as different coral taxa may harbor distinct microbial assemblages that contribute to holobiont functioning. Understanding these patterns may also improve predictions of coral responses to environmental stress and change. This study provides a regional baseline for understanding coral–microbe interactions in the eastern Pacific and contributes to broader efforts to predict coral responses to environmental change.
5. Conclusions
Coral-associated microbial communities in the Gulf of California are primarily structured by host identity rather than geographic location, indicating strong host-driven selection processes. Across all coral genera, a conserved microbial and predicted functional core was observed, dominated by central metabolic pathways, while distinct host-specific taxonomic assemblages were associated with differences in community composition and inferred metabolic profiles.
The coexistence of stability and host-specific differentiation suggests that coral microbiomes are both resilient and adaptable, supporting the concept of a flexible core microbiome. Although functional predictions indicated a largely conserved metabolic repertoire, variation in taxonomic contributors highlights the importance of community structure in shaping potential ecological functions.
In the context of the Coral Probiotic Hypothesis, these findings suggest that microbiome-mediated responses may operate within host-defined boundaries, where shifts in microbial composition contribute to functional plasticity without altering core metabolic capabilities. This study provides a baseline for understanding coral–microbe interactions in the eastern Pacific and contributes to predicting how coral holobionts may respond to environmental change.




 ,
,