Article

Potential Association Between Glucosamine Supplementation and Gut Microbiota Composition in Middle-Aged Japanese Adults: A Cross-Sectional Analysis Using 16S rRNA Sequencing


Toyo Institute of Food Technology, 23-2 Minami-Hanayashiki 4-Chome, Kawanishi 666-0026, Hyogo, Japan
Microbiol. Res. 2026, 17(6), 103; https://doi.org/10.3390/microbiolres17060103
Submission received: 7 April 2026 / Revised: 22 May 2026 / Accepted: 24 May 2026 / Published: 27 May 2026

Abstract

Background: This study examined potential associations between daily glucosamine (GlcN) use and the gut microbiota. Methods: In a cross-sectional sample of 200 Japanese adults aged 50–59 (100 regular GlcN users; 100 age- and sex-matched non-users), fecal 16S rRNA profiles were analyzed. α-diversity (richness, Shannon index) and β-diversity were compared; predominant genera (>1% mean abundance) were evaluated, and differential abundance was tested using ANCOM and LEfSe. A subgroup analysis assessed normal-BMI participants (18.5–25.0). Results: Overall α-diversity and β-diversity did not differ between users and non-users. Of the >150 genera detected, 22 exceeded 1% mean abundance, and their profiles were virtually identical across groups; neither ANCOM nor LEfSe identified taxa with significant differential abundance. In the normal-BMI subgroup, GlcN users showed lower species richness and a reduced prevalence of rare taxa (<10,000 total reads), with a decrease in Christensenella, which is consistent with prior intervention studies. Given reports linking Christensenella to lower frailty in specific contexts, these findings suggest a potential GlcN-related effect relevant to joint health. Conclusions: Habitual GlcN use was not strongly associated with broad changes in gut microbial diversity or common taxa in middle-aged adults, although it might have some effect on minor taxa. Longitudinal, controlled studies are warranted to confirm these findings and clarify mechanisms.

1. Introduction

The naturally occurring amino sugar ᴅ-glucosamine (GlcN; 2-amino-2-deoxy-ᴅ-glucose) constitutes a monomeric unit of the biopolymer chitosan, which is found in arthropod exoskeletons [1]. GlcN is produced via hydrolysis of crustacean chitosan (Figure S1) and is widely marketed as a nutraceutical, primarily for alleviating osteoarthritis and joint pain [2]. However, clinical evidence for its efficacy in joint health remains mixed, with only modest or inconsistent reported benefits of GlcN for osteoarthritis symptoms [3,4]. GlcN that is not absorbed in the small intestine may suppress systemic inflammation, including in the joints, by improving the gut microbiota. Despite the ongoing debate over the musculoskeletal benefits of GlcN, it remains a popular supplement. The supplement has a large number of users and has occasionally been the subject of epidemiological studies [5,6]. Regular GlcN use is associated with reduced all-cause and cardiovascular mortality [5]. Additionally, dietary GlcN extended the lifespan of mice [7] in a preclinical study. However, further investigation of its longevity effects is required [8].
Only a small fraction of orally ingested GlcN is absorbed in the small intestine [9,10,11], and the majority reaches the colon unmetabolized [11,12]. This highlights the possibility of GlcN interacting with the colonic microbiota [13]. Indeed, GlcN can serve as a fermentable substrate for gut microbes, thereby potentially stimulating the production of short-chain fatty acids (SCFAs) [14]. These SCFAs reinforce intestinal barrier integrity, modulate immune responses, influence host energy metabolism, and improve bowel motility [15]. Furthermore, GlcN could exert systemic effects beyond joint health via these microbiota-mediated pathways.
Microbiome changes following GlcN supplementation have been reported. For example, a high GlcN dose (3000 mg/day) trial revealed that GlcN alleviated constipation symptoms; however, no gut microbiome composition changes were observed at the genus level without changing SCFA levels in the fecal sample [12]. In another pilot randomized trial [14], the abundances of four Lachnospiraceae genera, two Prevotellaceae genera, and Desulfovibrio increased after GlcN and chondroitin treatment compared to that under the placebo treatment, whereas the abundance of a member of the Christensenellaceae family decreased after administration of 1500 mg/day GlcN plus chondroitin. In contrast, in a highly reproducible in vitro culture model of the human colonic flora, GlcN increased butyric acid bacteria and butyrate (unpublished results) [16]. These findings led to the hypothesis that GlcN may beneficially modulate the intestinal environment by enriching SCFA-producing bacteria including butyrate-producing bacteria, which could partly explain its health benefits. However, the evidence is based on limited sample sizes and often involves co-supplementation, rendering it difficult to isolate the specific effects of GlcN.
To date, no large-scale cross-sectional studies have examined whether habitual GlcN use is associated with discernible differences in the gut microbiota composition of the general population. Therefore, this study hypothesized that regular GlcN intake is associated with an increased abundance of purported “beneficial” major gut bacteria, such as butyrate producers, and is potentially associated with altered diversity of the gut microbiome. In addition, because extreme body mass index (BMI) perturbs the microbiome [17,18], a subgroup analysis focusing on participants with normal BMI was conducted to determine if GlcN-induced microbiome changes were more evident in metabolically healthy individuals. To test this hypothesis, a cross-sectional analysis was performed using fecal microbiome data from 200 middle-aged Japanese adults. Specifically, 100 GlcN users were compared with 100 non-users matched for age and sex. To the best of the author’s knowledge, this study is the first large-scale cross-sectional study to evaluate the effect of GlcN supplementation on the gut microbiome and highlight the importance of host factors, such as BMI. Therefore, the objective of this study was to explore the association between habitual glucosamine supplement use and gut microbiome composition in middle-aged Japanese adults using 16S rRNA gene sequencing data in a cross-sectional design, including BMI-stratified analyses.

2. Materials and Methods

2.1. Study Design, Setting, and Ethics Approval

A cross-sectional observational study was conducted in Japan to evaluate the association between GlcN supplementation and the gut microbiota. The study protocol was registered in the University Hospital Medical Information Network (UMIN000058208). All data were anonymized and used with permission from the data provider. The study was conducted in accordance with the Declaration of Helsinki (2013) [19] and Japan’s Ethical Guidelines for Medical and Health Research Involving Human Subjects.

2.2. Data Sources

The microbiome and metadata used in this study were obtained from a commercial gut microbiota database provided by Cykinso, Inc. (Tokyo, Japan) [20]. Cykinso Inc. offers a service (“Mykinso”) in which Japanese individuals purchase a stool kit [21]. Their gut microflora is analyzed via 16S rDNA sequencing of the V1–V2 region [22]. As part of the service, participants completed questionnaires on basic attributes, such as age, sex, and BMI, and lifestyle factors (smoking status, alcohol consumption, dietary habits (food content and intake frequency), physical activity, sleep, perceived stress, bowel habits, medical history, medication use, and use of dietary supplements (including glucosamine)) (Table S1). Customers who consented to use of the data were included in the Cykinso microbiome profile database. As of 2023, the database included over 9000 individuals, and the sample size would expand to >56,000 by early 2024 [23]. The utility of the database has been previously demonstrated in some gut microbiome research [21,22,24].

2.3. Data Collection

Cykinso Inc. queried its database (as of 2024) for individuals who met the inclusion criteria. GlcN users were defined as those who answered “Yes” to the lifestyle question “Have you used supplements regularly (4 or more days per week) for at least one month recently?” and who specified “glucosamine” in the supplement free-text field. One hundred eligible GlcN users (50 males and 50 females aged 50–59 years) were randomly selected. Non-users (controls) were then randomly selected from the database and frequency-matched to GlcN users according to sex and age (50 males and 50 females, aged 50–59 years), with matching performed by the database provider to ensure consistency in age and sex distribution. The matching was based on age and sex only, and the timing/season of stool sample collection and other factors could not be used for matching. This study was a secondary analysis of an existing dataset in which each participant provided a single stool sample (one biological sample per individual), and no repeated (longitudinal) samples were available. The 100 controls reported no regular use of any GlcN supplements. Thus, 200 participants (100 GlcN users and 100 non-users) were included. Selection and data retrieval were performed by Cykinso personnel who were blinded to the study hypotheses. De-identified data were provided to the author.
Each participant’s dataset included gender, BMI categories defined by the World Health Organization [25], and 16S rRNA gene sequencing results from their fecal samples. Table S1 provides an overview of the participant selection criteria and metadata fields. The key characteristics of the final cohort (age, sex, and BMI) are summarized in Table 1. Without applying outlier thresholds, the full eligible cohort was analyzed; all data meeting the inclusion criteria were retained, and available-case analyses were performed without imputing missing values.
BMI categories were defined according to the WHO classification provided by the database (underweight, normal, pre-obese, and obese). “Non-obese” refers to underweight/normal, and “obese” refers to BMI ≥ 25 kg/m2 (WHO). The table summarizes the composition of the study cohort. The cohort comprises 100 glucosamine (GlcN) users and 100 non-users, all Japanese adults aged 50–59 years, with an equal gender distribution (50 males and 50 females in each group). Body mass index (BMI) categories were similarly distributed between the groups, with approximately 70% in the normal BMI range (18.5–24.9), 20–25% overweight or pre-obese, and ~5% obese. The groups were matched for basic demographic and health characteristics to minimize confounding factors. GlcN users regularly consumed glucosamine supplements, whereas non-users reported no GlcN intake. Matching and random selection processes aimed to control for potential differences in other lifestyle factors or dietary habits, thereby ensuring comparability for microbiome analysis.
Raw sequence data for all 200 samples (paired-end FASTQ files) were obtained from Cykinso. The 16S rRNA amplicon sequencing reads were deposited in the DNA Data Bank of Japan Sequence Read Archive under BioProject PRJDB20752 with accession numbers DRR698811–DRR699010. All 200 samples passed quality control and were included in the downstream analyses.

2.4. Sequence Data Analysis

Fecal DNA samples were sequenced by targeting the V1–V2 hypervariable region of the bacterial 16S rRNA gene using Illumina MiSeq (San Diego, CA, USA) (paired-end sequencing) per the Mykinso service protocol. Raw reads were processed using the Quantitative Insights into Microbial Ecology 2 (QIIME2, v2022.8) pipeline [26]. Briefly, paired-end reads were merged and quality-filtered. Amplicon sequence variants (ASVs) were inferred using the DADA2 algorithm in QIIME2 [27]. Taxonomy was assigned to each ASV using a naïve Bayes classifier trained on the SILVA 138 database (99% operational taxonomic units [OTU], full-length sequences) for 16S rRNA. Taxonomic classification was performed at the genus level when possible. For clarity, ASVs are simply referred to as OTUs. The final feature table (after quality control) contained 8,750,011 sequence reads across 200 samples, with an average of approximately 24,000 reads per sample (range: approximately 10,000–55,000 reads per sample). All sequencing data processing steps were performed using the default or recommended parameters in QIIME2.

2.5. β and α Diversity Analysis

For beta diversity, between-sample dissimilarities were calculated using the Bray–Curtis index and weighted UniFrac on rarefied OTU count data to capture differences in overall community composition. The QIIME2 beta diversity analytical method was employed [27]. Principal coordinates analysis (PCoA) was used to visualize beta diversity patterns. Group-level separation was tested using permutational multivariate analysis of variance (PERMANOVA; 999 permutations). PERMANOVA results with p < 0.05 were considered statistically significant evidence of community composition differences between GlcN users and controls.
Microbial alpha diversity was assessed using several indices computed in QIIME2. This study focused on three representative measures: OTU richness (the observed number of species-level OTUs per sample as a measure of community richness), Shannon entropy (a diversity index accounting for both richness and evenness), and Faith’s phylogenetic diversity. Group differences in alpha diversity between GlcN users and non-users were evaluated via non-parametric tests (Mann–Whitney U) using GraphPad Prism 9 (GraphPad Software, San Diego, CA, USA). For subgroup analyses (participants with a normal BMI), the same approach was applied within the subgroup.

2.6. Comparison of Relative Abundance of Dominant Genera

To compare taxonomic profiles, the dominant genera in the gut microbiota of the cohort were identified. Genera with a mean relative abundance of >1% (averaged across all 200 samples) were defined as dominant, yielding 22 genera in total. The top 22 genera accounted for the majority of bacterial communities in each sample. The relative abundance of each dominant genus for each individual was computed and compared between the GlcN and control groups. Group comparisons for each genus were performed using Welch’s t-test (two-sided) [28]. An outcome of p < 0.05 was considered significant [29].

2.7. Differential Abundance Analysis

Beyond the most abundant taxa, comprehensive differential abundance analysis was conducted to detect subtle differences in the gut microbiome between groups. First, the analysis of composition of microbiomes (ANCOM) method in QIIME2 was employed [27]. ANCOM evaluates each taxon at the genus or ASV level in a compositional framework and reports a W-statistic that indicates the number of pairwise comparisons that a taxon wins over others [30]. ANCOM was applied separately at the genus and ASV levels to identify taxa that differed between the GlcN users and controls. Significance was determined using ANCOM’s built-in multiple comparisons approach (conservative).
Additionally, linear discriminant analysis effect size (LEfSe) was performed using MicrobiomeAnalyst (version 2.0). LEfSe combines non-parametric testing with linear discriminant analysis to identify taxa at any taxonomic level that are statistically different between groups and have a large effect size (linear discriminant analysis [LDA] score) [31]. All LEfSe data processing steps were performed using the default or recommended parameters in MicrobiomeAnalyst. For LEfSe, the default criteria were as follows: α = 0.05 and LDA score > 2.0 for declaring a discriminative feature [32]. LEfSe was performed on the multi-level relative abundance data.

2.8. Heat Tree Analysis

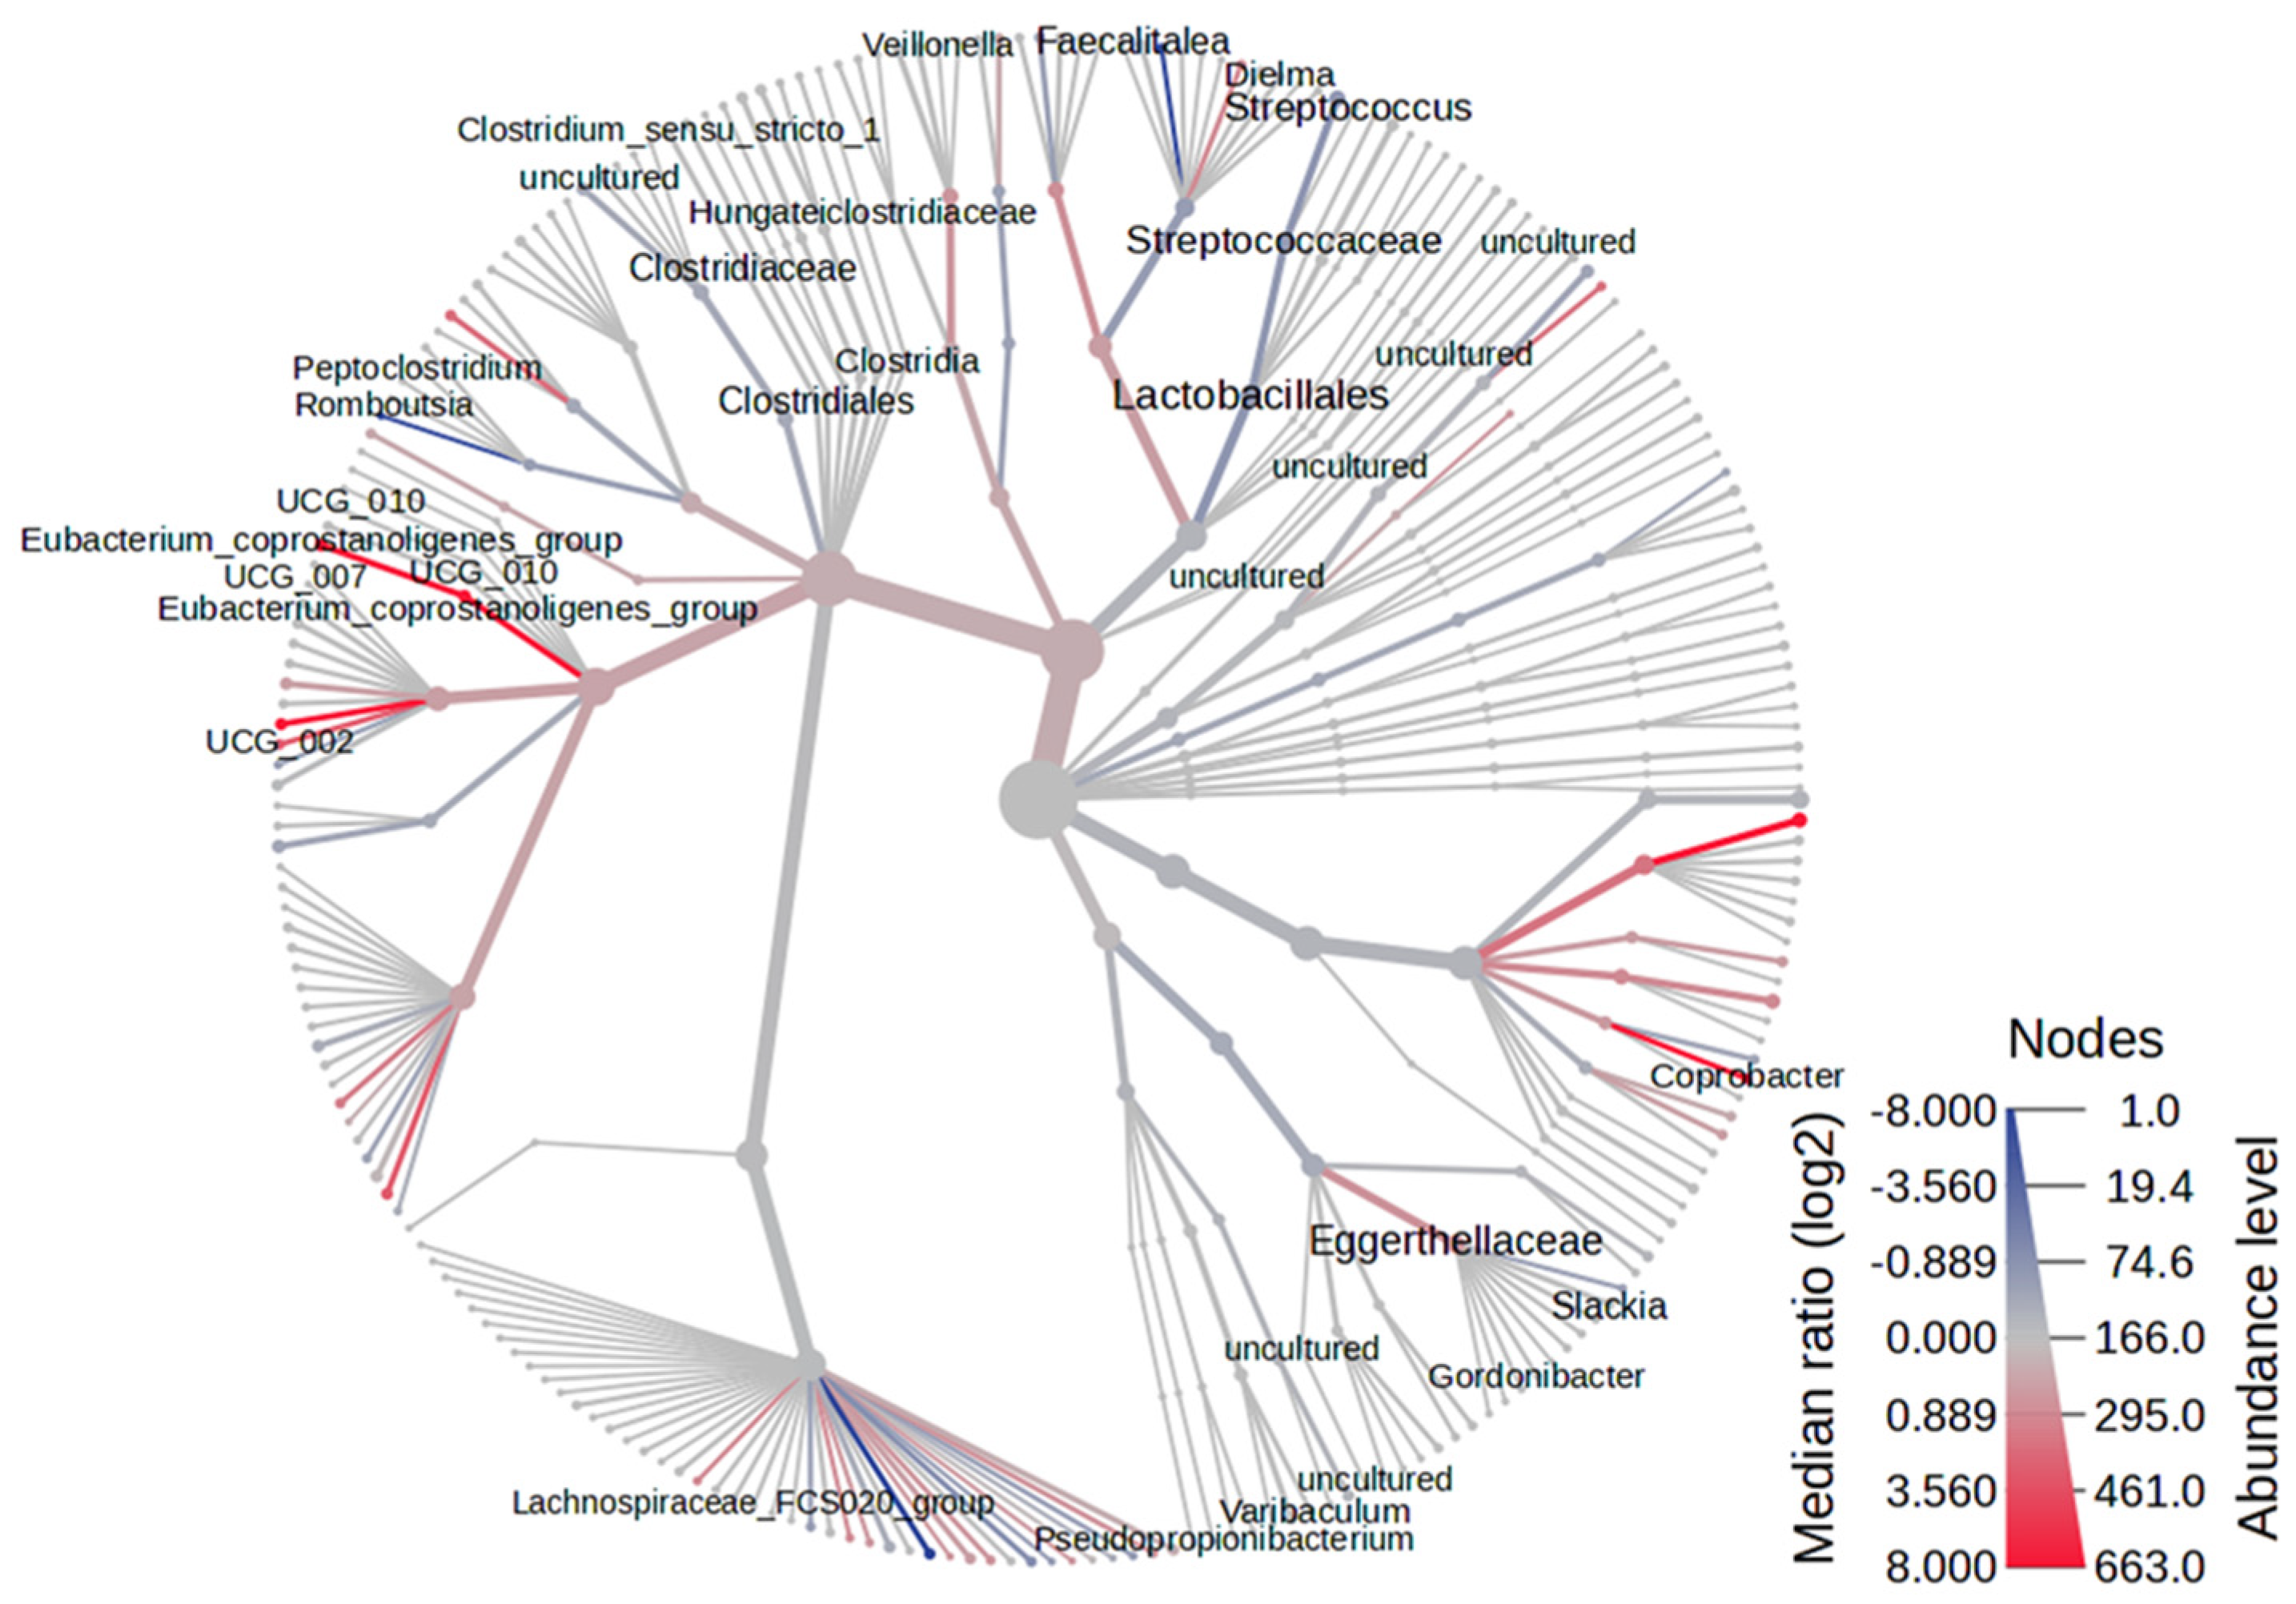
Taxonomic differences were visualized using heat tree analysis with MicrobiomeAnalyst [33]. MicrobiomeAnalyst’s online platform was used to create an interactive heat tree for group comparisons. The “Taxon Set Enrichment” and “Heat Tree” modules were utilized [34]. All data processing steps of heat tree analysis were performed using the default or recommended parameters in MicrobiomeAnalyst. Taxa more abundant in GlcN users are colored in blue, and those more abundant in controls are colored in red, with the color intensity reflecting the effect size or significance. A heat tree was generated by comparing the median relative abundances of taxa between the GlcN and control groups (overall cohort), with statistical coloring based on p-values from edgewise tests (adjusted for multiple comparisons).

2.9. Prevalence of Low-Abundance Taxa

To explore potential effect modification by body size, subgroup analyses were performed according to WHO BMI categories (underweight, normal, overweight, and obese) as provided in the dataset. The study further explored whether GlcN supplementation influenced the presence of rare taxa in the gut in normal-BMI subgroups [35]. Low-abundance taxa were defined as those with fewer than 10,000 total reads (roughly corresponding to <0.05% of the total reads) [36]. To evaluate differences in the presence of microbial taxa between groups, a prevalence analysis was conducted based on binary presence/absence data [37]. Prevalence was defined as the proportion of samples in which each taxon was detected (i.e., relative abundance > 0). The feature table, obtained from QIIME2, was converted into a binary matrix, where features with a non-zero abundance in a sample were marked as “1” (present), and “0” otherwise. Samples were stratified into groups based on experimental metadata (Control vs. GlcN), and Fisher’s exact test was applied to each taxon to test for significant differences in prevalence between groups [38]. This analysis was performed using custom R scripts (R version 4.2.0), utilizing the dplyr and stats packages. All low-abundance taxa with different prevalence between GlcN users and non-users were analyzed. Taxa with p-values < 0.05 were listed, and the identified taxa names with the actual numbers of total feature counts were shown. The p values were calculated for all taxa without applying multiple testing correction. Finally, the test results were merged with the taxonomic annotation table to assign taxonomy to each feature. Taxa were then ranked according to their raw p-values, and the top 10 taxa with the lowest p-values were selected for further interpretation. The identified taxa names with the actual numbers of total feature counts are shown for reference.

2.10. Statistical Analyses

Statistical analyses were performed using GraphPad Prism 9 (GraphPad Software, San Diego, CA, USA), Microsoft Excel 2010 (Microsoft Co., Ltd., Tokyo, Japan), and R (v4.2.0). Statistical significance was set at p < 0.05 (two-tailed).

3. Results

3.1. Cohort Characteristics

Each group (GlcN users and non-users) comprised 100 Japanese adults aged 50–59 years (mean age: 55 years), with equal numbers of males (N = 50) and females (N = 50). Based on the study design, all the participants were in their 50s and of Japanese ethnicity. The two groups were well-matched in terms of their basic characteristics (Table 1). No apparent change in BMI was observed between GlcN users and controls. The distribution of BMI categories was also similar; approximately 70% of each group fell within the normal BMI range (18.5–24.9); 20–25% were overweight or pre-obese; and approximately 5% were obese, with the remainder underweight (Table 1). This rate was roughly consistent with that of a similar cohort comprising 3361 Japanese individuals [22], suggesting that this cohort is ideal in terms of BMI. Other lifestyle factors were not extensively analyzed in this study; however, groups were drawn from the same dataset using matching procedures aimed at minimizing major lifestyle differences. The total number of individuals with a normal BMI across both groups was 140. This stratified cohort was used for part of the study analyses.

3.2. β and α Diversity Indices for the Overall Cohort

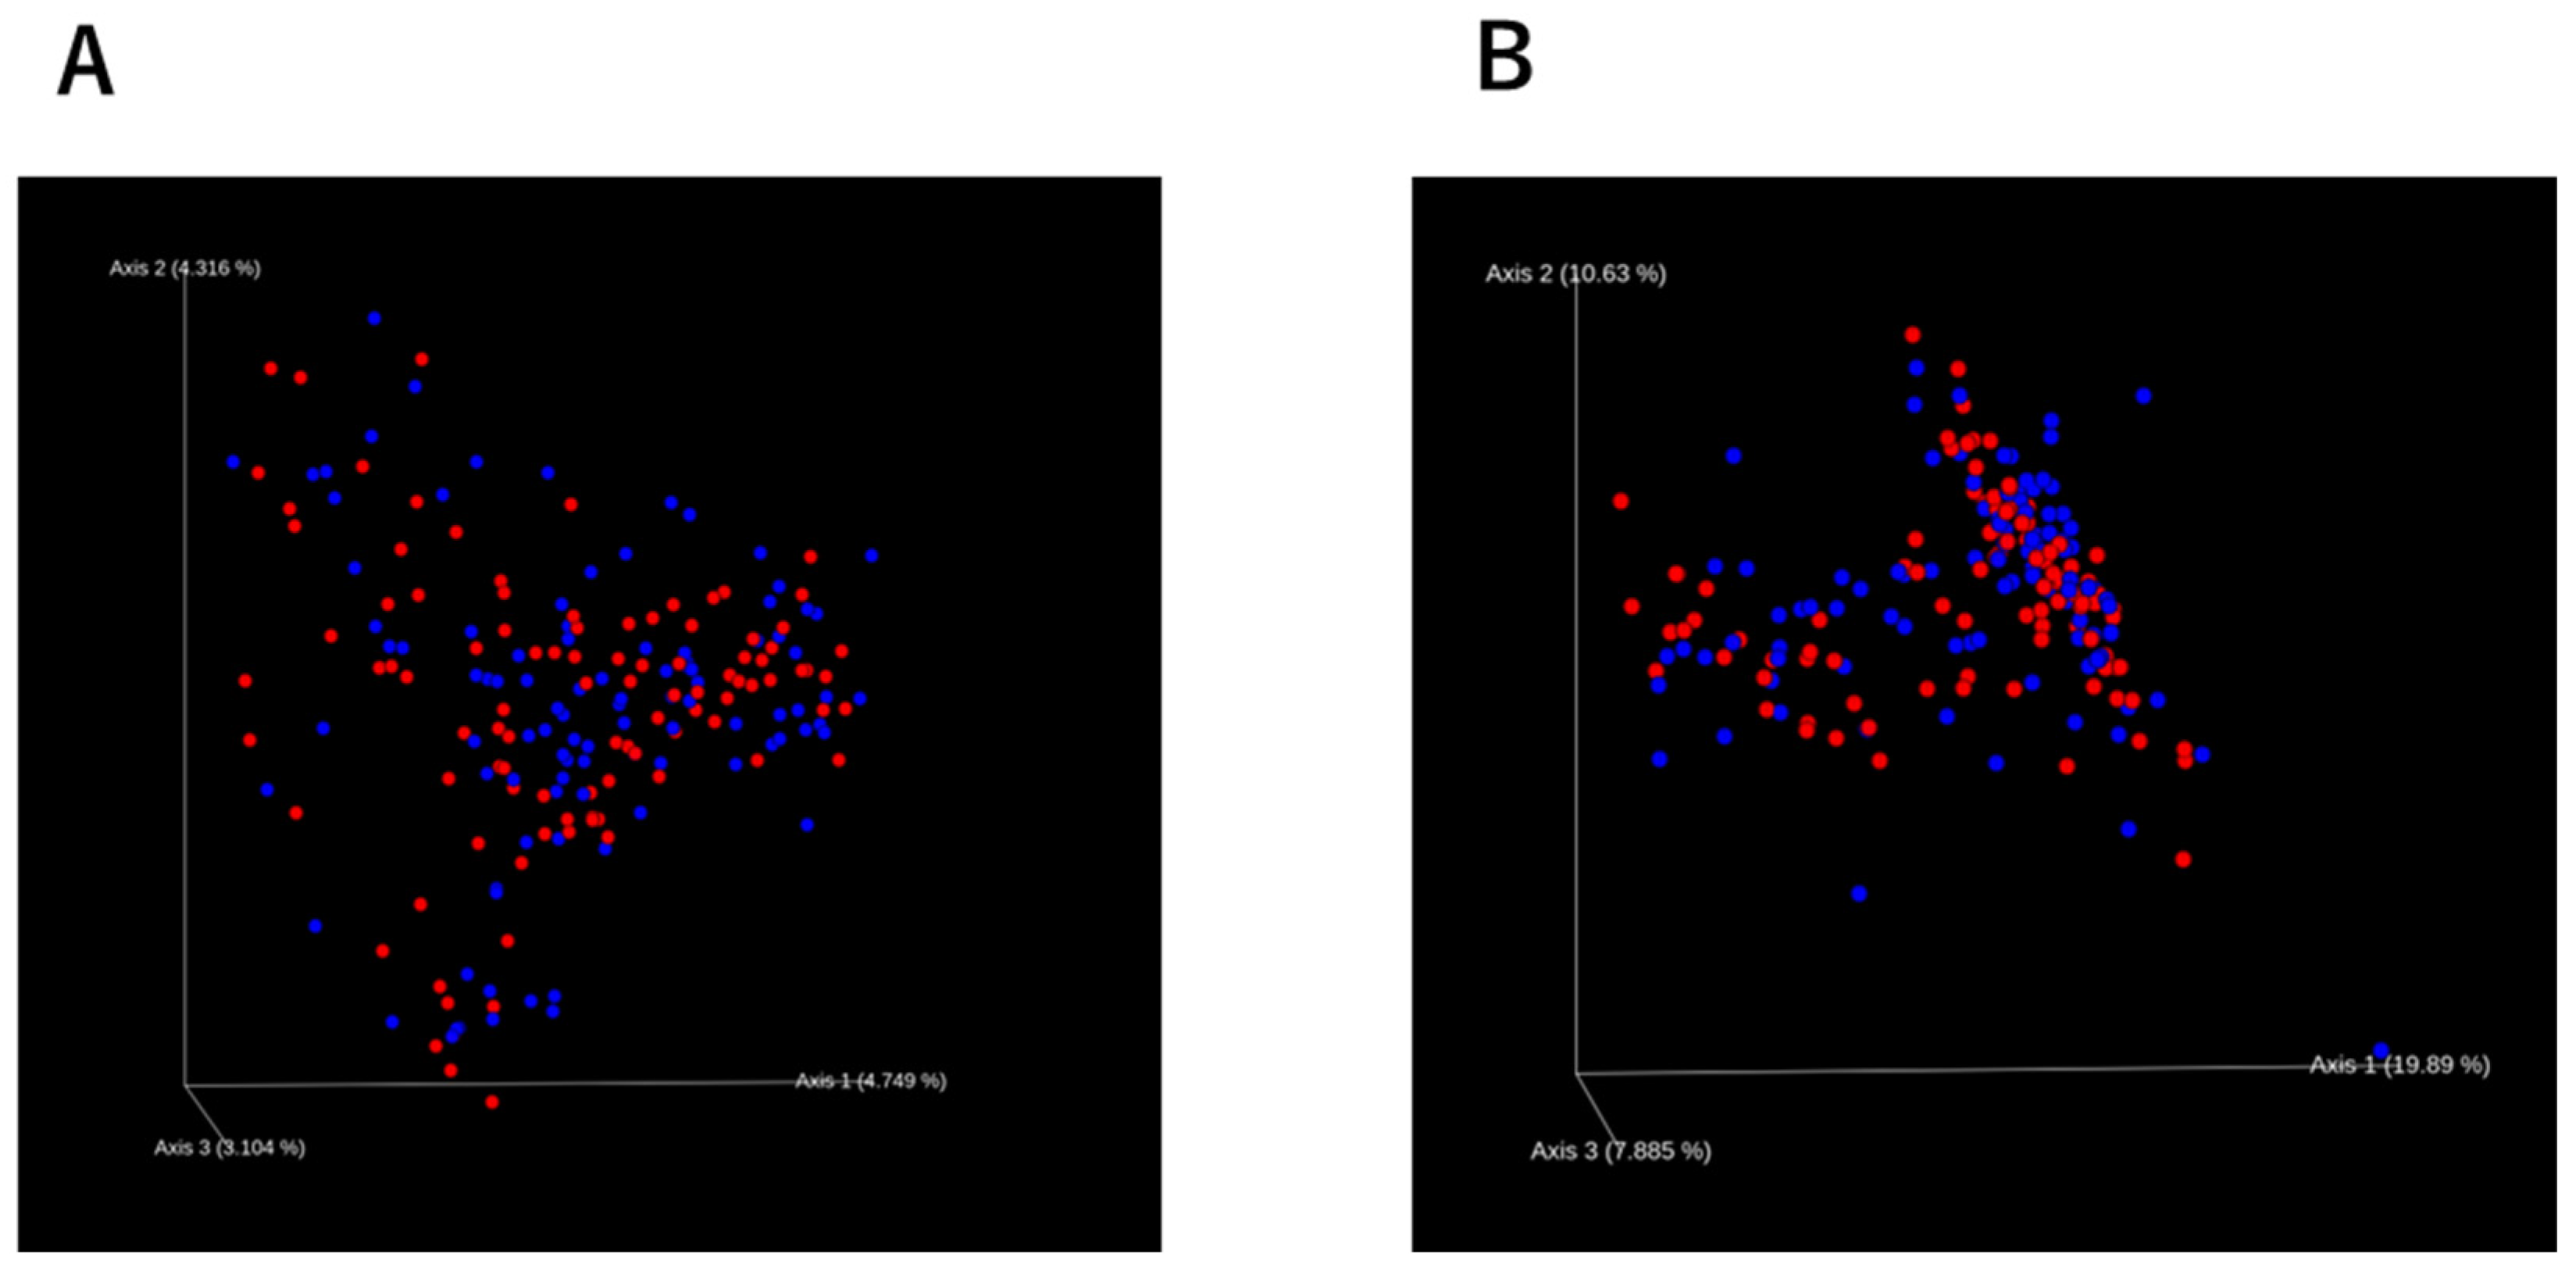
Beta diversity was first examined to determine whether GlcN users harbored a distinct global community composition compared with that of non-users. Figure 1A shows the PCoA of Bray–Curtis dissimilarities for all samples. The points representing controls (red) and GlcN users (blue) overlapped substantially, with no clear segregation between the two groups. In line with this observation, PERMANOVA confirmed no significant differences in community structure (pseudo-F = 0.83, p = 0.868). Similar results were obtained using weighted UniFrac distances (no significant difference; pseudo-F = 0.484, p = 0.923) (Figure 1B). The points representing controls (red) and GlcN users (blue) also overlapped substantially, with no clear segregation between the two groups. Thus, at the community level, habitual GlcN intake did not produce a distinct fecal microbiome profile. This may indicate that any association of habitual GlcN use with the overall community structure is small relative to inter-individual variability.
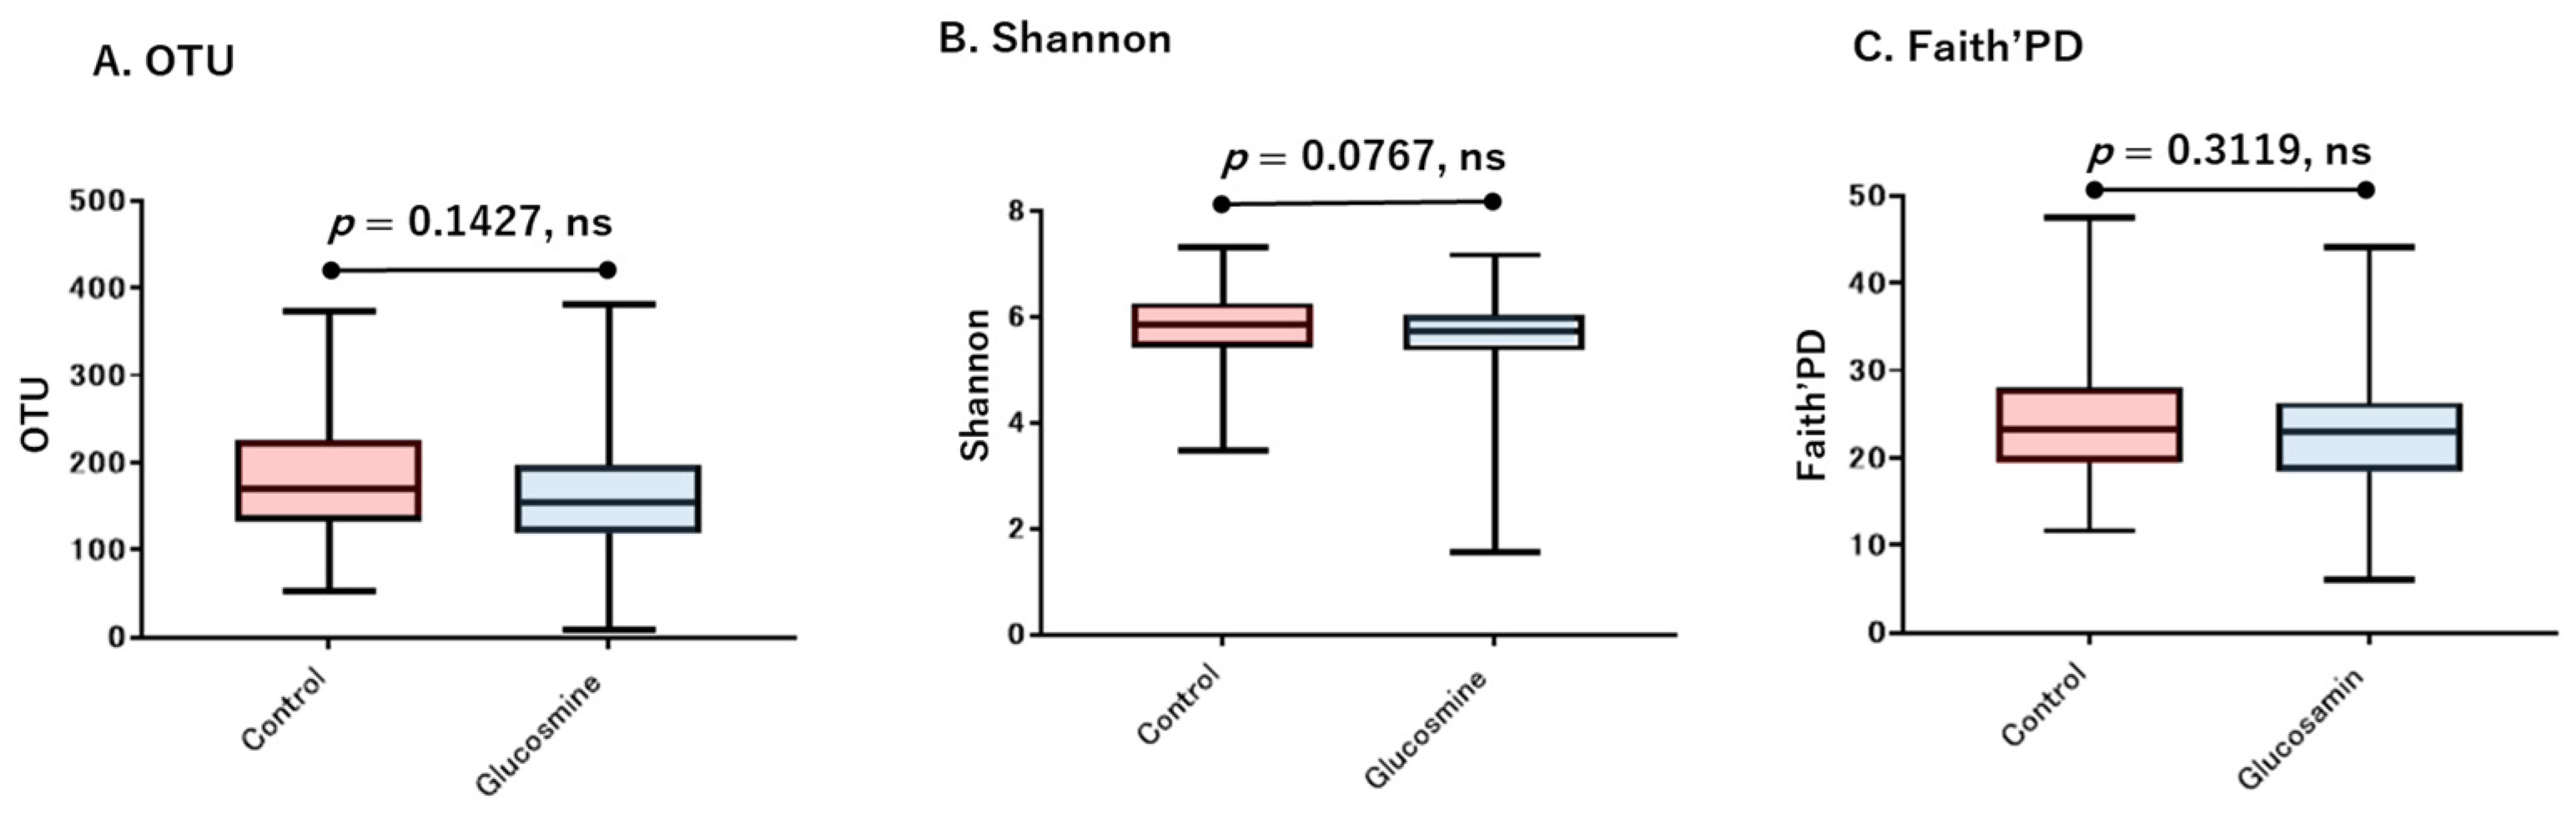
Next, alpha diversity was assessed to examine whether regular GlcN use was associated with differences in within-sample microbiome diversity. In the overall cohort, alpha diversity metrics did not differ substantially between the GlcN and control groups. The mean observed OTU count (richness) was 178 ± 65 for controls versus 164 ± 60 for GlcN users (Figure 2A), and the mean Shannon diversity index was 5.83 ± 0.66 for controls versus 5.66 ± 0.75 for GlcN users (Figure 2B). Faith’s phylogenetic diversity index was 24.5 ± 6.9 for controls versus 23.3 ± 6.5 for GlcN users (Figure 2C). The overall alpha diversity indices also showed no significant group differences (Mann–Whitney p = 0.1427 for OTU count; p = 0.0767 for Shannon index; p = 0.3119 for Faith’s phylogenetic diversity). These results indicated that the overall gut microbial richness and diversity were not measurably affected by GlcN supplementation in this population of the overall cohort.

3.3. Relative Abundance of Dominant Genera

Taxonomic profiling of the fecal microbiota identified >100 bacterial genera across 200 individuals. Among these, 22 genera had a mean relative abundance >1% and were considered the dominant gut taxa in this cohort (Table 2). The gut microbiome is primarily composed of commensal genera. The most abundant genera (>3%) were Bacteroides, Faecalibacterium, Blautia, Bifidobacterium, and Prevotella, and the most abundant family was Lachnospiraceae, each of which contributed to a substantial portion of the community. The most abundant gut microbiome members of the overall cohort in this study were similar to those previously reported in Japan [39,40]; thus, this study could provide a reasonable basis for microbiome comparisons. Other prevalent genera (>1.5%) were Parabacteroides, Alistipes, Ruminococcus, Megamonas, Collinsella, Fusobacterium, Subdoligranulum, and Anaerostipes. Together, these 22 taxa comprised the total relative abundance and accounted for the majority of fecal microbiota in all subjects.
The relative abundance of each of these dominant genera was compared between GlcN users and non-users. The average genus-level composition of each group is illustrated in Table 2, which shows that the GlcN profiles and control groups were nearly superimposable. None of the top 22 genera showed a statistically significant difference in the mean relative abundance between the groups (Welch’s t-test). For example, Bacteroides was the most abundant genus in both GlcN users and controls (on average, ~25% of sequences), with no considerable difference. Faecalibacterium (~5%), Blautia (~6%), Bifidobacterium (~4%), and Prevotella (~9%) were similar between the groups. Even relatively lower-abundance dominant genera showed no notable group disparity. For example, Agathobacter comprised approximately 1.41% of the microbiota in GlcN users versus 1.07% in controls, which was a minor difference and not statistically significant (p = 0.233, Welch’s test). In summary, GlcN supplementation was not associated with any change in the relative abundance of the major gut bacterial genera. Contrary to the initial hypothesis that GlcN enriches certain beneficial genera, the core gut microbiome composition remained stable regardless of GlcN intake. Notably, butyrate-producing genera, such as Alistipes, Ruminococcus, Anaerostipes and Faecalibacterium, and the Lachnospiraceae family were present at low levels and did not differ between groups. Their relative abundances in GlcN users were virtually the same as those in non-users. These results indicate the general compositional resilience of the dominant gut taxa in the presence of GlcN.
Relative abundance of the top 22 genera (mean relative abundance >1%) in the glucosamine (GlcN) intake and non-intake groups. Values represent the mean gut microbiota composition at the genus level for each group. Each colored segment corresponds to one of the 22 dominant genera (legend on the right; genera are sorted by overall abundance). Mean relative abundance is shown separately for glucosamine users (n = 100) and non-users (n = 100). For readability, genera are shown up to rank 22; genera ranked 23rd and below were <1% in overall mean relative abundance (e.g., rank 23: overall 0.86%; controls 0.82%; glucosamine users 0.89%). The relative abundance of all detected genera is provided in Supplementary Table S2. The values appear nearly identical, illustrating that the dominant genera and their proportions are very similar between groups. No significant differences among the 22 genera were found in the relative abundances using Welch’s t test.

3.4. Differential Abundance Testing

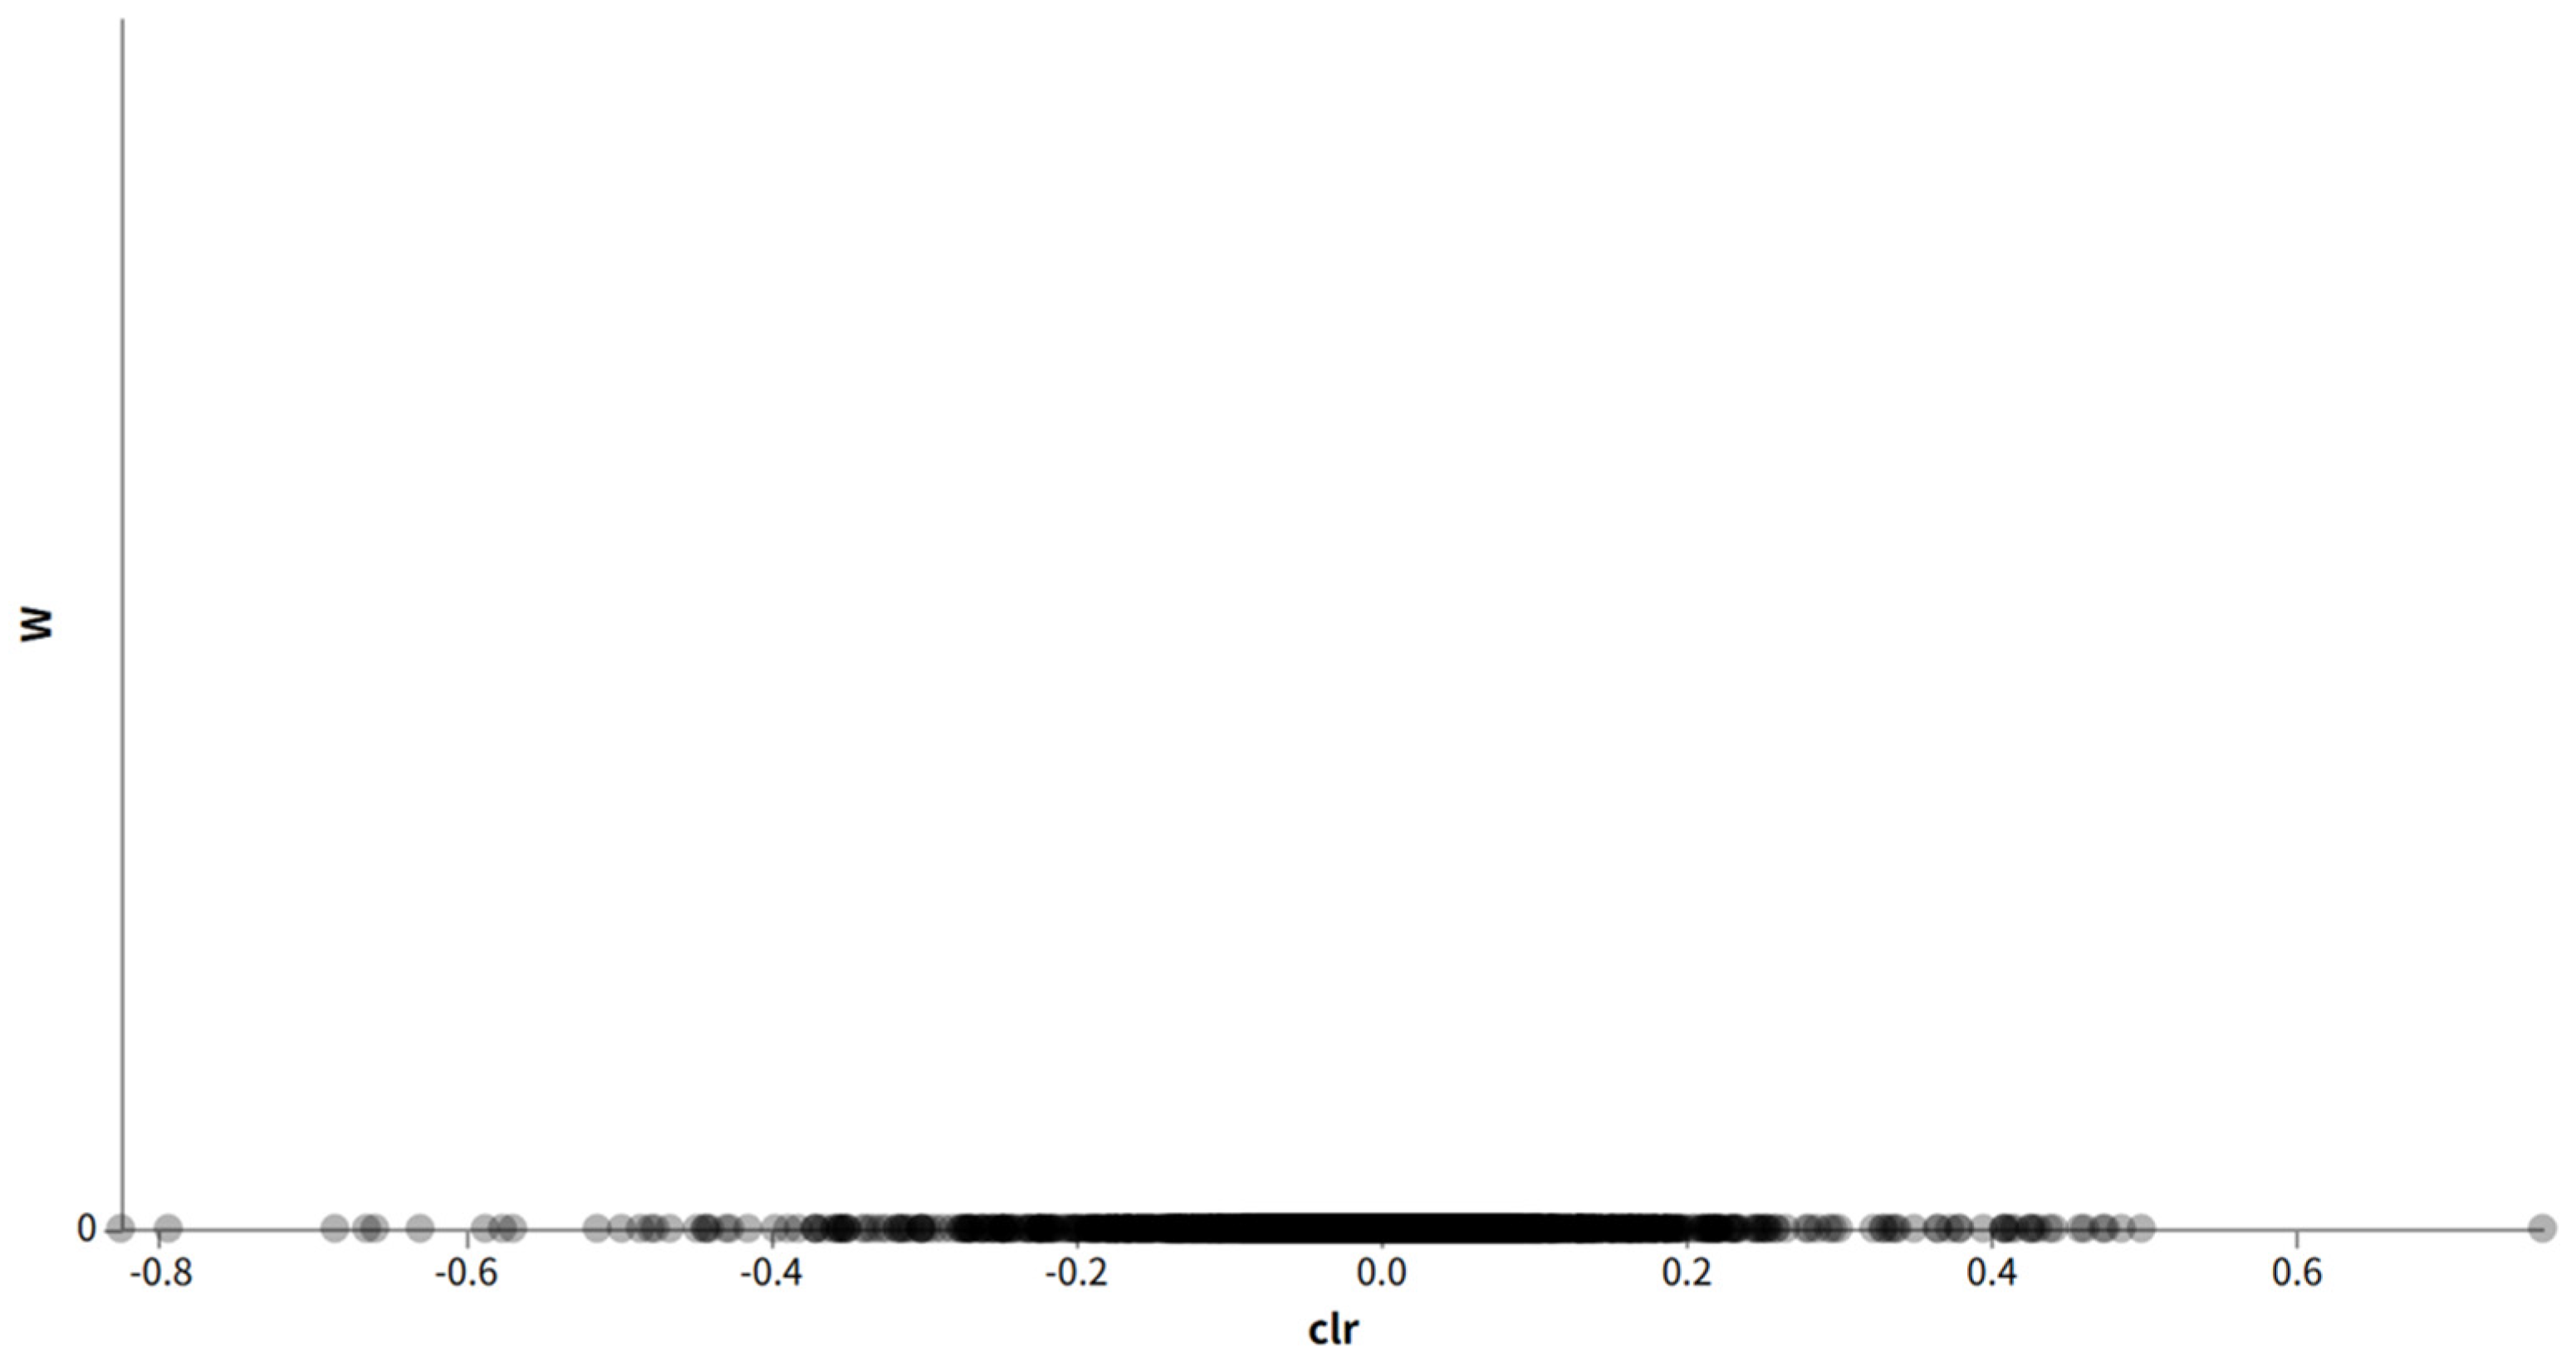
Fine-grained analyses (ANCOM and LEfSe) were conducted to determine whether any specific taxa outside the top 22 genera were affected by GlcN use. ANCOM did not identify any bacterial taxa as differentially abundant between GlcN users and controls after adjusting for multiple comparisons. At the genus level, the ANCOM W-statistics were uniformly low, indicating that no genera consistently outperformed the others in terms of between-group differences (Figure 3). ANCOM did not flag any substantially different features. Simply, within the detection limits of the study data, ANCOM found no robust evidence of any taxonomic group being increased or decreased with GlcN supplementation.
Consistent with the ANCOM results, LEfSe did not reveal any taxa with either statistical significance or a large effect size distinguishing the two groups (Figure S2). Theses bars represent the respective highlighted taxa of controls (red) and GlcN users (blue) before correcting for multiple tests. Before the correction, a few features showed nominal differences. For instance, LEfSe indicated that some low-abundance taxa had LDA scores >2, thereby favoring one group or the other. However, none of these passed the stringent cutoffs (α = 0.05 and LDA > 2.0) after correction. Thus, LEfSe did not identify any genus (or higher taxon) that was markedly enriched in GlcN users compared to that in controls (or vice versa), with an appreciable effect size. This aligns with the observations from the dominant genus analysis showing that the overall taxonomic profiles were highly similar.

3.5. Heat Tree Visualization

Figure 4 presents a heat tree visualization that provides a holistic view of the taxonomic landscape in the overall cohort. These lines represent the respective highlighted taxa of controls (red) and GlcN users (blue). No consistent shifts in any particular branch of the bacterial tree were associated with the use of GlcN. For example, the phyla Bacteroidetes and Firmicutes, which dominate the gut microbiome, have roughly equal representation in both groups. At finer levels, most nodes were grey, which signified no change or very faint hues. A few tiny peripheral nodes (rare taxa) showed slight color differences; however, these were not statistically significant and likely reflected noise or very small effect sizes. Notably, similar to the LEfSe analysis results before correcting for multiple tests (Figure 4), the HeatTree analysis also highlighted the UCG_002 genus in the control group and the Streptococcus genus in the GlcN group. This suggests that the validity of the analytical results was confirmed to some extent. Overall, comprehensive differential abundance analyses indicated the absence of strong group-specific perturbations in the gut microbiome attributable to GlcN. Even taxa previously highlighted [14,16], such as Anaerostipes, Lachnospira, and Desulfovibrio, were not significantly different between the GlcN users and non-users in this dataset. The heat tree highlights that GlcN did not induce any notable restructuring of the gut microbiota’s taxonomic tree. The overall community appeared stable, with only minor fluctuations in a few low-abundance groups and no statistically significant results for the conventional analytical methods.

3.6. BMI-Stratified Analysis of Microbial Diversity and Low-Abundance Taxa

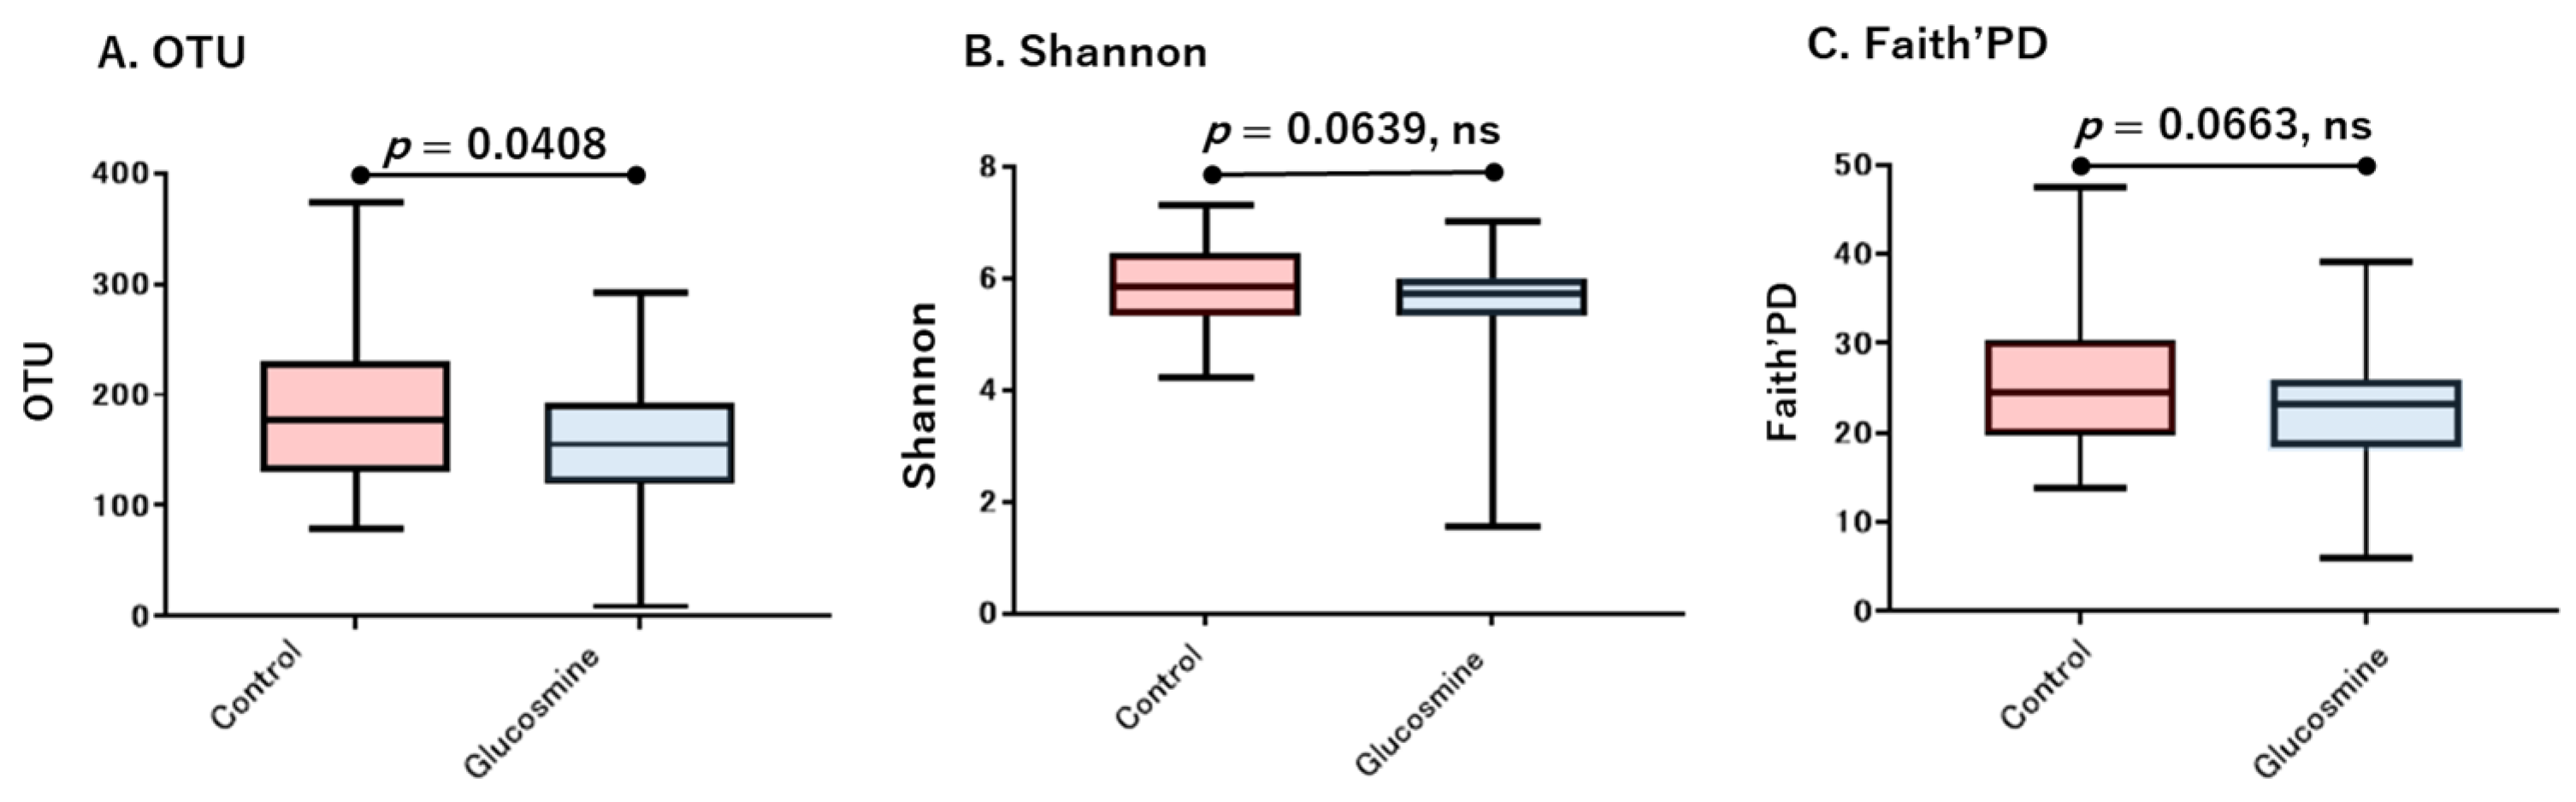
Considering that BMI might modulate the microbiome response, I performed an additional analysis focusing on the 140 participants with a BMI within the normal range (18.5–25.0) (Table 1). Within this normal-BMI subgroup, a subtle reduction in alpha diversity (richness) was detected among GlcN users. Notably, even in this subgroup, Shannon diversity and Faith’s phylogenetic diversity index did not reach pronounced levels. GlcN users with a normal BMI had a significantly lower median OTU count (approximately 188 ± 67 for controls versus 161 ± 58 for GlcN users, p = 0.0408, Mann–Whitney) (Figure 5A). Moreover, the Shannon index was 5.87 ± 0.67 vs. 5.60 ± 0.80 (p = 0.0639, ns, Mann–Whitney) (Figure 5B), and Faith’s phylogenetic diversity index was 25.7 ± 6.9 for controls versus 23.1 ± 6.3 for GlcN users (p = 0.0663, ns, Mann–Whitney) (Figure 5C). This suggests that GlcN use in individuals without BMI-related dysbiosis may be associated with a modest decrease in gut bacterial richness without changing diversity. In summary, the only detectable difference in diversity was a slight reduction in richness among GlcN users with a normal body weight.

3.7. Prevalence of Low-Abundance Taxa in the Normal BMI Cohort

This study focused on the prevalence of low-abundance taxa. Within the normal-BMI subgroup, GlcN users harbored fewer rare taxa than controls (Table 3). Statistical analysis confirmed that the aggregate prevalence of several low-abundance taxa was significantly lower in GlcN users than in the normal-BMI subgroup (Fisher exact test, p < 0.05 for overall rare taxa presence). Among individuals with a normal BMI, certain taxa were present in a substantially higher fraction of controls than in GlcN users. The taxon of g__Izemoplasmatales and the taxon of g__DTU014 were significant (p = 0.009, respectively). A member of the family Christensenellaceae and another taxon of Christensenellaceae were significantly enriched (p = 0.004 and 0.021, respectively) with relatively high abundance (feature count; 403 and 469, respectively).
Low-abundance taxa (<10,000 total reads) showed different prevalences between glucosamine users and non-users with normal BMI. These differences were significant according to Fisher’s exact test (p < 0.05). Taxa with p values less than 0.05 are listed. Count indicates the actual number of total feature counts; higher counts indicate higher relative abundance.

4. Discussion

In this cross-sectional study, the association between habitual GlcN supplementation and gut microbiota composition in a cohort of 200 middle-aged Japanese adults was examined. Overall, the study results indicated that GlcN use was not linked to major alterations in gut microbial diversity or community structure. Specifically, alpha diversity metrics (richness, Shannon index and Faith’s phylogenetic diversity index) were virtually identical between GlcN users and non-users, and beta diversity analyses showed no separation between the groups. Furthermore, the relative abundance of the dominant bacterial genera was stable to some extent, regardless of GlcN product use. These findings suggest that gut microbiota is resilient to the influence of commercial GlcN products at the population level. Therefore, any GlcN-induced effects on the microbiome are either too small to be detected using current methods or are confined to a narrow set of conditions.
Importantly, the stratified analysis suggested that the host phenotype may modulate the microbiome response to GlcN. Among individuals with a normal BMI, GlcN use was associated with a modest decrease in microbial richness and prevalence of certain low-abundance taxa. This indicated that GlcN exerts subtle, selective effects on the gut ecosystem under specific host physiological conditions. The reason such an effect is more evident in individuals with a normal BMI may be because the baseline microbiome is relatively stable and not strongly dysbiotic in metabolically healthy (non-obese) hosts. Therefore, dietary factors, such as GlcN, may modulate the balance of some minor taxa. In contrast, in individuals with obesity or those with other metabolic disturbances, the microbiome may already be in a dysbiotic state, and any GlcN-induced effects could be masked by larger host- or diet-induced variations.
Interestingly, one of the rare taxa that showed a reduced prevalence among GlcN users belonged to the Christensenellaceae family [41]. In an intervention study [14], Christensenellaceae abundance decreased with GlcN intake, which aligns with the findings of this study. Among the various microbiota changes observed with GlcN intake in intervention trials, the reduction in Christensenellaceae may represent the most prominent and easily detectable effect. This suggests that this change could be the microbiota change with the largest effect size among GlcN-induced effects on gut microbes. Christensenellaceae is a microbial group that has been associated with leanness and co-occurrence networks in the gut ecosystem [42,43]. The implications of reducing the prevalence of such organisms are unclear. However, the ecological role of Christensenellaceae is not fully understood, and the suppression of low-abundance organisms could reflect a streamlining of the overall microbial community [44]. This streamlining could hypothetically favor more efficient energy utilization or a more stable core microbiota in the overall microbial community by eliminating certain peripheral players [45]. This idea aligns with the broader concept that greater diversity is not inherently beneficial, as an overabundance of species, especially opportunistic species, can sometimes indicate dysbiosis in contexts such as inflammatory bowel disease or infection [46,47]. Thus, the slight reduction in diversity and specific rare taxa seen with GlcN use may not be detrimental. This slight reduction could even be indicative of a subtle reorganization toward a more refined community. For example, if GlcN selectively inhibits microbes that are less favorable or simply redundant, the outcome may be a more efficient microbiome. Notably, the decrease in Christensenellaceae in the context of fragility under a specific context was partially supported by a recent study [48]. The study of 268 people with HIV (human immunodeficiency virus) linked frailty to gut microbiome features with sex-specific patterns. Focusing on Christensenellaceae, males showed a positive association between Christensenellaceae R-7 and frailty, implying that a reduction in Christensenellaceae may accompany improvements in frailty in this context. Frailty was measured by the phenotypic frailty index and a 58-item deficit index, and fourteen taxa were associated with both measures. A community state characterized by lower diversity and more pathobionts strongly predicted higher frailty, suggesting that restoring short-chain fatty acid-producing genera and reducing opportunists, alongside decreasing Christensenellaceae where elevated, may support improvements in frailty. Larger studies, intervention studies and mechanistic experiments under specific contexts are needed to validate and refine these findings.
Nonetheless, the study findings differ from those of previous studies [12,14,16,49]. In this study, no increase was observed in any of the predominant genera (Anaerostipes, Lachnospira) or other SCFA-producing genera in GlcN users, and their levels were virtually the same as those in non-users. Overall, the lack of broad microbiome changes in this study appears to contradict the results of previous pilot trials [14]. This discrepancy has some possible explanations. First, the intervention trials used controlled dosing and likely higher compliance, whereas this study relied on self-reported supplement use with unknown dose/duration variability. Some GlcN users may have been taking lower or irregular doses, thereby diluting the effects. Second, these trials involved very small sample sizes and specific populations, whereas this cross-sectional dataset covered a broader population with more heterogeneous diets and lifestyles. In a tightly controlled setting, such as a randomized controlled trial with strict inclusion criteria, GlcN may show an effect that is too subtle to emerge against the noise of a general population. Third, the timing and duration can lead to transient microbiome responses [50]. A cross-sectional snapshot may miss dynamic changes that occur soon after starting GlcN use. If many of the study users had been on GlcN for long periods, their microbiomes may have adapted to a new equilibrium.
This cross-sectional study itself had many limitations. First, this study is observational and cross-sectional, which precludes any inference of causality or directionality. Hence, whether GlcN use caused the slight microbiome differences observed is uncertain. Unmeasured confounders, such as diet or other lifestyle factors, could be involved, although matching for age/sex and random selection helped mitigate some confounding factors. Second, GlcN intake was self-reported via a questionnaire, thereby introducing potential misclassification. Some GlcN users under the criteria of this study may not have been consistent, and some GlcN non-users under the criteria of this study might have taken GlcN (<4 days/week or for <1 month). However, the study definition (≥4 days/week for ≥1 month) in the default survey field of the data provider aimed to capture habitual use. Third, many commercially available GlcN products contain chondroitin sulfate, collagen and other ingredients. The commercial database in this study does not capture dose or product formulation, limiting inference to “habitual use of GlcN-containing supplements”. Therefore, this study could not isolate the effect of GlcN because any microbiome influence could be a result of GlcN, chondroitin, and their combination, as well as the other dietary supplements, uncontrolled diets, medications or associated lifestyle factors. This study contains potential selection bias inherent in commercial databases. This is a common challenge in supplement studies and suggests that results should be interpreted as the effect of GlcN-containing supplement use rather than pure GlcN. Fourth, there are inherent limitations in interpreting data from fecal analyses that sequence the 16S rRNA gene V1–V2 region. Predicted functional profiles based on 16S rRNA gene data capture potential rather than realized metabolic activity, and subtle physiological effects may fall below the sensitivity of this approach. Fifth, although the overall sample size (n = 200) was moderate, the size of the stratified subgroups was relatively small. It is difficult to discuss generalization. Causal inference is not possible due to the cross-sectional design with a small sample size. The findings in individuals with a normal BMI, although statistically significant, should be reconsidered and require confirmation in larger cohorts. The generalizability of the study results may be limited to similar demographics (middle-aged and Japanese) and supplement usage patterns. Sixth, joint-related conditions (e.g., osteoarthritis) were not available in the dataset; therefore, residual confounding related to underlying joint disease and its correlation with obesity and supplement use may remain. Seventh, longitudinal data were not available in this dataset. Because repeated stool samples from the same individuals could not be obtained, I was unable to assess within-individual temporal stability or dynamic changes in the gut microbiome over time. Therefore, the present findings represent a cross-sectional snapshot, and longitudinal studies are needed to confirm whether the observed patterns persist.
Furthermore, this cross-sectional study could not evaluate changes in total bacterial count or stool volume. However, in a single-group open-label trial, an improvement in bowel movement was observed with GlcN alone [51]. The study also evaluated the effect of GlcN on the growth of 70 gut bacterial species in vitro and found that 81% of the species, including SCFA-producing bacteria, exhibited markedly enhanced growth in the presence of GlcN. These results suggest that GlcN may support gut bacterial growth similarly to dietary fiber. Additionally, an open-label, single-arm trial with 29 healthy participants (1500 mg GlcN/day for two weeks) demonstrated substantial improvements in stool color, stool volume, defecation frequency, and defecation day. These findings suggest that dietary GlcN can enhance overall colonic microbiota growth and promote bowel function without changing the balance of the microbiota. This cross-sectional study did not evaluate changes in stool volume; hence, this will be addressed in future studies.
Overall, regular GlcN supplementation did not broadly perturb the gut microbiota in this cross-sectional population-based study. GlcN, at least in real-world settings, does not considerably perturb the gut ecosystem of middle-aged adults. In particular, the overall diversity and core taxonomic profile of the gut microbiome were unchanged in GlcN users compared with non-users. This suggests that GlcN, unlike other dietary interventions, is largely neutral with respect to the major microbial inhabitants of the gut, which may reflect the homeostatic robustness of the gut microbiota. Nonetheless, this study identified modest context-dependent effects. In individuals with a normal BMI, GlcN use was linked to slight reductions in microbial richness and the prevalence of certain rare taxa (the Christensenellaceae family). These subtle shifts, although interesting, did not translate into changes in the dominant gut bacteria or global community structure. The genus Christensenella has been reported to be correlated with frailty in a specfiic context, suggesting a potential effect of GlcN, which is widely used as a dietary supplement that supports joint health. Overall, the minimal effects of GlcN on the microbiome could highlight the complexity of diet–microbiome interactions and the need to consider host factors. Furthermore, the lack of major GlcN-induced disruption would support its safety as a supplement. Accordingly, future GlcN research should focus on longitudinal studies, functional analyses, and interactions with diet and host factors to better understand its potential health benefits beyond joint health.

5. Conclusions

This study examined associations between glucosamine (GlcN) supplementation and gut microbiota in Japanese adults aged 50–59 years. Overall community structure, diversity, and dominant taxa were largely similar between GlcN users and non-users, suggesting no major disruption of the gut ecosystem. In BMI-stratified analyses, GlcN use was associated with modest reductions in richness and the prevalence of some low-abundance taxa among individuals with a normal BMI, indicating potentially subtle and host-dependent effects. Given the cross-sectional design, self-reported supplement use, and limited information on co-ingredients, diet, and medications, these findings should be interpreted cautiously. Larger longitudinal and mechanistic studies are needed to confirm and explain these associations.

Supplementary Materials

The following supporting information can be downloaded at: https://www.mdpi.com/article/10.3390/microbiolres17060103/s1, Figure S1: Production of GlcN; Figure S2: Features of LEfSe before correction for multiple comparisons; Table S1: Background of the dataset; Table S2: Genus level of all subject.

Funding

This research received no external funding. This research was funded by the Toyo Institute of Food Technology (a non-profit organization).

Institutional Review Board Statement

This study was conducted in accordance with relevant ethical guidelines and regulations. All data were obtained in de-identified form from the commercial provider (Cykinso Inc.) with the user’s consent for research use. Analysis of the anonymized dataset was approved by the Toyo Institute of Food Technology ethics committee (24190, 25190 and 26190) (approval date 21 January 2025). The study protocol was registered with the University Hospital Medical Information Network (UMIN000058208). No direct interaction with human subjects occurred, and thus no additional informed consent was required beyond the original provider’s consent procedure.

Informed Consent Statement

Informed consent was obtained from all subjects involved in the study by the commercial provider (Cykinso Inc.).

Data Availability Statement

The 16S rRNA sequencing data generated and analyzed during this study have been deposited in the DDBJ Sequence Read Archive under BioProject PRJDB20752 (accession numbers DRR698811–DRR699010). Raw paired-end FASTQ files for all 200 samples were obtained and deposited in the DDBJ Sequence Read Archive (SAMD00915708–SAMD00915907). Processed data tables (OTU abundance tables, alpha diversity metrics, etc.) and analysis codes are available from the corresponding author upon reasonable request.

Acknowledgments

The author thanks Cykinso Inc. for providing access to the data and for performing the initial matching and selection of participants. The author thanks the Mykinso service participants for contributing their data and colleagues for discussions on study design and data interpretation. The author thanks exaBase Generative AI GPT-5.2 for English manuscript editing. The author thanks members of the Toyo Institute of Food Technology for helpful advice and suggestions throughout the study.

Conflicts of Interest

The author declares no conflicts of interest. The study sponsor (Toyo Institute of Food Technology) is a non-profit organization and had no role in the design, analysis, interpretation, or decision to publish this study.

Abbreviations

GlcN, glucosamine; ANCOM, analysis of composition of microbiomes; LEfSe, linear discriminant analysis effect size; BMI, body mass index; SCFA, short-chain fatty acid; QIIME2, Quantitative Insights into Microbial Ecology 2; ASV, amplicon sequence variant; OTU, operational taxonomic unit; PCoA, principal coordinates analysis; PERMANOVA, permutational multivariate analysis of variance; LDA, linear discriminant analysis.

References

  1. Dhillon, S.G.; Kaur, S.; Brar, K.S.; Verma, M. Green synthesis approach: Extraction of chitosan from fungus mycelia. Crit. Rev. Biotechnol. 2013, 33, 379–403. [Google Scholar] [CrossRef] [PubMed]
  2. Shintani, T. Food Industrial Production of Monosaccharides Using Microbial, Enzymatic, and Chemical Methods. Fermentation 2019, 5, 47. [Google Scholar] [CrossRef]
  3. Zhu, X.; Sang, L.; Wu, D.; Rong, J.; Jiang, L. Effectiveness and safety of glucosamine and chondroitin for the treatment of osteoarthritis: A meta-analysis of randomized controlled trials. J. Orthop. Surg. Res. 2018, 13, 170. [Google Scholar] [CrossRef]
  4. Simental-Mendía, M.; Sánchez-García, A.; Vilchez-Cavazos, F.; Acosta-Olivo, A.C.; Peña-Martínez, M.V.; Simental-Mendía, E.L. Effect of glucosamine and chondroitin sulfate in symptomatic knee osteoarthritis: A systematic review and meta-analysis of randomized placebo-controlled trials. Rheumatol. Int. 2018, 38, 1413–1428. [Google Scholar] [CrossRef]
  5. Li, Z.-H.; Gao, X.; Chung, C.V.; Zhong, W.-F.; Fu, Q.; Lv, Y.-B.; Huang, Q.-M.; Shen, D.; Wu, X.-B.; Zhang, X.-R.; et al. Associations of regular glucosamine use with all-cause and cause-specific mortality: A large prospective cohort study. Ann. Rheum. Dis. 2020, 79, 829–836. [Google Scholar] [CrossRef]
  6. King, E.D.; Xiang, J. Glucosamine/Chondroitin and Mortality in a US NHANES Cohort. J. Am. Board Fam. Med. 2020, 33, 842–847. [Google Scholar] [CrossRef]
  7. Weimer, S.; Priebs, J.; Kuhlow, D.; Groth, M.; Priebe, S.; Mansfeld, J.; Schmeisser, S.; Horstkorte, R.; Pfeiffer, A.F.H.; Guthke, R.; et al. D-Glucosamine supplementation extends life span of nematodes and of ageing mice. Nat. Commun. 2014, 5, 3563. [Google Scholar] [CrossRef]
  8. Shintani, H.; Ashida, H.; Shintani, T. Shifting the focus of d-glucosamine from a dietary supplement for knee osteoarthritis to a potential anti-aging drug. Hum. Nutr. Metab. 2021, 26, 200134. [Google Scholar] [CrossRef]
  9. Ibrahim, A.; Gilzad-Kohan, H.M.; Aghazadeh-Habashi, A.; Jamali, F. Absorption and Bioavailability of Glucosamine in the Rat. J. Pharm. Sci. 2012, 101, 2574–2583. [Google Scholar] [CrossRef]
  10. Persiani, S.; Roda, E.; Rovati, L.C.; Locatelli, M.; Giacovelli, G.; Roda, A. Glucosamine oral bioavailability and plasma pharmacokinetics after increasing doses of crystalline glucosamine sulfate in man. Osteoarthr. Cartil. 2005, 13, 1041–1049. [Google Scholar] [CrossRef]
  11. Jackson, C.G.; Plaas, A.H.; Sandy, J.D.; Hua, C.; Kim-Rolands, S.; Barnhill, J.G.; Harris, C.L.; Clegg, D.O. The human pharmacokinetics of oral ingestion of glucosamine and chondroitin sulfate taken separately or in combination. Osteoarthr. Cartil. 2010, 18, 297–302. [Google Scholar] [CrossRef] [PubMed]
  12. Moon, J.M.; Finnegan, P.; Stecker, R.A.; Lee, H.; Ratliff, K.M.; Jäger, R.; Purpura, M.; Kerksick, C.M. Impact of Glucosamine Supplementation on Gut Health. Nutrients 2021, 13, 2180. [Google Scholar] [CrossRef]
  13. Shintani, T.; Shintani, H.; Sato, M.; Ashida, H. Calorie restriction mimetic drugs could favorably influence gut microbiota leading to lifespan extension. GeroScience 2023, 45, 3475–3490. [Google Scholar] [CrossRef]
  14. Navarro, S.L.; Levy, L.; Curtis, R.K.; Lampe, J.W.; Hullar, M.A.J. Modulation of Gut Microbiota by Glucosamine and Chondroitin in a Randomized, Double-Blind Pilot Trial in Humans. Microorganisms 2019, 7, 610. [Google Scholar] [CrossRef]
  15. Silva, P.Y.; Bernardi, A.; Frozza, L.R. The Role of Short-Chain Fatty Acids From Gut Microbiota in Gut-Brain Communication. Front. Endocrinol. 2020, 11, 25. [Google Scholar] [CrossRef]
  16. Shintani, T.; Sasaki, D.; Matsuki, Y.; Kondo, A. In vitro human colon microbiota culture model for drug research. Med. Drug Discov. 2024, 22, 100184. [Google Scholar] [CrossRef]
  17. Gao, R.; Zhu, C.; Li, H.; Yin, M.; Pan, C.; Huang, L.; Kong, C.; Wang, J.; Qin, H. Dysbiosis Signatures of Gut Microbiota Along the Sequence from Healthy, Young Patients to Those with Overweight and Obesity. Obesity 2018, 26, 351–361. [Google Scholar] [CrossRef] [PubMed]
  18. Dominianni, C.; Sinha, R.; Goedert, J.J.; Pei, Z.; Yang, L.; Hayes, R.B.; Ahn, J. Sex, Body Mass Index, and Dietary Fiber Intake Influence the Human Gut Microbiome. PLoS ONE 2015, 10, e0124599. [Google Scholar] [CrossRef]
  19. World Medical Association. World Medical Association Declaration of Helsinki: Ethical principles for medical research involving human subjects. JAMA 2013, 310, 2191–2194. [Google Scholar] [CrossRef] [PubMed]
  20. Kawabata, S.; Takagaki, M.; Nakamura, H.; Oki, H.; Motooka, D.; Nakamura, S.; Katayama, S.; Shinto, K.; Nakano, T.; Tanaka, K.; et al. Dysbiosis of Gut Microbiome Is Associated with Rupture of Cerebral Aneurysms. Stroke 2022, 53, 895–903. [Google Scholar] [CrossRef]
  21. Watanabe, S.; Kameoka, S.; Shinozaki, O.N.; Kubo, R.; Nishida, A.; Kuriyama, M.; Hamasaki, S.; Sato, T. A cross-sectional analysis from the Mykinso Cohort Study: Establishing reference ranges for Japanese gut microbial indices. Biosci. Microbiota Food Health 2021, 40, 123–134. [Google Scholar] [CrossRef]
  22. Watanabe, S.; Yoshida, N.; Baba, K.; Yamasaki, H.; Shinozaki, O.N.; Ogawa, M.; Hamasaki, S.; Sato, T. Gut microbial stability in older Japanese populations: Insights from the Mykinso cohort. Biosci. Microbiota Food Health 2024, 43, 64–72. [Google Scholar] [CrossRef] [PubMed]
  23. Cykinso. Japan’s Largest Provider of Anonymized Gut Microbiota Information, Expands Data Volume by Six-Fold to 56,312 Samples, Promoting Business Support Using Gut Microbiota Data. (In Japanese) Available online: https://cykinso.co.jp/news/240322 (accessed on 21 April 2025).
  24. Hino, A.; Fukushima, K.; Kusakabe, S.; Ueda, T.; Sudo, T.; Fujita, J.; Kaida, K.; Kanda, J.; Ichinohe, T.; Matsuoka, K.; et al. Prolonged gut microbial alterations in post-transplant survivors of allogeneic haematopoietic stem cell transplantation. Br. J. Haematol. 2023, 201, 725–737. [Google Scholar] [CrossRef] [PubMed]
  25. Nuttall, F.Q. Body Mass Index: Obesity, BMI, and Health: A Critical Review. Nutr. Today 2015, 50, 117–128. [Google Scholar] [CrossRef] [PubMed]
  26. Bolyen, E.; Rideout, J.R.; Dillon, M.R.; Bokulich, N.A.; Abnet, C.C.; Al-Ghalith, G.A.; Alexander, H.; Alm, E.J.; Arumugam, M.; Asnicar, F.; et al. Reproducible, interactive, scalable and extensible microbiome data science using QIIME 2. Nat. Biotechnol. 2019, 37, 852–857. [Google Scholar] [CrossRef]
  27. Bokulich, N.A.; Kaehler, B.D.; Rideout, J.R.; Dillon, M.; Bolyen, E.; Knight, R.; Caporaso, J.G.; Huttley, G.A. Optimizing taxonomic classification of marker-gene amplicon sequences with QIIME 2’s q2-feature-classifier plugin. Microbiome 2018, 6, 93. [Google Scholar] [CrossRef]
  28. Delacre, M.; Lakens, D.; Leys, C. Why Psychologists Should by Default Use Welch’s t-test Instead of Student’s t-test. Int. Rev. Soc. Psychol. 2017, 30, 92–101. [Google Scholar] [CrossRef]
  29. Wallen, Z.D. Comparison study of differential abundance testing methods using two large Parkinson disease gut microbiome datasets derived from 16S amplicon sequencing. BMC Bioinform. 2021, 22, 265. [Google Scholar] [CrossRef]
  30. Xia, Y.; Sun, J. Compositional Analysis of Microbiome Data. In Bioinformatic and Statistical Analysis of Microbiome Data; Springer: Cham, Switzerland, 2023; pp. 491–556. [Google Scholar]
  31. Marcos-Zambrano, L.J.; Karaduzovic-Hadziabdic, K.; Loncar Turukalo, T.; Przymus, P.; Trajkovik, V.; Aasmets, O.; Berland, M.; Gruca, A.; Hasic, J.; Hron, K.; et al. Applications of Machine Learning in Human Microbiome Studies: A Review on Feature Selection, Biomarker Identification, Disease Prediction and Treatment. Front. Microbiol. 2021, 12, 634511. [Google Scholar] [CrossRef]
  32. Segata, N.; Izard, J.; Waldron, L.; Gevers, D.; Miropolsky, L.; Garrett, W.S.; Huttenhower, C. Metagenomic biomarker discovery and explanation. Genome Biol. 2011, 12, R60. [Google Scholar] [CrossRef]
  33. Chong, J.; Liu, P.; Zhou, G.; Xia, J. Using MicrobiomeAnalyst for comprehensive statistical, functional, and meta-analysis of microbiome data. Nat. Protoc. 2020, 15, 799–821. [Google Scholar] [CrossRef]
  34. Shi, Y.; Maga, E.A.; Mienaltowski, J.M. Fecal microbiota changes associated with pathogenic and non-pathogenic diarrheas in foals. BMC Res. Notes 2025, 18, 45. [Google Scholar] [CrossRef]
  35. Jin, H.; You, L.; Zhao, F.; Li, S.; Ma, T.; Kwok, L.-Y.; Zhang, H. Hybrid, ultra-deep metagenomic sequencing enables genomic and functional characterization of low-abundance species in the human gut microbiome. Gut Microbes 2022, 14, 2021790. [Google Scholar] [CrossRef] [PubMed]
  36. Han, G.; Luong, H.; Vaishnava, S. Low abundance members of the gut microbiome exhibit high immunogenicity. Gut Microbes 2022, 14, 2104086. [Google Scholar] [CrossRef]
  37. Falony, G.; Joossens, M.; Vieira-Silva, S.; Wang, J.; Darzi, Y.; Faust, K.; Kurilshikov, A.; Bonder, M.J.; Valles-Colomer, M.; Vandeputte, D.; et al. Population-level analysis of gut microbiome variation. Science 2016, 352, 560–564. [Google Scholar] [CrossRef]
  38. White, R.J.; Nagarajan, N.; Pop, M. Statistical Methods for Detecting Differentially Abundant Features in Clinical Metagenomic Samples. PLoS Comput. Biol. 2009, 5, e1000352. [Google Scholar] [CrossRef] [PubMed]
  39. Hosomi, K.; Saito, M.; Park, J.; Murakami, H.; Shibata, N.; Ando, M.; Nagatake, T.; Konishi, K.; Ohno, H.; Kunisawa, J. Oral administration of Blautia wexlerae ameliorates obesity and type 2 diabetes via metabolic remodeling of the gut microbiota. Nat. Commun. 2022, 13, 4477. [Google Scholar] [CrossRef]
  40. Nishijima, S.; Suda, W.; Oshima, K.; Kim, S.-W.; Hirose, Y.; Morita, H.; Hattori, M. The gut microbiome of healthy Japanese and its microbial and functional uniqueness. DNA Res. 2016, 23, 125–133. [Google Scholar] [CrossRef]
  41. Morotomi, M.; Nagai, F.; Watanabe, Y. Description of Christensenella minuta gen. nov., sp. nov., isolated from human faeces, which forms a distinct branch in the order Clostridiales, and proposal of Christensenellaceae fam. nov. Int. J. Syst. Evol. Microbiol. 2012, 62, 144–149. [Google Scholar] [CrossRef]
  42. Goodrich, J.K.; Waters, J.L.; Poole, A.C.; Sutter, J.L.; Koren, O.; Blekhman, R.; Beaumont, M.; Goodrich, H.J.; Knight, R.; Ley, R.E. Human Genetics Shape the Gut Microbiome. Cell 2014, 159, 789–799. [Google Scholar] [CrossRef] [PubMed]
  43. Waters, J.L.; Ley, R.E. The human gut bacteria Christensenellaceae are widespread, heritable, and associated with health. BMC Biol. 2019, 17, 83. [Google Scholar] [CrossRef] [PubMed]
  44. Giovannoni, S.J.; Thrash, J.C.; Temperton, B. Implications of streamlining theory for microbial ecology. ISME J. 2014, 8, 1553–1565. [Google Scholar] [CrossRef]
  45. Lindsay, C.E.; Metcalfe, B.N.; Llewellyn, S.M. The potential role of the gut microbiota in shaping host energetics and metabolic rate. J. Anim. Ecol. 2020, 89, 2415–2426. [Google Scholar] [CrossRef]
  46. Dey, P.; Chaudhuri, R.S. The opportunistic nature of gut commensal microbiota. Crit. Rev. Microbiol. 2023, 49, 739–763. [Google Scholar] [CrossRef] [PubMed]
  47. Halfvarson, J.; Brislawn, C.J.; Lamendella, R.; Vázquez-Baeza, Y.; Walters, W.A.; Bramer, L.M.; D’Amato, M.; Bonneau, R.; Knight, R.; Jansson, J.K. Dynamics of the human gut microbiome in inflammatory bowel disease. Nat. Microbiol. 2017, 2, 17004. [Google Scholar] [CrossRef]
  48. Zaparte, A.; Christopher, M.; Taylor, J.W.L.; Luo, M.; Lin, H.-Y.; Siggins, R.W.; Molina, P.E.; Welsh, D.A. Sex specific gut bacterial community structure: Implications for frailty risk in people with HIV. GeroScience 2025, 48, 2043–2061. [Google Scholar] [CrossRef]
  49. Coulson, S.; Butt, H.; Vecchio, P.; Gramotnev, H.; Vitetta, L. Green-lipped mussel extract (Perna canaliculus) and glucosamine sulphate in patients with knee osteoarthritis: Therapeutic efficacy and effects on gastrointestinal microbiota profiles. Inflammopharmacology 2013, 21, 79–90. [Google Scholar] [CrossRef]
  50. Fassarella, M.; Blaak, E.E.; Penders, J.; Nauta, A.; Smidt, H.; Zoetendal, G.E. Gut microbiome stability and resilience: Elucidating the response to perturbations in order to modulate gut health. Gut 2021, 70, 595–605. [Google Scholar] [CrossRef] [PubMed]
  51. Shintani, T.; Sakiyama, S.; Ami, Y.; Shintani, H.; Kurihara, S. Effects of D-Glucosamine on the Growth of Human Gut-Dominant Microbiota In Vitro and Bowel Movements in Healthy Individuals. J. Appl. Glycosci. 2026, 73, 7301101. [Google Scholar] [CrossRef]
Figure 1. (A) Principal coordinates analysis (PCoA) based on Bray–Curtis dissimilarity between the glucosamine intake and non-intake groups. Each point represents a single fecal sample (red = control, blue = GlcN user). The first two principal coordinates explain a portion of the variance in community composition (axis labels). A substantial overlap exists between groups, indicating no clear separation in beta diversity. (B) PCoA based on weighted UniFrac dissimilarity between the non-intake groups and the GlcN groups.
Microbiolres 17 00103 g001
Figure 2. Comparison of alpha diversity indices between glucosamine users and non-users. Alpha diversity indices include (A) operational taxonomic units (OTUs), (B) Shannon diversity, and (C) Faith’s phylogenetic diversity (PD) for the full cohort (n = 200). Boxplots show the distributions of OTUs, Shannon index, and Faith’s PD for each group (red = control, blue = GlcN user). In all participants, no significant differences were observed between GlcN and control groups for either metric. Alpha diversity was analyzed using the Mann–Whitney test.
Microbiolres 17 00103 g002
Figure 3. Analysis of composition of microbiomes (ANCOM) results for differential abundance analysis between glucosamine (GlcN) users and controls. The figure displays the W−statistics (W) at the genus level, which were uniformly low, thereby indicating no significant differences in the relative abundance of bacterial genera between the two groups after adjusting for multiple comparisons.
Microbiolres 17 00103 g003
Figure 4. Heat tree visualization of taxonomic differences between glucosamine users and non-users. This tree diagram depicts the bacterial taxonomic hierarchy from phylum (center) down to genus (outer nodes). Node size corresponds to the total abundance of that taxon in the dataset, and node color indicates the direction of difference between groups (red = more abundant in controls, blue = more abundant in GlcN group). Gray indicates no difference. Most nodes are gray or only faintly colored, and no large red or blue clusters are present, signifying no consistent, significant shifts in any part of the taxonomy. A few small nodes on the periphery show slight color changes (rare genus more frequent in controls), but these did not seem statistically robust. The heat tree indicates that GlcN supplementation did not cause broad alterations in the gut microbial community structure.
Microbiolres 17 00103 g004
Figure 5. Comparison of alpha diversity indices between non-users and GlcN users in the normal BMI category. This figure compares alpha diversity indices between glucosamine (GlcN) users and non-users within the normal BMI range (18.5–25.0, n = 140). The alpha diversity indices include: (A) Operational Taxonomic Units (OTU), (B) Shannon Diversity Index, and (C) Faith’s Phylogenetic Diversity (PD). The boxplots illustrate the distribution of OTUs, Shannon diversity, and Faith’s PD for each group (red = control, blue = GlcN user). GlcN users with normal BMI exhibited a slightly lower number of OTUs compared to controls (p = 0.0408, Mann–Whitney test), while trends of lower Shannon diversity and Faith’s PD were observed but did not reach statistical significance.
Microbiolres 17 00103 g005
Table 1. Overview of cohort characteristics.
ItemsControl GroupGlucosamine GroupNote
AgeRange (yrs/o)50–5950–59 Matching
GenderFemale (N)5050Matching
Male (N)5050Matching
BMI18.574Underweight
18.5–25.06773Normal
25.0–30.01920Pre-obese
3073Obese
Table 2. Increase or decrease in the predominant intestinal bacterial groups.
RankAbundance (%)TaxonControl (N = 100)GlcN-Intake
(N = 100)
p Value
MeanSDMeanSD
123.3 p__Bacteroidota;c__Bacteroidia;o__Bacteroidales;f__Bacteroidaceae;g__Bacteroides23.1 12.2 23.6 12.4 0.852
28.4 p__Bacteroidota;c__Bacteroidia;o__Bacteroidales;f__Prevotellaceae;g__Prevotella8.6 14.3 7.8 12.9 0.825
35.8 p__Firmicutes;c__Clostridia;o__Lachnospirales;f__Lachnospiraceae;g__Blautia5.90 3.15 5.58 2.77 0.395
45.2 p__Firmicutes;c__Clostridia;o__Oscillospirales;f__Ruminococcaceae;g__Faecalibacterium5.34 3.88 4.94 3.85 0.439
54.1 p__Firmicutes;c__Clostridia;o__Lachnospirales;f__Lachnospiraceae;__3.97 2.00 3.95 2.15 0.912
63.2 p__Actinobacteriota;c__Actinobacteria;o__Bifidobacteriales;f__Bifidobacteriaceae;g__Bifidobacterium3.09 3.22 3.38 3.64 0.541
72.8 p__Bacteroidota;c__Bacteroidia;o__Bacteroidales;f__Tannerellaceae;g__Parabacteroides2.98 2.63 2.73 2.37 0.460
82.2 p__Bacteroidota;c__Bacteroidia;o__Bacteroidales;f__Rikenellaceae;g__Alistipes2.30 2.80 1.84 2.35 0.194
92.0 p__Firmicutes;c__Clostridia;o__Oscillospirales;f__Ruminococcaceae;g__Ruminococcus2.13 2.91 1.83 3.00 0.451
101.9 p__Firmicutes;c__Negativicutes;o__Veillonellales-Selenomonadales;f__Selenomonadaceae;g__Megamonas2.30 5.95 1.49 3.82 0.241
111.8 p__Actinobacteriota;c__Coriobacteriia;o__Coriobacteriales;f__Coriobacteriaceae;g__Collinsella1.72 1.59 1.75 2.04 0.838
121.7 p__Fusobacteriota;c__Fusobacteriia;o__Fusobacteriales;f__Fusobacteriaceae;g__Fusobacterium1.65 4.39 2.87 10.12 0.276
131.7 p__Firmicutes;c__Clostridia;o__Oscillospirales;f__Ruminococcaceae;g__Subdoligranulum1.69 1.75 1.54 1.72 0.570
141.7 p__Firmicutes;c__Clostridia;o__Lachnospirales;f__Lachnospiraceae;g__Anaerostipes1.77 1.97 1.59 1.86 0.468
151.6 p__Proteobacteria;c__Gammaproteobacteria;o__Burkholderiales;f__Sutterellaceae;g__Sutterella1.48 1.68 1.69 1.71 0.419
161.5 p__Firmicutes;c__Clostridia;o__Lachnospirales;f__Lachnospiraceae;g__Fusicatenibacter1.46 1.41 1.63 1.62 0.470
171.3 p__Firmicutes;c__Clostridia;o__Lachnospirales;f__Lachnospiraceae;g__Agathobacter1.07 1.76 1.41 2.17 0.233
181.2 p__Firmicutes;c__Negativicutes;o__Acidaminococcales;f__Acidaminococcaceae;g__Phascolarctobacterium1.13 1.06 1.25 1.26 0.517
191.2 p__Firmicutes;c__Bacilli;o__Lactobacillales;f__Streptococcaceae;g__Streptococcus0.90 1.87 1.25 2.38 0.250
201.2 p__Bacteroidota;c__Bacteroidia;o__Bacteroidales;__;__0.91 1.72 1.21 2.01 0.256
211.1 p__Firmicutes;c__Clostridia;o__Lachnospirales;f__Lachnospiraceae;g__[Ruminococcus]_gnavus_group0.91 1.59 1.34 2.54 0.162
221.1 p__Firmicutes;c__Clostridia;o__Lachnospirales;f__Lachnospiraceae;g__[Ruminococcus]_torques_group1.15 1.36 1.10 1.15 0.840
Table 3. Low-abundance taxa prevalence.
RankTaxonp-ValueCount
1p__Firmicutes;c__Clostridia;o__Christensenellales;f__Christensenellaceae;__;__0.004 403
2p__Firmicutes;c__Bacilli;o__Izemoplasmatales;f__Izemoplasmatales;g__Izemoplasmatales;s__uncultured_organism0.009 50
3p__Firmicutes;c__Incertae_Sedis;o__DTU014;f__DTU014;g__DTU014;s__unidentified0.009 431
4p__Firmicutes;c__Clostridia;o__Christensenellales;f__Christensenellaceae;g__uncultured;__0.021 469
5p__Firmicutes;c__Clostridia;o__Oscillospirales;f__Ruminococcaceae;g__[Eubacterium]_siraeum_group;__0.022 43
6p__Firmicutes;c__Clostridia;o__Clostridia_vadinBB60_group;f__Clostridia_vadinBB60_group;g__Clostridia_vadinBB60_group;s__uncultured_bacterium0.022 269
7p__Firmicutes;c__Clostridia;o__Eubacteriales;f__Eubacteriaceae;g__Eubacterium;__0.037 147
8p__Firmicutes;c__Clostridia;o__Oscillospirales;f__Oscillospiraceae;g__NK4A214_group;s__uncultured_organism0.037 168
9p__Firmicutes;c__Bacilli;o__Erysipelotrichales;f__Erysipelotrichaceae;g__Faecalitalea;__0.047 86
10p__Proteobacteria;c__Gammaproteobacteria;o__Burkholderiales;f__Sutterellaceae;g__Sutterella;s__metagenome0.047 170
Disclaimer/Publisher’s Note: The statements, opinions and data contained in all publications are solely those of the individual author(s) and contributor(s) and not of MDPI and/or the editor(s). MDPI and/or the editor(s) disclaim responsibility for any injury to people or property resulting from any ideas, methods, instructions or products referred to in the content.