Abstract
Dekkera bruxellensis is already known for its great biotechnological potential, part of this due to the ability to assimilate nitrate during fermentation. Despite the previous works on nitrogen metabolism in this yeast, especially regarding nitrate assimilation, the relation between this metabolism and the TOR (Target of Rapamycin) regulatory mechanism remains unexplored. This connection may reveal key regulatory mechanisms to maximize its fermentative performance and biotechnological use. Herein, we evaluated the physiological, metabolic, and gene expression profile of D. bruxellensis GDB 248 cultivated in ammonium and nitrate as nitrogen sources in the presence of TOR complex 1 (TORC1) inhibitor rapamycin. Our results showed that inhibition of the TORC1 significantly reduces cell growth and fermentative capacity, especially in nitrate media. Gene expression analysis revealed that TORC1 plays a central role in regulating genes involved in nitrate assimilation and the adaptive performance of D. bruxellensis in fermentative environments. Therefore, the regulation of nitrate assimilatory genes YNTI, YNRI, and YNI1 responds to a nitrate-dependent mechanism as well as to a TOR-dependent mechanism. These findings expand the understanding of the regulation of nitrogen metabolism in D. bruxellensis, providing valuable information that may aid in the development of future strategies for its use as an industrial yeast.
1. Introduction
The yeast Dekkera bruxellensis, also known as Brettanomyces bruxellensis, is commonly associated with industrial fermentation processes and has been identified as one of the main contaminants in the bioethanol production process in northeastern Brazil [1,2] and various anthropized environments around the world [3,4,5]. Studies have revealed a set of differential physiological characteristics in the establishment and adaptability to this environment that indicate its biotechnological potential, such as the advantageous assimilation of nitrate that is not used by Saccharomyces cerevisiae [6,7,8,9,10,11,12]. This yeast presents a very relevant genetic diversity and metabolic plasticity for carbon and nitrogen assimilation, depending on the niche from which the strains were isolated [5,13,14,15].
Dekkera bruxellensis strains isolated from industrial alcoholic fermentation using sugarcane juice or molasses as substrate present different fermentative capacities [16] and respond specifically to different culture conditions and the presence of inhibitory agents [17]. For example, strains isolated in Europe that are unable to grow on nitrate as the sole nitrogen source [18,19]. In aerobiosis, nitrate was considered a non-preferential or even poorly assimilable source [20,21]. In addition, intense oxidative stress in D. bruxellensis GDB 248 cells is triggered by nitrate when oxygen is present in the environment [22,23]. A wide variety of genetic and metabolic factors lead to these distinct physiological profiles of D. bruxellensis [12,22,24,25]. On the other hand, strains from bioethanol fermentation can grow anaerobically in the presence of nitrate as the sole nitrogen source, producing ethanol with yields similar to S. cerevisiae [12,22].
In a medium containing glucose as a carbon source, nitrogen compounds are classified as “preferred” (primary) sources and “non-preferred” (secondary) sources, according to the different growth rates calculated from cultivation in a medium containing these assimilable sources [20,25,26]. In general, a nitrogen source was classified as preferred when the growth rate exceeds 0.1 h−1 and as non-preferred when the growth rate is below this value [20,25,26]. Nitrate is assimilated through central nitrogen metabolism to be converted to ammonium and subsequently assimilated into glutamate [27]. When nitrate is assimilated, respiratory metabolism is privileged over fermentation [8,25]. Furthermore, the use of this source can solve the redox imbalance caused by the limitation in the capacity to reoxidize anabolic NADH under oxygen restriction conditions, which results in reduced ethanol production, known as the Custer effect [7,19].
The assimilation of different nitrogen sources in the environment is controlled by the TOR (Target of Rapamycin) regulatory mechanism and the Nitrogen Catabolic Repression (NCR) mechanism, which is negatively regulated by the TOR mechanism via a set of proteins that form its complex 1 (TORC1) [26,28]. In S. cerevisiae, this is a strong inducer of NCR by preventing the use of other nitrogen sources, repressing the transcription of NCR-sensitive genes [28]. However, this does not inhibit the use of nitrate by D. bruxellensis, since both sources are co-consumed in industrial [7] and laboratory environments [25]. There is evidence that nitrate assimilation is subject to a mechanism that is at least partially independent of the TOR regulatory mechanism and the NCR mechanism [7,12,20,21]. A previous study reported the use of methionine sulfoximine (MSX), which inhibits the activity of the enzyme glutamine synthetase and mimics nitrogen starvation, releasing the expression of NCR-sensitive genes and allowing the assimilation of other available nitrogen sources [21,28,29]. In this context, it is evident that nitrogen and oxygen availability influence physiological parameters and gene expression in different ways in D. bruxellensis GDB 248 [12,22,24,25]. However, some gaps have not yet been filled, such as the relation between nitrate and nitrogen metabolism and the genetic aspects involved in this regulation in D. bruxellensis. In this work, we complemented the studies on the regulation data previously obtained with MSX by using rapamycin as a direct inhibitor of the TORC1 regulatory mechanism. The effects of this inhibition on fermentative metabolism and the expression profile of genes from different metabolic pathways are presented, which helps to understand the existence of different regulatory mechanisms acting in the metabolic control of nitrate assimilation in this yeast. The implications of this regulation in terms of the industrial potential of this yeast were also discussed.
2. Materials and Methods
2.1. Yeast Strain and Culture Media
Dekkera bruxellensis GDB 248 (strain URM 8346) was used in the present work [12]. This strain has been used since its identification [1] as a model for studying the biology of this species due to its great adaptation to the industrial environment. Cell maintenance was performed in solid YPD medium (10 g/L yeast extract, 20 g/L peptone, 20 g/L dextrose, and 20 g/L agar). Before the assays, the cells were washed in 0.9% saline solution. For pre-inoculum, the cells were cultured in flasks containing 30 mL of liquid YPD and remained at 30 °C for 48 h on a rotary shaker at 160 rpm (Solab Ltd, Piracicaba, SP, Brazil). Then, the cells were centrifuged and resuspended to prepare seed cultures in synthetic liquid medium YNB (Yeast Nitrogen Base w/o amino acids and ammonium sulfate, 1.7 g/L) supplemented with glucose (20 g/L). Ammonium sulfate (5 g/L) or sodium nitrate (6.43 g/L) was added to achieve the initial concentration of 75 mM of equimolar assimilable nitrogen in both compositions [12,21,22]. Cells were cultivated at 30 °C and 160 rpm for 24 h. All reagents were purchased from Himedia Brazil (São Paulo, SP, Brazil)
2.2. Determination of Rapamycin Concentration
Cells precultured in YPD medium were collected, washed and used to inoculate synthetic YNB medium (1.7 g/L) containing glucose (20 g/L) and ammonium sulfate (5 g/L) or sodium nitrate (6.4 g/L) in the absence (reference condition) or presence of rapamycin (Merck, Darmstadt, Germany) at different concentrations up to 160 ng/mL. For growth in the microplate reader, cells were inoculated at an initial concentration of 0.1 OD 600 nm in a volume of 150 μL. Cultivations were performed at 30 °C and with continuous agitation for 48 h. Cell growth kinetics in each condition were evaluated by growth curves using a multi-reader for ELISA plates. The concentration of rapamycin chosen for subsequent assays was sufficient to not completely inhibit the TOR regulatory mechanism, allowing cell growth relative to 30% of the growth in the reference condition. To attest to the significance of the results, the cultures were performed in independent biological triplicate.
2.3. Growth Assays in Microtiter Plates
Aerobic growth cultures were performed in a multidetector microplate reader Synergy HT (Biotek, Winooski, VT, USA) using 96-well microplates. Cultivations were performed in YNB medium with 110 mM glucose as the sole carbon source and 75 mM ammonium sulfate or sodium nitrate as the sole nitrogen source. For growth in the microplate reader, cells were inoculated with seed cultures to an initial concentration of 0.1 OD 600 nm in a volume of 150 μL. Cultivations were performed at 30 °C and with continuous shaking for 40 h in Synergy HT multireader (Bioteck, Winooski, VT, USA) with automatic absorbance reading at 600 nm, following the manufacturer’s instructions. Rapamycin, representing the TORC1 inhibitor (iTOR), was selected from the screening described above at a concentration of 60 ng/mL. The conditions were tested in different plates and combinations: glucose + ammonium, glucose + ammonium + iTOR, glucose + nitrate, glucose + nitrate + iTOR. All experiments were performed in biological duplicates with technical triplicates and a negative control containing only culture medium. The growth rate (μ, h−1) was calculated from the slope of the logarithmic growth phase as previously described [8].
2.4. Fermentation Tests
Aerobic cultures were also performed in YNB medium with 110 mM glucose and 75 mM ammonium or nitrate. Cultures were performed in the presence and absence of rapamycin. The following culture conditions were tested: Glucose + ammonium, Glucose + ammonium + iTOR, Glucose + nitrate, Glucose + nitrate + iTOR. A volume of 30 mL of synthetic medium with ammonium was used in 125 mL flasks, and 60 mL of synthetic medium with nitrate in 250 mL flasks. These media were inoculated with seed cultures to an initial density of 0.5 OD, and then they were incubated on an orbital shaker at 30 °C and 150 rpm for 24 h. All experiments were performed in biological duplicates. Samples were taken and diluted in 0.9% saline to the range of 0.2 to 0.6 absorbance units at 600 nm in Synergy HT multireader (BioTek, Winooski, VT, USA). The absorbance value was calculated by multiplying the measured absorbance by the dilution of the sample. Values were plotted on a semi-log scale, and the growth rate was calculated as above. At the beginning of the exponential phase, samples were collected and centrifuged at 4 °C to separate the supernatants, which were then subjected to analysis by high-performance liquid chromatography (HPLC). The cell pellets were immediately frozen in liquid nitrogen and stored at −80 °C until RNA extraction.
2.5. Quantification of Extracellular Metabolites
The supernatants were collected, filtered with 0.22 μm membranes (Merck, Darmstadt, Germany), and used for HPLC analysis to determine the following metabolites: glucose, acetate, ethanol, and glycerol. For this, an HPX-87H ion exchange column (BioRad, Hercules, CA, USA) was used at 60 °C and a 5 mM H2SO4 solution was used as the mobile phase at a flow rate of 0.6 mL/min and detected by the refractive index of the samples [8,22]. Standard calibration curves were performed, and the metabolite parameters were calculated as described [8,30,31]. Carbon balance calculations were performed as reported [30,31].
2.6. Analysis of Relative Gene Expression
Cells were lysed by suspension in 200 μL of lyticase-containing solution. Subsequently, total RNA was isolated using the Maxwell® LEV simplyRNA Blood Kit, processed in the Maxwell equipment (Promega Co., Madison, WI, USA), following the manufacturer’s instructions. RNA quantification was performed in the Nanodrop equipment (Thermo Fischer Scientific, Waltham, MA, USA), and its integrity was verified by electrophoresis in a 1% agarose gel prepared with TAE buffer treated with DEPC and stained with ethidium bromide. cDNA synthesis was performed using the GoScript™ Reverse Transcription Mix, Oligo (dT) (Promega, Madison, WI, USA), with 2.5 μg of total RNA in 20 μL reactions, ensuring standardization of the input concentration for gene expression quantification. qPCR experiments were performed on the ABI Prism 7300 system (Applied Biosystems, Waltham, MA, USA) with the GoTaq® qPCR Master Mix. The selection of reference genes, primer validation, and data analysis followed the standardized procedures for gene expression analysis by qPCR in D. bruxellensis [32]. Reference genes already validated for this species [32] were used as internal controls. All experiments were conducted with biological duplicates and technical triplicates for each condition analyzed. The data for each gene were submitted to statistical analysis by One-Way ANOVA Calculator and Tukey HSD based on the Shapiro-Wilk Test at α = 0.05, available online at https://www.statskingdom.com/180Anova1way.html (accessed on 30 August 2023). Raw data are available in the Supplementary Material.
3. Results
3.1. Rapamycin Acts as an Inhibitor of the TORC1 in D. bruxellensis
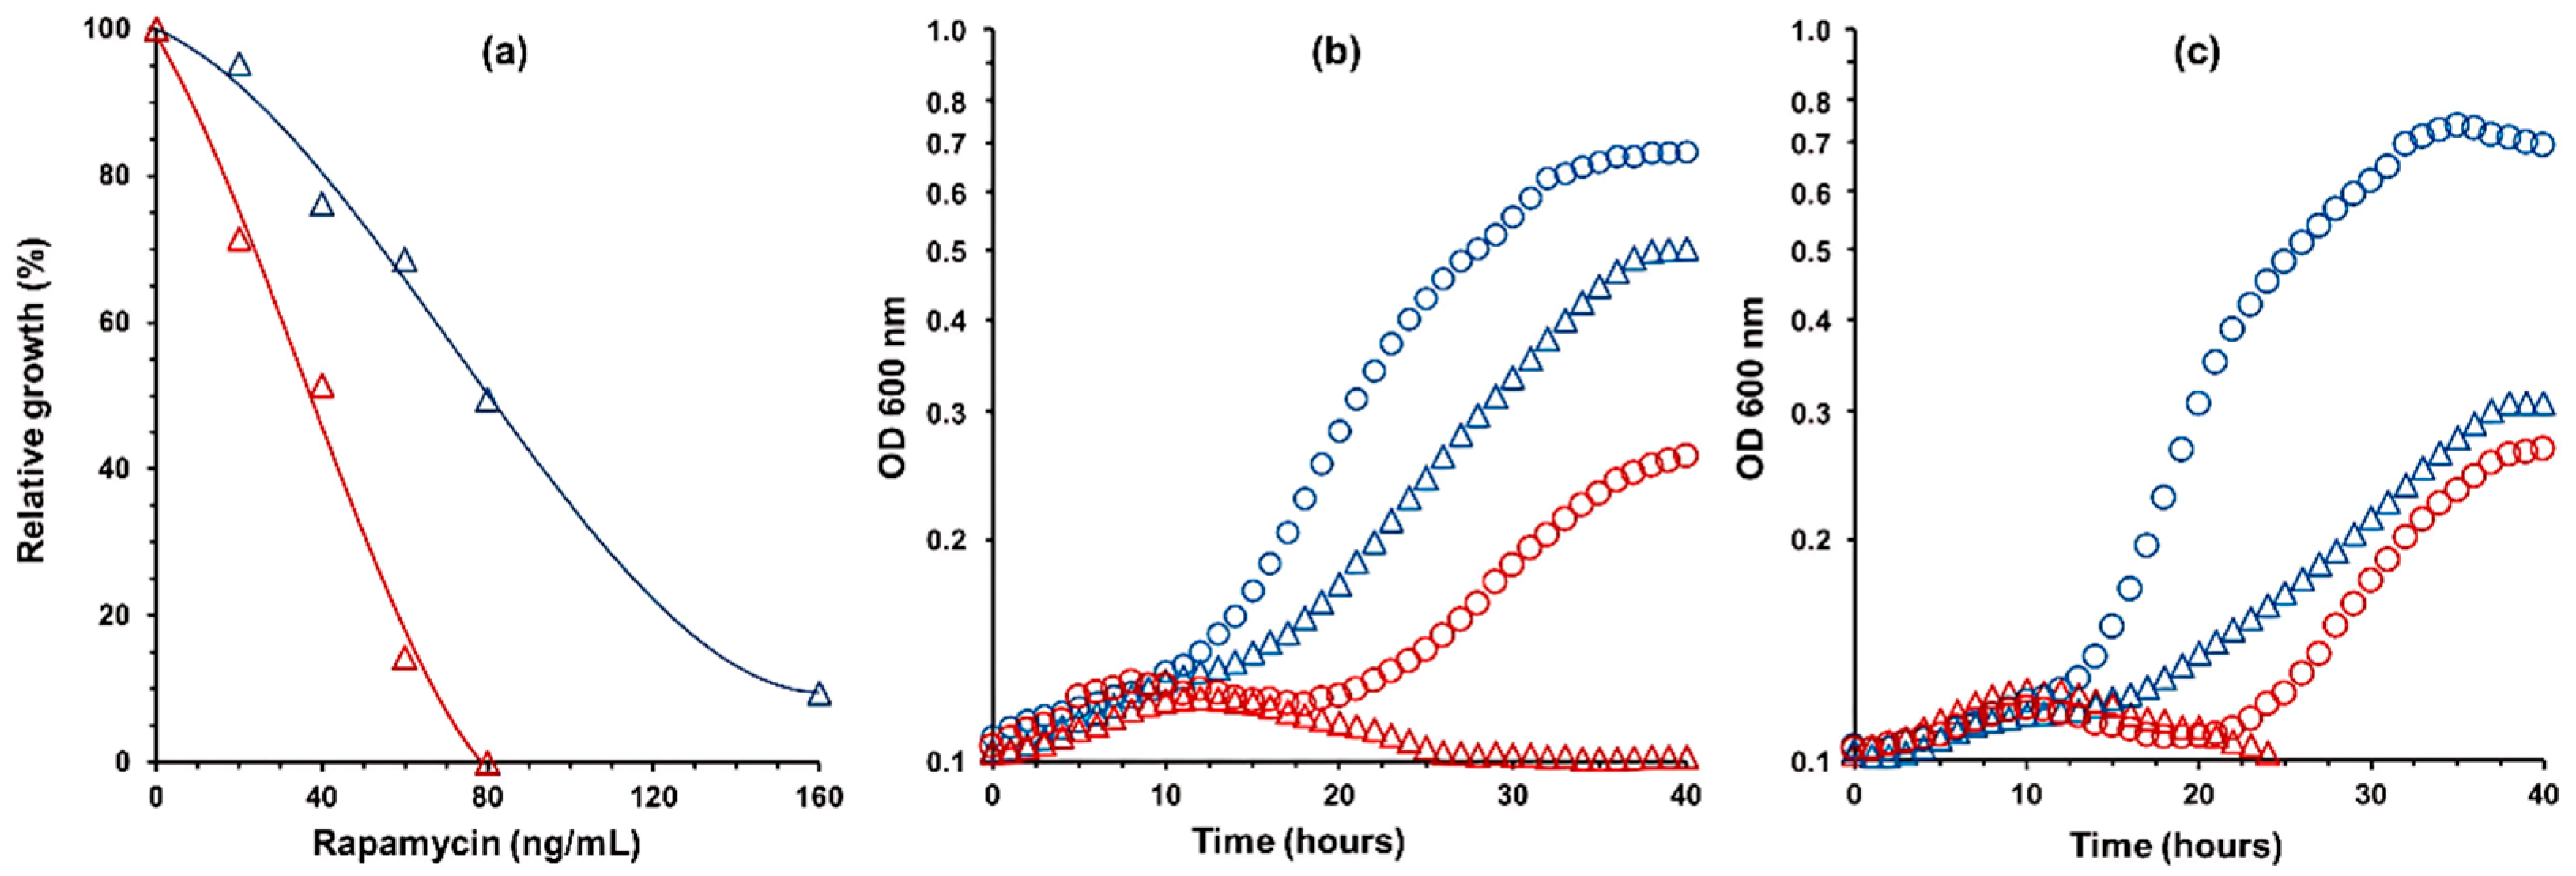
We have been studying the physiological effects of nitrate assimilation by the yeast D. bruxellensis, a trait that could be advantageous for its use in industrial processes [7]. Together with the physiological data, we gathered information on the metabolism of nitrate and other nitrogen sources and the expression of genes involved in those pathways [7,12,21,22,25,31,33]. The data obtained so far pointed to the participation of the TOR complex 1 (TORC1) in the regulation of those genes, since this is considered the major regulator that connects the nitrogen metabolism with cell development and growth in the model yeast S. cerevisiae [26,27,28,29]. Rapamycin, a classic inhibitor of the serine/threonine-specific protein kinase of TORC1, was added to YNB synthetic medium containing ammonium or nitrate as a nitrogen source in different concentrations (Figure 1a). The results showed that a concentration of 60 ng/mL of rapamycin reduced biomass production by 30% in the exponential growth phase in medium with ammonium. This inhibition was much greater in the medium with nitrate, with an 85% reduction in yeast biomass (Figure 1a). These results indicate that rapamycin also inhibits the TORC1 in D. bruxellensis, as described for S. cerevisiae [29,34], much more in nitrate-containing medium than in ammonium-containing medium.
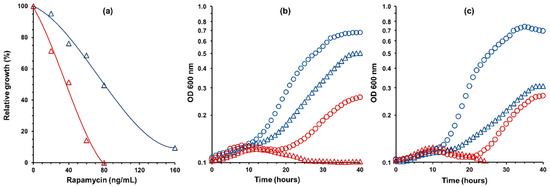
Figure 1.
Effect of rapamycin as an inhibitor of the serine/threonine-specific protein kinase of TOR regulatory pathway complex 1 (TORC1) in the cells of D. bruxellensis GDB 248 strain. (a) The yeast cells were cultivated in YNB medium containing ammonium (blue line) or nitrate (red line) as a nitrogen source in different rapamycin concentrations. Aerobic growth rate was calculated from the exponential growth phase and relativized from the reference condition without inhibitor. (b) Yeast cells were pre-cultivated in YNB-ammonium and re-inoculated in the YNB containing ammonium in the absence (blue circles) or in the presence of rapamycin at 60 ng/L (blue triangles) and the YNB containing nitrate in the absence (red circles) or the presence of rapamycin at 60 ng/L (red triangles). (c) Cells were pre-cultivated in YNB-nitrate and re-inoculated as in panel (b). Values represent the mean of six microcultures. Standard deviation values were less than 5%.
The effects of rapamycin on yeast growth kinetics were also evaluated based on pre-cultivation conditions in the two nitrogen sources (Figure 1b,c). The reference condition consisted of pre-cultivation in ammonium and re-inoculation in ammonium (Figure 1b). The final biomass achieved in the cultures was 9.42 g/L in ammonium (μ = 0.099 h−1), 6.75 g/L in ammonium plus rapamycin (μ = 0.065 h−1), 2.78 g/L in nitrate (μ = 0.054 h−1), and 0.97 g/L in nitrate plus rapamycin (μ = 0.020 h−1). The results showed that 60 ng/mL rapamycin reduced the maximum growth rate of D. bruxellensis in the ammonium medium. In contrast, 60 ng/mL rapamycin reduced the growth rate by 85% in the nitrate medium (Figure 1b). It has to be taken into consideration in this analysis that aerobic nitrate assimilation imposes some oxidative stress on the cells [12,23]. The presence of rapamycin practically inhibited cell growth in nitrate when coming from a nitrate pre-culture (Figure 1c). Therefore, there appears to be a cumulative negative effect of rapamycin when cells are exposed to nitrate for long periods.
Cells pre-cultivated in nitrate and then re-inoculated in ammonium showed a growth profile similar to that of cells pre-cultivated in ammonium and subsequently re-inoculated in ammonium. Therefore, the physiology of D. bruxellensis in ammonium was independent of the previous culture condition. On the other hand, this pre-culture in nitrate intensified the inhibitory effect of rapamycin on ammonium (Figure 1c). This indicates that the prior metabolization of nitrate produces a physiological effect that is maintained for the next cell culture in ammonium, but not in nitrate (Figure 1c). Previous studies have suggested that nitrate assimilation is controlled by a specific metabolic regulation process that is independent of the NCR mechanism [12,21]. Therefore, this mechanism would be hierarchically upstream of the NCR. Thus, this downstream regulatory effect would depend on the functioning of the TOR regulatory mechanism. It was addressed in the present study by analyzing the expression profile of key genes in the landscape of the NCR mechanism and its connection to nitrate assimilation.
3.2. TOR Mechanism Controls the Nitrogen Metabolism at the Glutamine Level
The relative expression profile of genes involved in central nitrogen metabolism, including nitrate assimilation, was defined. The genes were divided into three groups. Group 1 includes the genes GAP1 (general amino acid permease) and PUT4 (proline permease), whose orthologs are under the control of NCR in S. cerevisiae. The second group comprises genes encoding enzymes involved in the transport and conversion of ammonium into glutamate and glutamine: MEP1 (ammonium permease), GDH1 (NADPH-dependent glutamate dehydrogenase), and GLT1 (NAD+-dependent glutamate synthase). The third group includes the NIT genes specifically involved in nitrate assimilation: YNTI (nitrate permease), YNR1 (nitrate reductase), and YNI1 (nitrite reductase). The YNA1 gene may encode a putative transcription factor that controls these three nitrate metabolization genes.
The results showed that GAP1 expression was increased by the presence of rapamycin in both nitrogen sources (Figure 2a, blue and green columns). Hence, the expression of GAP1 is released upon TORC1 inhibition. Nitrate had no significant effect on the expression of this gene (Figure 2a, red column). GAP1 expression in nitrate plus rapamycin was practically the same if the reference was ammonium (Figure 2a, green column) or nitrate (Figure 2a, black column). It indicated that only TORC1 acted as a negative regulator of this gene. The expression of the PUT4 gene was also increased by the presence of rapamycin in ammonium (Figure 2b, blue column) and nitrate (Figure 2b, green column). It indicated that this gene was also regulated by TORC1. Different from GAP1, PUT4 was also upregulated by nitrate (Figure 2b, red column). A slight upregulation effect was observed in nitrate plus rapamycin compared to nitrate (Figure 2b, black column), which means that the strength of nitrate induction was lower than the signal through TORC1.
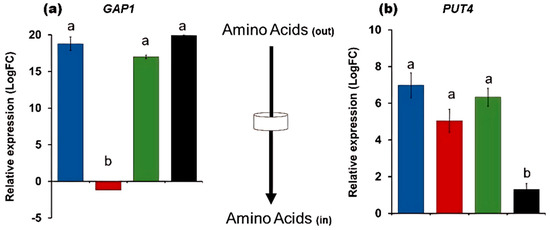
Figure 2.
Transcription level of the genes GAP1 (panel (a)) and PUT4 (panel (b)) involved in amino acid transport. Gene expressions were evaluated in cells grown in YNB synthetic medium containing glucose as a carbon source and different nitrogen sources, such as ammonium + rapamycin 60 ng/L (blue bars), nitrate (red bars), nitrate + rapamycin 60 ng/L (green bars), relative to the reference condition with ammonium. In addition, gene expression in nitrate + rapamycin was also relative to nitrate (black bars). Values represent the mean of six replicates for each condition (standard error bars are shown). Different lowercase letters indicate significant statistical differences by One-Way ANOVA Calculator and Tukey HSD based on the Shapiro-Wilk Test at α = 0.05 (https://www.statskingdom.com/180Anova1way.html, accessed on 2 May 2025).
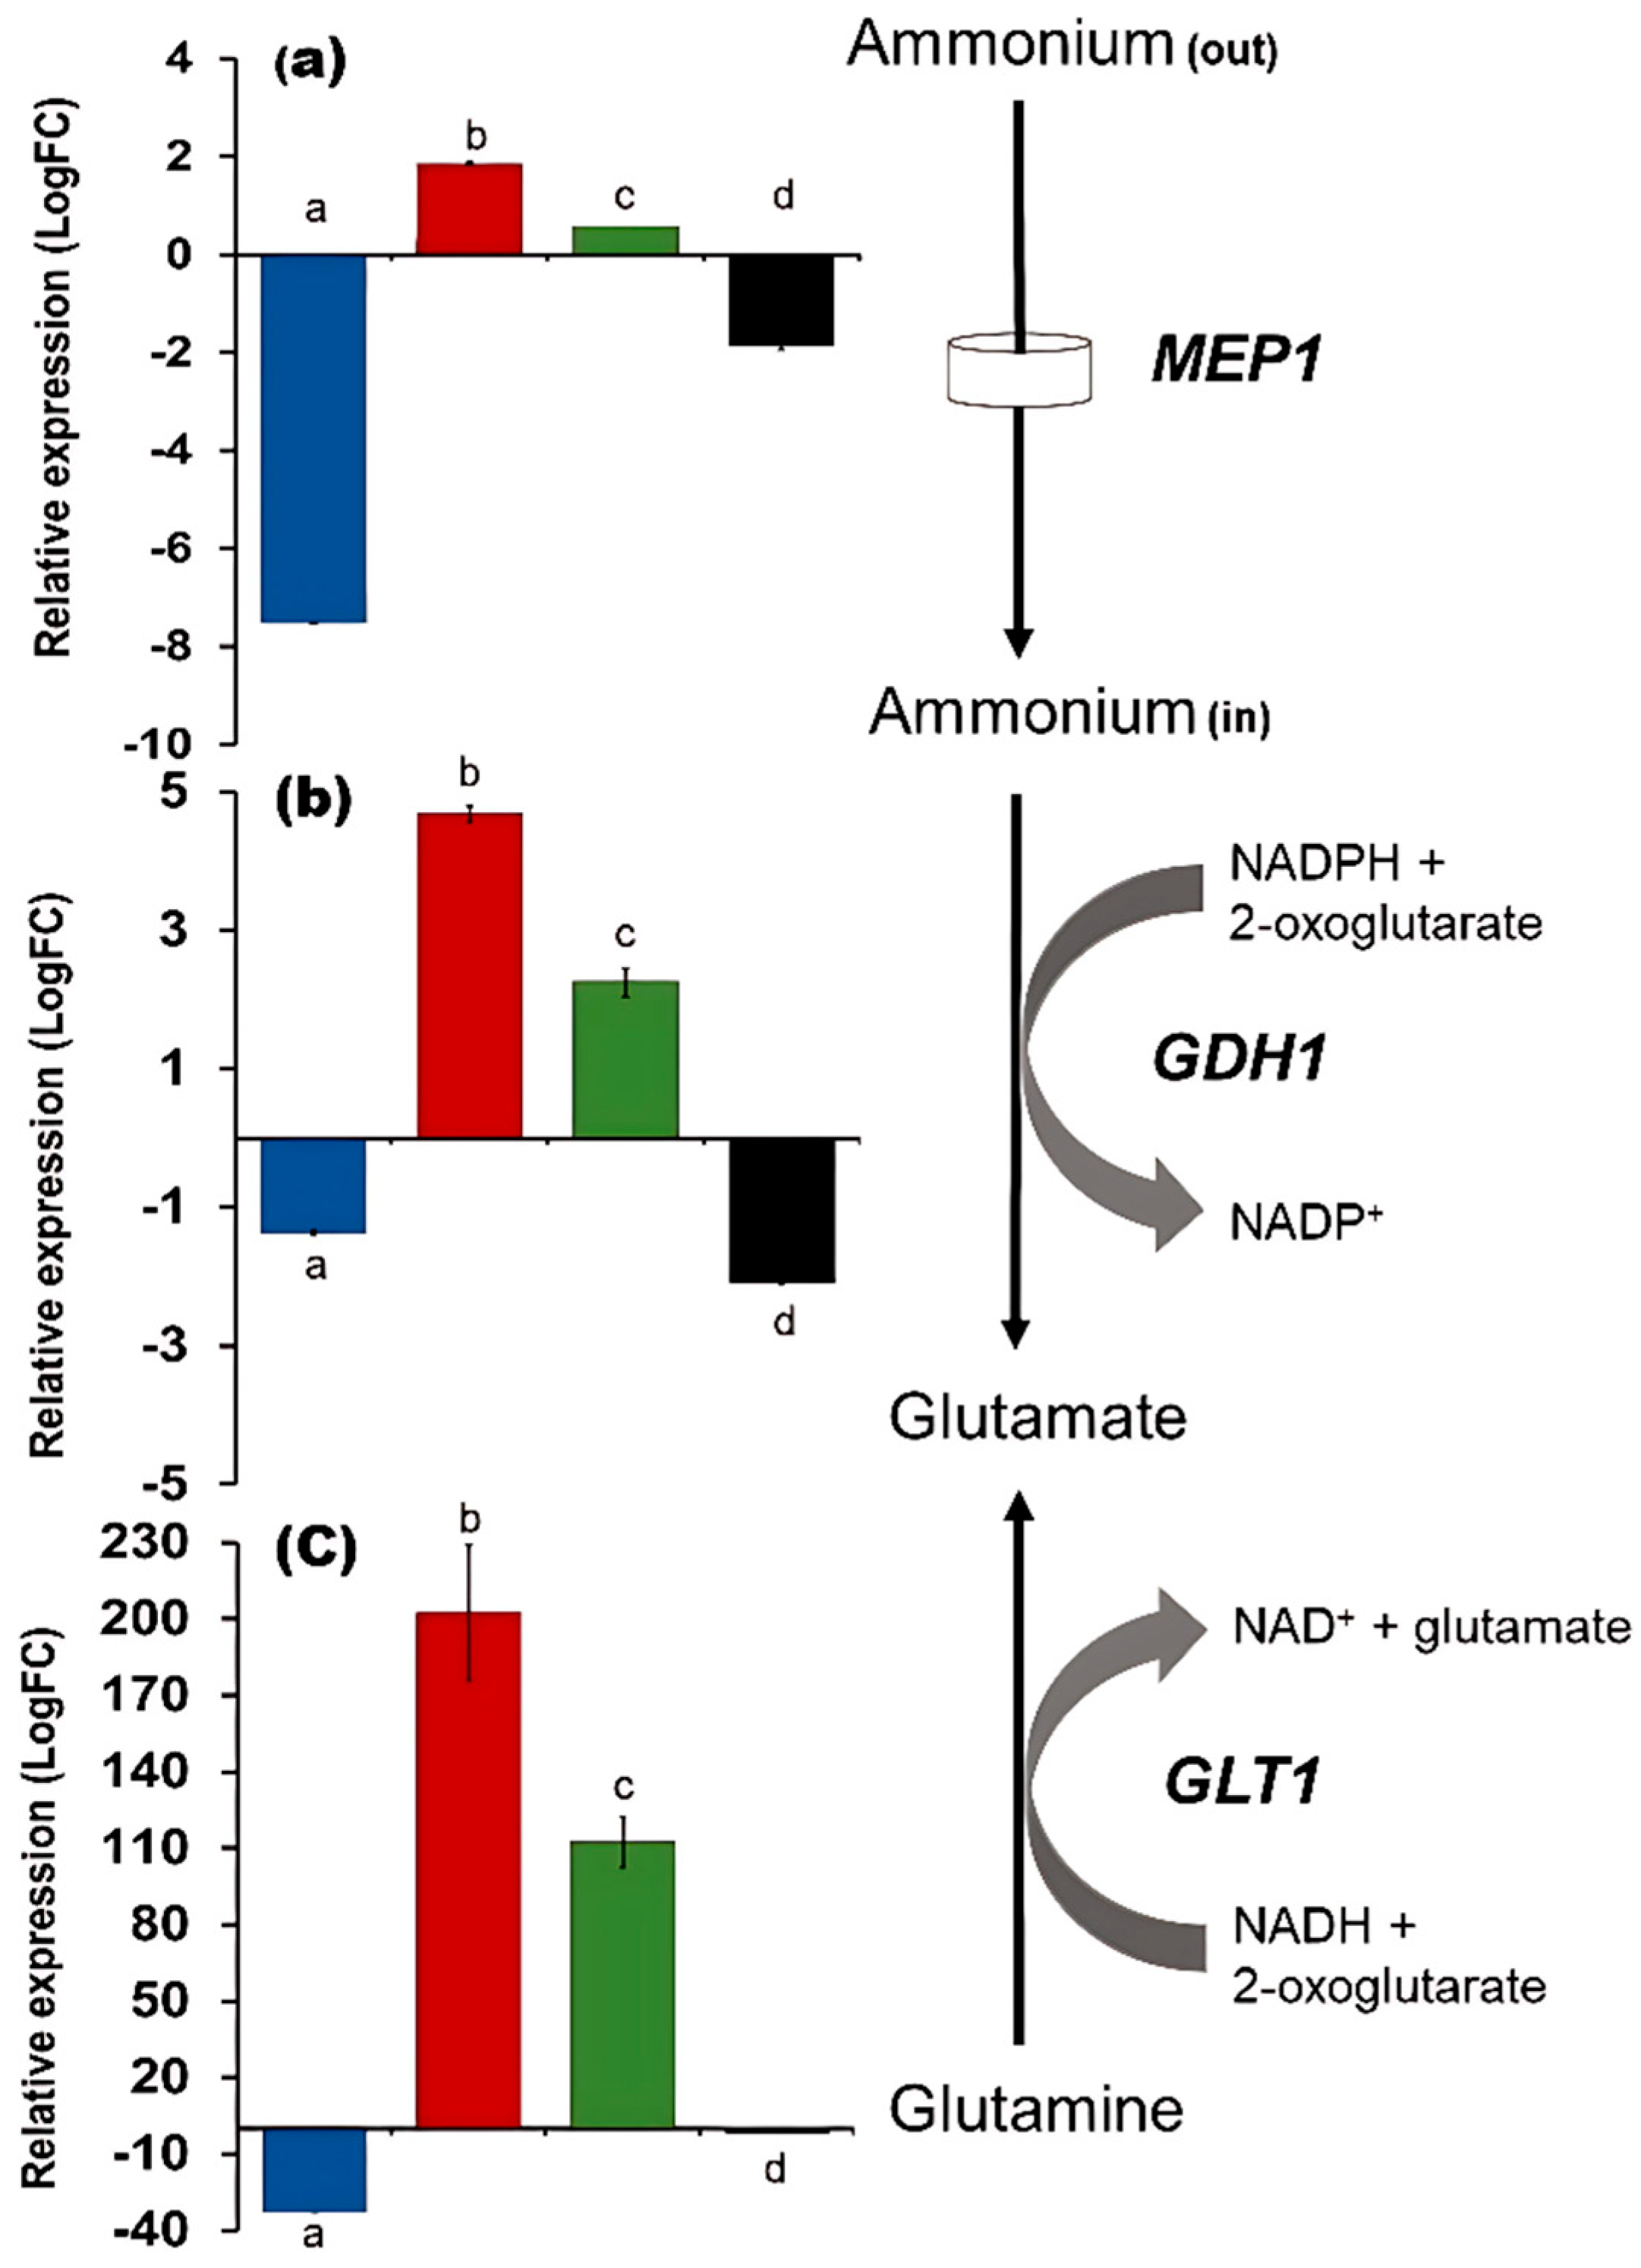
Regarding the second group of genes, the expression of MEP1 and GLT1 was severely affected by rapamycin in ammonium, while GDH1 was only slightly reduced (Figure 3a–c, blue columns). In this case, the results showed that the functionality of TORC1 was essential for their expression. All three genes were upregulated by nitrate, highlighting the impressive overexpression of GLT1 (Figure 3a–c, red columns). The presence of rapamycin reduced the strength of nitrate induction (Figure 3a–c, green columns). It indicated that both TORC1 and nitrate equally participated in the upregulation of these genes. A very faint signal was observed when the nitrate plus rapamycin condition was relative to nitrate (Figure 3a–c, black columns), which indicated that nitrate, or the specific mechanism that responds to it, was enough for the upregulation of these three genes.

Figure 3.
Transcription level of the genes MEP1 (panel (a)), GDH1 (panel (b)), and GLT1 (panel (c)) involved in ammonia transport and assimilation. Gene expressions were evaluated in cells grown in YNB synthetic medium containing glucose as a carbon source and different nitrogen sources, such as ammonium + rapamycin 60 ng/L (blue bars), nitrate (red bars), nitrate + rapamycin 60 ng/L (green bars), relative to the reference condition with ammonium. In addition, gene expression in nitrate + rapamycin was also relative to nitrate (black bars). Values represent the mean of six replicates for each condition (standard error bars are shown). Different lowercase letters indicate significant statistical differences, as determined by the One-Way ANOVA Calculator and Tukey HSD test, based on the Shapiro-Wilk Test at α = 0.05 (https://www.statskingdom.com/180Anova1way.html, accessed on 2 May 2025).
3.3. The Expression of NIT Genes Is Under the Control of the TORC1
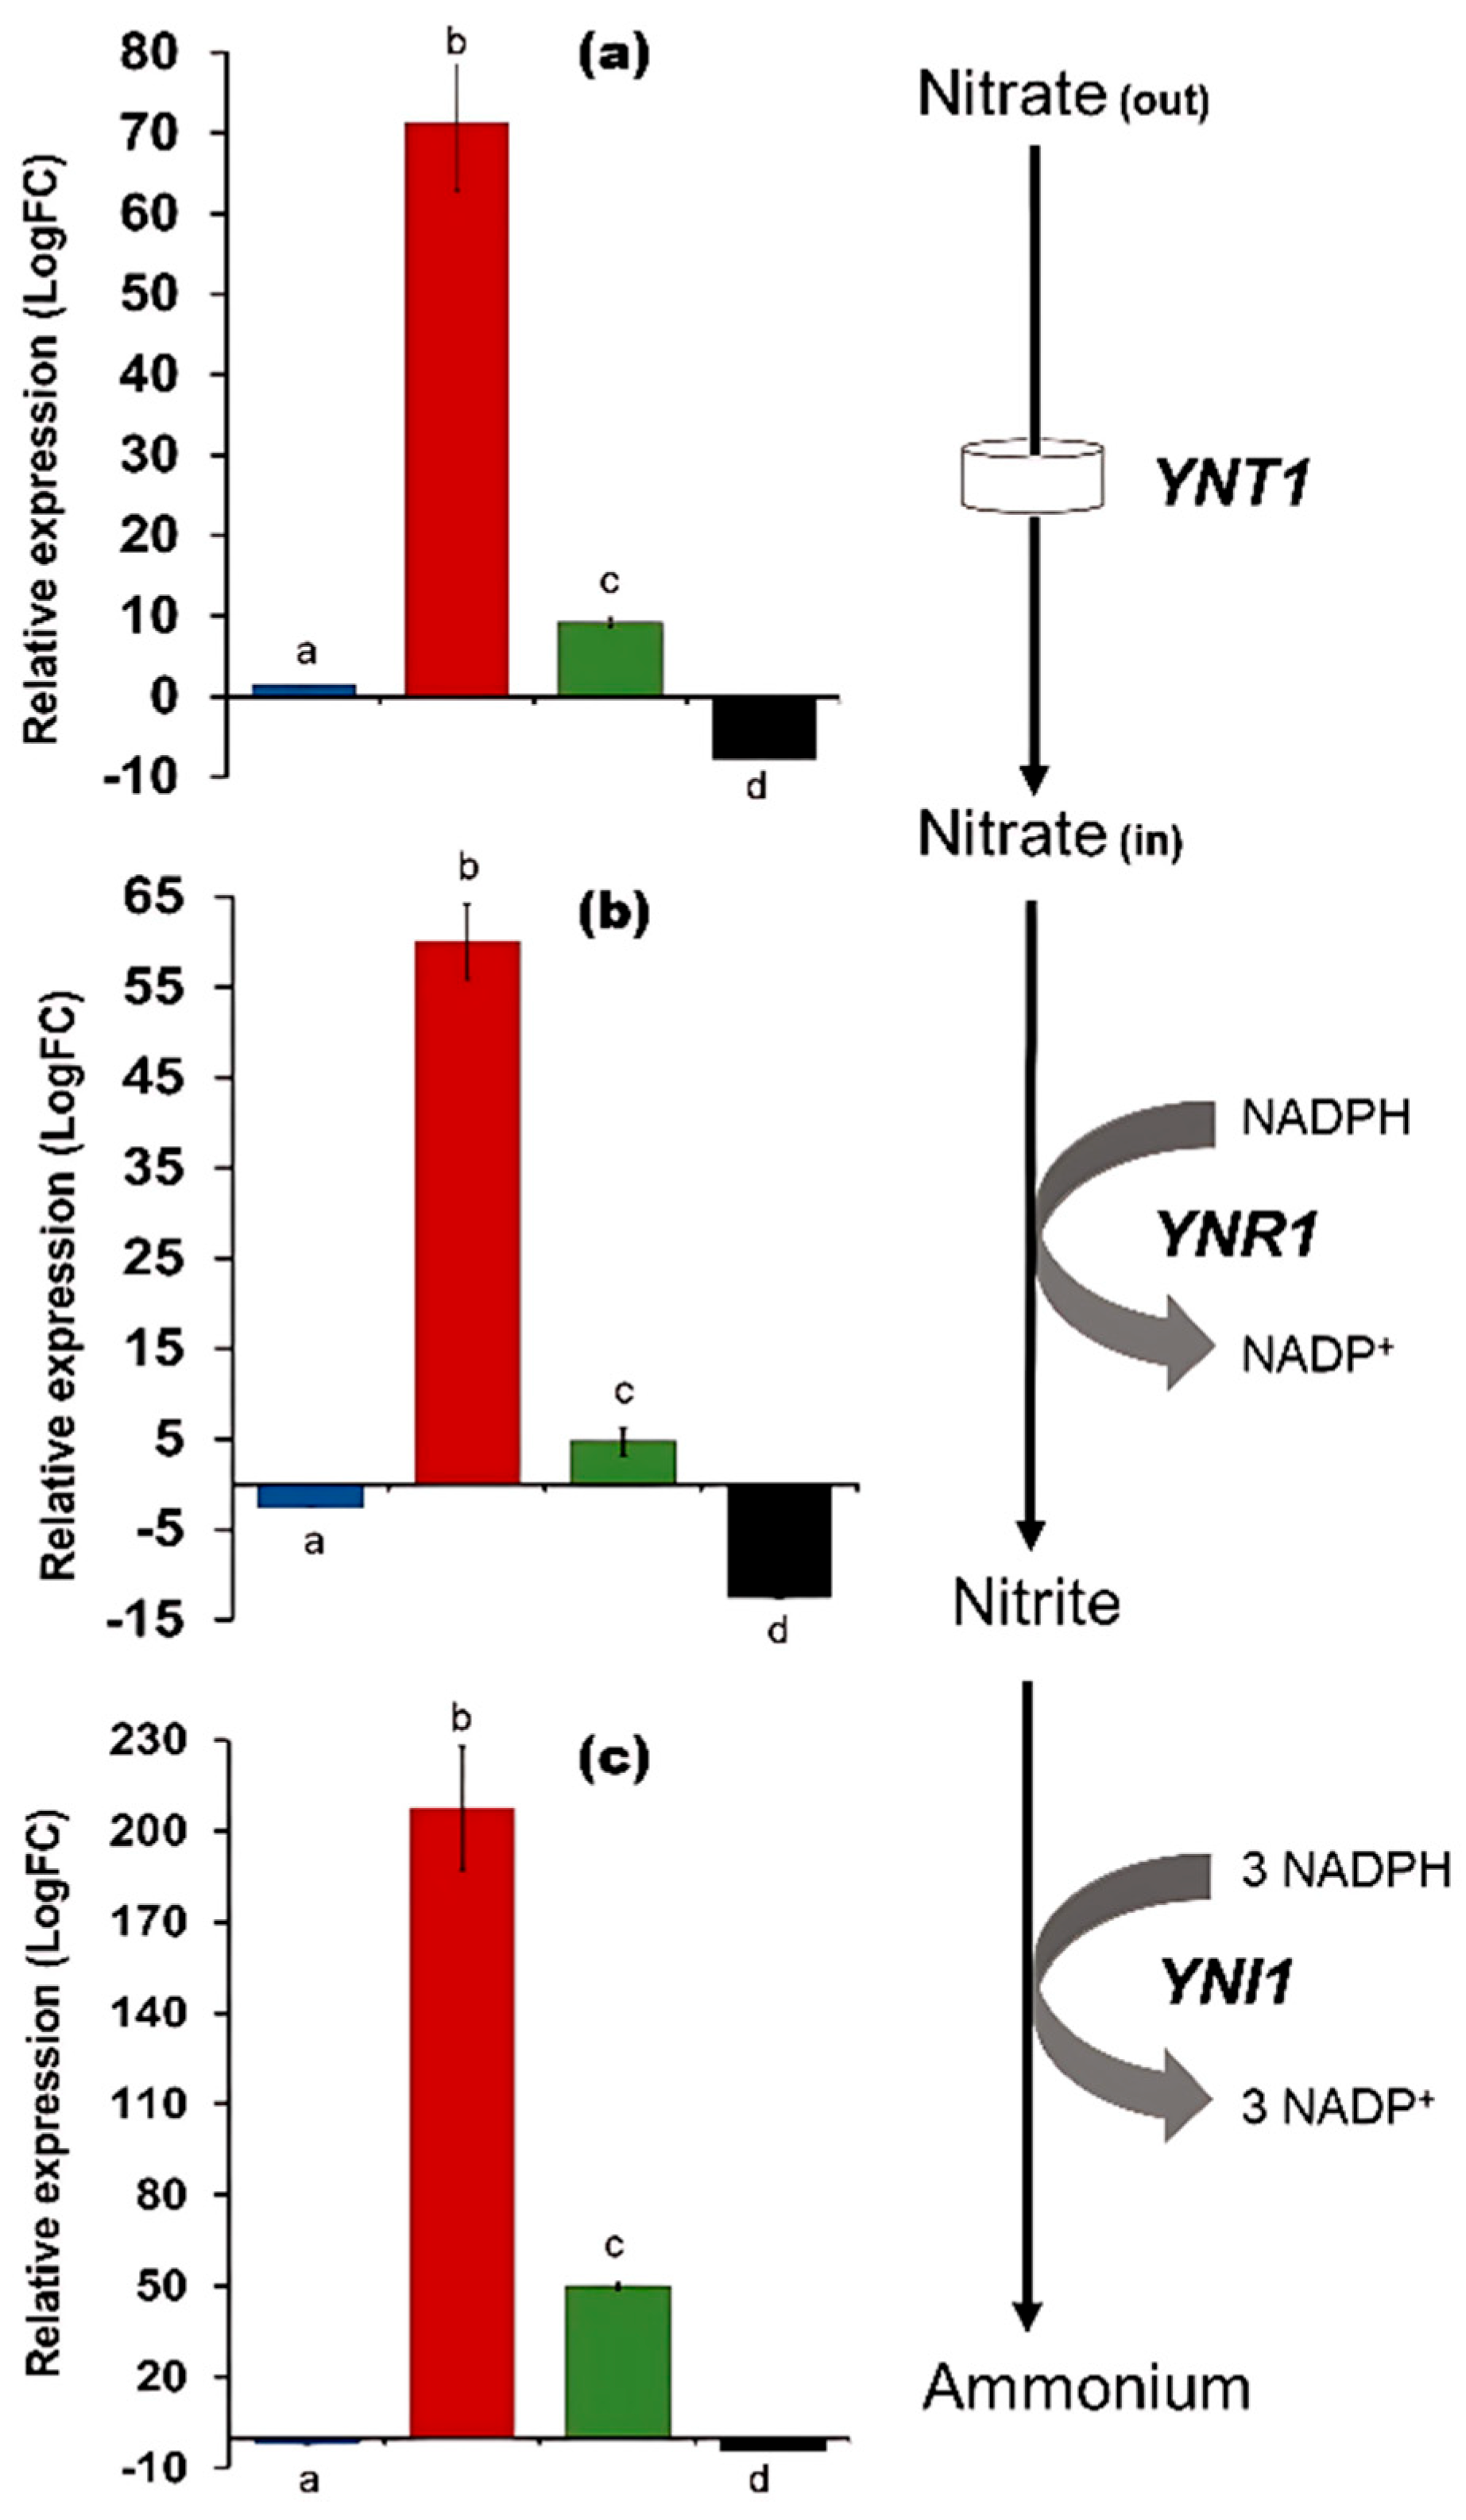
In our first work regarding nitrate assimilation by D. bruxellensis, we showed that all three structural NIT genes, a permease (YNTI) and two oxo-reductive enzymes (YNR1 and YNI1), were upregulated by nitrate even in the presence of ammonium [7]. The results herein confirmed the upregulation of NIT genes when the cells were cultivated in nitrate relative to ammonium medium, with an astonishing fold change for YNI1 (Figure 4a–c, red columns). In addition, their expression was not affected when rapamycin was added to ammonium medium (Figure 4a–c, blue columns). Therefore, these genes were not subject to the direct action of TORC1. Surprisingly, the addition of rapamycin strongly reduced the inductive signal of nitrate present in the medium, both in ammonium (Figure 4a–c, green columns) and in nitrate (Figure 4a–c, black columns) as reference condition. The gene YNA1 displayed the same expression behavior as the three structural genes (Supplementary Materials). It indicated an interplay between TORC1 and the nitrate signaling mechanism in a way that the integrity of the TORC1 signaling cascade may amplify the signal downstream triggered by nitrate.
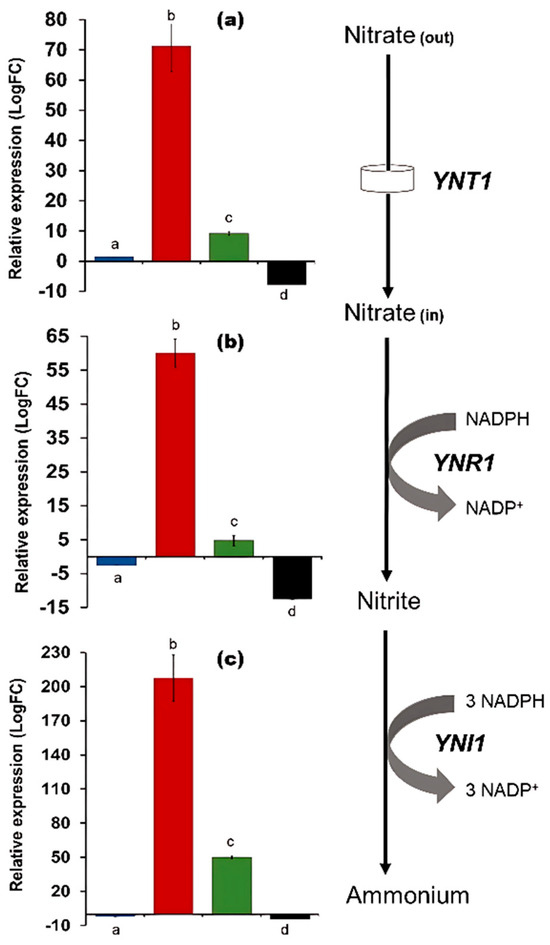
Figure 4.
Transcription level of the genes YNTI (panel (a)), YNR1 (panel (b)), and YNI1 (panel (c)) involved in nitrate assimilation in Dekkera bruxellensis. Gene expression was quantified from cells grown in YNB synthetic medium containing glucose as a carbon source and different nitrogen sources, such as ammonium + rapamycin (60 ng/L, blue bars), nitrate (red bars), and nitrate + rapamycin (60 ng/L, green bars), relative to the reference condition with ammonium. In addition, gene expression in nitrate + rapamycin was also relative to nitrate (black bars). Values represent the mean of six replicates for each condition (standard error bars are shown). Different lowercase letters indicate significant statistical differences by One-Way ANOVA Calculator and Tukey HSD based on the Shapiro-Wilk Test at α = 0.05 (https://www.statskingdom.com/180Anova1way.html, accessed on 2 May 2025).
We tentatively calculated the strength of each possible regulatory mechanism that acts on the expression of NIT genes. For the YNR1 gene, there was a 92% reduction in expression when TORC1 was inhibited, indicating that this is the contribution of the TOR regulatory mechanism in the regulation of the expression of this gene, with the remaining 8% being under the control of a nitrate-dependent mechanism. The contribution of the TOR regulatory mechanism to the YNTI, YNA1, and YNI1 genes was calculated as 84%, 80%, and 75%, respectively. These results explain why NIT genes are not downregulated by ammonium [7], since this preferential nitrogen source activates the TOR system and, consequently, benefits the expression of nitrate genes. Hence, it revealed that these genes were not subjected to the NCR mechanism in this yeast. This positive action of the TORC1 regulatory mechanism on nitrate genes was recently proposed based on comparative proteomic analyses performed on D. bruxellensis cells grown in ammonium and nitrate [12].
3.4. Partial Inactivation of TORC1 Hampered the Fermentation Metabolism in Nitrate
Since D. bruxellensis is a Crabtree-positive yeast, it can produce ethanol from hexose even in the presence of oxygen [8]. Nitrate assimilation almost abolishes this metabolic activity [25]. However, this negative effect is blocked when the cells are under anoxic conditions [22], which may explain the high ethanol production in sugarcane juice that contains nitrate [7]. Hence, it seemed relevant to evaluate the eventual role of TORC1, which was shown herein to control NIT genes, in the regulation of the fermentative metabolism in this yeast. Under fermentative conditions with agitation, all glucose was consumed by the yeast cells at the end of 40 h of cultivation in YNB medium containing ammonium, independent of the presence of rapamycin (Table 1). Ethanol yield reached 0.43 (g/g) in the reference condition, and was reduced by 50% when rapamycin was added to the medium. Biomass yield was also reduced by 70% in the presence of rapamycin relative to the reference condition (Table 1). Acetate was not detected in ammonium-based medium (Table 1). The production of CO2 was stoichiometrically calculated from the fermentation products, and it almost closed the mass balance of the system in the reference condition (Table 1). This implies that the measurements and calculations of the physiological parameters were very robust. On the other hand, the low mass recovery in the presence of rapamycin indicated that the stoichiometric CO2 might be understated (Table 1). Therefore, part of the substrate mass must be lost through some decarboxylation reaction or reactions not coupled to the formation of biomass or another fermentation product as a result of the TORC1 partial inhibition.

Table 1.
Physiological parameters of Dekkera bruxellensis GDB248 cells in fermentation assays in YNB medium containing ammonium or nitrate as nitrogen source in the absence (REF condition) or presence of rapamycin 60 ng/L as a TOR pathway inhibitor (iTOR condition) in the middle of the exponential growth phase.
Regarding carbon distribution through the central metabolism, the calculations shown in Table 1 indicate that a total of 3738 mmol out of 4483 mmol (83%) of glucose carbon was diverted from pyruvate to acetaldehyde by pyruvate decarboxylase in ammonium during the period of cultivation. It was reduced from 4497 to 2326 mmol (52%) in the presence of rapamycin, showing that the carbon flow through the fermentative pathway decreased by 38% when TORC1 was partially inhibited. It explains the drop in the fermentation activity (Table 1). Therefore, the direction of carbon for cell building was also affected by rapamycin (Table 1).
Assimilation of nitrate did not affect glucose consumption (Table 1). In this situation, the ethanol yield fell to 72%, and the biomass yield dropped to 30% of that calculated for the medium with ammonia (Table 1). Different from ammonium, the assimilation of nitrate stimulated the production of acetate (Table 1). The inhibition of TORC1 suppressed glucose assimilation when nitrate was used as a nitrogen source (Table 1), which explains the very low cell growth (Figure 1b). However, biomass yield was three times higher than in the absence of rapamycin, while ethanol was not produced at all (Table 1). This indicates that the consumed carbon was fundamentally used for cell biosynthesis. TORC1 partial inhibition resulted in the highest acetate yield in nitrate medium (Table 1). Therefore, 70% of the carbon was driven to the fermentative pathway in nitrate against 82% in ammonium (Table 1). It was reduced to only 11% in nitrate plus rapamycin against 52% in ammonium plus rapamycin. However, all these 11% were completely converted to acetate only. It is noteworthy that 11% was also the value calculated for the conversion of carbon to acetate in the medium with nitrate without rapamycin (Table 1). It is, therefore, clear that the glucose-to-acetate conversion pathway was not altered by the partial inhibition of TORC1.
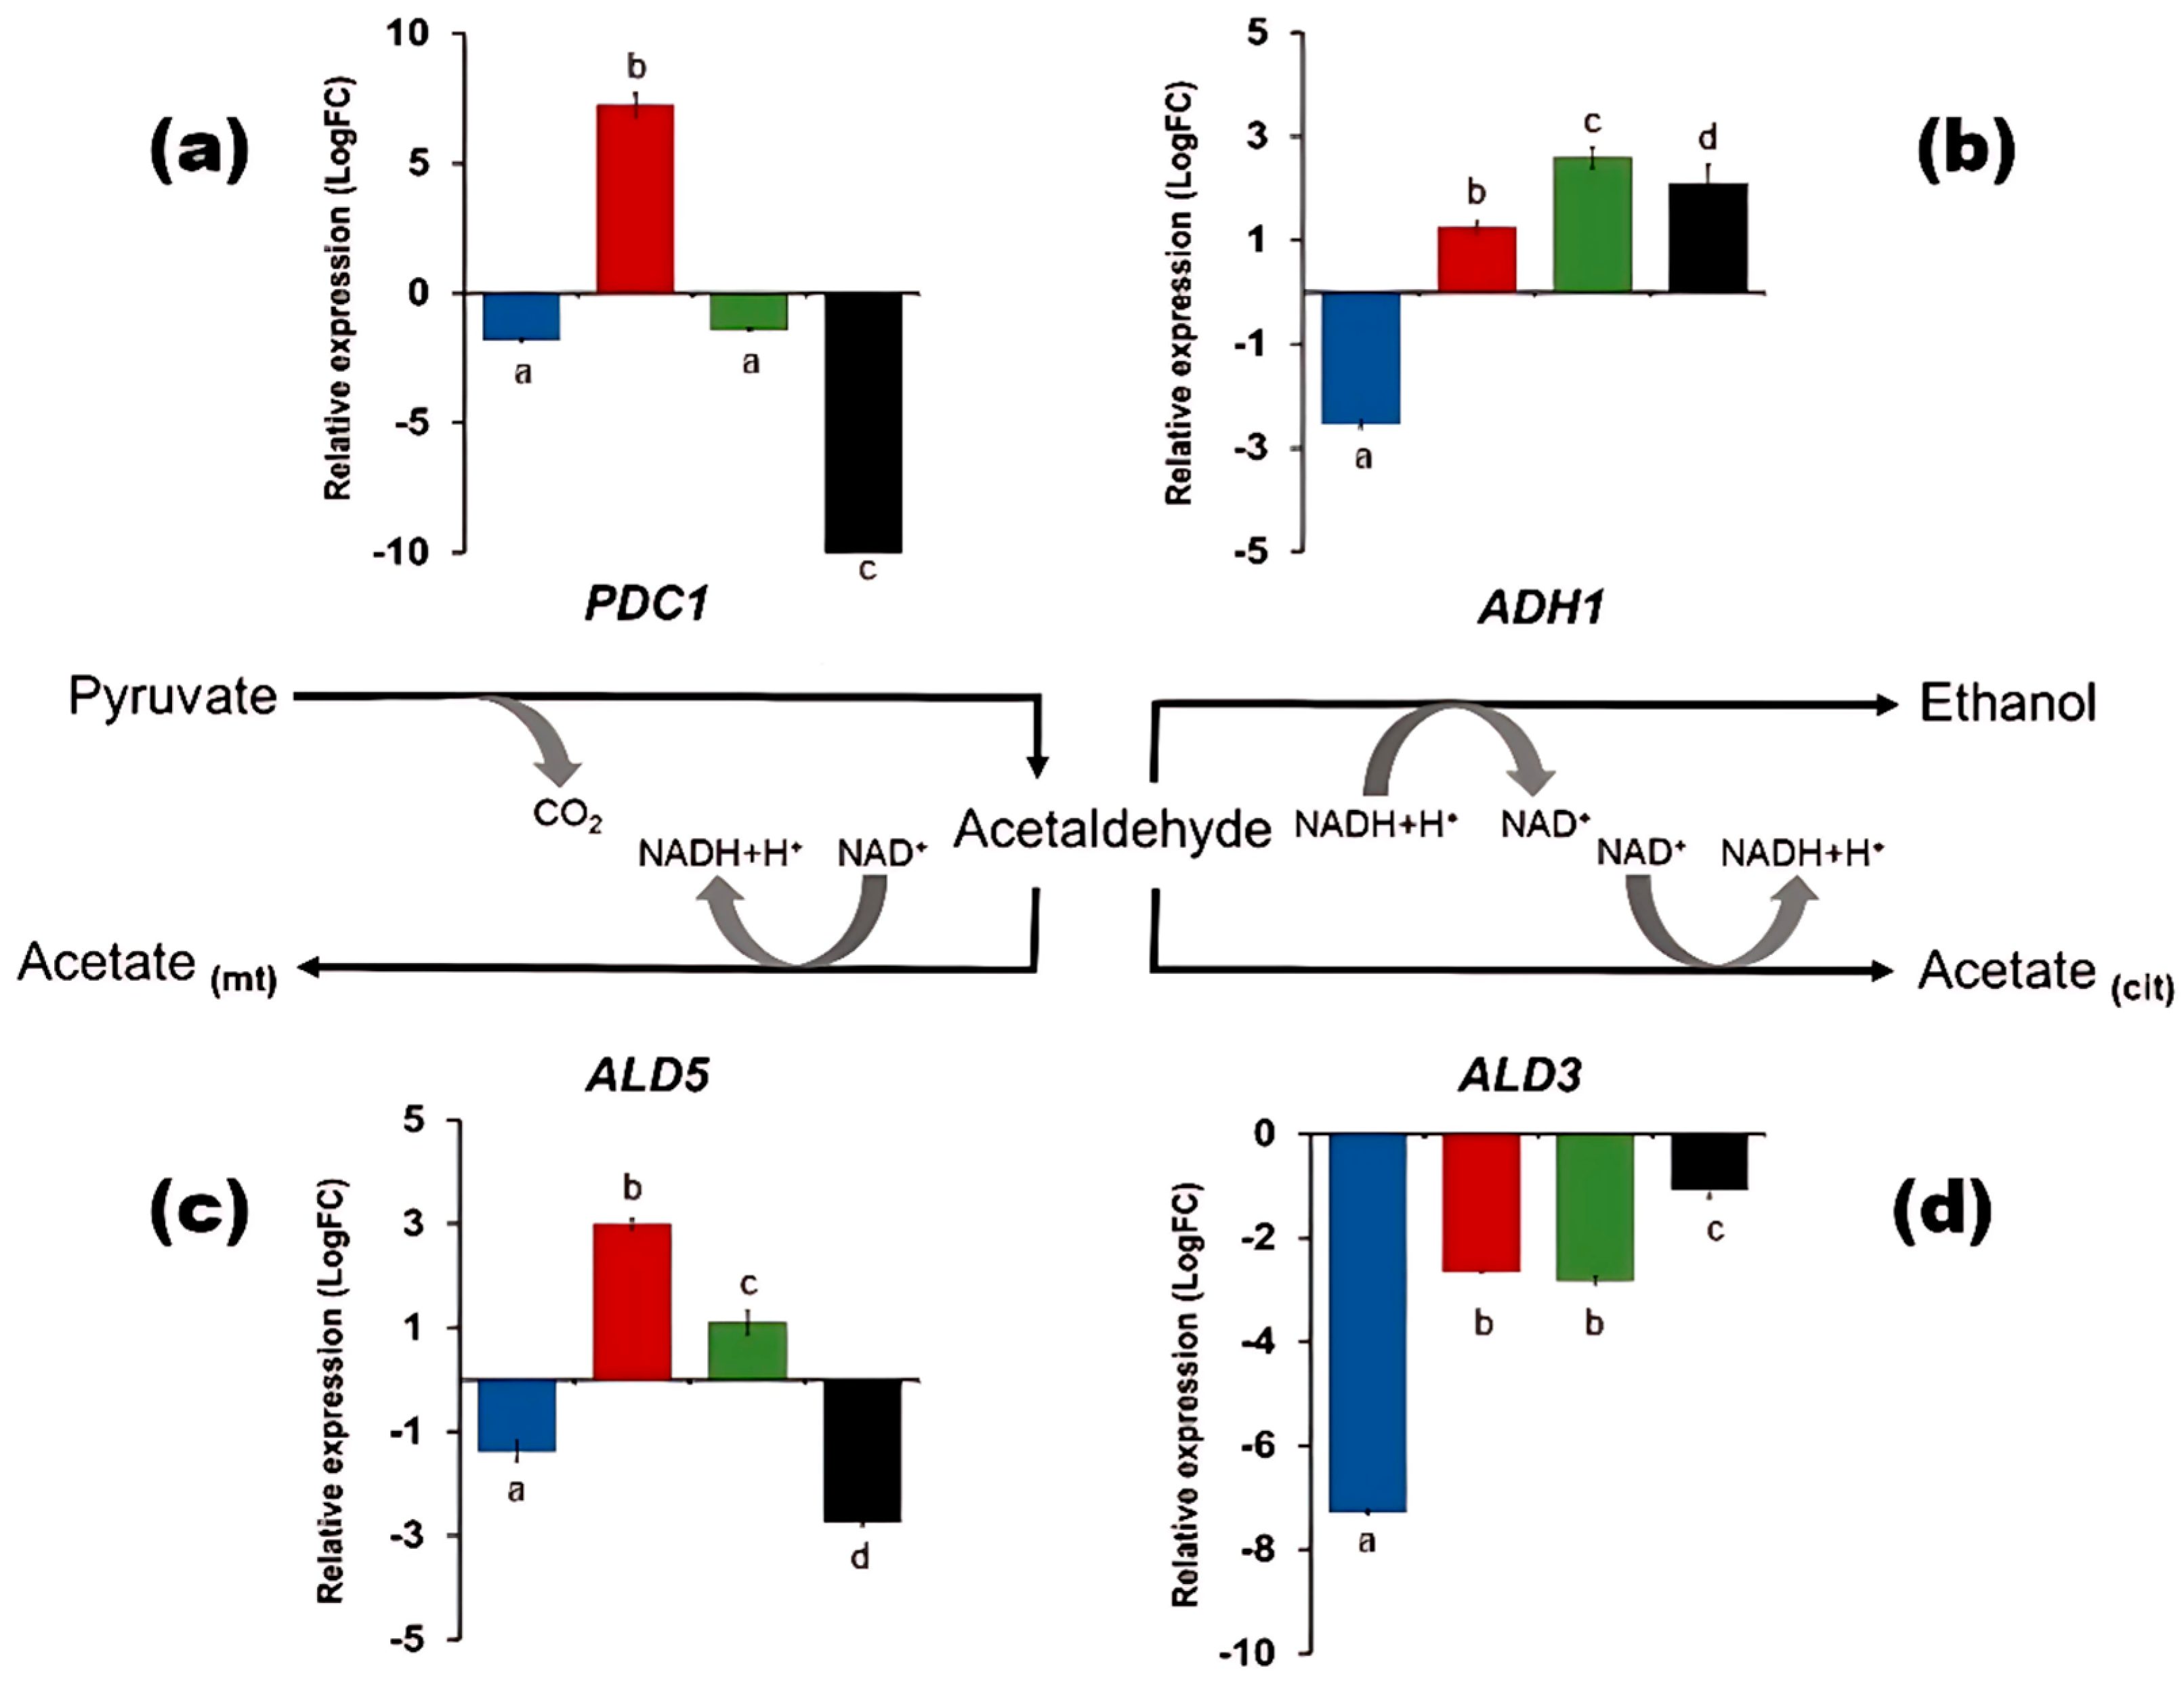
Given these physiological results, the expression of key genes involved in the fermentative metabolism was evaluated (Figure 5). The partial inactivation of TORC1 by rapamycin in ammonium reduced ethanol yield (Table 1) without affecting the expression profile of PDC1 (Figure 5a, blue column) and ALD5 (Figure 5c, blue column), mildly reduced the expression of ADH1 (Figure 5b, blue column) and significantly decreased the expression of ALD3 (Figure 5d, blue column). When TORC1 was partially inhibited by rapamycin, glucose consumption was drastically reduced, compromising yeast metabolism (Table 1). However, the cells used that little consumed carbon to build as many cells as possible (Table 1). Furthermore, downregulation of the PDC1 gene (Figure 5a, blue column) led to a significant decrease in carbon flow through the fermentative pathway, which was potentiated by the downregulation of ADH1 expression (Figure 5b, blue column).

Figure 5.
Transcription level of the genes PDC1 (panel (a)) and ADH1 (panel (b)) involved in ethanol biosynthesis and ALD5 (panel (c)) and ALD3 (panel (d)) involved in acetate biosynthesis in Dekkera bruxellensis. Gene expression was evaluated in cells grown in YNB synthetic medium containing glucose as a carbon source and different nitrogen sources, such as ammonium + rapamycin (60 ng/L, blue bars), nitrate (red bars), and nitrate + rapamycin (60 ng/L, green bars), relative to the reference condition with ammonium. In addition, gene expression in nitrate + rapamycin was also relative to nitrate (black bars). Values represent the mean of six replicates for each condition (standard error bars are shown). Different lowercase letters indicate significant statistical differences, as determined by the One-Way ANOVA Calculator and Tukey HSD test, based on the Shapiro-Wilk Test at α = 0.05 (https://www.statskingdom.com/180Anova1way.html, accessed on 2 May 2025).
Under nitrate, only PDC1 (Figure 5a, red column) and ALD5 (Figure 5c, red column) showed significant upregulation. These results explained that the production of acetate by the yeast cells (Table 1) is preferentially carried out by the mitochondrial acetaldehyde dehydrogenase (ALD5). The presence of rapamycin eliminated the nitrate stimulatory effect on PDC1 (Figure 5a, green column) and reduced it on ALD5 (Figure 5c, green column). ALD3 was downregulated in nitrate and in both nitrogen sources in the presence of rapamycin (Figure 5d). In this case, the production of acetate in nitrate plus rapamycin should be driven by another reaction that is independent of acetaldehyde dehydrogenase activities.
In addition, the expression profile of the ATP1 gene was investigated. Its ortholog in S. cerevisiae encodes the alpha-F1 subunit of the mitochondrial ATP synthase complex F1F0, which is directly involved in energy production in the respiratory chain [35]. The ATP1 gene showed nonsignificant variation in its expression when rapamycin was added to the medium containing ammonium or nitrate in the presence of rapamycin (Supplementary Materials
). It indicates that this respiration-related gene is not subject to regulatory influence by TORC1. Its low and consistent upregulation by nitrate compared to ammonium observed in the present work had been previously described [25]. It confirmed that nitrate induces the oxidative metabolism that leads to biomass formation, especially when TORC1 was partially inhibited (Table 1).
4. Discussion
4.1. TORC1 and the Control of Nitrogen Central Metabolism
The most important regulatory mechanism that controls cell growth is commanded by the TOR signalling cascade that transduces a series of phosphorylation/dephosphorylation reactions to the ultimate targets. These targets are transcription factors that act on the expression of nitrogen- and growth-related genes [26,28,29,34,36,37]. When S. cerevisiae cells are cultivated in ammonium, Gln3p is phosphorylated by TOR kinases and remains in the cytoplasm by its binding with Ure2p. When the cells are in the presence of a non-preferred N source, subjected to nitrogen starvation or glutamine starvation by MSX or under TORC1 inhibition by rapamycin, Gln3p is dephosphorylated, separated from Ure2p, and migrates to the nucleus to act as a transcriptional activator of NCR-controlled genes [29,36]. In this way, the cells start to metabolize different nitrogen sources present in the environment. Despite the extensive literature on this regulatory process in S. cerevisiae, there is still no data on the consequences of inhibiting the TORC1 complex on the metabolism of D. bruxellensis, mainly related to the use of nitrate.
The compilation of data on gene expression obtained in this work (Figure 2, Figure 3 and Figure 4) with those produced in nitrate [12,22,25], ammonium-nitrate mixture [7], under nitrogen limitation [24] or glutamine synthase inhibition [21] and in the excess of amino acids [20] aimed us to figure out a regulatory network that control the expression genes in the central metabolism of nitrogen in this yeast, from nitrate to glutamine, as well as its relation to TOR and NCR mechanisms (Figure 6).
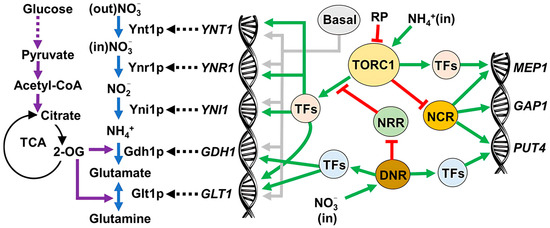
Figure 6.
Regulatory network proposed for the expression of genes in the central nitrogen metabolism of Dekkera bruxellensis. Genes (italic caps lock) are transcribed and translated (dotted black arrows) to the respective proteins that act on the metabolic reactions (blue arrows). In parallel, glucose is metabolised via the glycolysis pathway (purple arrows) and the Tricarboxylic Acid cycle (TCA) that provides 2-oxoglutarate (2-OG) as the carbon skeleton for glutamate and glutamine synthesis (purple arrows). Gene regulation by specific transcriptional factors (TFs) were proposed positive (green arrows) or negative (red hammer) under the control of the regulatory mechanisms TOR complex 1 (TORC1), Nitrogen Catabolic Repression (NCR) and the two putative mechanisms Direct Nitrogen Regulation (DNR) and Nitrate-Repressed Repression (NRR) in response to ammonium (NH4+), nitrate (NO3−) or rapamycin (RP). The constitutive, low-level expression of genes is maintained by basal gene expression mechanisms.
The metabolisms of nitrate and ammonium are connected, since the product of the first pathway is the substrate of the second pathway for the ultimate production of glutamate and glutamine. Extracellular ammonium is taken up by the Mep1p permease, and the internal ammonium is fixed in the carbon skeleton of 2-oxoglutarate from the Tricarboxylic Acid (TCA) cycle to produce glutamate by the action of the Gdh1p NADPH-dependent glutamate dehydrogenase (Figure 6). At this point, carbon and nitrogen metabolisms interplay. Glutamate is further aminated by glutamine synthase to produce glutamine. The balance between glutamate and glutamine is maintained by the GOGAT (Glutamine-Oxoglutarate Amino Transferase) or Glt1p enzyme, encoded by the GLT1 gene (Figure 6) [38]. Upstream, nitrate is taken up by the Ynt1p permeases and converted through two consecutive reduction reactions of Ynr1p nitrate reductase and Yni1p nitrite reductase to generate internal ammonium, which is further assimilated via Gdh1p activity. Therefore, six genes are involved in the nitrate-ammonium metabolism: YNTI, YNR1, YNI1, MEP1, GDH1, and GLT1. The first part of the pathway is commanded by the NIT genes that are supposedly regulated by the Zn(II)2Cys6-type transcription factor Yna1p, and were reported to be overexpressed by nitrate [7,20,21,22,25]. Therefore, the existence of a regulatory mechanism that responds to nitrate has already been proposed. Two other important scenarios have been reported. First, NIT genes are induced by nitrate even in the presence of ammonium (5), which means that the NCR mechanism does not act on their regulation. Second, NIT genes respond positively to the presence of MSX, indicating that they respond to nitrogen deprivation [21].
In the present work, we showed that NIT genes did not respond to rapamycin in ammonium (Figure 4, blue columns). These results indicate that the action of the TOR pathway on NIT genes is already naturally turned off downstream in the signalling cascade and, therefore, its inhibition by rapamycin does not produce any additional effect (Figure 6). However, the presence of rapamycin abrogated the effect of nitrate-induced expression (Figure 4, green columns). In this scenario, we hypothesized that there is a mechanism of inhibition toward the NIT genes whenever TOR is not fully functional. The most parsimonious hypothesis is that TORC1 works directly in the induction of the NIT gene by ultimately activating a transcription factor, such as Yna1p. However, it should be submitted to a negative control that maintains the expression of the NIT gene at a basal level in ammonium (Figure 6). Since TORC1 signal is already impaired, the presence of rapamycin does not influence the NIT genes expression profile (Figure 6). Nitrate may activate an independent regulatory mechanism that produces some sort of Direct Nitrate Regulation (DNR) over the NIT genes at the same time that represses a putative Nitrate-Repressed Repression (NRR) mechanism that negatively acts on the signal from TORC1 to NIT genes (Figure 6). In nitrate, NIT genes are overexpressed by the combined action of DNR and the released TORC1 signal (Figure 6). In this scenario, the nitrate captured from the environment would be more efficiently converted into ammonium to enter the second stage of central metabolism to generate glutamate/glutamine. The partial inhibition of TORC1 by rapamycin causes a reduction in transcriptional strength, leaving the expression of the NIT gene only under the control of DNR (Figure 6). Taking into account the relation between gene expression fold changes, it can be assumed that TORC1 might be responsible for 75 to 90% of the expression strength, while NDR takes the remaining 10 to 25%. This scenario explains why NIT genes behave as down-expressed in nitrate-rapamycin when relativised by nitrate (Figure 4, black columns).
Before continuing on the metabolic pathway with the intracellular ammonium from nitrate, it must take into consideration that ammonium is also taken up from the environment by the permease Mep1p. Rapamycin downregulated MEP1 expression by sevenfold (Figure 3a), while MSX slightly upregulated this gene by twofold [21]. MEP1 is also upregulated at low nitrogen concentration or when proline is the nitrogen source, regardless of the sugar concentration [24]. Therefore, this gene seems to be subjected to two parallel induction mechanisms (Figure 6): (1) TOR when the cells are in the presence of ammonium and (2) NCR when in preference of alternative nitrogen sources or under nitrogen scarcity.
The next step is the fixation of the nitrogen from ammonium (both external and produced from nitrate) to glutamate by the Gdh1p enzyme (Figure 6). The expression of the GDH1 gene is not affected by rapamycin (Figure 3b, blue column) or by MSX [21], but is downregulated under ammonium limitation [24]. The absence of canonical regulatory motifs in its promoter region indicates that GDH1 has constitutive expression in ammonium [21]. Surprisingly, it was upregulated by the presence of all amino acids in the medium [20]. This seems a contradiction, given that in this environment the amount of assimilable nitrogen is high and the function of the Gdh1p enzyme is to produce more glutamate. This gene also shows induction by the presence of nitrate (Figure 3, red columns) that could occur via DNR. However, this induction also occurred independently of the presence of rapamycin (Figure 3 green columns). At this point, we propose that this induction is solely dependent on the NDR mechanism (Figure 6).
Finally, GLT1 was strongly downregulated by more than 30x upon partial inhibition of TORC1 in ammonium (Figure 3c, blue column). Therefore, it is under the direct control of TOR, bypassing the NRR mechanism (Figure 6). This gene is strongly induced by nitrate (Figure 3c, red column; [21]), which seems to be independent of the NRR mechanism. That is, the overexpression of GLT1 in nitrate must be the result of the combined action of the TOR and NDR mechanisms (Figure 6).
These results consolidate the role of the TOR mechanism as the controller of the nitrogen metabolism at the point of glutamate-glutamine interconversion when nitrate is the nitrogen source. In previous work, we showed that the mechanisms of glutamate biosynthesis are modulated according to the phase of yeast populations, from GDH1 in the early stages of cultivation to GLT1 in the late stages of cultivation [22]. Since both genes were simultaneously upregulated by nitrate, the biosynthetic pathway may operate according to the availability of the reducing cofactors NADH and NADPH, and be less dependent on the gene expression level. Therefore, it ultimately responds to carbon metabolism as the supplier of reduced cofactor. The demand for this cofactor in other metabolic fates, such as ethanol production during fermentation [22] or protection against oxidative damages [23], could compromise nitrogen metabolism efficiency, and ultimately, cell development and growth.
4.2. NCR Is Not a Player in the Nitrate Metabolism
As stated above, except for MEP1, the other five genes were not subjected to NCR control. Thus, we used two well-established model genes, GAP1 and PUT4, to overview the role of this mechanism in D. bruxellensis. In S. cerevisiae, the GAP1 gene that encodes for a general amino acid permease is under the control of the NCR mechanism in such a way that it is downregulated by ammonium [26,28,29,37]. In environments with nitrogen scarcity or limitations, GAP1 expression is induced by the transcription factors Gat1p and Gln3p, which promote the activation of genes involved in the assimilation of less preferred nitrogen sources [26,28,29,37]. PUT4 gene encodes a proline-specific permease that also promotes the transport of other amino acids, such as alanine and glycine, and its expression is negatively regulated by ammonium and follows the same regulatory pattern observed for GAP1 [26,28,29,37]. Thus, both genes play a role in the adaptation of S. cerevisiae to fluctuations in nitrogen availability, allowing the cell to switch between the use of preferred and alternative nitrogen sources according to environmental conditions. Here, we showed that both genes were induced by rapamycin (Figure 2, blue columns), likewise observed with the use of MSX that inactivates glutamine synthase and imposes glutamine/nitrogen starvation on yeast cells [21]. Therefore, the inhibition of TOR activity in different ways must release their expression via the NCR (Figure 6). However, only PUT4 had its expression increased by the presence of nitrate in the medium (Figure 2b red column) in a rapamycin-independent manner (Figure 2b black column). This shows that only PUT4 would be regulated by the action of the NDR mechanism proposed in this work (Figure 6). Therefore, the only role of NCR in the metabolism of nitrogen seems to be opening the gates in the cell membrane to allow the entry of any nitrogen source available in the environment. It does not apply to nitrate assimilation.
4.3. TORC1 and Its Influence on the Physiology of D. bruxellensis in Nitrate
Like what was observed with MSX [21], rapamycin also interfered with the cell growth rate (Figure 1a). The first inhibitor induces glutamine starvation, while the second mimics nitrogen starvation. Thus, TOR works in D. bruxellensis as it does in S. cerevisiae in the control of cell growth.
For a glimpse of the influence of TOR on cell physiology, we performed fermentation experiments under agitated conditions to allow some oxygenation. Since D. bruxellensis is a Crabtree-positive yeast, it can ferment hexoses to ethanol even in the presence of oxygen [8]. Thus, it presents the so-called respiro-fermentative metabolism, although the tendency to an oxidative metabolism is higher than the fermentative one [8,33]. Rapamycin reduced biomass yield by 28% and ethanol yield by 40% in ammonium. Since mass recovery was low and no other fermentation product was detected, it seems plausible to suppose that the stoichiometric CO2 was underestimated due to the existence of some sort of decarboxylation reaction(s) not coupled to biomass formation or fermentation activity. This phenomenon has been recently proposed [31]. The difference of 38% less carbon going from pyruvate to acetaldehyde, as calculated from carbon balance (Table 1), may be explained by the slight but consistent reduction in the expression of all fermentative genes tested (Figure 5, blue columns). Thus, TORC1 inhibition prevented 38% of the assimilated carbon from entering the fermentative pathway, pushing this resource to the oxidative metabolism for increasing biomass production efficiency.
One plausible hypothesis to explain this phenomenon is the deviation of glucose molecules through the PPP, which leads to the loss of 1 mol CO2 per mol of glucose before the return of the hydrocarbon skeleton to the glycolytic pathway as fructose 6P and glyceraldehyde 3P. Thus, that carbon would not be included in the stoichiometric calculations, leading to low mass and carbon balances. The metabolic reason for that deviation should be the increment of NADPH demand required for anabolic and/or maintenance metabolic expenses that could be supplied by PPP: each mol of glucose entering the PPP produces 2 moles of NADPH. This hypothesis was first proposed for cells using nitrate in anaerobiosis based on proteomic studies [12]. Thus, the partial inhibition of TORC1 would increase the demand for NADPH to ensure the construction of cellular components and the generation of biomass, forcing the cell to push the metabolism through the PPP. This change responds to the downregulation of ALD3 and ALD5, which code for the major NADPH-providing enzymes, acetaldehyde dehydrogenases (Figure 5c,d blue columns). Additionally, CO2 can be highly produced by a futile use of the TCA cycle disconnected from biomass or any other growth or fermentation product. In this case, 1 mol of glucose would produce 6 moles of CO2, which would not be taken into consideration by the stoichiometric model.
In nitrate, rapamycin increased biomass yield by three times while abolishing ethanol production when compared to non-treated nitrate cultures. Biomass yield increased despite the huge decline in glucose consumption and biomass formation. It means that cells deviated most of the low quantity of carbon to produce cell components, and nothing was left for fermentation products, even under oxygen limitation. This is corroborated by the slight increment of acetate yield, even with the downregulation of ALD3 and ALD5 genes (Figure 5c,d, black columns). This apparent contrast can be explained by the fact that acetate can also be produced from mitochondrial acetyl-CoA by the action of acetyl-CoA hydrolase/transferase, which is encoded by the ACH1 gene in S. cerevisiae [39]. The activation of ACH1 occurs when the cytosolic acetate supply is low, as it happens in pyruvate decarboxylase null mutants. In the present case, the downregulation of PDC1, ALD3, and ALD5 genes could mimic that situation, and activate the ACH1 ortholog of D. bruxellensis. This acetate production was uncoupled from NADPH production by the PDH bypass by pushing the carbon flow through the PPP pathway, leading to even greater CO2 loss. As a result, mass and carbon balance were severely affected (Table 1).
These results indicate that the TOR signalling mechanism also acts as a coregulator of the carbon distribution in the central metabolism of D. bruxellensis cells, favouring the anabolic metabolism that depends on both the canonical pathway of mitochondrial acetyl-CoA production and the alternative pathway PDH bypass. It has a direct influence on nitrate metabolism, which requires reduced cofactor NADPH for the sequential action of Ynr1p, Yni1p, and Gdh1p.
5. Conclusions
In the present study, we added a few more pieces to the puzzle of the regulation of nitrogen metabolism in D. bruxellensis, especially regarding nitrate assimilation. The role of the TOR signalling pathway in controlling the expression of the main nitrate and ammonium assimilation genes was demonstrated, interacting with supposed TOR-independent and nitrate-driven control mechanisms that would be amplified in the control of gene expression. Additionally, TOR would act in the distribution of carbon in the central metabolism, providing substrates and reduced cofactors responsible for glutamate and glutamine biosynthesis. The control mechanisms theorized in the present study, although of a suppositional nature, are based on several studies with D. bruxellensis, whose results are quite convergent, and based on the scaffold of the regulatory models already well-established for S. cerevisiae. Overall, the analyses of gene expression profiles reinforced that the regulation of nitrogen metabolism in D. bruxellensis has adaptive specificities that make it competitive in industrial environments, such as during alcoholic fermentation processes using substrates that contain nitrate in their composition.
Supplementary Materials
The following supporting information can be downloaded at: https://www.mdpi.com/article/10.3390/microbiolres16070143/s1. It contains an “Ethical Assessment” explaining the significant amount of self-citation, a “Table S1” with raw Cq data of RT-qPCR experiments used to quantify the expression of D. bruxellensis genes and an “Appendix S1” with the facsimile of all the Statistical analysis of pairwise comparison of the expression of a gene in different cultivation conditions.
Author Contributions
Conceptualization, M.A.d.M.J.; validation, G.H.T. and I.C.P.-M.; formal analysis, K.M., B.C.d.M., and G.H.T.; investigation, K.M., B.C.d.M., I.C.P.-M., and G.H.T.; writing—original draft preparation, K.M. and M.A.d.M.J.; writing—review and editing, K.M., R.B.d.S., and M.A.d.M.J.; supervision, M.A.d.M.J.; project administration, M.A.d.M.J.; funding acquisition, M.A.d.M.J. All authors have read and agreed to the published version of the manuscript.
Funding
This research was funded by the Bioethanol Research Network of the State of Pernambuco, (CNPq/FACEPE/PRONEM program, grant number APQ-1452–2.01/10) and by grants of the National Council of Science and Technology/CNPq grant No. 307390/2021-7. Author K.M. received a Master’s scholarship from the FACEPE agency.
Institutional Review Board Statement
Not applicable.
Informed Consent Statement
Not applicable.
Data Availability Statement
Raw data on RT-qPCR gene expression and the statistical analysis are available in the Supplementary Data.
Acknowledgments
The authors are thankful to the Federal University of Pernambuco (UFPE) central administration for their kind support in this work with all basic needs and to the technical staff of the University of Pernambuco (UPE) for their support for metabolic analysis.
Conflicts of Interest
The authors declare no conflicts of interest.
References
- De Souza Liberal, A.T.; Basílio, A.C.; Do Monte Resende, A.; Brasileiro, B.; da Silva-Filho, E.; de Morais, J.O.F.; Simões, D.; de Morais, M.A., Jr. Identification of Dekkera bruxellensis as a major contaminant yeast in continuous fuel ethanol fermentation. J. Appl. Microbiol. 2007, 102, 538–547. [Google Scholar] [CrossRef] [PubMed]
- Basilio, A.C.M.; Araujo, P.R.L.; Morais, J.O.F.; da Silva Filho, E.A.; de Morais, M.A., Jr.; Simões, D.A. Detection and identification of wild yeast contaminants of the industrial fuel ethanol fermentation process. Curr. Microbiol. 2008, 56, 322–326. [Google Scholar] [CrossRef]
- Renouf, V.; Falcou, M.; Miot-Setier, C.; Perello, M.C.; De Revel, G.; Lonvaud-Funel, A. Interactions between Brettanomyces bruxellensis and other yeast species during the initial stages of winemaking. J. Appl. Microbiol. 2006, 100, 1208–1219. [Google Scholar] [CrossRef]
- Agnolucci, M.; Tirelli, A.; Cocolin, L.; Toffanin, A. Brettanomyces bruxellensis yeasts: Impact on wine and winemaking. World J. Microbiol. Biotechnol. 2017, 33, 180. [Google Scholar] [CrossRef] [PubMed]
- Harrouard, J.; Eberlein, C.; Ballestra, P.; Dols-Lafargue, M.; Masneuf-Pomarede, I.; Miot-Sertier, C.; Schacherer, J.; Albertin, W. Brettanomyces bruxellensis: Overview of the genetic and phenotypic diversity of an anthropized yeast. Mol. Ecol. 2023, 32, 2374–2395. [Google Scholar] [CrossRef]
- Blomqvist, J.; Eberhard, T.; Schnürer, J.; Passoth, V. Fermentation characteristics of Dekkera bruxellensis strains. Appl. Microbiol. Biotechnol. 2010, 87, 1487–1497. [Google Scholar] [CrossRef] [PubMed]
- De Barros Pita, W.; Leite, F.C.B.; De Souza Liberal, A.T.; Simões, D.A.; De Morais, M.A., Jr. The ability to use nitrate confers an advantage to Dekkera bruxellensis over S. cerevisiae and can explain its adaptation to industrial fermentation processes. Antonie Leeuwenhoek 2011, 1, 1–9. [Google Scholar] [CrossRef]
- Leite, F.C.B.; Basso, T.O.; De Pita Barros, W.; Gombert, A.K.; Simões, D.A.; de Morais, M.A., Jr. Quantitative aerobic physiology of the yeast Dekkera bruxellensis, a major contaminant in bioethanol production plants. FEMS Yeast Res. 2013, 1, 34–43. [Google Scholar] [CrossRef]
- Parente, D.C.; Vidal, E.E.; Leite, F.C.; de Barros Pita, W.; de Morais, M.A., Jr. Production of sensory compounds by means of the yeast Dekkera bruxellensis in different nitrogen sources with the prospect of producing cachaça. Yeast 2015, 32, 77–87. [Google Scholar] [CrossRef]
- Reis, A.L.S.; Damilano, L.D.; Menezes, R.S.C.; De Morais, M.A., Jr. Second-generation ethanol from sugarcane and sweet sorghum bagasses using the yeast Dekkera bruxellensis. Ind. Crops Prod. 2016, 92, 255–262. [Google Scholar] [CrossRef]
- De Barros Pita, W.; Teles, G.H.; Peña-Moreno, I.C.; da Silva, J.M.; Ribeiro, K.C.; de Morais, M.A., Jr. The biotechnological potential of the yeast Dekkera bruxellensis. World J. Microbiol. Biotechnol. 2019, 35, 103. [Google Scholar] [CrossRef]
- Peña-Moreno, I.C.; Parente, D.C.; da Silva, K.M.; Pena, E.P.N.; Silva, F.A.C.; Calsa Junior, T.; de Barros Pita, W.; de Morais, M.A., Jr. Comparative proteomic analyses reveal the metabolic aspects and biotechnological potential of nitrate assimilation in the yeast Dekkera bruxellensis. Appl. Microbiol. Biotechnol. 2021, 105, 1585–1600. [Google Scholar] [CrossRef]
- Piškur, J.; Rozpedowska, E.; Polakova, S.; Merico, A.; Compagno, C. How did Saccharomyces evolve to become a good brewer? Trends Genet. 2006, 22, 183–186. [Google Scholar] [CrossRef]
- Da Silva, J.M.; Teles, G.H.; Parente, D.C.; Leite, F.C.B.; Silva, C.S.; Valente, P.; Ganga, A.M.; Simões, D.A.; de Morais, M.A., Jr. Biological diversity of carbon assimilation among isolates of the yeast Brettanomyces bruxellensis from wine and fuel-ethanol industrial processes. FEMS Yeast Res. 2019, 19, 1–10. [Google Scholar] [CrossRef]
- Canonico, L.; Agarbati, A.; Comitini, F.; Ciani, M. Relationships among origin, genotype, and oenological traits of Brettanomyces yeasts. Int. J. Mol. Sci. 2024, 25, 11781. [Google Scholar] [CrossRef] [PubMed]
- Pereira, L.F.; Bassi, A.P.G.; Avansini, S.H.; Neto, A.G.B.; Brasileiro, B.T.R.V.; Ceccato-Antonini, S.R.; de Morais, M.A., Jr. The physiological characteristics of the yeast Dekkera bruxellensis in fully fermentative conditions with cell recycling and in mixed cultures with Saccharomyces cerevisiae. Antonie Leeuwenhoek 2012, 101, 529–539. [Google Scholar] [CrossRef] [PubMed]
- Bassi, A.P.; Paraluppi, A.L.; Reis, V.R.; Ceccato-Antonini, S.R. Potassium metabisulphite as a potential biocide against Dekkera bruxellensis in fuel ethanol fermentations. Lett. Appl. Microbiol. 2015, 60, 248–258. [Google Scholar] [CrossRef]
- Blomqvist, J.; Nogué, V.S.; Gorwa-Grauslund, M.; Passoth, V. Physiological requirements for growth and competitiveness of Dekkera bruxellensis under oxygen-limited or anaerobic conditions. Yeast 2012, 29, 265–274. [Google Scholar] [CrossRef]
- Galafassi, S.; Capusoni, C.; Moktaduzzaman, M.; Compagno, C. Utilization of nitrate abolishes the “Custers effect” in Dekkera bruxellensis and determines a different pattern of fermentation products. J. Ind. Microbiol. Biotechnol. 2013, 40, 297–303. [Google Scholar] [CrossRef]
- Parente, D.C.; Cajueiro, D.B.B.; Peña-Moreno, I.C.; Leite, F.C.B.; de Barros Pita, W.; de Morais, M.A., Jr. On the catabolism of amino acids in the yeast Dekkera bruxellensis and the implications for industrial fermentation processes. Yeast 2017, 35, 299–309. [Google Scholar] [CrossRef]
- Cajueiro, D.B.B.; Parente, D.C.; Leite, F.C.B.; de Morais, M.A., Jr.; de Barros Pita, W. Glutamine: A major player in nitrogen catabolite repression in the yeast Dekkera bruxellensis. Antonie Leeuwenhoek 2017, 110, 1157–1168. [Google Scholar] [CrossRef] [PubMed]
- Peña-Moreno, I.C.; Parente, D.C.; Da Silva, J.M.; Mendonça, A.A.; Rojas, L.A.V.; de Morais J, M.A.; de Barros Pita, W. Nitrate boosts anaerobic ethanol production in an acetate-dependent manner in the yeast Dekkera bruxellensis. J. Ind. Microbiol. Biotechnol. 2019, 46, 209–220. [Google Scholar] [CrossRef] [PubMed]
- Xavier, M.R.; Teles, G.H.; De Carvalho, J.M.; Vieira, L.D.; de Barros Pita, W.; de Morais, M.A., Jr. The antioxidant defense of Dekkera bruxellensis against hydrogen peroxide and its relationship to nitrate metabolism. J. Appl. Microbiol. 2023, 134, lxad065. [Google Scholar] [CrossRef]
- De Barros Pita, W.; Castro-Silva, D.; Simões, D.A.; Passoth, V.; de Morais, M.A., Jr. Physiology and gene expression profiles of Dekkera bruxellensis in response to carbon and nitrogen availability. Antonie Leeuwenhoek 2013, 105, 855–868. [Google Scholar] [CrossRef]
- De Barros Pita, W.; Tiukova, I.; Leite, F.C.B.; Passoth, V.; Simões, D.A.; de Morais, M.A., Jr. The influence of nitrate on the physiology of the yeast Dekkera bruxellensis grown under oxygen limitation. Yeast 2013, 30, 111–117. [Google Scholar] [CrossRef]
- Magasanik, B.; Kaiser, C.A. Nitrogen regulation in Saccharomyces cerevisiae. Gene 2002, 290, 1–18. [Google Scholar] [CrossRef]
- Siverio, J.M. Assimilation of nitrate by yeasts. FEMS Microbiol. Rev. 2002, 26, 277–284. [Google Scholar] [CrossRef]
- Georis, I.; Tate, J.J.; Cooper, T.G.; Dubois, E. Nitrogen-responsive regulation of GATA protein family activators Gln3 and Gat1 occurs by two distinct pathways, one inhibited by rapamycin and the other by methionine sulfoximine. J. Biol. Chem. 2011, 286, 44897–44912. [Google Scholar] [CrossRef]
- Crespo, J.L.; Hall, M.N. Elucidating TOR signaling and rapamycin action: Lessons from Saccharomyces cerevisiae. Microbiol. Mol. Biol. Rev. 2002, 66, 579–591. [Google Scholar] [CrossRef]
- Teles, G.H.; Da Silva, J.M.; Mendonça, A.A.; De Morais, M.A., Jr.; De Barros, P. First aspects on acetate metabolism in the yeast Dekkera bruxellensis: A few keys for improving ethanol fermentation. Yeast 2018, 35, 577–584. [Google Scholar] [CrossRef]
- Teles, G.H.; Xavier, M.R.; Da Silva, J.M.; De Souza, R.B.; de Barros Pita, W.; de Morais, M.A., Jr. The metabolism of respiring carbon sources by Dekkera bruxellensis and its relation with the production of acetate. Appl. Biochem. Biotechnol. 2023, 195, 6369–6391. [Google Scholar] [CrossRef] [PubMed]
- De Barros Pita, W.; Leite, F.C.B.; De Souza Liberal, A.T.; Pereira, L.F.; Carazzolle, M.F.; Pereira, G.A.; de Morais, M.A., Jr. A new set of reference genes for RT-qPCR assays in the yeast Dekkera bruxellensis. Can. J. Microbiol. 2012, 58, 1362–1367. [Google Scholar] [CrossRef]
- Teles, G.H.; Da Silva, J.M.; Xavier, M.R.; de Souza, R.B.; de Barros Pita, W.; De Morais, M.A., Jr. Metabolic and biotechnological insights on the analysis of the Pdh bypass and acetate production in the yeast Dekkera bruxellensis. J. Biotechnol. 2022, 355, 42–52. [Google Scholar] [CrossRef] [PubMed]
- Loewith, R.; Jacinto, E.; Wullschleger, S.; Lorberg, A.; Crespo, J.L.; Bonenfant, D.; Oppliger, W.; Jenoe, P.; Hall, M.N. Two TOR complexes, only one of which is rapamycin sensitive, have distinct roles in cell growth control. Mol. Cell. 2002, 10, 457–468. [Google Scholar] [CrossRef]
- Francis, B.R.; White, K.H.; Thorsness, P.E. Mutations in the ATP1p and Atp3p subunits of yeast ATP synthase differentially affect respiration and fermentation in Saccharomyces cerevisiae. J. Bioenerg. Biomembr. 2007, 39, 127–144. [Google Scholar] [CrossRef]
- Betram, P.G.; Choi, J.H.; Carvalho, J.; Ai, W.; Zeng, C.; Chan, T.F.; Zheng, X.S. Tripartite regulation of Gln3p by TOR, Ure2p, and phosphatases. J. Biol. Chem. 2000, 275, 35727–35733. [Google Scholar] [CrossRef] [PubMed]
- Ter Schure, E.G.; Van Riel, N.A.W.; Verrips, C.T. The role of ammonia metabolism in nitrogen catabolite repression in Saccharomyces cerevisiae. FEMS Microbiol. Rev. 2000, 24, 67–83. [Google Scholar] [CrossRef]
- Valenzuela, L.; Ballario, P.; Aranda, C.; Filetici, P.; González, A. Regulation of expression of GLT1, the gene encoding glutamate synthase in Saccharomyces cerevisiae. J. Bacteriol. 1998, 180, 3533–3540. [Google Scholar] [CrossRef]
- Chen, Y.; Zhang, Y.; Siewers, V.; Nielsen, J. Ach1 is involved in shuttling mitochondrial acetyl units for cytosolic C2 provision in Saccharomyces cerevisiae lacking pyruvate decarboxylase. FEMS Yeast Res. 2015, 15, fov015. [Google Scholar] [CrossRef]


Disclaimer/Publisher’s Note: The statements, opinions and data contained in all publications are solely those of the individual author(s) and contributor(s) and not of MDPI and/or the editor(s). MDPI and/or the editor(s) disclaim responsibility for any injury to people or property resulting from any ideas, methods, instructions or products referred to in the content. |
© 2025 by the authors. Licensee MDPI, Basel, Switzerland. This article is an open access article distributed under the terms and conditions of the Creative Commons Attribution (CC BY) license (https://creativecommons.org/licenses/by/4.0/).