Abstract
Soda lakes are extreme saline–alkaline environments that harbor metabolically versatile microbial communities with significant biotechnological potential. This study employed shotgun metagenomics (NovaSeq PE150) to investigate the functional diversity and metabolic potential of microbial communities in Ethiopia’s Chitu and Shala Lakes. An analysis of gene content revealed 554,609 and 525,097 unique genes in Chitu and Shala, respectively, in addition to a substantial fraction (1,253,334 genes) shared between the two, underscoring significant functional overlap. Taxonomic analysis revealed a diverse phylogenetic composition, with bacteria (89% in Chitu Lake, 92% in Shala Lake) and archaea (4% in Chitu Lake, 0.8% in Shala Lake) as the dominant domains, alongside eukaryotes and viruses. Predominant bacterial phyla included Pseudomonadota, Actinomycetota, and Gemmatimonadota, while Euryarchaeota and Nitrososphaerota were prominent among archaea. Key genera identified in both lakes were Nitriliruptor, Halomonas, Wenzhouxiangella, Thioalkalivibrio, Aliidiomarina, Aquisalimonas, and Alkalicoccus. Functional annotation using the KEGG, eggNOG, and CAZy databases revealed that the identified unigenes were associated with various functions. Notably, genes related to amino acid, carbohydrate, and energy metabolism (KEGG levels 1–2) were predominant, indicating that conserved core metabolic functions are essential for microbial survival in extreme conditions. Higher-level pathways included quorum sensing, two-component signal transduction, and ABC transporters (KEGG level 3), facilitating environmental adaptation, stress response, and nutrient acquisition. The eggNOG annotation revealed that 13% of identified genes remain uncharacterized, representing a vast untapped reservoir of novel enzymes and biochemical pathways with potential applications in biofuels, bioremediation, and synthetic biology. This study identified 375 unique metabolic pathways, including those involved in pyruvate metabolism, xenobiotic degradation, lipid metabolism, and oxidative stress resistance, underscoring the microbial communities’ ability to thrive under fluctuating salinity and alkalinity. The presence of carbohydrate-active enzymes (CAZymes), such as glycoside hydrolases, polysaccharide lyases, and oxidoreductases, highlights their role in biomass degradation and carbon cycling. Enzymes such as alkaline proteases (Apr), lipases (Lip), and cellulases further support the lakes’ potential as sources of extremophilic biocatalysts. These findings position soda lakes as reservoirs of microbial innovation for extremophile biotechnology. Future research on unannotated genes and enzyme optimization promises sustainable solutions in bioenergy, agriculture, and environmental management.
Keywords:
CAZy; eggNOG; taxonomic annotation; functional annotation; KEGG; soda lakes; shotgun metagenomics 1. Introduction
Soda lakes are distinct ecosystems that are highly alkaline with high salt concentrations and high productivity [1]. There are particular microbial communities that have adapted to flourish in these harsh conditions. The microorganisms that inhabit these soda lakes are known as alkalohalophilic, which grow best at pH values of 9 and above and require high salinity levels (>10%) [2,3,4].
The microbiome of soda lakes comprises a diverse community of bacteria, viruses, fungi, and archaea that collaborate to support biological processes by breaking down organic matter, cycling nutrients, and influencing the chemistry of the lakes [5,6,7,8,9,10]. The species richness, abundance, and niches of microorganisms in soda lakes are significantly affected by high pH and salt concentrations [2,9]. In Ethiopia’s Eastern Africa Great Rift Valley, Shala and Chitu soda lakes are notable for their harsh conditions, with pH values ranging from 9 to 11, salinity levels above 10 g/L, and frequent temperatures exceeding 25 °C [2,11]. The environmental context of these lakes is unique due to their location in a region characterized by tectonic activity and volcanic landscapes, which influence their chemical composition and physical properties. These lakes exhibit high alkalinity and salinity, creating challenging environments for microbial life. However, there is a diverse array of microbial life, including haloalkaliphiles, which are organisms adapted to high salinity and alkalinity.
Understanding the mechanisms and studying the metabolic potential and functional diversity of the microbes in such soda lakes of extreme environments could have significant implications for commercial, industrial, and medical applications. These ecosystems, therefore, serve as natural laboratories for studying microbial resilience and resource utilization under harsh conditions. While culture-dependent techniques have been employed to explore microbial diversity and functions in soda lakes [6,8], they are limited in their ability to capture the full spectrum of microbial life and metabolic potential. Similarly, molecular approaches such as amplicon sequencing and metabarcoding, which target specific genomic regions like 16S rRNA and ITS, have provided valuable taxonomic insights but fall short in elucidating the functional and metabolic capabilities of microbial communities [2,12]. For instance, Jeilu et al. [13] and Lanzen et al., ref. [2] investigated prokaryotic and eukaryotic diversity in Ethiopian soda lakes using amplicon sequencing, revealing important taxonomic patterns but offering limited functional insights. These limitations underscore the need for more comprehensive approaches to fully understand the ecological roles and adaptive strategies of microbial communities in these extreme environments.
Shotgun metagenomics has emerged as a powerful alternative, overcoming the constraints of traditional methods by sequencing the entire DNA content of environmental samples. This approach provides unbiased insights into both taxonomic and functional diversity, enabling the identification of novel genes, metabolic pathways, and functional traits that are critical for microbial adaptation and ecosystem processes [3,14]. Unlike amplicon sequencing, which is prone to primer biases and limited resolution, shotgun metagenomics supports long-read sequencing (>100 bp) and facilitates the detection of diverse catabolic and anabolic gene features [15]. This technique has been instrumental in revealing the ecological roles (functions) and interactions of microorganisms, particularly in extreme environments where microbial resilience and resource utilization are of paramount importance. Through the use of functional analysis tools, novel genes and metabolic pathways that produce bioactive compounds, enzymes, and other biomolecules for possible use in biotechnology, medicines, and environmental remediation have been found in alkalohalophilic environments [5].
Functional analyses using databases such as the KEGG (Kyoto Encyclopedia of Genes and Genomes), eggNOG (Evolutionary Genealogy of Genes: Nonsupervised Orthologous Groups), and CAZy (Carbohydrate-Active enZYmes) have further enhanced our understanding of microbial metabolism in soda lakes. The KEGG pathway analysis identified enzymes involved in anabolic and catabolic processes, while the COG (Clusters of Orthologous Groups) analysis highlighted functional categories related to energy production, cell envelope biogenesis, transcription, translation, and posttranslational modification [3,16,17]. The eggNOG analysis enabled the classification of genes into functional groups associated with carbohydrate, amino acid, and lipid metabolism, as well as signal transduction mechanisms [17]. Additionally, CAZy analysis revealed a wealth of carbohydrate-active enzymes involved in the breakdown of complex carbohydrates, underscoring the metabolic versatility of soda lake microbiomes [7,10,13]. These findings have not only advanced our understanding of microbial ecology in extreme environments but have also uncovered novel genes and metabolic pathways with potential applications in biotechnology, medicine, and environmental remediation [5].
Moreover, various findings also demonstrated the significance of soda lakes as hotspots for ecological processes and microbial diversity to explore metabolic and functional diversity, which has significant implications for various biotechnological and environmental applications. Consequently, using high-throughput shotgun metagenomic sequencing, this study identified 554,609 and 525,097 unique genes in Chitu and Shala soda lakes, respectively, with 1,253,334 shared genes, demonstrating substantial genetic diversity. Taxonomic annotation revealed bacterial dominance, particularly Pseudomonadota, Actinomycetota, and Gammatimonadota, alongside archaea such as Euryarchaeota and Nitrosophaerota. In addition, functional annotation using KEGG, eggNOG, and CAZy databases uncovered a diverse repertoire of metabolic pathways, enzymes, and biomolecules. Thus, studying microbial communities in Chitu and Shala Lakes has valuable applied implications, including bioremediation potential, the discovery of industrially relevant enzymes, and insights into climate-resilient ecosystems. Consequently, these findings underscore the ecological and applied significance of the lakes, positioning them as valuable reservoirs for discovering novel biocatalysts, biomolecules, and adaptive mechanisms for industrial and environmental innovations. Therefore, our study of soda lake microbiomes using shotgun metagenomics shed light on microbial metabolic potential and functional diversity from the Ethiopian soda lakes of Shala and Chitu.
2. Materials and Methods
2.1. Sampling Sites
Soil samples were collected from Shala and Chitu Soda Lakes. Chitu Lake is located at an elevation of 1540 m above sea level, with geographic coordinates of 7°24′0″ N and 38°25′0″ E, whereas Shala Lake is situated at an elevation of 1558 m above sea level, with coordinates of 7°27′49.8″ N and 38°33′03.1″ E (Figure S1).
2.2. Designation of the Samples
The samples were collected in triplicate under strict aseptic settings at three different sampling points (Figure S1), and each georeferenced point with a Garmin® handheld GPSMAP64 (Garmin Ltd., Olathe, KS, USA) was taken from the two lakes. Then, the samples were pooled and designated as AastuCL1 (Addis Ababa Science and Technology University for Chitu Lake, Addis Ababa, Ethiopia) and AastuSL2 (Addis Ababa Science and Technology University for Shala Lake, Addis Ababa, Ethiopia). The samples were then placed in sterile polyethylene bags and transported to the laboratory in a cold room maintained at 4 °C for further analysis.
2.3. Physicochemical Analysis of the Soil Samples
The physicochemical analysis of soil samples was determined through a combination of on-site measurements and laboratory analyses to determine key properties of the soil. On-site measurements began with the preparation of a soil–water mixture by mixing 20 g of air-dried, sieved soil with 100 mL of distilled water in a 1:5 ratio (one part soil to five parts water. The mixture was stirred thoroughly and allowed to settle for 30 min. A HANNA HI9829 multi-parameter device (Multiparameter pH/ISE/EC/DO/Turbidity Waterproof Meter with optional GPS; Hanna Instruments Inc., Woonsocket, RI, 02895, USA) was then calibrated according to the manufacturer’s instructions, ensuring all probes and sensors are clean and properly connected. The device was used to measure parameters such as pH, electrical conductivity (EC), turbidity, dissolved oxygen (DO), and the concentrations of ammonium, phosphate, sulfate, chloride, nitrite, and nitrate. Measurements were taken in triplicate, and the average values were recorded to ensure accuracy. For laboratory analysis, soil samples were prepared by digesting 0.5 g of dried soil with 10 mL of concentrated nitric acid and 2 mL of hydrogen peroxide at 95 °C for 2 h. The digestate was filtered and diluted to 50 mL with distilled water. The elemental composition, including ions such as Na⁺, K⁺, Ca2⁺, and Mg2⁺ (using Flame Atomic Absorption Spectroscopy (FAAS)), as well as heavy metals like Mn, Co, Fe, Al, Cr, Pb, Ni, Cd, Cu, Zn, and Hg (using Graphite Furnace Atomic Absorption Spectroscopy (GFAAS) were determined using a novAA 800 Atomic Absorption Spectrometer (AAS; Analytik Jena AG, Jena, Germany) at the Environmental Protection Agency Laboratory in Addis Ababa, Ethiopia. Then, the quality assurance was ensured through calibration curves, blanks, and certified reference materials.
2.4. Metagenomic DNA Extraction, Library Construction, and Sequencing
Metagenomic DNA was extracted from soil and mud samples from each lake using lysis buffer method adapted from Verma et al. [18]. Using a NanoDrop 3300 spectrophotometer (Thermo Fisher Scientific, Washington, DC, USA) and 1% agarose gel electrophoresis, the extracted DNA’s quality and quantity were evaluated. The extracted DNA was subjected to random shearing to obtain fragments of approximately 350 bp. Following this, Qubit, real-time PCR, and Agilent 2100 Bioanalyzer (Agilent, Santa Clara, CA, USA) were used to evaluate, quantify, and determine the size distribution of the constructed library. Then, libraries were pooled, and the paired-end library was constructed using an Ultra DNA Library Prep Kit for Illumina (New England Biolabs, Beverly, MA, USA). Consequently, libraries were sequenced on a NovaSeq PE150 device (Illumina, Tsim Sha Tsui, Hong Kong) and processed via FastQC [19] to obtain clean data for downstream analysis. The reads were subsequently quality-filtered and trimmed using Trimmomatic v0.36 [20]. Low-quality reads, those containing unknown bases (N) > 10 bp, and those with adapters longer than 15 base pairs or with a quality value (Q) ≤ 38 were removed from the dataset [21].
2.5. Metagenomic Assembly and Functional Annotation of Assembled Contigs
Metagenome assembly was conducted using MEGAHIT software (v1.0.4-beta) to obtain scaffolds from clean reads [21], and the statistics of the total scaftigs for assembled metagenomic data were determined. Subsequently, the assembled scaftigs were subjected to further binning using multiple tools, including MetaBAT2, CONCOCT, and MaxBin. Then, the DAS tool was used for the retrieval of metagenome-assembled genomes (MAGs). Then, the bin quality assessment and various assembly statistics were evaluated using CheckM2 (version 1.0.0). Following this, individual assemblies were extracted for downstream analysis using BinUtil and MAGs categorized as high quality and medium quality, possessing > 70% and 60% completeness, respectively, and <10% contamination. Then, ORF (open reading frame) prediction was performed on scaffolds with a length of at least 500 base pairs via MetaGeneMark (version 3.05), and CD-HIT (version 4.5.8) was used with default parameters to select the nonredundant initial gene catalog [21]. Bowtie2 was then used to map the clean reads to the initial gene catalog abundance, with parameters set to ≥95% identity and 90% coverage. Then, core-pan gene analysis was performed based on gene catalog abundance to identify genes present in all samples (core genes) and those unique to individual samples (pan genes) [22]. The functional and taxonomic diversity of the bacterial, fungal, viral, and archaeal sequences was determined using DIAMOND (v0.9.9) and MEGAN (MEGAN6) software against NCBI-nr database [21] and displayed using the Krona, cartogram, and stack bar charts. For functional analysis, the unigenes were aligned and compared to functional databases, including KEGG [14], eggNOG [17], and CAZy [13] via the BLASTP algorithm with an e-value cutoff of ≤1 × 10⁻⁵. The best BLAST hit (BLAST+ 2.14.1) results obtained with the highest score (one HSP > 60 bits) were nominated for additional analysis. The data were also subjected to a cartogram of the annotated gene numbers to facilitate the visualization and interpretation of the results. Functional alpha diversity indices were assessed to quantify the number of protein-coding genes [23], and functional group similarity between samples (beta diversity) was also evaluated using the Bray–Curtis distance [24].
3. Results
3.1. Physicochemical Characteristics of the Lakes
The Chitu and Shala Lakes exhibit alkalohalophilic properties, as inferred from the physicochemical analysis (Table S1). The data indicated that Chitu Lake is characterized by hypersalinity (46,500 mg/L) and high pH (10.56) compared with Shala Lake. In addition, Shala Lake had higher concentrations of dissolved oxygen (8.63 mg/L) than Chitu Lake (6.5 mg/L). Furthermore, the conductivity of Chitu Lake significantly differed, with a higher value (65,780 μS/cm) than that of Shala Lake (27,250 μS/cm). The elemental composition also analyzed and revealed that the lakes had varied heavy metal compositions, including Fe, Zn, Hg, Pb, Cr, Ni, and others.
3.2. Sequencing Data and Metagenome Assembly
The Chitu Lake and Shala Lake contain unprocessed shotgun metagenomic sequencing raw data containing gigabase pairs (Gbp) and raw reads in megabase pairs (Mbp). However, after quality control of the raw data and raw reads, the metagenomic DNA quality control integrity (Figure S2), quality score distribution along reads, and good base content along reads (Figure S3 for Chitu Lake, Figure S4 for Shala Lake) were obtained, with percentages of 97.73% and 97.75% at Q20 (%) of clean reads (Figure S5a for Chitu Lake and Figure S5b for Shala Lake), and GC percentages of 63.87% and 65.75% for Chitu and Shala Lakes, respectively (Table 1).

Table 1.
Summary of sequencing metrics for Chitu Lake and Shala Lake. The QC and shotgun metagenomic sequencing data filtration of the two soda lakes. This table presents a comparative analysis of key sequencing metrics between two samples from Chitu Lake and Shala Lake.
The total length of the scaffolds (scaftigs ≥ 500 bp) was assessed (Figure S6) and determined that Shala Lake had a total scaffold length of 1,040,056,228 base pairs (bps), while Chitu Lake exhibited a length of 956,295,942 bps (Table 2). Thus, from the result, it is confirmed that Shala Lake has greater total scaffold length and average length per scaftigs compared to Chitu Lake. In addition, Chitu Lake has a higher number of scaftigs, but Shala Lake exhibits a better N50 length and maximum scaffold length. In addition, a total of optimized 60 MAGs were generated using DAStool, comprising 20 from Chitu Lake and 40 from Shala Lake (Table S2). Out of these, 12 MAGs from Chitu Lake (completeness >60% (2), and >70% (10), and 27 MAGs form Shala Lake (>60% (3), and >70% (24)) were subjected to detailed taxonomic and functional annotation, which elucidated a diverse range of taxa and genes with metabolic capabilities specifically adapted to the extreme environmental conditions of each lake. This analysis underscores the distinct microbial populations and functional pathways that facilitate microbial survival and ecological processes in these soda lake ecosystems.
Table 2.
Comparative analysis of scaffolding (≥500 bps) metrics from the sequencing data of Chitu Lake and Shala Lake. The key metrics include total length in base pairs (bps), the number of scaffolds, average length per scaffold, N50 length, and maximum scaffold length provide insights into the complexity and assembly quality of the genomic data from each location.
3.3. Gene Prediction and Core-Pan Gene Analysis
The analysis of the gene catalog revealed 2,683,127 ORFs in the samples from Lakes Chitu and Shala, displaying an average GC percentage of 65.75% (Figure 1a). The core-pan gene analysis of the two soda lakes revealed the unique gene numbers, and the coexistence of genes in between the lake was analyzed using a Venn diagram. Consequently, in Lake Chitu, there were 554,609 unique genes, while Lake Shala had a lower count of 525,097 unique genes, as shown in the core-pan gene abundance using a Venn graph (Figure 1b). Even though the two lakes had distinct genes, they still shared a considerable amount of genes (1,253,343 unigenes).
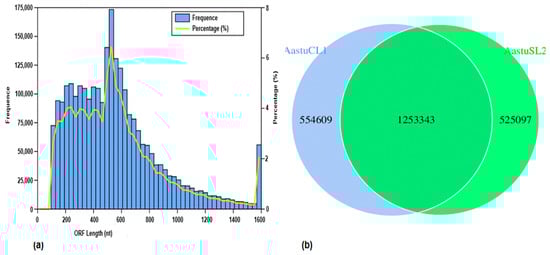
Figure 1.
Unigene catalog length distribution (ORF length) and core-pan genome analysis of the Chitu Lake (AastuCL1) and Shala Lake (AastuSL2). For the unigene length distribution, the first Y-axis (number of frequency) represents the number of scaftigs; the second Y-axis (percentage (%)) represents the percentage of the number of scaftigs; and the X-axis (ORF length (nt)) represents the length of scaftigs (a). For the number of core-pan gene analysis, the non-overlapping circles represent the unique number of genes of Chitu and Shala Lakes, while the overlapping parts of the circles represent the number of genes shared between the two soda lakes (b).
3.4. Microbial Community Composition and Structure
An analysis of open reading frames (ORFs) identified the taxonomy of microbial population in both lakes. As a result, it was found that bacteria made up the majority of the microbial communities, followed by archaea, eukaryote, and virus, with 89, 4, 0.04, and 0.2% for Chitu Lake, respectively (Figure S7a–d), and 92, 0.8, 0.02, and 0.09% for Shala Lake, respectively (Figure S8a–d; Figure 2a). In addition, the taxonomic analysis also showed that Pseudomonadota, Actinomycetota, Chloroflexota, Gemmatimonadota, Euarchaeota, Acidobacteriota, Balneolota, Planctomycetota, and Baccilota were the predominant phyla in both Chitu and Shala Lakes (Figure 2b; Table S3). Moreover, the dominant genera included Nitriliruptor, Halomonas, Wenzhouxiangella, Thioalkalivibrio, Egicoccus, Aliidiomarina, Aquisalimonas, Natronospira, Alkalicoccus, and Pararhodobacter (Figure 2c; Table S3). The research also found that the top ten types of species in the two microbiomes were Bacteria sp., Chloroflexota bacterium, Nitriliruptor sp., Acidobacteriota bacterium, Nitriliruptor alkaliphilus, Gammatimonadales bacterium, Actinomycetota bacterium, Egicoccus halophilus, Gammaproteobacteria bacterium, and Actinobacteria bacterium RBG_16_68_21 (Figure 2d; Table S3). In addition, 6% of the taxa from Chitu Lake were classified as unassigned, and 5% as unclassified (Figure S7a), whereas both unassigned and unclassified accounted for 8% of the total taxa from Shala Lake (Figure S8a).
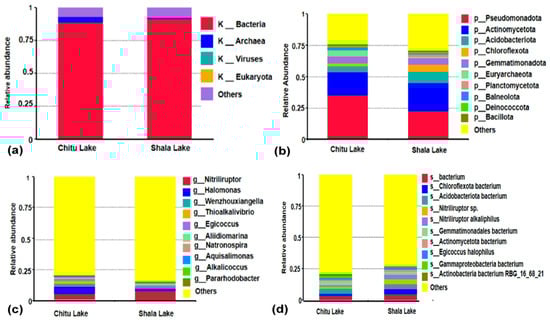
Figure 2.
Taxonomic composition of microbial communities in Chitu and Shala Lakes based on relative abundance at different taxonomic levels. Microbial composition is determined using high-throughput sequencing of shotgun metagenomic data with the taxonomic annotation via MicroNR. At the domain level, bacteria dominate both samples, with contributions from archaea, viruses, eukaryota, and others (a). The phylum level reveals dominant phyla such as Proteobacteria, Actinobacteria, Chloroflexi, and Gammatimonadota (b). At the genus level, prominent genera include Nitriliruptor, Halomonas, and Wenzhouxiangella (c). The species level breakdown highlights key species, particularly the dominance of bacteria sp., Chloroflexota bacterium, Nitriliruptor sp., and Acidobacteriota bacterium (d). The ‘Others’ category in the bar plots includes bacterial taxa at the phylum, genus, and species levels that are not individually listed.
3.5. Functional Analysis
The functional annotation of the metagenome-predicted genes was performed via the KEGG, EggNog, and CAZy databases, which revealed the abundance and diversity of functional genes between Chitu Lake and Shala Lake.
3.5.1. KEGG Functional Annotation
KEGG database analysis revealed that the relative abundance and most unigenes were linked to metabolism accounts of 19% (372,579 genes and 355,805 genes) followed by 5% of genetic information processes (98,228 and 92,550 genes) and environmental information process accounts (89,412 and 86,112 genes) in Chitu and Shala Lakes, respectively (Figure 3a). In addition, 2–3% of the gene counts were for cellular processes, human diseases, and organismal systems. The gene counts for “others” were significantly high, making up 65% of the genes (1,242,324 and 1,239,542 genes) associated with KO_Pathway_Level1 (Table S3).
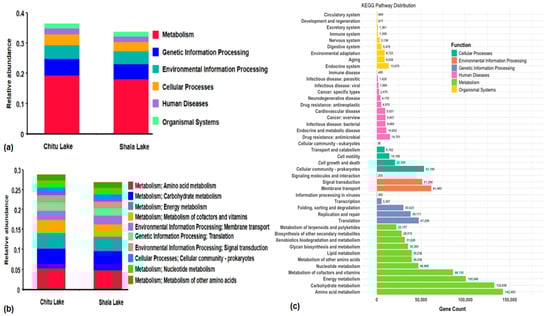
Figure 3.
KEGG pathway annotation. The bar graph showing the relative abundance of the six main KEGG functional categories in Chitu and Shala Lake samples obtained from annotated genes at KEGG Level 1. Metabolism is the most abundant category, followed by genetic information processing and environmental information processing (a). The bar graph (b) and cartogram (c) showing the comparison and distribution of annotated unigenes (number of genes) with categories under 45 functional categories across KEGG level 2 pathways annotation. The amino acid metabolism, carbohydrate metabolism, energy metabolism, and the metabolism of cofactors and vitamins are the most dominant functions across the two lakes.
In addition, functional annotation at KEGG level2 provided 45 unique functional categories along with their respective numbers and abundances genes accounting for 43% and 40% in Chitu and Shala Lakes, respectively, while the remaining gene counts were coined as “others” (Table S4). The amount of genes linked to the top 10 functions were associated with amino acid metabolism, carbohydrate metabolism, and energy metabolism, accounting for 4–5% of the genes, while the remaining genes are connected to various processes such as vitamin and cofactor metabolism, membrane transport, cellular community prokaryotes, nucleotide metabolism, signal transduction, translation, and the metabolism of other amino acids, all falling within 1–3% of categories (Figure 3b). The overall KEGG pathway distribution with gene count associated with functional category in both lakes is also analyzed (Figure 3c).
Furthermore, the analysis of KEGG pathways at level 3 offered a more in-depth perspective of the particular pathways. This analysis allowed us to obtain 375 pathways in the two lakes, with the top 10 pathways as ABC transporters (ko02010), signal transduction (ko02020), quorum sensing (ko02024), pyruvate metabolism (ko00620), oxidative phosphorylation (ko00190), purine metabolism (ko00230), glyoxylate and dicarboxylate metabolism (ko00630), carbon fixation pathways in prokaryotes (ko00720), glycolysis/gluconeogenesis (ko00010),translation, and ribosome (ko03010) (Figure 4a). Furthermore, in this analysis, the Chitu Lake had nine unique pathways, while Shala Lake had six unique pathways in these functional categories (Table S5). An integrated functional-taxonomic analysis of the above 10 top pathways identified critical functional gene distributions within Lake Chitu and Shala microbiomes. ABC transporters were prevalent across Pseudomonadota (particularly Halomonas), Bacillota, and Acidobacteriota phyla, with notable enrichment in sulfur-metabolizing Thioalkalivibrio. Two-component regulatory systems demonstrated broad phylum-level conservation in Pseudomonadota and Bacillota. Core energy metabolism pathways—pyruvate metabolism (EMP pathway) and glycolysis—exhibited universal conservation across taxonomic divisions, including Actinomycetota, indicating fundamental metabolic requirements in these alkaline lake ecosystems.
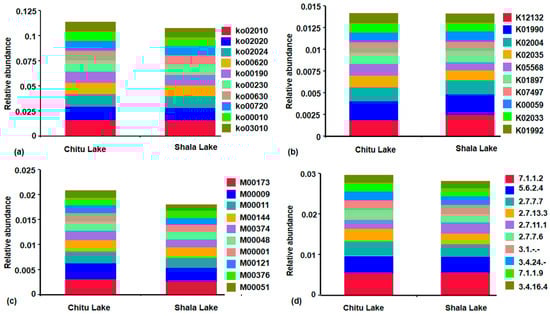
Figure 4.
The relative abundance of specific functional groups annotated using functional gene prediction pipelines based on KEGG Orthology pathway level 3 (Ko), KEGG Orthology ID (K), KEGG Modules (M), and KEGG Enzyme ID (KO EC) in Chitu and Shala lake samples. Stacked bar plot showing the relative abundance of functional subcategories of KEGG Orthology Level 3 (Ko) groups at higher abundance levels. The membrane transport, ABC transporters, quorum sensing, and pyruvate metabolism, among others at this functional level (a). The most dominant KEGG Orthology groups (K) are of threonine-protein kinase, putative ABC transport system permease protein, the ABC-2- ABC-2 type transport system, ATP-binding protein, and others with relatively consistent distributions between the two samples (b). For the relative abundance of KEGG modules encoding reaction modules, the Arnon–Buchanan cycle, citrate cycle, second carbon oxidation reaction, NADH:quinone oxidoreductase, and others are dominant in both lakes (c). The most dominant KEGG EC enzymes are transhydrogenase, DNA 3′-5′ helicase, Taq DNA polymerase, histidine kinase, and esterases, which are highly abundant across microbiome samples of Chitu and Shala Lake (d).
Moreover, the KEGG Orthology (KO) classification system identified 7643 distinct functional orthologous groups across both lakes. Among these, 435 KO pathways were unique to Shala Lake, while 246 were unique to Chitu Lake, and the rest were shared between them (Table S6). In this pathway analysis, the most abundant in both lakes were K12132 (prkC, stkP|eukaryotic-like serine/threonine-protein kinase), K02004 (ABC.CD. P|putative ABC transport system permease protein), and K01990 (yadG; ABC-2- ABC-2 type transport system ATP-binding protein). K02035 (ABC-2-type transport system ATP-binding protein), K02035 (ABC.PE. S|peptide/nickel transport system substrate-binding protein), K05568 (mnhD, mrpD|multicomponent Na+:H+ antiporter subunit D), K01897 (ACSL, fadD|long-chain acyl-CoA synthetase), K07497 (putative transposase), K00059 (fabG, OAR1|3-oxoacyl-[acyl-carrier protein] reductase), K02003 (ABC.CD. A|putative ABC transport system ATP-binding protein), and K01992 (ABC-2. P|ABC-2 type transport system permease protein) (Figure 4b).
We also used the KEGG Module database to perform a thorough functional assessment of the metabolic potentials of the microbial populations in both lakes. This analysis confirmed that 284 modules possessing functional units of genes are responsible for either of the three modules: pathway modules (controls metabolic pathways), signature modules (characterize phenotypic features), and reaction modules (control successive reaction steps in metabolic pathways). In this regard, the most 10 dominant modules were found to be M00173 (Arnon–Buchanan cycle), M00009 (Krebs cycle), M00011 (second carbon oxidation), M00144 (NADH:quinone oxidoreductase, prokaryotes), M00374 (dicarboxylate-hydroxybutyrate cycle), M00048 (de novo purine biosynthesis), M00001 (Embden–Meyerhof pathway), M00121 (heme biosynthesis), M00376 (3-hydroxypropionate bicycle), and M00051 (de novo pyrimidine biosynthesis). Remarkably, Chitu Lake had three unique KEGG modules: M00702 (multidrug resistance, efflux pump NorB), M00148 (succinate dehydrogenase (ubiquinone)), and M00705 (multidrug resistance, efflux pump MepA). On the other hand, Shala Lake featured three specific modules: M00838 (undidecylprodigiosin biosynthesis), M00649 (multidrug resistance, efflux pump AdeABC), and M00819 (pentalenolactone biosynthesis) (Figure 4c; Table S7).
The KEGG enzyme database was also used in our analysis to find specific genes categorized as enzymes. A grand total of 2958 enzymes were identified, with 95 enzymes found only in Shala Lake and 85 enzymes found only in Chitu Lake (Table S8). The top ten KEGG enzymes enriched in this study were EC 7.1.1.1.2 (NADH:ubiquinone reductase), EC 5.6.2.4 (DNA 3′-5′ helicase), EC 2.7.7.7 (DNA polymerase; Taq polymerase), EC 2.7.13.3 (histidine kinase), EC 2.7.11.1 (protein kinase), EC 2.7.7.6 (RNA polymerase), EC 3.1.-.- (Esterases), EC 3.4.24.- (metallopeptidase), EC 3.4.24.1 (atrolysin A), EC 3.4.24.3 (microbial collagenase), EC 3.4.24.6 (Leucolysin), EC 7.1.1.9 (cytochrome-c oxidase), and EC 3.4.16.4 (D-Ala-D-Ala carboxypeptidase) (Figure 4d).
3.5.2. eggNOG Functional Annotation
The eggNOG level 1 analysis showed that 22 functional categories containing genes with a large number are an unknown function accounting for 13% (S: 410,638 and 434,324 unigenes), which was almost twice as many as the next genes associated with amino acid transport and metabolism (E: 181,339 and 173,997 unigenes), as well as energy production and conversion (C: 160,179 and 154,293 unigenes) in Chitu and Shala Lakes, respectively (Figure 5a; Table S9). In contrast, among the other top 10 functions, the lowest number of genes was also identified for encoding various functions such as replication, recombination, and repair (L: 132,186 and 127,538 unigenes), cell envelope formation (M:118,153 and 113,215 unigenes), inorganic ion transport and metabolism (P: 116,142 and 110,195 unigenes), transcription (K: 109,589 and 108,257 unigenes), the transport and metabolism of carbohydrate (G: 105,358 and 103,586 unigenes), signal transduction mechanisms (T: 100,384 and 95,093 unigenes), and translation, ribosomal structure, and biogenesis (J: 99,975 and 94,761 unigenes) (Figure 5b).
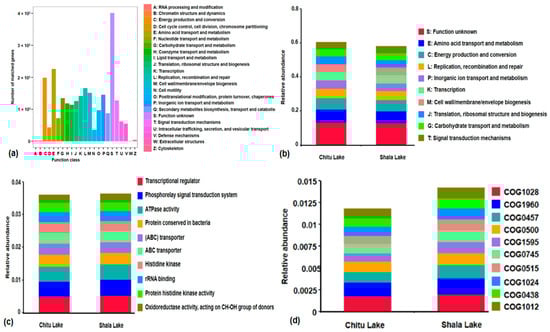
Figure 5.
The relative abundance of eggNOG-encoding functions. The cartogram showing the gene distributions of functional classes across different categories annotated by the eggNOG database within the two microbiomes (a). The stackbar plot showing the relative abundance of eggNOG-encoding functions within subcategories of eggNOG Level 1 in the lakes, and the unknown functions, energy production and conversion, and amino acid transport and metabolism were found to be the most dominant functions in the two microbiomes (b). For eggNOG Level 2 annotation, the transcriptional regulators, phosphorelay signal transduction, ATPase activity, and ABC transporters are the dominant functions (c). The unigenes categorized in the eggNOG COG functional classification system, the COG1028, COG1960, COG0457, and COG0500 are highly abundant functional subcategories across microbiome samples from the lakes (d).
We also delved deeper into analyzing the functional annotations of unigenes at the eggNOG level 2 (OG) for a more comprehensive grasp of their biological roles. This analysis uncovered 31,244 known functions that were common to both soda lakes, with 1944 functions unique to Shala Lake and 1914 functions to Chitu Lake (Table S10). The most common functions at this level were mostly transcriptional regulators, with phosphoryl signal transduction systems as the next most abundant, followed by ATPase activity, (ABC) transporters, ABC transporter, histidine kinases, rRNA binding proteins, protein histidine kinases, and oxidoreductase activity targeting CH-OH group donors (Figure 5c). In addition, the unigenes categorized by the COG and/or ENOG functional classification system in eggNOG OG, going beyond Level 1 and Level 2, also identified 490,659 functions in both soda lakes, with 66,452 and 67,022 functions specific to Shala and Chitu Lake, respectively (Table S11). The top 10 most abundant functions identified in the two lakes were COG1028 (oxidoreductase activity, acting on the CH-OH group of donors), COG1960 (acyl-CoA dehydrogenase activity), COG0457 (peptidyl-tyrosine sulfation), COG0500 (methyltransferase activity), COG1595 (DNA-templated transcription, initiation), COG0745 (phosphorelay signal transduction system), COG0515 (protein kinase activity), COG1024 (Enoyl-CoA hydratase), COG0438 (transferase activity, transferring glycosyl groups), and COG1012 (belonging to the aldehyde dehydrogenase family) (Figure 5d).
3.5.3. Carbohydrate-Active Enzyme-Encoding Gene (CAZy Gene) Annotation
The CAZy study showed that glycosyl transferases (GTs) were the most prevalent enzyme classes encoded by nearly 2.8% (54,651 unigenes) and 2.9% (54,647 unigenes) of the total genes annotated, while glycoside hydrolases (GHs) followed closely behind with 2.6 and 2.7% (51,710 and 50,222 genes in Chitu and Shala Lake, respectively, exceeding the number of genes encoding carbohydrate-binding modules (CBMs) by almost threefold). However, there was a notable decrease in the amount of enzymes for carbohydrate esterase (CE), auxiliary activity (AA), and polysaccharide lyase (PL) (Figure 6a and Tables S12 and S13).

Figure 6.
The gene numbers and relative abundance of CAZy-encoding enzymes in Chitu Lake and Shala Lake. The stacked bar graph showing the relative abundance of CAZy-encoding enzymes within subcategories of CAZy Level 1 (a). The glycosyl transferases, glycoside hydrolases, and carbohydrate-binding modules function classes have the largest number of CAZy-encoding genes and are highly abundant in the two microbiomes. The relative abundance of CAzy-encoding enzymes in subcategories of CAZy Level 2 shows the GT1, GT2, and GT4 of glycosyltransferases classes followed by CBM50 from carbohydrate-binding modules are the most abundant CAZy enzymes (b). The subcategories of CAZy EC ID depicting the dolichyl-phosphate β-glucosyltransferase, beta-mannosylphosphodecaprenol-mannooligosaccharide, alpha-1,6-mannosyltransferase, cellulose synthase, chitin synthase, and others show the highly abundant CAZyme groups in the two microbiomes (c).
Additionally, the analysis of CAZymes at CAZy Level 2 confirmed the presence of 344 enzymes (Table S14). In this group, the 10 most dominant enzymes came from various families like glycosyltransferases GT1, GT2, GT4, and GT51; glycoside hydrolases GH13, GH23, GH28, and GH5; carbohydrate-binding modules CBM50; and carbohydrate esterases CE8 (Figure 6b). In addition, nine CAZymes (GH58, GT103, GH112, GT6, PL32, CBM77, GH107, CBM36, and GH11) were unique to Shala Lake, and eight CAZymes (GH166, GT73, PL29, CBM70, CBM63, GT85, GH121, and CBM44) were distinctive to Chitu Lake. We also identified 705 active enzymes in the metagenome data from the two lakes through the CAZy EC annotation (Table S15). Among these, the top 10 CAZymes were EC 2.4.1.117 (dolichyl-phosphate β-glucosyltransferase), EC 2.4.1.199 (beta-mannosylphosphodecaprenol-mannooligosaccharide alpha-1,6-mannosyltransferase), EC 2.4.1.12 (cellulose synthase), EC 2.4.1.16 (chitin synthase), EC 2.4.289 (dTDP-L-Rha: N-acetylglucosaminyl-PP-decaprenol alpha-1,3-L-rhamnosyltransferase), EC 2.4.1.1.- (N-acetylgalactosaminyltransferase), EC 2.4.1.212 (hyaluronan synthase), EC 2.4.1.83 (dolichyl-phosphate beta-D-mannosyltransferase), EC 2.4.1.- ([inverting] UDP-Glc: protein O-beta-glucosyltransferase), and EC 2.4.225 (alternating beta-1,3_4-N-acetylmannan synthase (2.4.1.-)_ UDP-GlcA: N-acetylglucosaminyl) (Figure 6c). It was also noticed that Chitu Lake had 11 enzymes that were distinct, while Lake Shala only had 3 unique CAZymes.
3.6. Exploring Taxonomic and Functional Alpha Diversity Across Chitu and Shala Lakes
The alpha diversity metrics for Chitu Lake and Shala Lake were assessed through both taxonomic (Table S16) and functional annotations (Table S17), providing a comprehensive evaluation of the microbial community structure and functional potential in these extreme environments. In terms of taxonomic diversity, Chitu Lake exhibited high species richness, with ACE and Chao1 indices of 21,013 and 21,225, respectively, and an observed species count of 20,833. The Shannon index of 8.33 and Simpson index of 0.98 indicated considerable species diversity and evenness, while the Goods coverage of 0.99 confirmed the thoroughness of sampling. Shala Lake showed comparable diversity, with ACE and Chao1 indices of 20,761 and 20,916, respectively, and an observed species count of 20,642. Although the Shannon index (7.90) was slightly lower than that of Chitu Lake, the Simpson index (0.98) still suggested balanced community structure, and the Goods coverage remained high (0.99), affirming the robustness of the taxonomic sampling.
Functional annotations further expanded the understanding of microbial communities, highlighting their metabolic and ecological roles. KEGG annotations indicated high functional diversity, with species counts of 369 for Chitu Lake and 366 for Shala Lake. The Shannon indices (7.01 and 7.02) and Simpson indices (0.9885 for both lakes) aligned with the taxonomic findings, reinforcing the high diversity and evenness of the functional genes present in both lakes. In contrast, eggNOG annotations revealed fewer species (23 for each lake) and moderate Shannon indices (4.04 for Chitu and 4.03 for Shala), with Simpson indices (0.93) suggesting a slightly less even distribution of functional genes compared to KEGG. CAZy annotations, however, demonstrated a diverse and balanced microbial functional profile, with species counts of 336 for Chitu and 335 for Shala, and Shannon indices of 5.87 and 5.84, respectively. The high Goods coverage values across all functional annotations further validate the completeness of the sampling and sequencing efforts, underscoring the comprehensive nature of both taxonomic and functional assessments in capturing the microbial diversity within these soda lake ecosystems.
4. Discussion
This study investigated the taxonomic and functional potential of microbial communities in Shala and Chitu Lakes, Ethiopia. Microbial distributions appear to correlate with variations in physicochemical characteristics (Table S1). For example, Lake Chitu exhibited higher turbidity, nitrate, ammonia, total alkalinity, hydrogen carbonate, and heavy metal concentrations compared to Lake Shala. These environmental differences played a crucial role in shaping the microbial composition and functional potential within these ecosystems, as demonstrated by similar findings in other studies [4]. Supporting this, the genetic profiles of microbial communities, with Chitu Lake harboring a greater number of distinct genes, suggested broader metabolic capabilities (Figure 1b). However, a high degree of functional overlap between the two lakes indicates shared metabolic pathways, likely due to their shared geological history within the Ziway-Shala Lake basin system, which dates back to the late Pliocene–early Pleistocene [25]. This shared history, marked by volcanic activity, has likely driven the evolution of similar functional profiles in both lakes, with slight environmental variations contributing to unique adaptations and functional redundancy [1].
Taxonomic analysis identified four domains—bacteria, archaea, eukaryotes, and viruses—in both lakes, with dominant microbial taxa reflecting subtle differences in physicochemical conditions [9]. In the bacterial domain, Pseudomonadota, Actinomycetota, Bacilota, Chloroflexota, Acidobacteriota, Balneolota, Planctomycetota, and Gammatimonadota were the predominant phyla, consistent with findings from other soda lakes in East Africa [6], the Tibetan Plateau [9], and Lonar Lake, India [16]. Key genera such as Nitriliruptor, Halomonas, Wenzhouxiangella, Egicoccus, and Thioalkalivibrio demonstrated physiological adaptations to extreme conditions. For example, Nitriliruptor thrives in high-pH environments and produces nitrile hydratases for industrial applications [5,26], while Halomonas is effective in nitrogenous waste removal in high-salinity environments [27]. Thioalkalivibrio, a sulfur-oxidizing genus, flourishes in alkaline, sulfide-rich conditions [7,9], and Egicoccus and Wenzhouxiangella exhibit metabolic flexibility, utilizing diverse substrates [28,29]. Moreover, 5–8% of bacterial sequences remained unassigned or unclassified, indicating the presence of unexplored microbial diversity and potentially novel bacterial lineages uniquely adapted to soda lakes of Chitu and Shala. Thus, it underscores the potential for discovering new microbial taxa and gaining insights into their ecological roles, metabolic capabilities, and evolutionary adaptations in these extreme environments [13].
The dominance of Euryarchaeota in both lakes, followed by Nitrososphaerota, Candidatus_Thorarchaeota, Candidatus_Heimdallarchaeota, Thermoproteota, Candidatus_Wosearchaeota, and Candidatus_Thermoplasmatota, aligns with patterns observed in other extreme environments, such as the prevalence of Candidatus_Nanohaloarchaeota in Inner Mongolia [17] and Crenarchaeota in Tibetan Plateau salt lakes [9]. The most abundant archaeal genera—Natronococcus, Halorubrum, Halohasta, and Natronomonas—are highly adapted to extreme temperature, salinity, and pH conditions. These archaea play critical roles in nutrient cycling and ecosystem stability through the metabolism of ammonium, nitrite, and sulfide [6,30]. Their unique physiological adaptations not only sustain ecological processes in soda lakes but also hold significant biotechnological potential, such as the production of bioactive compounds for human and animal applications [31]. Therefore, this study provided broader taxonomic coverage, enabling a more comprehensive detection of the microbial community. Unlike the 16S rRNA amplicon sequencing study by Jeilu et al. [13], our approach highlights the dominance of bacteria and archaea, a higher proportion of unassigned and unclassified taxa, and valuable functional insights in Chitu and Shala Lakes.
In addition, taxonomic annotation results indicate that Chitu Lake exhibits higher alpha diversity than Shala Lake. Elevated ACE and Chao1 indices suggest greater species richness, while higher Shannon and Simpson indices reflect a more balanced microbial community in Chitu Lake. The observed species count was also greater, further supporting its higher diversity. Goods coverage values for both lakes were near 1, confirming adequate sequencing depth to capture most species. These findings suggest that Chitu Lake hosts a more complex microbial ecosystem, likely influenced by environmental factors such as nutrient availability, water chemistry, and ecological interactions.
The functional gene analysis of microbial communities in Chitu and Shala Lakes revealed distinct metabolic capabilities with implications for both ecological adaptation and biotechnological applications. At KEGG level 1, genes associated with metabolism predominated in both lakes (19.4% in Chitu, 18.1% in Shala), with Shala Lake showing a higher proportion of unannotated pathways (66.3%), possibly linked to its less alkaline and saline environment. KEGG functional diversity indices further indicate that both lakes host highly functionally diverse communities, with high alpha-diversity values pointing to a well-balanced distribution of metabolic functions. This diversity reinforces their resilience and capacity to adapt to environmental stressors. Unique enzyme families exclusive to each lake underscore localized microbial adaptation and specialization, while functional redundancy across taxonomic groups suggests ecological stability, enabling these communities to maintain essential biogeochemical functions despite environmental fluctuations [6,23]. At KEGG level 2, genes related to amino acid metabolism, carbohydrate metabolism, and nucleotide synthesis were prominent, reflecting microbial functions crucial for survival [32,33]. These pathways are valuable for biotechnological applications such as enzyme production, biofuel generation, and pharmaceutical synthesis. Notably, genes involved in secondary metabolite biosynthesis (e.g., flavonoids, terpenoids, polyketides) suggest potential for nutraceuticals and pharmaceuticals [34], while vitamin and cofactor metabolism pathways underscore opportunities for enhancing vitamin fortification in fermented foods [35]. Glycan biosynthesis and metabolism further offer prospects for high-value polysaccharides in medicine and therapeutics [36]. Additionally, the detection of genes associated with xenobiotic degradation (e.g., benzoate degradation, polycyclic aromatic hydrocarbon degradation) highlights the potential of these microbial communities for environmental bioremediation. These genes encode enzymes that break down pollutants, making them valuable for cleaning up contaminated environments [16,37]. At KEGG level 3, key functional genes associated with environmental adaptation were identified, including two-component signal transduction systems, ABC transporters, and energy metabolism pathways. These genes enable microbial communities to thrive in nutrient-limited and extreme conditions [38,39]. In addition, quorum sensing, sulfur metabolism, and xenobiotic degradation pathways highlighted their roles in stress response, detoxification, and bioremediation [40,41]. More serine/threonine kinases were identified as critical for cellular control and stress responses, ABC-2 type transport systems were essential for nutrient and ion uptake, while nickel ABC transporters are vital for enzyme function [39,42]. Na+:H+ antiporters played a key role in pH regulation and cellular homeostasis, enabling microbes to thrive in alkaline conditions [43]. Enzymes such as long-chain acyl-CoA synthetase were involved in lipid metabolism and energy storage [44], while transposases contributed to genetic diversity and adaptation through gene duplication and genetic drift [45]. It is also noticed that unique enzyme families exclusive to each lake underscore localized microbial adaptation and specialization, while functional redundancy across taxonomic groups suggests ecological stability, enabling these communities to maintain essential biogeochemical functions despite environmental fluctuations [6,23,46]. Therefore, these findings emphasize the evolutionary and biotechnological significance of these microbial communities. KEGG functional diversity indices further indicate that both lakes host highly functionally diverse communities, with high alpha-diversity values pointing to a well-balanced distribution of metabolic functions. This diversity reinforces their resilience and capacity to adapt to environmental stressors
Dominant microbial species, including Chloroflexota bacterium, Nitriliruptor alkaliphilus, and Egicoccus halophilus, exhibit genetic adaptations critical for survival in extreme conditions. Functions annotated using eggNOG annotations (Table S10), key unigenes driving stress response mechanisms, such as transcriptional regulators, histidine kinases, and rRNA-binding proteins, underscore niche-specific adaptations and further enhance survival by sustaining biogeochemical processes under high salinity and alkalinity [47,48,49,50]. These genetic traits highlight niche-specific adaptations and evolutionary strategies for resource exploitation in fluctuating environments. Further, key biochemical processes underpin microbial adaptation, including lipid metabolism (acyl-CoA dehydrogenases) [51]), redox balance (oxidoreductases), and protein stabilization (peptidyl-tyrosine sulfation) [52] (Table S11). In other words, the presence of such genes underscores the diverse metabolic activities of the microbial community and its contribution to broader ecosystem functions, as observed in similar soda lake ecosystems [53]. The microbial communities that also encode diverse carbohydrate-active enzymes (CAZymes), such as glycoside hydrolases, glycosyltransferases, carbohydrate-binding modules, carbohydrate esterases, and polysaccharide lyases, suggest an active role in organic matter degradation [54,55,56], enabling lignocellulose degradation and biomass conversion [57,58,59,60]. Among 704 EC-encoded enzymes, cellulase (EC 2.4.1.12) [60], chitinase (EC 2.4.1.16) [57,61], hyaluronan synthase (EC 2.4.1.212) [62] and N-acetylgalactosaminyltransferase (EC 2.4.1.-) [63] demonstrate industrial potential for biofuel production, medical applications, and bioremediation. Extremozymes like alkaline proteases (apr), amylase (amyE), and lipases (lip) are particularly promising for detergents and pharmaceuticals due to their stability in high-pH conditions.
The microbial communities’ metabolic repertoire offers significant biotechnological opportunities. Remarkably, nearly 13% of identified genes remain uncharacterized, suggesting untapped biochemical pathways. These findings position Chitu and Shala Lakes as reservoirs of microbial innovation, with applications spanning bioenergy, agriculture, and environmental management. Their functional diversity and genetic resilience underscore their ecological significance and biotechnological promise in addressing industrial and environmental challenges.
5. Conclusions
This study reveals the functional potential of microbial communities in Chitu and Shala Lakes, two alkali-halophile ecosystems, through comparative metagenomic analysis. While Chitu Lake harbors a higher number of unique genes linked to niche-specific adaptations, both lakes share conserved metabolic frameworks dominated by amino acid, carbohydrate, and energy metabolism (KEGG levels 1–2), alongside specialized pathways such as quorum sensing, two-component systems, and ABC transporters (KEGG level 3). Functional redundancy across taxa ensures ecological stability, while Chitu’s distinct gene repertoire highlights localized specialization. The prevalence of oxidoreductases, glycoside hydrolases, and polysaccharide lyases underscores metabolic versatility, enabling biomass degradation and stress resilience, with applications in biofuel production and bioremediation. Notably, nearly 13% of genes remain uncharacterized, suggesting untapped biochemical pathways. Taxonomic profiling revealed the presence of bacteria, archaea, eukaryotes, and viruses in the microbial communities of the lakes. Among the bacterial taxa, the phylum Pseudomonadota was predominant, while the archaeal community was dominated by the phylum Euryarchaeota. These dominant phyla reflect microbial communities that are well adapted to the extreme salinity and alkalinity of the soda lakes. Remarkably, a significant proportion of unassigned and unclassified bacterial sequences highlights the presence of unexplored microbial diversity, indicating the potential for discovering novel lineages and metabolic pathways. These findings position soda lakes as reservoirs of microbial innovation, bridging extremophile ecology and bio-technology. Future research targeting unannotated genes and enzyme optimization will advance sustainable solutions in bioenergy and environmental management, leveraging these ecosystems’ untapped potential.
Supplementary Materials
The following supporting information can be downloaded at https://www.mdpi.com/article/10.3390/microbiolres16030071/s1. Figure S1: Map of sampling sites; Figure S2: The metagenomic DNA quality control integrity test result for Chitu Lake and Shala Lake; Figure S3: The base content along reads and the base quality score distribution along reads of Chitu Lake; Figure S4: The base content along reads and the base quality score distribution along reads of Shala Lake; Figure S5: Composition of raw data and the classification of raw reads of the metagenome of Chitu Lake and Shala Lake; Figure S6: The total scaftig statistics of assembled metagenomic data of Chitu and Shala Lake; Figure S7: The relative abundance of microbial composition at kingdom level by 89% of Bacteria, 4% of Archaea, 0.04% of Eukaryote and 0.2% of Virus composition in Chitu Lake; Figure S8: The relative abundance of microbial composition at kingdom level by 92% of Bacteria (a), 0.8% of Archaea, 0.02% of Eukaryote and 0.09% of Virus composition in Shala Lake. Table S1: Physicochemical measurements and elemental content of Lake Chitu and Shala; Table S2: Detailed CheckM of MAGs in Shala and Chitu Lake; Table S3: The relative abundance of microbial community of Chitu and Shala Lakes at phylum, genera, and species levels; Table S4: KEGG pathway Level 1 of Chitu Lake and Shala Lake; Table S5: KEGG (KO) Pathway Level 2 of Chitu Lake and Shala Lake; Table S6: KEGG (KO) pathway Level 3 of Chitu Lake and Shala Lake; Table S7: KEGG Orthology ID of Chitu Lake and Shala Lake; Table S8: Relative Abundance of KEGG Modules (M) in Chitu Lake and Shala Lake; Table S9: Relative Abundance of KEGG Enzymes (KO_EC) in Chitu Lake and Shala Lake; Table S10: eggNOG Level 1 (Functional Category) of Chitu Lake and Shala Lake; Table S11: eggNOG Level 2 (OG_Description) of Chitu Lake and Shala Lake; Table S12: Relative Abundance of eggNOG Ortholog_Group Level 3 (COG and ENOG) in Chitu Lake and Shala Lake; Table S13: Summary of CAZy Module of Chitu Lake and Shala Lake; Table S14: Relative abundance of CAZy-encoding enzymes (CAZy Module Level 2) in Chitu Lake and Shala Lake; Table S15: Relative abundance of CAZy-encoding enzymes (CAZy Module level 2) in Chitu Lake and Shala Lake; Table S16: Relative abundance of CAZy EC ID in Chitu Lake and Shala Lake; Table S17: Alpha diversity index statistics of microbial taxonomic alpha diversity index statistics; and Table S18: Diversity index statistics of KEGG, eggNOG and CAZy annotation.
Author Contributions
Conceptualization, methodology, and investigation, G.K.B.; validation, A.F.M., E.M.A., M.T.G., and F.A.T.; formal analysis, G.K.B. and A.F.M.; writing—original draft manuscript preparation, G.K.B.; project administration, supervision, reviewing, and editing, E.M.A., M.T.G. and F.A.T. All authors have read and agreed to the published version of the manuscript.
Funding
This research received no external funding. However, the Addis Ababa Science and Technology University (AASTU), in Ethiopia, provided small funding for this project of postgraduate PhD programs.
Institutional Review Board Statement
Not applicable.
Informed Consent Statement
Not applicable.
Data Availability Statement
The raw data comprising shotgun metagenomic reads obtained from the sequencing of samples were deposited in the Sequence Read Archive (SRA) of the National Center for Biotechnology Information (NCBI) under the accession numbers PRJNA1081624 and PRJNA1081670, corresponding to Chitu Lake (AastuCL1) and Shala Lake (AastuSL2), respectively.
Acknowledgments
The authors would like to thank Addis Ababa Science and Technology University for its laboratory and technical support. Additionally, the authors would like to express their sincere gratitude to Novogen metagenomic sequencing facilities (HK) in Singapore for their assistance in processing shotgun metagenomics sequencing data.
Conflicts of Interest
The authors declare no conflicts of interest.
References
- Zorz, J.K.; Sharp, C.; Kleiner, M.; Gordon, P.M.; Pon, R.T.; Dong, X.; Strous, M.A. A shared core microbiome in soda lakes separated by large distances. Nat. Commun. 2019, 10, 4230. [Google Scholar] [CrossRef] [PubMed]
- Lanzen, A.; Simachew, A.; Gessesse, A.; Chmolowska, D.; Jonassen, I.; Øvreås, L. Surprising prokaryotic and eukaryotic diversity, community structure and biogeography of Ethiopian soda lakes. PLoS ONE 2013, 8, e72577. [Google Scholar] [CrossRef]
- Vavourakis, C.D.; Ghai, R.; Rodriguez-Valera, F.; Sorokin, D.Y.; Tringe, S.G.; Hugenholtz, P.; Muyzer, G. Metagenomic insights into the uncultured diversity and physiology of microbes in four hypersaline soda lake brines. Front. Microbiol. 2016, 7, 180500. [Google Scholar] [CrossRef] [PubMed]
- Banda, J.F.; Lu, Y.; Hao, C.; Pei, L.; Du, Z.; Zhang, Y.; Dong, H. The effects of salinity and pH on microbial community diversity and distribution pattern in the brines of Soda Lakes in Badain Jaran Desert, China. Geomicrobiol. J. 2019, 37, 1–12. [Google Scholar] [CrossRef]
- Sorokin, D.Y.; Berben, T.; Melton, E.D.; Overmars, L.; Vavourakis, C.D.; Muyzer, G. Microbial diversity and biogeochemical cycling in soda lakes. Extremophiles 2014, 18, 791–809. [Google Scholar] [CrossRef]
- Grant, W.D.; Jones, B.E. Bacteria, archaea, and viruses of soda lakes. In Soda Lakes of East Africa; Schagerl, M., Ed.; Springer: Cham, Switzerland, 2016; pp. 97–147. [Google Scholar] [CrossRef]
- Vavourakis, C.D.; Andrei, A.S.; Mehrshad, M.; Ghai, R.; Sorokin, D.Y.; Muyzer, G. A metagenomics roadmap to the uncultured genome diversity in hypersaline soda lake sediments. Microbiome 2018, 6, 168. [Google Scholar] [CrossRef]
- Bekele, G.K.; Gebrie, S.A.; Mekonen, E.; Fida, T.T.; Woldesemayat, A.A.; Abda, E.M.; Gemeda, M.T.; Assefa, F. Isolation and characterization of diesel-degrading bacteria from hydrocarbon-contaminated sites, flower farms, and soda lakes. Int. J. Microbiol. 2022, 2022, 5655767. [Google Scholar] [CrossRef] [PubMed]
- He, Y.; He, L.; Wang, Z.; Liang, T.; Sun, S.; Liu, X. Salinity shapes the microbial communities in surface sediments of salt lakes on the Tibetan Plateau, China. Water 2022, 14, 4043. [Google Scholar] [CrossRef]
- Liu, Q.; Yang, J.; Wang, B.; Liu, W.; Hua, Z.; Jiang, H. Influence of salinity on the diversity and composition of carbohydrate metabolism, nitrogen, and sulfur cycling genes in lake surface sediments. Front. Microbiol. 2022, 13, 1019010. [Google Scholar] [CrossRef]
- Melese, H.; Debella, H.J. Comparative study on seasonal variations in physico-chemical characteristics of four soda lakes of Ethiopia (Arenguade, Beseka, Chitu, and Shala). Heliyon. 2023, 9, e16308. [Google Scholar] [CrossRef]
- Ranjan, R.; Rani, A.; Metwally, A.; McGee, H.S.; Perkins, D.L. Analysis of the microbiome: Advantages of whole genome shotgun versus 16S rRNA amplicon sequencing. Biochem. Biophys. Res. Commun. 2016, 469, 967–977. [Google Scholar] [CrossRef] [PubMed]
- Jeilu, O.; Gessesse, A.; Simachew, A.; Johansson, E.; Alexandersson, E. Prokaryotic and eukaryotic microbial diversity from three soda lakes in the East African Rift Valley determined by amplicon sequencing. Front. Microbiol. 2022, 13, 999876. [Google Scholar] [CrossRef] [PubMed]
- Soufi, H.H.; Tran, D.; Louca, S. Microbiology of Big Soda Lake, a multi-extreme meromictic volcanic crater lake in the Nevada desert. Environ. Microbiol. 2024, 26, e16578. [Google Scholar] [CrossRef]
- Wiseschart, A.; Mhuantong, W.; Tangphatsornruang, S.; Chantasingh, D.; Pootanakit, K. Shotgun metagenomic sequencing from Manao-Pee cave, Thailand, reveals insight into the microbial community structure and its metabolic potential. BMC Microbiol. 2019, 19, 144. [Google Scholar] [CrossRef] [PubMed]
- Chakraborty, J.; Rajput, V.; Sapkale, V.; Kamble, S.; Dharne, M. Spatiotemporal resolution of taxonomic and functional microbiome of Lonar soda lake of India reveals metabolic potential for bioremediation. Chemosphere 2021, 264, 128574. [Google Scholar] [CrossRef]
- Zhou, H.; Zhao, D.; Zhang, S.; Xue, Q.; Zhang, M.; Yu, H.; Xiang, H. Metagenomic insights into the environmental adaptation and metabolism of Candidatus_Haloplasmatales, one archaeal order thriving in saline lakes. Environ. Microbiol. 2022, 24, 2239–2258. [Google Scholar] [CrossRef]
- Verma, S.K.; Singh, H.; Sharma, P.C. An improved method suitable for isolation of high-quality metagenomic DNA from diverse soils. 3 Biotech 2017, 7, 171. [Google Scholar] [CrossRef] [PubMed]
- Chen, S.; Huang, T.; Zhou, Y.; Han, Y.; Xu, M.; Gu, J. AfterQC: Automatic filtering, trimming, error removing and quality control for fastq data. BMC Bioinform. 2017, 18, 80. [Google Scholar] [CrossRef]
- Perez-Mon, C.; Qi, W.; Vikram, S.; Frossard, A.; Makhalanyane, T.; Cowan, D.; Frey, B. Shotgun metagenomics reveals distinct functional diversity and metabolic capabilities between 12,000-year-old permafrost and active layers on Muot da Barba Peider (Swiss Alps). Microb. Genom. 2021, 7, 000558. [Google Scholar] [CrossRef]
- Yang, J.; Li, W.; Teng, D.; Yang, X.; Zhang, Y.; Li, Y. Metagenomic insights into microbial community structure, function, and salt adaptation in saline soils of arid land, China. Microorganisms 2022, 10, 2183. [Google Scholar] [CrossRef]
- Costa, S.S.; Guimarães, L.C.; Silva, A.; Soares, S.C.; Baraúna, R.A. First steps in the analysis of prokaryotic pan-genomes. Bioinform. Biol. Insights 2020, 14, 1177932220938064. [Google Scholar] [CrossRef] [PubMed]
- Pellegrinetti, T.A.; Cotta, S.R.; Sarmento, H.; Costa, J.S.; Delbaje, E.; Montes, C.R.; Fiore, M.F. Bacterial communities along environmental gradients in tropical soda lakes. Microb. Ecol. 2023, 85, 892–903. [Google Scholar] [CrossRef] [PubMed]
- Wang, L.; Zhang, G.; Xu, H.; Xin, H.; Zhang, Y. Metagenomic analyses of microbial and carbohydrate-active enzymes in the rumen of Holstein cows fed different forage-to-concentrate ratios. Front. Microbiol. 2019, 10, 649. [Google Scholar] [CrossRef] [PubMed]
- Le Turdu, C.; Tiercelin, J.J.; Gibert, E.; Travi, Y.; Lezzar, K.E.; Richert, J.P.; Taieb, M. The Ziway–Shala lake basin system, Main Ethiopian Rift: Influence of volcanism, tectonics, and climatic forcing on basin formation and sedimentation. Palaeogeogr. Palaeocl. 1999, 150, 135–177. [Google Scholar] [CrossRef]
- Sorokin, D.Y.; van Pelt, S.; Tourova, T.P.; Evtushenko, L.I. Nitriliruptor alkaliphilus gen. nov., sp. nov., a deep-lineage haloalkaliphilic actinobacterium from soda lakes capable of growth on aliphatic nitriles, and proposal of Nitriliruptoraceae fam. nov. and Nitriliruptorales ord. nov. Int. J. Syst. Evol. Microbiol. 2009, 59, 248–253. [Google Scholar] [CrossRef]
- Wang, T.; Jiang, Z.; Dong, W.; Liang, X.; Zhang, L.; Zhu, Y. Growth and nitrogen removal characteristics of Halomonas sp. B01 under high salinity. Ann. Microbiol. 2019, 69, 1425–1433. [Google Scholar] [CrossRef]
- Sorokin, D.Y.; Mosier, D.; Zorz, J.K.; Dong, X.; Strous, M. Wenzhouxiangella strain AB-CW3, a proteolytic bacterium from hypersaline soda lakes that preys on cells of Gram-positive bacteria. Front. Microbiol. 2020, 11, 597686. [Google Scholar] [CrossRef] [PubMed]
- Chen, D.D.; Ahmad, M.; Liu, Y.H.; Wang, S.; Liu, B.B.; Guo, S.X.; Li, W.J. Transcriptomic responses of haloalkalitolerant bacterium Egicoccus halophilus EGI 80432T to highly alkaline stress. Extremophiles 2021, 25, 459–470. [Google Scholar] [CrossRef]
- Wu, Y.J.; Whang, L.M.; Fukushima, T.; Huang, Y.J. Abundance, community structures, and nitrification inhibition on ammonia-oxidizing archaea enriched under high and low salinity. Int. Biodeter. Biodegr. 2020, 153, 105040. [Google Scholar] [CrossRef]
- Bawane, P.; Deshpande, S.; Yele, S. Industrial and pharmaceutical applications of microbial diversity of hypersaline ecology from Lonar Soda Crater. Curr. Pharm. Biotechnol. 2024, 25, 1564–1584. [Google Scholar] [CrossRef]
- Jang, Y.S.; Lee, J.; Malaviya, A.; Seung, D.Y.; Cho, J.H.; Lee, S.Y. Butanol production from renewable biomass: Rediscovery of metabolic pathways and metabolic engineering. Biotechnol. J. 2012, 7, 186–198. [Google Scholar] [CrossRef]
- Chandel, N.S. Nucleotide metabolism. Cold Spring Harb. Perspect. Biol. 2021, 13, a040592. [Google Scholar] [CrossRef]
- Vasudevan, U.M.; Lee, E.Y. Flavonoids, terpenoids, and polyketide antibiotics: Role of glycosylation and biocatalytic tactics in engineering glycosylation. Biotechnol. Adv. 2020, 41, 107550. [Google Scholar] [CrossRef]
- Das, P.; Babaei, P.; Nielsen, J. Metagenomic analysis of microbe-mediated vitamin metabolism in the human gut microbiome. BMC Genom. 2019, 20, 208. [Google Scholar] [CrossRef]
- Paliya, B.S.; Sharma, V.K.; Tuohy, M.G.; Singh, H.B.; Koffas, M.; Benhida, R.; Gupta, V.K. Bacterial glycobiotechnology: A biosynthetic route for the production of biopharmaceutical glycans. Biotechnol. Adv. 2023, 67, 108180. [Google Scholar] [CrossRef]
- Bao, Y.J.; Xu, Z.; Li, Y.; Yao, Z.; Sun, J.; Song, H. High-throughput metagenomic analysis of petroleum-contaminated soil microbiome reveals the versatility in xenobiotic aromatics metabolism. J. Environ. Sci. 2017, 56, 25–35. [Google Scholar] [CrossRef]
- Laub, M.T.; Goulian, M. Specificity in two-component signal transduction pathways. Annu. Rev. Genet. 2007, 41, 121–145. [Google Scholar] [CrossRef]
- Glavinas, H.; Krajcsi, P.; Cserepes, J.; Sarkadi, B. The role of ABC transporters in drug resistance, metabolism, and toxicity. Curr. Drug Deliv. 2004, 1, 27–42. [Google Scholar] [CrossRef]
- Nag, M.; Lahiri, D.; Ghosh, A.; Das, D.; Ray, R.R. Quorum sensing. In Biofilm-Mediated Diseases: Causes and Controls; Ray, R.R., Nag, M., Lahiri, D., Eds.; Springer: Singapore, 2021. [Google Scholar] [CrossRef]
- Miller, C.G.; Schmidt, E.E. Sulfur metabolism under stress. Antioxid. Redox Signal. 2020, 33, 1158–1173. [Google Scholar] [CrossRef]
- Maqbool, A.; Horler, R.S.; Muller, A.; Wilkinson, A.J.; Wilson, K.S.; Thomas, G.H. The substrate-binding protein in bacterial ABC transporters: Dissecting roles in the evolution of substrate specificity. Biochem. Soc. Trans. 2015, 43, 1011–1017. [Google Scholar] [CrossRef]
- Wai, L.C.; Illias, R.M.; Muhammad, M.N.; Najimudin, N. Expression of the Na+/H+ antiporter gene (g1-nhaC) of alkaliphilic Bacillus sp. G1 in Escherichia coli. FEMS Microbiol. Lett. 2007, 276, 114–122. [Google Scholar] [CrossRef]
- Roelands, J.; Garand, M.; Hinchcliff, E.; Ma, Y.; Shah, P.; Toufiq, M.; Chaussabel, D. Long-chain acyl-CoA synthetase 1 role in sepsis and immunity: Perspectives from a parallel review of public transcriptome datasets and of the literature. Front. Immunol. 2019, 10, 2410. [Google Scholar] [CrossRef]
- Anderson, R.E.; Graham, E.D.; Huber, J.A.; Tully, B.J. Microbial populations are shaped by dispersal and recombination in a low biomass subseafloor habitat. mBio 2022, 13, e00354-22. [Google Scholar] [CrossRef]
- Simachew, A.; Lanzén, A.; Gessesse, A.; Øvreås, L. Prokaryotic community diversity along an increasing salt gradient in a soda ash concentration pond. Microb. Ecol. 2016, 71, 326–338. [Google Scholar] [CrossRef]
- Majdalani, N.; Gottesman, S. The Rcs phosphorelay: A complex signal transduction system. Annu. Rev. Microbiol. 2005, 59, 379–405. [Google Scholar] [CrossRef]
- Pitriuk, A.V.; Detkova, E.N.; Pusheva, M.A. Comparative study of the energy metabolism of anaerobic alkaliphiles from soda lakes. Mikrobiologiia 2004, 73, 293–299. [Google Scholar] [CrossRef] [PubMed]
- Ishii, E.; Eguchi, Y. Diversity in sensing and signaling of bacterial sensor histidine kinases. Biomolecules 2021, 11, 1524. [Google Scholar] [CrossRef]
- Van Assche, E.; Van Puyvelde, S.; Vanderleyden, J.; Steenackers, H.P. RNA-binding proteins involved in posttranscriptional regulation in bacteria. Front. Microbiol. 2015, 6, 141. [Google Scholar] [CrossRef]
- Ghisla, S.; Thorpe, C. Acyl-CoA dehydrogenases: A mechanistic overview. Eur. J. Biochem. 2004, 271, 494–508. [Google Scholar] [CrossRef]
- Pan, Z.; Liu, Z.; Cheng, H.; Wang, Y.; Gao, T.; Ullah, S.; Xue, Y. Systematic analysis of the In Situ crosstalk of tyrosine modifications reveals no additional natural selection on multiply modified residues. Sci. Rep. 2014, 4, 7331. [Google Scholar] [CrossRef]
- Sorokin, D.Y.; Kevbrin, V.V.; Tourova, T.P. Microbial diversity and biogeochemical cycles in soda lakes: A review. Appl. Environ. Microbiol. 2015, 81, 6391–6403. [Google Scholar]
- Lairson, L.L.; Henrissat, B.; Davies, G.J.; Withers, S.G. Glycosyltransferases: Structures, functions, and mechanisms. Annu. Rev. Biochem. 2008, 77, 521–555. [Google Scholar] [CrossRef]
- Berlemont, R.; Martiny, A.C. Glycoside hydrolases across environmental microbial communities. PLoS Comput. Biol. 2016, 12, e1005300. [Google Scholar] [CrossRef]
- Drula, E.; Garron, M.L.; Dogan, S.; Lombard, V.; Henrissat, B.; Terrapon, N. The carbohydrate-active enzyme database: Functions and literature. Nucleic Acids Res. 2022, 50, D571–D577. [Google Scholar] [CrossRef]
- Alshareef, S.A. Metabolic analysis of the CAZy class glycosyltransferases in rhizospheric soil fungiome of the plant species Moringa oleifera. Saudi J. Biol. Sci. 2024, 31, 103956. [Google Scholar] [CrossRef]
- Davies, G.J.; Sinnott, M.L. Sorting the diverse: The sequence-based classifications of carbohydrate-active enzymes. Biochemist 2008, 30, 26–32. [Google Scholar] [CrossRef]
- Van Wyk, N.; Drancourt, M.; Henrissat, B.; Kremer, L. Current perspectives on the families of glycoside hydrolases of Mycobacterium tuberculosis: Their importance and prospects for assigning function to unknowns. Glycobiology 2017, 27, 112–122. [Google Scholar] [CrossRef]
- Li, Y.; Wang, Y.; Tu, T.; Zhang, D.; Ma, R.; You, S.; Xu, B. Two acidic, thermophilic GH28 polygalacturonases from Talaromyces leycettanus JCM 12802 with application potentials for grape juice clarification. Food Chem. 2017, 237, 997–1003. [Google Scholar] [CrossRef]
- Berini, F.; Casartelli, M.; Montali, A.; Reguzzoni, M.; Tettamanti, G.; Marinelli, F. Metagenome-sourced microbial chitinases as potential insecticide proteins. Front. Microbiol. 2019, 10, 1358. [Google Scholar] [CrossRef]
- DeAngelis, P.L.; Zimmer, J. Hyaluronan synthases; mechanisms, myths, & mysteries of three types of unique bifunctional glycosyltransferases. Glycobiology 2023, 33, 1117–1127. [Google Scholar] [CrossRef]
- Vadaie, N.; Jarvis, D.L. Molecular cloning and functional characterization of a Lepidopteran insect β4-N-acetylgalactosaminyltransferase with broad substrate specificity, a functional role in glycoprotein biosynthesis, and a potential functional role in glycolipid biosynthesis. J. Biol. Chem. 2004, 279, 33501–33518. [Google Scholar] [CrossRef] [PubMed]
Disclaimer/Publisher’s Note: The statements, opinions and data contained in all publications are solely those of the individual author(s) and contributor(s) and not of MDPI and/or the editor(s). MDPI and/or the editor(s) disclaim responsibility for any injury to people or property resulting from any ideas, methods, instructions or products referred to in the content. |
© 2025 by the authors. Licensee MDPI, Basel, Switzerland. This article is an open access article distributed under the terms and conditions of the Creative Commons Attribution (CC BY) license (https://creativecommons.org/licenses/by/4.0/).