Article

Quantitative Differences in the Human Intestinal Microbiota Through the Stages of Life: Infants, Children, Adults and the Elderly

1
Department of Microbiology, Institute of Biomedicine and Translational Medicine, University of Tartu, Ravila 19, 50411 Tartu, Estonia
2
Children’s Clinic, Tartu University Hospital, Puusepa 8, 50406 Tartu, Estonia
3
BioCC OÜ, Kreutzwaldi Str. 1, 51014 Tartu, Estonia
*
Author to whom correspondence should be addressed.
Microbiol. Res. 2025, 16(3), 60; https://doi.org/10.3390/microbiolres16030060
Submission received: 6 December 2024 / Revised: 16 February 2025 / Accepted: 21 February 2025 / Published: 5 March 2025

Abstract

:
The aim of this study was to compare the human intestinal microbiota in different age groups, elucidating the precise stages of life in which the gut microbiota evolves its specific characteristics in terms of composition and diversity, as well as associating different bacterial groups for prediction of their intertwined metabolic role, considering their importance in human health. The quantitative composition, Bacteroidetes/Firmicutes (B/F) ratio, counts and diversity indices of faecal samples obtained from infant, child, adult and elderly individuals were assessed via quantitative real-time polymerase chain reaction (qPCR). The intestinal microbiota of infants expressed the highest B/F ratio and diversity. The total bacteria counts, Bacteroides-Prevotella and Blautia coccoides-Eubacterium rectale groups were the most abundant in adults and infants, while child and elderly individuals presented the highest counts of Firmicutes and Lactobacillus sp. In infants, the counts of Enterococcus sp., Streptococcus sp., Enterobacteriaceae, Veillonella sp. and Clostridium perfringens groups were higher, when compared to the other age groups. The tightest positive correlations between bacteria within age groups were found for the B. coccoides-E. rectale, C. leptum (incl. Faecalibacterium prausnitzii), Bacteroidetes-Prevotella and Atopobium groups. Through the stages of life, the quantitative composition and diversity of intestinal microbiota evolves with two changing maximal peaks of predominant groups, with bacterial diversity decreasing from infant to child stage, showing unitary stabilization in adults and presenting a wide individual range in the elderly. The high counts of Bacteroidetes and Clostridium from the phylum Firmicutes, present throughout all life stages, mainly influence the composition and metabolic activity of other bacteria. Recognizing age-specific differences may provide a basis for comparing different geographic populations and predicting the intertwined metabolites of various bacteria, which have certain implications for health.

1. Introduction

The human gut microbiota is a complex ecological community which, through its metabolic activities and interactions with the host organism, has an influence on human physiology [1,2]. The development of the intestinal microbiota is affected by a number of factors, including genetics, geography, socio-economic factors, diet and the use of antibiotics [3,4,5]. However, the modulation (in both profound and stable senses) of the microbiota throughout the stages of human life is not yet well-understood.
Studies have reported over 50 bacterial phyla and more than 1000 different species of bacteria present in the large intestine of healthy adults [6,7,8,9]. In the first days of life, the meconium contains mainly 2/3 Proteobacteria and approximately 1/3 of Firmicutes while, by the first month, their proportion quickly shifts towards the latter [10]. The gut microbiota composition increases in diversity and richness during childhood and adolescence, while the phyla Bacteroidetes and Firmicutes dominate in the human adult [11,12,13]. Variable reports have suggested that the age-affiliated microbiota population shifts from 2 years to adulthood [14], while others have indicated that this process begins in the 3-4-year period after birth [15] or even at 5 years of age [16,17].
This raises a question regarding possible shifts in the composition of the intestinal microbiota in the transition from infancy to a young child (1 year) and further to a 5-year-old preschool child. Similarly, which of the colonizing microbes during infancy are sustained in the intestinal microbiota through to adulthood remains unresolved. Another essential shift in the composition of the intestinal microbiota occurs with ageing, mainly due to changes in the physiology of the gastrointestinal tract and associated immune system, as well as diseases, drugs and changes in nutrition [13,18,19,20]. The reported age-related differences in the composition of the intestinal microbiota in elderly individuals include shifts in highly abundant species within several bacterial groups and an increase in the total number of anaerobes, whereas no significant changes have been reported for anaerobic bacteria [13,21,22,23,24].
Most studies published on the composition of the intestinal microbiota have focused on the effects of different human diseases [25,26,27,28,29]. However, there are fewer studies comparing the intestinal microbiota of healthy individuals across all age groups, including infants, young children, preschool children, adults and the elderly.
To characterise the individually highly complex microbiota, core (most shared) and non-core (less shared) groups in the bacterial community have been proposed [30]. Although the quantitative variations of core bacterial taxa have been investigated in previous studies [31,32,33], to the best of our knowledge, there have been no studies on the division by counts and relations between bacteria of the intestinal microbiota in individuals from different age groups to date.
The quantitative real-time PCR (qPCR) method is a well-established and widely used approach for the quantification of different microbial groups within the intestinal microbiota. The next-generation sequencing approach has advanced microbiome research through enabling absolute quantification and deeper taxonomic resolution. However, this method has not yet been universally adopted for diagnosis of dysbiosis in routine diagnostic laboratories. Given the complementary nature of these techniques, it is crucial to evaluate the continued relevance of qPCR in microbiome-related studies. Additionally, some recent studies have demonstrated the necessity of applying absolute quantification alongside whole-genome sequencing to obtain a comprehensive understanding of microbiome-related dynamics and interactions [34,35]. The use of specific primers and probes enables the accurate and sensitive quantification of bacterial populations [25,33,35], as well as the ability to compare correlations between detected bacteria across different age groups.
We aimed to reveal differences in the human intestinal microbiota in relation to different age groups (infants, young children, adults and the elderly) in the Estonian population, in order to elucidate when precisely (from 1- to 75-years-old) the gut microbiota composition reaches the richness and diversity characteristic of adults, as well as when it becomes characteristic of the elderly. We also aimed to assess the associations between different bacterial groups in the intestinal microbiota, enabling prediction of their intertwined metabolic roles throughout the stages of life.

2. Materials and Methods

2.1. Ethical Permission

The experimental design applied to these cohorts was approved by the Ethics Committee of the Medical Faculty of the University of Tartu with approvals: no. 43/1-1997, no. 42/5-1996, no. 210/T-3, 19 November 2011 and no. 139/16 20 June 2005. The present study was conducted according to the guidelines laid down in the Declaration of Helsinki.

2.2. Study Group

The study groups were defined based on age categories as follows: infants (0–12 months), children (1–12 years), adults (18–64 years) and the elderly (65 years and older), according to established demographic and clinical criteria [36,37] (Table 1). Faecal samples were collected from all individuals.
All infants and children were randomly selected from a control group of a larger study on the immune response to allergens and the development of allergies in relation to environmental factors. No sensitization to any of the tested allergens nor any clinical manifestation of any allergic diseases were detected in study groups [38]. Informed consent was also obtained from the parents of the children. Adults were randomly recruited from the baseline sample of a study assessing the impacts of a probiotic product [39,40]. Elderly individuals were randomly included from the registry of family doctors and orthopaedists of the Tartu University Hospital, Estonia, who were considered sufficiently healthy to perform elective orthopaedic surgery [41]. Inclusion criteria for adult and elderly individuals included not following any diet regiment, while exclusion criteria were the usage of antibiotics or antifungals within three months prior to participation, consumption of probiotics in any form within one month prior to participation, chronically active inflammatory diseases, chronic gastrointestinal disorder and pregnancy. The inclusion and exclusion criteria were validated by medical doctors.
Infants consumed only breast milk in the period of 2.6 ± 2.0 months and breast milk combined with formula in the period of 10.4 ± 5.9 months.
Subjects in the adult and elderly groups habitually consumed a Western-type diet, typically rich in rye bread, pork, potatoes, dairy products, eggs, oat/wheat/rice porridge, vegetable seed oils and non-alcoholic beverages [42,43,44].

2.3. Sample Collection and Preparation

Fresh stool samples were placed into sterile containers. The samples collected at home or at hospital were kept in a domestic refrigerator at 4 °C for no more than 2 h before transportation to the laboratory. Upon arrival, samples were mechanically homogenized with a sterile spatula, divided into aliquots and stored at −70 °C until future molecular microbiological isolation.

2.4. Bacterial Strains and Culture Conditions

Fifteen culture collection strains from both the American Type Culture Collection (ATCC), the German Collection of Microorganisms and Cell Cultures (DSMZ) and Human Microbiota Biobank (HUMB) of University of Tartu were used to evaluate the specificity of PCR primer sets: Bacteroides fragilis ATCC 25285, Ruminococcus gnavus HUMB 09254, Clostridium leptum DSM 753, Fusobacterium prausnitzii DSM 17677, Clostridium perfringens DSM 756, Clostridiodes difficile ATCC 43255, Veillonella parvula DSM 2007, Lactobacillus acidophilus ATCC 4356, Enterococcus faecalis ATCC 51299, Streptococcus mutans ATCC25175, Staphylococcus aureus ATCC 25923, Bifidobacterium longum DSM14583, Atopobium parvulum ATCC33793, Escherichia coli ATCC 700336 and Desulfovibrio desulfuricans ATCC 7757.

2.5. DNA Extraction from Bacterial Cultures and Feces

Bacterial DNA from faecal samples was extracted with the QIAamp PowerFecal®Pro DNA kit (Qiagen, Bristol, VA, USA), using an ELMI Sky Line instrument (ELMI Ltd., Riga, Latvia) according to the manufacturer’s instructions. Extracted DNA was quantified using a NanoDrop™ 1000 Spectrophotometer 1.0 (NanoDrop Technologies, Inc., Wilmington, DE, USA) at 260 nm.
Bacterial DNA of type strains was extracted using a QiaAmp DNA mini kit (Qiagen, Hilden, Germany), according to the manufacturer’s instructions.

2.6. Primers and Probes

The primers and probes used in the study targeted the 16S rRNA genes (Table 2). The oligonucleotide probe used for the detection of the genera Bifidobacterium and Lactobacillus were labelled with the 5-reporter dye VIC and the 3 quencher NFQ-MGB, and those for total bacteria and Clostridiodes difficile were labelled with 6-FAM and TAMRA (Applied Biosystems, The Netherlands).

2.7. Quantitative Real-Time PCR (qPCR)

To generate plasmid standards for qPCR, plasmids containing amplified regions of target bacteria were cloned using the pGEM-T Easy vector system (Promega, Madison, WI, USA). Corresponding PCR amplicons were inserted into a separate plasmid vector and the recombinant vector was transformed into chemically competent E. coli JM109 cells. Plasmids were purified with a NucleoSpin PlasmidQuick pure Kit, according to the manufacturer’s instructions (Macherey-Nagel, Dueren, Germany). Multiple dilutions of purified plasmids were quantified via spectrophotometry (NanoDrop ND-1000, USA) [21,52]. Quantification of target DNA was achieved using serial tenfold dilution from 105 to 101 plasmid copies of the previously quantified plasmid standards.
Amplification and detection of DNA via real-time qPCR was performed with a 7500 Fast Real-Time PCR System (Applied Biosystems Europe BV, Zug, Switzerland) using optical-grade 96-well plates. Triplicate sample analysis was routinely performed in a total volume of 25 µL using SYBR Green PCR Master Mix (Applied Biosystems). Each reaction included 5 µL of template DNA or water (no-template control), 12.5 µL of SYBR Green Master mix (Applied Biosystems, Waltham, MA, USA), 4 mM MgCl2 and the appropriate primers with concentration of 150–500 nM (Table 2) [21,25,32,46,49,51,52].
For TaqMan assay, the PCR reaction was performed in a total volume of 25 µL using TaqMan® Universal PCR Master Mix (Applied Biosystems, Foster City, CA, USA). Each reaction included 5 µL of template DNA or water, 12.5 µL of TaqMan® Universal PCR Master Mix (Applied Biosystems, USA), 125–600 nM of corresponding primers and 40–100 nM probes (Table 2) [45,47,48,50].
The qPCR conditions consisted of an initial denaturation step 50 °C for 2 min and 95 °C for 10 min, continued with an amplification step followed by 40 cycles consisting of denaturation at 95 °C for 15 s, and an annealing–elongation step at 60 °C for 1 min. At the end of PCR assays, dissociation curve analysis was performed to check for non-specific products and/or contamination for SYBR Green. Standard curves were routinely obtained for each qPCR run using serial dilutions of control plasmid DNA. Data were analysed using the Sequence Detection Software version 1.6.3 (Applied Biosystems, USA).

2.8. Statistical Analysis

The software programs Sigma Plot for Windows V.11.0 (GmbH Formation, Germany) and V.R 2.6.2 (A Language and Environment, http://www.r-project.org, accessed on 8 February 2008) were used for data analysis and the generation of graphs. Logarithms of faecal 16S rRNA gene copy numbers were calculated to achieve normally distributed data. The prevalence of species is expressed as a percentage. Clinical and microbiological data are expressed as mean ± standard deviation (SD). The diversity, Bacteroidetes/Firmicutes ratio and counts of bacteria in different age groups were compared through t-tests or the Wilcoxon rank-sum test, according to the distribution of data adjusted for multiple comparisons. Spearman correlation coefficients were calculated between microbiological and clinical data and bacterial groups within different age groups. The predominance of specific groups of bacteria was evaluated according to statistical differences between subordinate bacterial groups within a particular age group. Differences were considered statistically significant at p ≤ 0.05.

3. Results

3.1. Prevalence and Counts of Intestinal Bacteria Groups in Persons of Different Age

Using qPCR, a total of 17 bacterial groups or species were quantified from the faecal samples. Different age groups were characterized by specific (core) abundant bacteria (Table 3). The prevalence of bacterial groups in different age groups varied from 28% to 100%. In infants and adults, the highest bacterial counts were detected among total bacteria, Bacteroides-Prevotella and B. coccoides-Eubacterium rectale groups. Children and the elderly exhibited the highest counts of Firmicutes, when compared to infants and adults (p < 0.001, Table 3). In children, the high amounts of Lactobacillus sp., Bifidobacterium sp. and Atopobium group corresponded to the high values for the Bacteroides-Prevotella group. In the elderly, the predominance of Lactobacillus sp. shared the first position with B. coccoides-E. rectale and C. leptum groups from the Clostridia class.
Statistically significant age-dependent differences in bacterial counts in the intestinal tract were also detected among the ten specific groups and species of bacteria from the phylum Firmicutes. Specifically, the counts of B. coccoides-E. rectale, C. perfringens and C. difficile presented notable differences. The B. coccoides-E. rectale group was highly abundant in the intestinal tract of infants, reaching 9.7 log10 gene copies/g faeces. The counts in adults were similar, but were several hundred times lower in the elderly (p < 0.001, Table 3).
The counts of the C. leptum group did not show statistically significant differences between groups. Exceptionally, the count of F. prausnitzii in the C. leptum group was significantly higher in adults compared to infants, children and the elderly (p < 0.001, p = 0.005, Table 3).
Regarding the intestinal bacteria with lower counts, the highest values for the C. perfringens group were found in infants, while the lowest were observed in the elderly (Table 3). A high prevalence of C. difficile was found in the elderly, compared to adults (10/23, 43.5% vs. 0/25, p = 0.005), while low prevalence was detected similarly in infants and children. The counts of Lactobacillus sp. showed large differences between all age groups. The highest counts were detected in children and the elderly, while significantly lower amounts were observed in adults (both p < 0.001). Although infants harboured fewer lactobacilli compared to children and the elderly (p < 0.001), the counts of other lactic acid bacteria, such as Enterococcus sp. and Streptococcus sp., were higher in infants compared to the other groups (Table 3). Additionally, infants expressed a significantly higher abundance of gram-negative bacteria, such as Veillonella sp. of phylum Firmicutes and Enterobacteriaceae of phylum Proteobacteria, when compared to children, adults and the elderly. However, the count of Desulfovibrio sp. was highest in adults.
For the phylum Actinobacteria, statistically significant differences were found, with high counts of Bifidobacterium sp. and Atopobium group in infants and children, while the lowest counts were observed in adults and the elderly (both p = 0.003; Table 3).
The highest and lowest Bacteroidetes/Firmicutes ratios, with the largest variation, were detected in infants and the elderly, respectively. Significant differences between the groups were also found (p < 0.001, p = 0.006; Figure 1).

3.2. Intestinal Bacterial Diversity in Different Age Groups

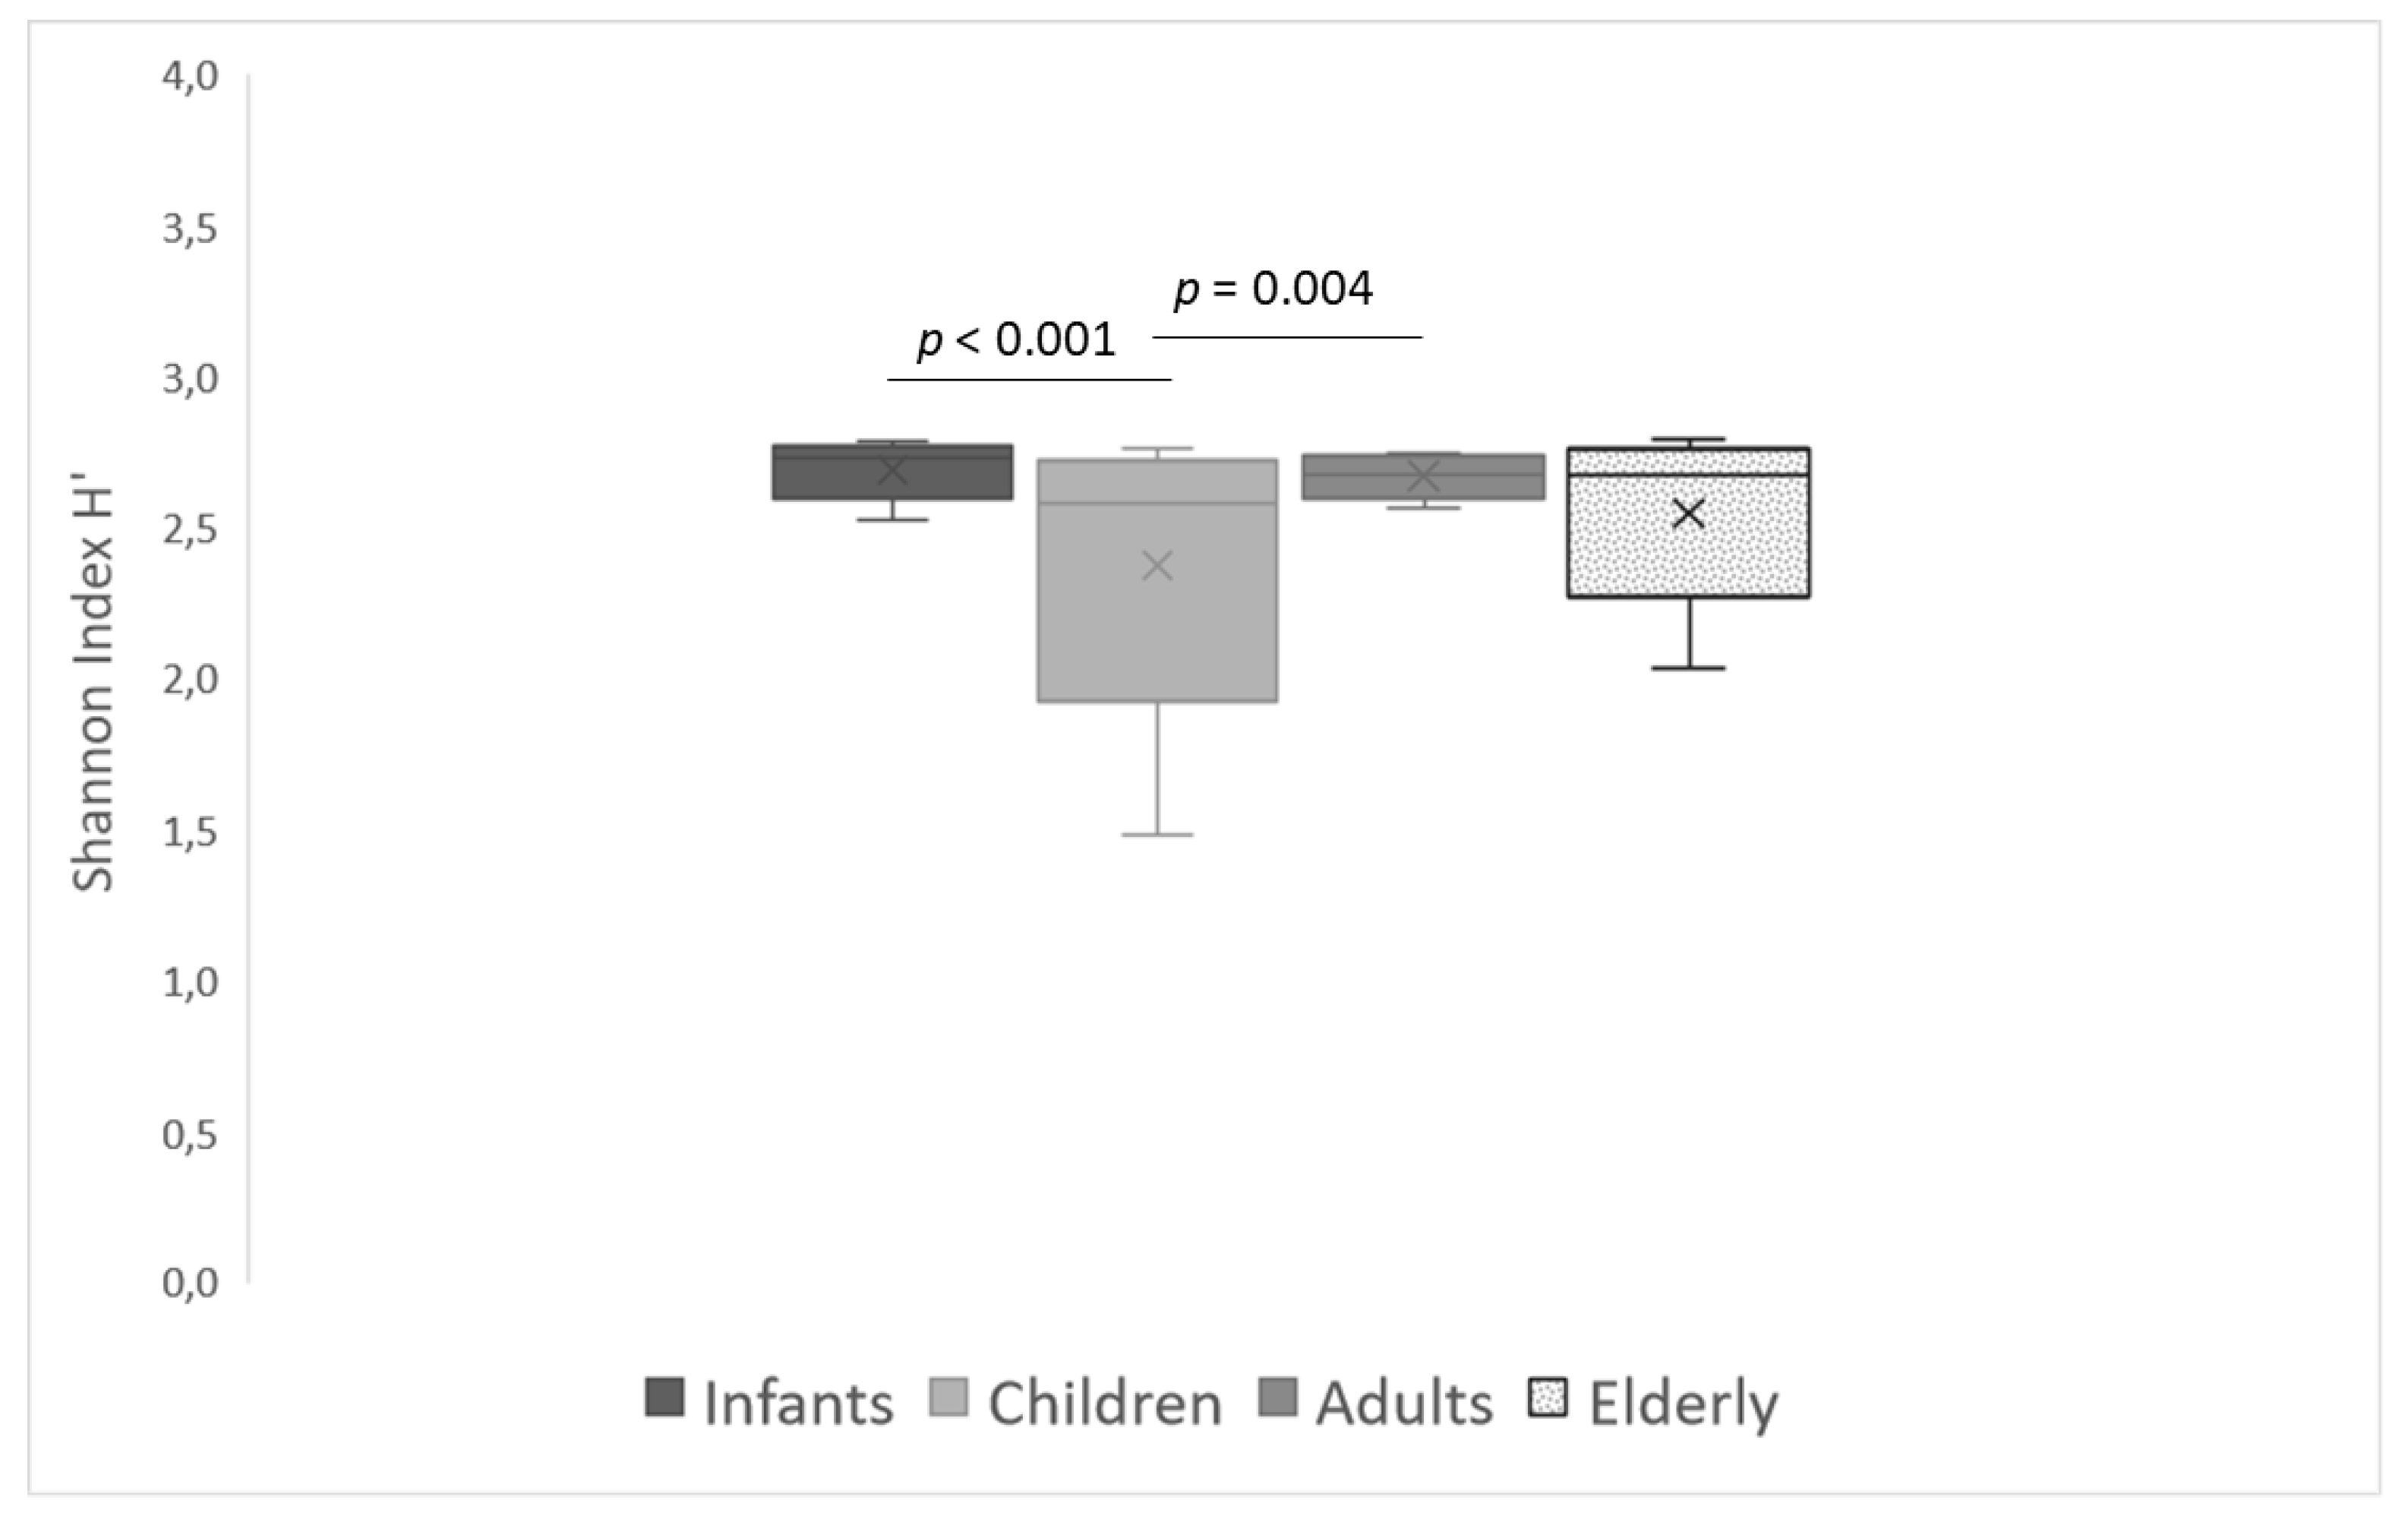
The microbiota of infants had significantly higher diversity and a narrower range, when compared to other groups. The diversity index (Shannon index, H’) was lower in the child group, compared to infants and adults (p < 0.001 and p = 0.004, respectively; Figure 2), whereas the diversity index did not differ between the adult and elderly age groups.
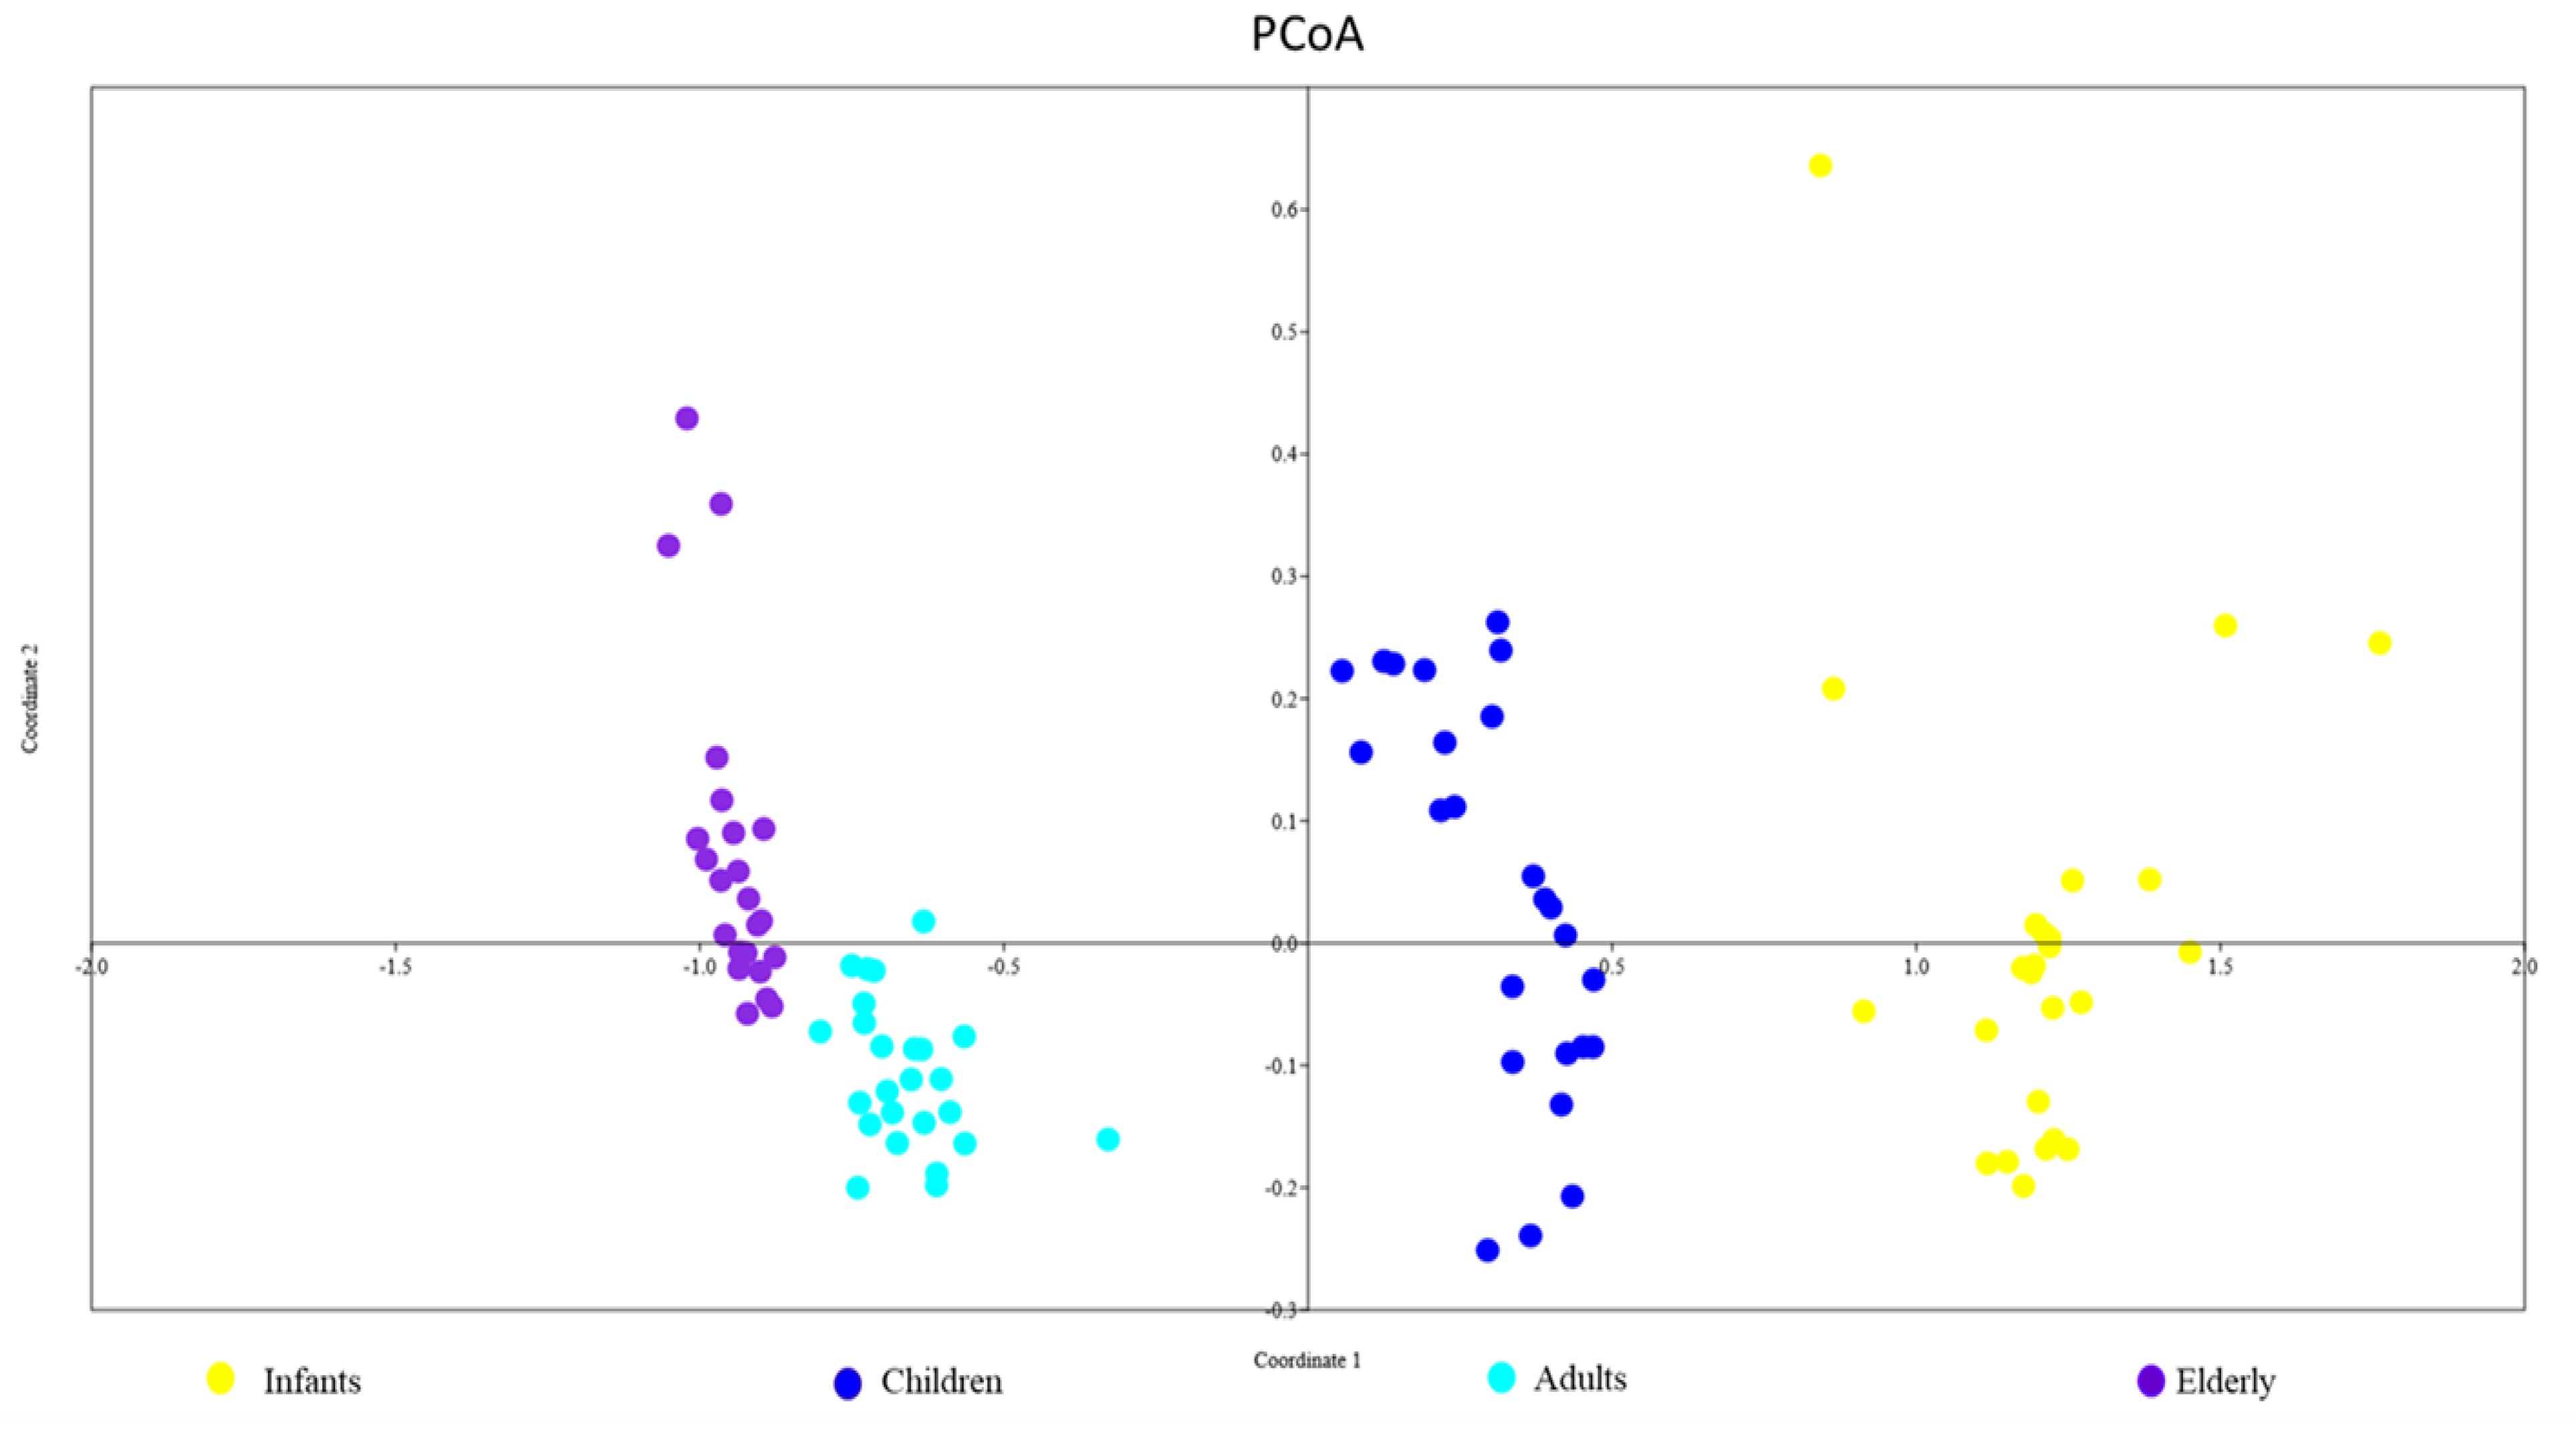
A principal coordinate analysis (PCoA) plot based on the counts of faecal bacteria in different age groups was constructed to assess the relationships between the community structures of the studied samples. The PCoA plot indicated a strong separation between the study groups, with a mostly consistent structure indicating high inter-individual variability, especially in both young-aged groups (Figure 3).

3.3. Correlation Between Age and Counts of Intestinal Bacteria Groups

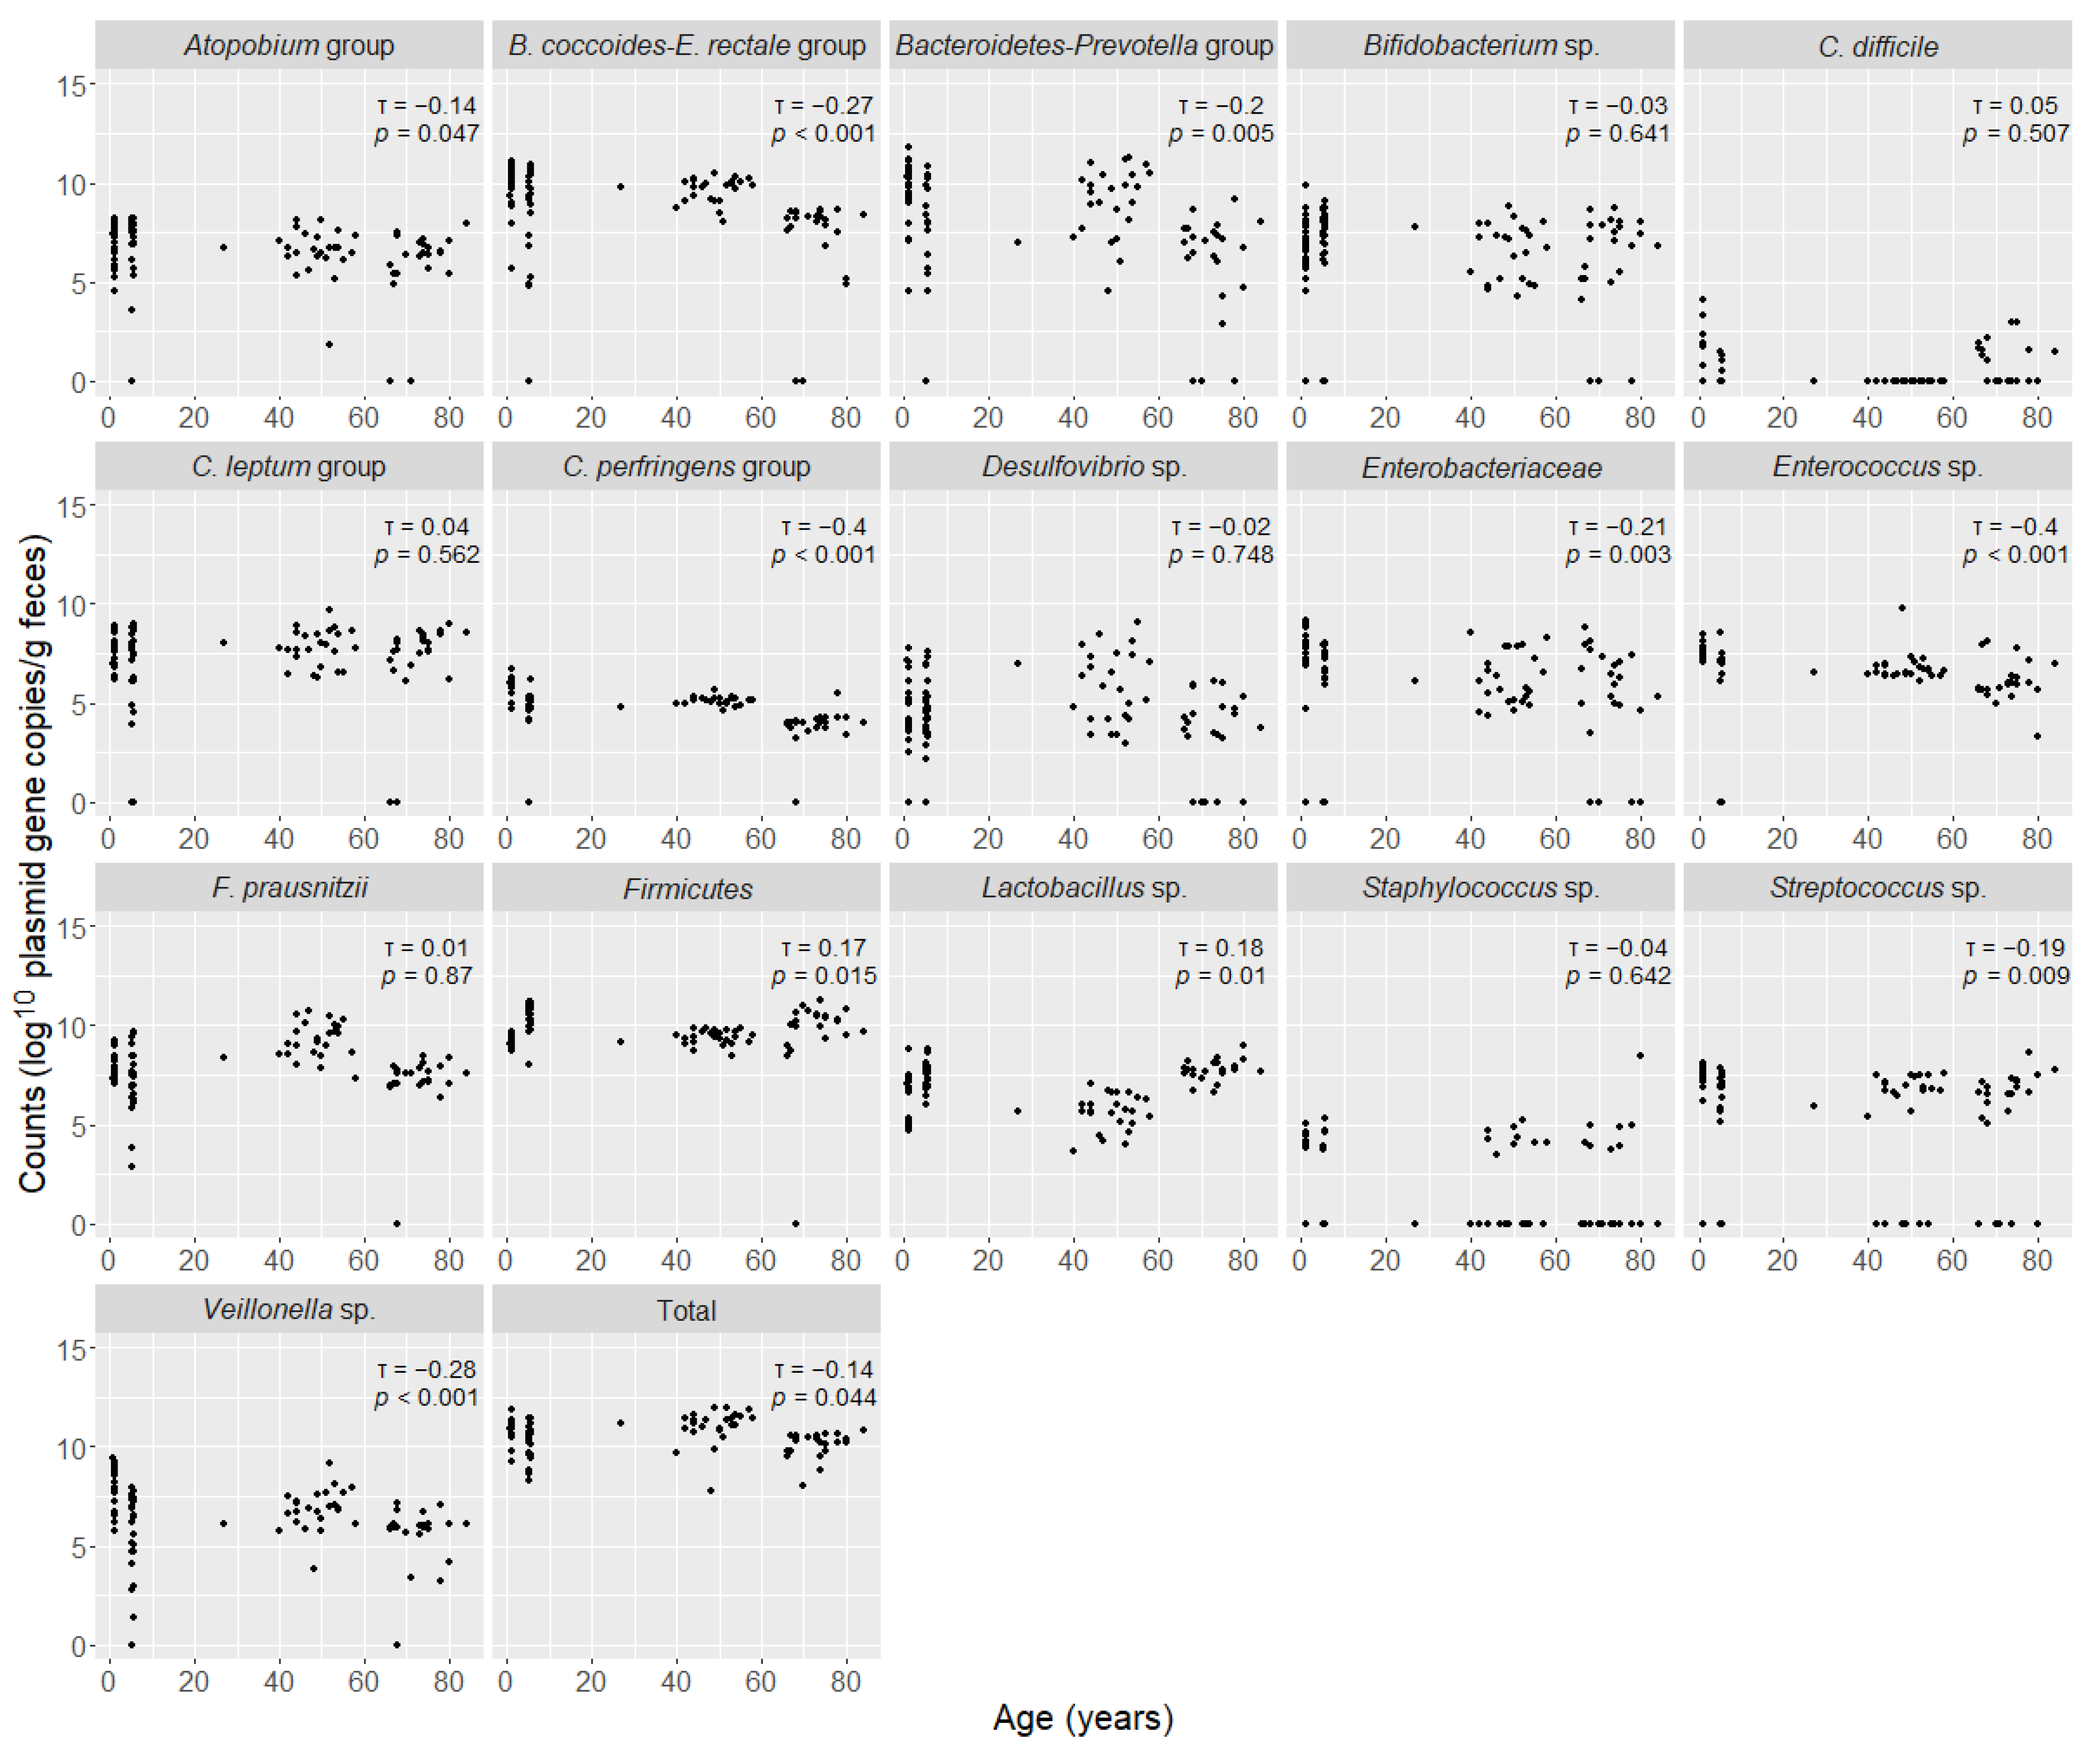
Spearman correlations were calculated based on the distribution of bacterial counts between different age groups. Age was positively correlated with the counts of Firmicutes (p = 0.015) and Lactobacillus sp. (p = 0.01), and negatively correlated with the counts of the B. coccoides-E. rectale group (p < 0.001), Bacteroidetes-Prevotella group (p = 0.005), C. perfringens group (p < 0.001), Veillonella sp. (p < 0.001) and Enterococcus (p < 0.001); see Figure 4.
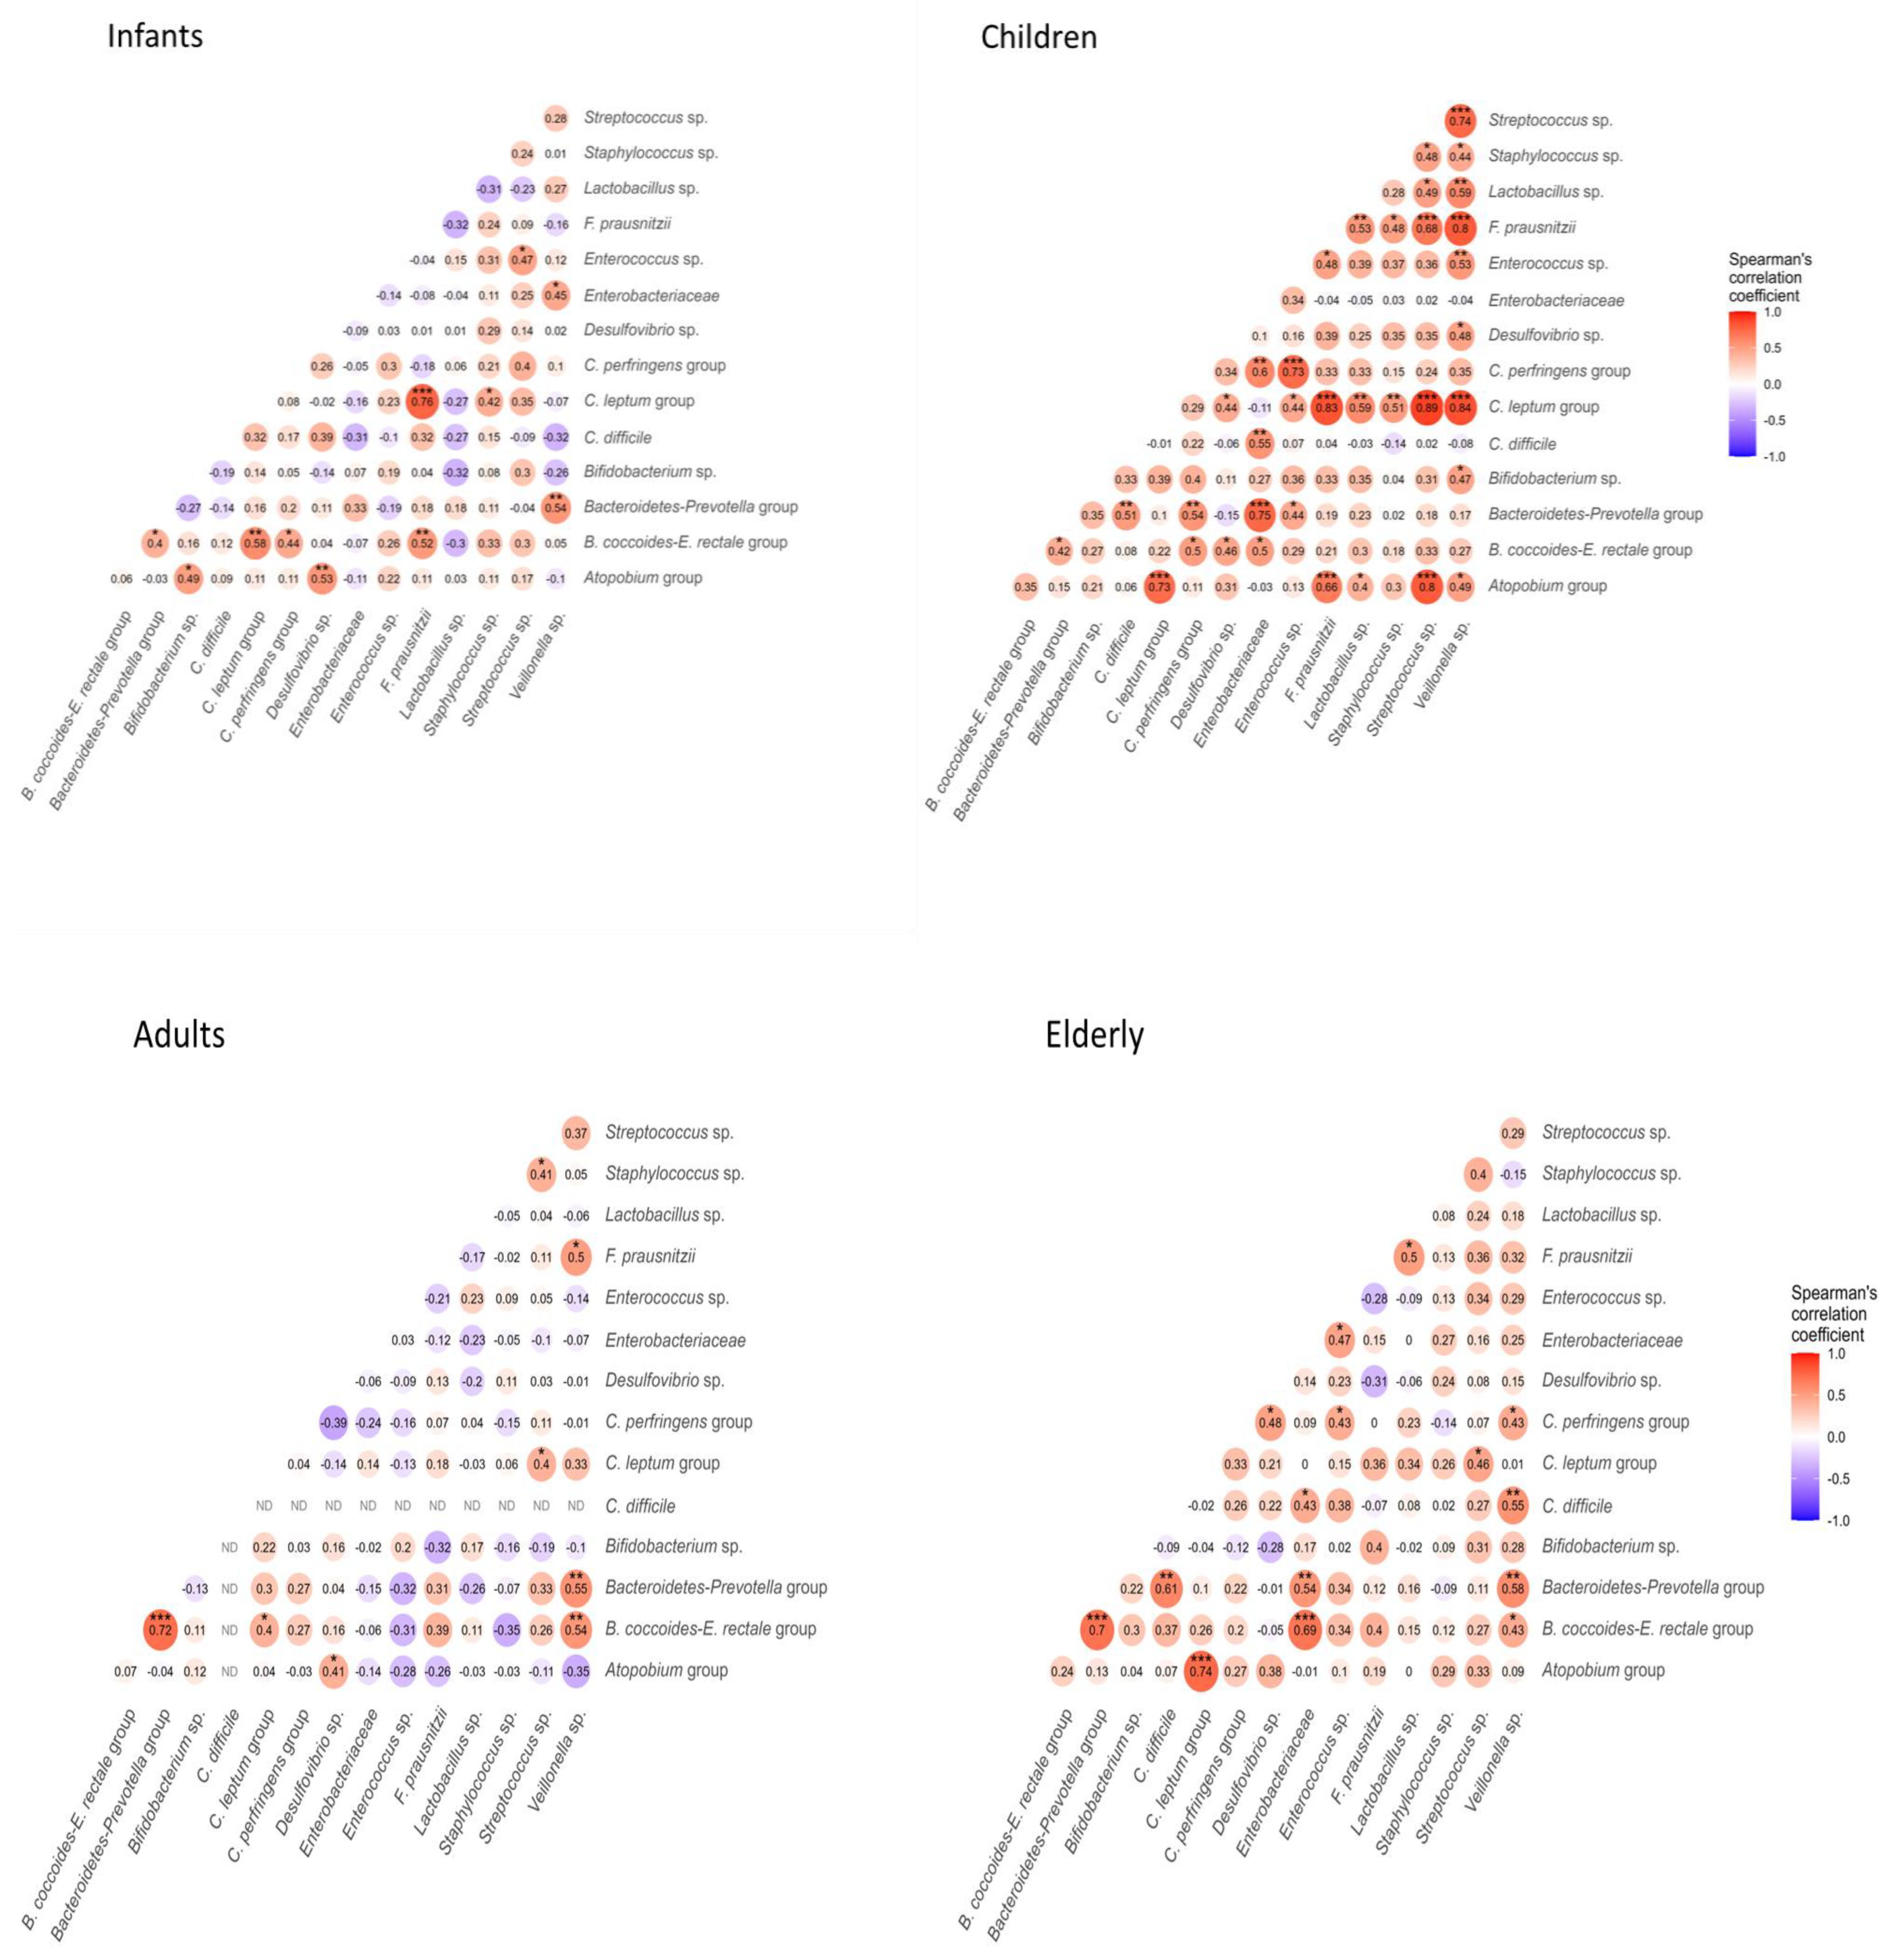
The correlations between bacterial groups within different age groups were also assessed. The tightest positive correlations were found for the Bacteroidetes-Prevotella, B. coccoides-E. rectale, C. leptum (including F. prausnitzii) and Atopobium groups (Figure 5). Among the bacterial groups presented in the samples, 5-year-old children showed the highest number of correlations (Figure 5). A positive correlation between the B. coccoides-E. rectale group and Bacteroidetes-Prevotella group was detected in infants, adults and the elderly (p ≤ 0.01, p ≤ 0.05 and p ≤ 0.001, respectively), as well as with C. leptum (p ≤ 0.01), C. perfringens (p ≤ 0.05) and F. prausnitzii (p ≤ 0.01) groups in infants; Veillonella sp. (p ≤ 0.01) in adults and the elderly; and the Enterobacteriaceae group (p ≤ 0.001) in the elderly (Figure 5).
The counts of the C. leptum group (including F. prausnitzii) positively correlated with Veillonella sp. (p ≤ 0.001) in children, as well as with subordinate bacteria such as Streptococcus sp. (p ≤ 0.001), Lactobacillus sp. (p ≤ 0.01), Staphylococcus sp. (p ≤ 0.01), Desulfovibrio sp. (p ≤ 0.01) and Enterococcus (p ≤ 0.05). A weak correlation for Streptococcus sp. was also detected in adults and the elderly (Figure 5). Increased counts of F. prausnitzii were also associated with higher counts of Lactobacillus in children and the elderly (p ≤ 0.05 and p ≤ 0.01, respectively). Moreover, positive correlations were found for the Atopobium group and C. leptum (including F. prausnitzii) in both children and the elderly (both p ≤ 0.001), as well as for Veillonella sp. (p ≤ 0.05) in children and Desulfovibrio sp. (p ≤ 0.05, p ≤ 0.01) in infants and adults (Figure 5).

4. Discussion

The present study aimed to assess the quantitative composition and diversity of intestinal microbiota across various age groups living in the same geographical region and primarily adhering to a Western-type diet. The life stage-based study examined four life stages (corresponding to 1-, 5-, 48- and 72-years old) to track the evolution of intestinal tract colonization, identifying qualitative and quantitative peaks in the development of the stable adult microbiota and the changes that occur in advanced age. This serves as an important foundation for future microbiota-based studies relating to different health conditions, using the obtained data as valuable criteria.
Our study identified two peak periods for total bacterial counts and the abundance of both Firmicutes and Bacteroidetes phylotypes: at one year of age and in adulthood. In 5-year-old children, the high numbers and extensive list of species colonizing infants decreased, along with a simultaneous decline in diversity. In adults, diversity stabilized, characterized by high total bacterial counts and dominance of the Bacteroides-Prevotella and Blautia coccoides-Eubacterium rectale groups. Although diversity remained stable in the elderly, there was significant variation and a general decrease in bacterial numbers. While some studies have also reported increasing microbiota diversity with age [53,54], they did not emphasize the important fluctuations occurring in early childhood.
The remarkable differences in the diversity of the faecal microbiota between children younger than 3-years-old in comparison with adults have also been previously described [17,53,55]. Similarly, the decrease in microbiota diversity has been demonstrated in healthy 4-year-old children [56]. However, the decrease in diversity from the age of one year has not been specifically highlighted. The reasons for this decrease in diversity in young children are not yet fully understood. Possible explanations may include diet-driven mucus production, the glycosylation pattern of mucin glycoproteins, and the development of intestinal immunity [56,57,58]. That the range of the drop may be bound to the child’s health condition has been shown in our previous culture-dependent studies. In non-allergic 5-year-old children, the high diversity and low prevalence of Clostridium group differentiated them from children with allergies [59,60].
The abundant core groups of adult microbiota, including Bacteroides-Prevotella, B. coccoides-E. rectale and F. prausnitzii, followed the same trend as observed in infants. Two general hypotheses have been proposed for the recruitment of adult-associated anaerobic species in infants: either these species are vertically transmitted early in life and maintained as a low-abundance population until conditions become favourable for their growth, or they are acquired later in life through spores that enable their survival in the environment [14,61]. Previously, it has been shown that 1-year-old weaned infants harbour bacteria characteristic of newborns and 3- to 6-month-old infants in high numbers [62]. It is possible that the highest counts of enterobacteria, enterococci and streptococci in infants are not yet counterbalanced with some new groups that adult individuals are exposed to, such as F. prausnitzii.
The abundance of F. prausnitzii was found to be high in adults. F. prausnitzii is one of the most prevalent bacteria in faecal samples and is a major source of butyrate in the gastrointestinal tract [6,63,64]. This particular marker is frequently observed in studies of the human gut, and has also been described in the context of metabolic dysfunction and inflammation. Adults with poorer overall health tend to harbour fewer Faecalibacterium spp. in their gastrointestinal microbiota [65] during adulthood [66]. It is possible that particular differences in diet between Nordic and Southern countries are responsible for its varying prevalence. The production of butyrate by these bacteria may enhance the growth of Lactobacillus spp. and play a crucial role in colon physiology and metabolism. In contrast, metabolites of lactobacilli, such as lactate, serve as the starting point for many other bacteria to produce butyrate [67].
The composition of the intestinal microbiota in 5-year-old children was quite different from the adult microbiota, with a predominance of a high core of Actinobacteria, including both the Atopobium group and Bifidobacterium spp. Similarly, data on the aforementioned core bacteria and Collinsella sp. from the same phylum in faecal samples from children and adolescents have also been reported [13,68,69]. Bifidobacteria are among the first species to colonize the newborn gut [70,71]; however, we may assume that the drop in counts during weaning is gradually restored by other species of bifidobacteria until stable levels are reached in early childhood [17].
The changes in colonization with Clostridia are important, as these clusters account for over 90% of Firmicute species, which is one of the two main phyla colonizing the human gut [6,72]. We observed decreases in the counts of both the B. coccoides-Eubacterium rectale and C. perfringens groups with aging. Decreased counts of the intestinal B. coccoides-E. rectale group in the elderly have been previously demonstrated in Japanese, Italian and Finnish studies [23,73,74]. This feature was correlated with age-related frailty, hospitalization, antibiotic treatment and non-steroidal anti-inflammatory therapy [21,75]. It has previously been observed that healthy people carry fewer than 105 C. perfringens cfu/g faeces, while patients may carry 106 or more cfu/g [76]. Our data demonstrated the highest counts of the C. perfringens group in healthy infants at 6.0 (log10 gene copies).
Tight correlations between the Clostridia and Bacteroides-Prevotella groups were present in our children, adult and elderly patients. This fact supports the stable establishment of the B. coccoides-E. rectale group from the Clostridia class in the intestines at an early age.
Changes in dietary habits with aging are considered one of the main factors contributing to the diversity of the human gut microbiota [77]. Although we did not study the dietary habits of our participants, data from the National Institute of Health Development have shown that, from adolescence, the Western-type diet prevails in Estonia [44]. Positive correlations with the C. leptum group, C. perfringens in infants, Veillonella sp. in adults and Enterobacteriaceae in the elderly were also demonstrated. Previously, several positive correlations between the B. coccoides-E. rectale and C. leptum groups in different age groups have been reported [78,79]. These differences in correlation between age groups may be explained by dietary variations. We may assume that the diet of children contains more carbohydrates (non-starch polysaccharides and sweets), which promotes increased counts of the B. coccoides-Eubacterium rectale group [80,81], while the Western-type diet of adults and the elderly is associated with the Bacteroidetes phylum [82].
Remarkably, the increased count of the C. leptum group was positively correlated with non-core bacteria, such as Lactobacillus sp., Staphylococcus sp. and Streptococcus sp., in children, and negatively correlated with Enterobacteriaceae in the elderly. The presence of butyrate, produced by C. leptum and F. prausnitzii, may promote the growth of Lactobacillus sp. [83,84]. This is in full agreement with our results, and may play a crucial role in the colon’s physiology and metabolism [85]. Increased butyrate levels have been associated with decreased counts of Enterobacteriaceae, which might prevent inflammatory conditions due to decreased lipopolysaccharide or endotoxin production [86].
The increase in Firmicutes observed in this study was associated with Lactobacillus sp. Changes in Lactobacillus sp. counts were found across all study groups, with the highest counts in the elderly. This finding aligns with previous data describing an increase in the prevalence and abundance of Lactobacillus sp. with ageing [41,87]. Lactobacillus sp. contributes to digestion, immune stimulation, and influences nutrition, metabolism and energy uptake in the host [85,88,89].
Remarkably, positive correlations between the Atopobium group and Veillonella spp. counts in children and Desulfovibrio sp. in adults were detected. This appears to be the first study in which quantitative changes of the Atopobium group across different ages have been observed. The Atopobium group is an important member of the faecal microbiota of healthy humans (around 8% of the microbiota) [90], affecting host physiology. A metagenomic study of faecal samples from Chinese diabetic patients conducted by Qin et al. identified Eggerthella lenta of the Atopobium group as one of the molecular species linked to the occurrence of type-2 diabetes [91,92]. Phenotypic characterization of Atopobium group strains isolated from human faecal samples has revealed great diversity in their metabolic capabilities [93,94]. We suggest that the increased counts of both Veillonella sp. and Desulfovibrio sp. may be associated with increased carbohydrate metabolism, stepwise producing lactate by Atopobium group members, propionate by Veillonella sp. and acetate by Desulfovibrio sp. Under reduced pH conditions, lactate can also accumulate, which may occur during dysbiosis [95,96]. Detection of low counts of Desulfovibrio species is characteristic of a healthy host state, which is of particular interest due to their potential link with inflammatory bowel diseases [97].
Our study has some limitations. First, the number of faecal samples from volunteers in each age group was limited and was collected over time periods ranging from 1995 to 2011. As a result, this sample may not fully reflect the microbiota’s trends throughout the stages of life across the Estonian population. Further research is needed to assess the impacts of dietary and environmental factors on the gut microbiota during period of increased prosperity of time in Estonia and its role in the development of lifestyle-related diseases. Additionally, the analytical method we used (qPCR) provides information only on specific bacterial groups and species. A combination of multiple methods, such as qPCR and ‘omics’ approaches, would allow for a more comprehensive study of the interactions and dynamics of the human intestinal microbiota during aging.

5. Conclusions

Our study demonstrated that the quantitative composition and diversity of intestinal microbiota evolves through the stages of life, presenting two changing maximal peaks for the predominant groups as well as a decrease in bacterial diversity, decreasing from a high level in infants to children, reaching unitary stabilization in adults and presenting a wide individual range in the elderly. The early presence of some dominant bacterial groups, such as Bacteroides-Prevotella and Blautia coccoides-Eubacterium rectale, is thought to influence the presence of bacteria in phyla Firmicutes/Clostridia in adults, as well as Proteobacteria/Enterobacteriaceae in the elderly. The high proportion of butyrate-producing bacteria from the C. leptum group (particularly F. prausnitzii) may enable the useful colonization of the intestines with Actinobacteria/Atopobium and Firmicutes/Lactobacilli groups in children and the elderly. Recognition of the age-specific differences in the gut microbiota may help to discriminate between the possible characteristics of dysbacteriosis of the microbiota in individuals with different health disorders, facilitating the search for evidence-based substitutional therapies.

Author Contributions

J.Š. and E.S. were responsible for study design, performing the study, data analysis and manuscript drafting; N.Š., M.R. and H.S. were responsible for performing the study and data analysis; T.V. was involved in clinical evaluation and the collection of samples; M.M. and R.M. were responsible for coordination and drafting of the manuscript. All authors contributed to the interpretation of data and in writing and approval of the final manuscript. All authors have read and agreed to the published version of the manuscript.

Funding

This study was financially supported by the European Union through the European Regional Development Fund (SFOS reg. No. 3.2.0701.11-0023), the Estonian Ministry of Education and Research (target No. SF0180132s08 and financing of scientific collections No. KOGU-HUMB) and Estonian Research Council (grant No. IUT34-19 and No. TEM-TA28).

Institutional Review Board Statement

The present study was conducted according to the guidelines laid down in the Declaration of Helsinki. The experimental design applied to these cohorts was approved by the Ethics Committee of the Medical Faculty of the University of Tartu with approvals: no. 43/1-1997, no. 42/5-1996, no. 210/T-3, 19.11.2011 and no. 139/16 20.06.2005.

Informed Consent Statement

Informed consent was obtained from all subjects involved in the study.

Data Availability Statement

The datasets used and analysed during current study available from the corresponding author on reasonable request.

Acknowledgments

We thank Irja Roots, Tiiu Rööp and Sandra Sokman for technical assistance.

Conflicts of Interest

The authors report no conflict of interest regarding the publication of this paper.

References

  1. Lozupone, C.A.; Stombaugh, J.I.; Gordon, J.I.; Jansson, J.K.; Knight, R. Diversity, stability and resilience of the human gut microbiota. Nature 2012, 489, 220–230. [Google Scholar] [CrossRef] [PubMed]
  2. Sekirov, I.; Russell, S.L.; Antunes, L.C.; Finlay, B.B. Gut microbiota in health and disease. Physiol. Rev. 2010, 90, 859–904. [Google Scholar] [CrossRef] [PubMed]
  3. Ladirat, S.E.; Schols, H.A.; Nauta, A.; Schoterman, M.H.; Keijser, B.J.; Montijn, R.C.; Gruppen, H.; Schuren, F.H. High-throughput analysis of the impact of antibiotics on the human intestinal microbiota composition. J. Microbiol. Methods 2013, 92, 387–397. [Google Scholar] [CrossRef]
  4. Nylund, L.; Satokari, R.; Salminen, S.; de Vos, W.M. Intestinal microbiota during early life—Impact on health and disease. Proc. Nutr. Soc. 2014, 73, 457–469. [Google Scholar] [CrossRef]
  5. Hasan, N.; Yang, H. Factors affecting the composition of the gut microbiota, and its modulation. PeerJ 2019, 7, e7502. [Google Scholar] [CrossRef] [PubMed]
  6. Eckburg, P.B.; Bik, E.M.; Bernstein, C.N.; Purdom, E.; Dethlefsen, L.; Sargent, M.; Gill, S.R.; Nelson, K.E.; Relman, D.A. Diversity of the human intestinal microbial flora. Science 2005, 308, 1635–1638. [Google Scholar] [CrossRef]
  7. Frank, D.N.; Pace, N.R. Gastrointestinal microbiology enters the metagenomics era. Curr. Opin. Gastroenterol. 2008, 24, 4–10. [Google Scholar] [CrossRef]
  8. Almeida, A.; Mitchell, A.L.; Boland, M.; Forster, S.C.; Gloor, G.B.; Tarkowska, A.; Lawley, T.D.; Finn, R.D. A new genomic blueprint of the human gut microbiota. Nature 2019, 568, 499–504. [Google Scholar] [CrossRef]
  9. Ohkusa, T.; Nishikawa, Y.; Sato, N. Gastrointestinal disorders and intestinal bacteria: Advances in research and applications in therapy. Front. Med. 2023, 7, 935676. [Google Scholar] [CrossRef]
  10. Moore, R.E.; Townsend, S.D. Temporal development of the infant gut microbiome. Open Biol. 2019, 9, 190128. [Google Scholar] [CrossRef]
  11. Guo, M.; Miao, M.; Wang, Y.; Duan, M.; Yang, F.; Chen, Y.; Yuan, W.; Zheng, H. Developmental differences in the intestinal microbiota of Chinese 1-year-old infants and 4-year-old children. Sci. Rep. 2020, 10, 19470. [Google Scholar] [CrossRef] [PubMed]
  12. Ottman, N.; Smidt, H.; de Vos, W.M.; Belzer, C. The function of our microbiota: Who is out there and what do they do? Front. Cell. Infect. Microbiol. 2012, 2, 104. [Google Scholar] [CrossRef]
  13. Odamaki, T.; Kato, K.; Sugahara, H.; Hashikura, N.; Takahashi, S.; Xiao, J.Z.; Abe, F.; Osawa, R. Age-related changes in gut microbiota composition from newborn to centenarian: A cross-sectional study. BMC Microbiol. 2016, 16, 90. [Google Scholar] [CrossRef] [PubMed]
  14. Avershina, E.; Storro, O.; Oien, T.; Johnsen, R.; Pope, P.; Rudi, K. Major faecal microbiota shifts in composition and diversity with age in a geographically restricted cohort of mothers and their children. FEMS Microbiol. Ecol. 2014, 87, 280–290. [Google Scholar] [CrossRef]
  15. Bergstrom, A.; Skov, T.H.; Bahl, M.I.; Roager, H.M.; Christensen, L.B.; Ejlerskov, K.T.; Molgaard, C.; Michaelsen, K.F.; Licht, T.R. Establishment of intestinal microbiota during early life: A longitudinal, explorative study of a large cohort of Danish infants. Appl. Environ. Microbiol. 2014, 80, 2889–2900. [Google Scholar] [CrossRef]
  16. Cheng, J.; Ringel-Kulka, T.; Heikamp-de Jong, I.; Ringel, Y.; Carroll, I.; de Vos, W.M.; Salojarvi, J.; Satokari, R. Discordant temporal development of bacterial phyla and the emergence of core in the fecal microbiota of young children. ISME J. 2016, 10, 1002–1014. [Google Scholar] [CrossRef] [PubMed]
  17. Derrien, M.; Alvarez, A.S.; de Vos, W.M. The Gut Microbiota in the First Decade of Life. Trends Microbiol. 2019, 27, 997–1010. [Google Scholar] [CrossRef]
  18. Kau, A.L.; Ahern, P.P.; Griffin, N.W.; Goodman, A.L.; Gordon, J.I. Human nutrition, the gut microbiome and the immune system. Nature 2011, 474, 327–336. [Google Scholar] [CrossRef]
  19. Lynch, D.B.; Jeffery, I.B.; Cusack, S.; O’Connor, E.M.; O’Toole, P.W. Diet-microbiota-health interactions in older subjects: Implications for healthy aging. Interdiscip. Top. Gerontol. 2015, 40, 141–154. [Google Scholar] [CrossRef]
  20. Rampelli, S.; Candela, M.; Turroni, S.; Biagi, E.; Collino, S.; Franceschi, C.; O’Toole, P.W.; Brigidi, P. Functional metagenomic profiling of intestinal microbiome in extreme ageing. Aging 2013, 5, 902–912. [Google Scholar] [CrossRef]
  21. Bartosch, S.; Fite, A.; Macfarlane, G.T.; McMurdo, M.E. Characterization of bacterial communities in feces from healthy elderly volunteers and hospitalized elderly patients by using real-time PCR and effects of antibiotic treatment on the fecal microbiota. Appl. Environ. Microbiol. 2004, 70, 3575–3581. [Google Scholar] [CrossRef] [PubMed]
  22. Brussow, H. Bacteriophage-host interaction: From splendid isolation into a messy reality. Curr. Opin. Microbiol. 2013, 16, 500–506. [Google Scholar] [CrossRef] [PubMed]
  23. Mueller, S.; Saunier, K.; Hanisch, C.; Norin, E.; Alm, L.; Midtvedt, T.; Cresci, A.; Silvi, S.; Orpianesi, C.; Verdenelli, M.C.; et al. Differences in fecal microbiota in different European study populations in relation to age, gender, and country: A cross-sectional study. Appl. Environ. Microbiol. 2006, 72, 1027–1033. [Google Scholar] [CrossRef]
  24. Woodmansey, E.J. Intestinal bacteria and ageing. J. Appl. Microbiol. 2007, 102, 1178–1186. [Google Scholar] [CrossRef]
  25. Malinen, E.; Rinttila, T.; Kajander, K.; Matto, J.; Kassinen, A.; Krogius, L.; Saarela, M.; Korpela, R.; Palva, A. Analysis of the fecal microbiota of irritable bowel syndrome patients and healthy controls with real-time PCR. Am. J. Gastroenterol. 2005, 100, 373–382. [Google Scholar] [CrossRef]
  26. Nagpal, R.; Kumar, M.; Yadav, A.K.; Hemalatha, R.; Yadav, H.; Marotta, F.; Yamashiro, Y. Gut microbiota in health and disease: An overview focused on metabolic inflammation. Benef. Microbes 2016, 7, 181–194. [Google Scholar] [CrossRef]
  27. Payne, A.N.; Chassard, C.; Zimmermann, M.; Muller, P.; Stinca, S.; Lacroix, C. The metabolic activity of gut microbiota in obese children is increased compared with normal-weight children and exhibits more exhaustive substrate utilization. Nutr. Diabetes 2011, 1, e12. [Google Scholar] [CrossRef]
  28. Sokol, H.; Seksik, P.; Furet, J.P.; Firmesse, O.; Nion-Larmurier, I.; Beaugerie, L.; Cosnes, J.; Corthier, G.; Marteau, P.; Dore, J. Low counts of Faecalibacterium prausnitzii in colitis microbiota. Inflamm. Bowel Dis. 2009, 15, 1183–1189. [Google Scholar] [CrossRef] [PubMed]
  29. Yamashiro, K.; Tanaka, R.; Urabe, T.; Ueno, Y.; Yamashiro, Y.; Nomoto, K.; Takahashi, T.; Tsuji, H.; Asahara, T.; Hattori, N. Gut dysbiosis is associated with metabolism and systemic inflammation in patients with ischemic stroke. PLoS ONE 2017, 12, e0171521. [Google Scholar] [CrossRef]
  30. Salonen, A.; Salojarvi, J.; Lahti, L.; de Vos, W.M. The adult intestinal core microbiota is determined by analysis depth and health status. Clin. Microbiol. Infect. 2012, 18 (Suppl. 4), 16–20. [Google Scholar] [CrossRef]
  31. Jalanka-Tuovinen, J.; Salonen, A.; Nikkila, J.; Immonen, O.; Kekkonen, R.; Lahti, L.; Palva, A.; de Vos, W.M. Intestinal microbiota in healthy adults: Temporal analysis reveals individual and common core and relation to intestinal symptoms. PLoS ONE 2011, 6, e23035. [Google Scholar] [CrossRef] [PubMed]
  32. Matsuki, T.; Watanabe, K.; Fujimoto, J.; Takada, T.; Tanaka, R. Use of 16S rRNA gene-targeted group-specific primers for real-time PCR analysis of predominant bacteria in human feces. Appl. Environ. Microbiol. 2004, 70, 7220–7228. [Google Scholar] [CrossRef] [PubMed]
  33. Ott, S.J.; Musfeldt, M.; Ullmann, U.; Hampe, J.; Schreiber, S. Quantification of intestinal bacterial populations by real-time PCR with a universal primer set and minor groove binder probes: A global approach to the enteric flora. J. Clin. Microbiol. 2004, 42, 2566–2572. [Google Scholar] [CrossRef]
  34. Jian, C.; Luukkonen, P.; Yki-Jarvinen, H.; Salonen, A.; Korpela, K. Quantitative PCR provides a simple and accessible method for quantitative microbiota profiling. PLoS ONE 2020, 15, e0227285. [Google Scholar] [CrossRef] [PubMed]
  35. Jeong, J.; Mun, S.; Oh, Y.; Cho, C.; Yun, K.; Ahn, Y.; Chung, W.; Lim, M.; Lee, K.; Hwang, T.; et al. A qRT-PCR Method Capable of Quantifying Specific Microorganisms Compared to NGS-Based Metagenome Profiling Data. Microorganisms 2022, 10, 324. [Google Scholar] [CrossRef]
  36. UN. World Population Prospects 2019: Highlights; UN: New York, NY, USA, 2019. [Google Scholar]
  37. WHO. World Health Statistics 2020: Monitoring Health for the SDGs; WHO: Geneva, Switzerland, 2020. [Google Scholar]
  38. Voor, T.; Julge, K.; Bottcher, M.F.; Jenmalm, M.C.; Duchen, K.; Bjorksten, B. Atopic sensitization and atopic dermatitis in Estonian and Swedish infants. Clin. Exp. Allergy 2005, 35, 153–159. [Google Scholar] [CrossRef]
  39. Mikelsaar, M.; Songisepp, E.; Rätsep, M.; Vallas, M.; Hütt, P.; Smidt, I.; Truusalu, K.; Sepp, E.; Mikelsaar, R.-H.; Kilk, K.; et al. Lactobacillus plantarum INDUCIA® Strain DSM 21379 as Hypocholesterolemic Agent And antimicrobial Agent Against Clostridium. Difficile. Patent Application PCT/EE2014/00007, 31 October 2014. [Google Scholar]
  40. Mikelsaar, M.; Sepp, E.; Štšepetova, J.; Hütt, P.; Zilmer, K.; Kullisaar, K.; Zilmer, M. Regulation of plasma lipid profile by Lactobacillus fermentum (probiotic strain ME-3 DSM14241) in a randomised controlled trial of clinically healthy adults. BMC Nutrition 2015, 1, 27. [Google Scholar] [CrossRef]
  41. Mikelsaar, M.; Stsepetova, J.; Hutt, P.; Kolk, H.; Sepp, E.; Loivukene, K.; Zilmer, K.; Zilmer, M. Intestinal Lactobacillus sp. is associated with some cellular and metabolic characteristics of blood in elderly people. Anaerobe 2010, 16, 240–246. [Google Scholar] [CrossRef]
  42. Statovci, D.; Aguilera, M.; MacSharry, J.; Melgar, S. The Impact of Western Diet and Nutrients on the Microbiota and Immune Response at Mucosal Interfaces. Front. Immunol. 2017, 8, 838. [Google Scholar] [CrossRef]
  43. WHO. Nutrition and Lifestyle in the Baltic Republics (EUR/ICP/LVNG 020304 E67884); WHO: Geneva, Switzerland, 1999. [Google Scholar]
  44. Estonian Food Infoserver. 2025. Available online: https://www.eestitoit.ee/en (accessed on 12 December 2024).
  45. Yang, S.; Lin, S.; Kelen, G.D.; Quinn, T.C.; Dick, J.D.; Gaydos, C.A.; Rothman, R.E. Quantitative multiprobe PCR assay for simultaneous detection and identification to species level of bacterial pathogens. J. Clin. Microbiol. 2002, 40, 3449–3454. [Google Scholar] [CrossRef]
  46. Guo, X.; Xia, X.; Tang, R.; Zhou, J.; Zhao, H.; Wang, K. Development of a real-time PCR method for Firmicutes and Bacteroidetes in faeces and its application to quantify intestinal population of obese and lean pigs. Lett. Appl. Microbiol. 2008, 47, 367–373. [Google Scholar] [CrossRef]
  47. van den Berg, R.J.; Vaessen, N.; Endtz, H.P.; Schulin, T.; van der Vorm, E.R.; Kuijper, E.J. Evaluation of real-time PCR and conventional diagnostic methods for the detection of Clostridium difficile-associated diarrhoea in a prospective multicentre study. J. Med. Microbiol. 2007, 56, 36–42. [Google Scholar] [CrossRef] [PubMed]
  48. Haarman, M.; Knol, J. Quantitative real-time PCR assays to identify and quantify fecal Bifidobacterium species in infants receiving a prebiotic infant formula. Appl. Environ. Microbiol. 2005, 71, 2318–2324. [Google Scholar] [CrossRef] [PubMed]
  49. Collado, M.C.; Delgado, S.; Maldonado, A.; Rodriguez, J.M. Assessment of the bacterial diversity of breast milk of healthy women by quantitative real-time PCR. Lett. Appl. Microbiol. 2009, 48, 523–528. [Google Scholar] [CrossRef]
  50. Haarman, M.; Knol, J. Quantitative real-time PCR analysis of fecal Lactobacillus species in infants receiving a prebiotic infant formula. Appl. Environ. Microbiol. 2006, 72, 2359–2365. [Google Scholar] [CrossRef]
  51. Rinttila, T.; Kassinen, A.; Malinen, E.; Krogius, L.; Palva, A. Development of an extensive set of 16S rDNA-targeted primers for quantification of pathogenic and indigenous bacteria in faecal samples by real-time PCR. J. Appl. Microbiol. 2004, 97, 1166–1177. [Google Scholar] [CrossRef] [PubMed]
  52. Fite, A.; Macfarlane, G.T.; Cummings, J.H.; Hopkins, M.J.; Kong, S.C.; Furrie, E.; Macfarlane, S. Identification and quantitation of mucosal and faecal desulfovibrios using real time polymerase chain reaction. Gut 2004, 53, 523–529. [Google Scholar] [CrossRef]
  53. Yatsunenko, T.; Rey, F.E.; Manary, M.J.; Trehan, I.; Dominguez-Bello, M.G.; Contreras, M.; Magris, M.; Hidalgo, G.; Baldassano, R.N.; Anokhin, A.P.; et al. Human gut microbiome viewed across age and geography. Nature 2012, 486, 222–227. [Google Scholar] [CrossRef]
  54. Tuikhar, N.; Keisam, S.; Labala, R.K.; Ramakrishnan, P.; Arunkuma, M.C.; Ahmed, G.; Biagi, E.; Jeyaram, K. Comparative analysis of the gut microbiota in centenarians and young adults shows a common signature across genotypically non-related populations. Mech. Ageing Dev. 2019, 179, 23–35. [Google Scholar] [CrossRef]
  55. Koenig, J.E.; Spor, A.; Scalfone, N.; Fricker, A.D.; Stombaugh, J.; Knight, R.; Angenent, L.T.; Ley, R.E. Succession of microbial consortia in the developing infant gut microbiome. Proc. Natl. Acad. Sci. USA 2011, 108 (Suppl. 1), 4578–4585. [Google Scholar] [CrossRef]
  56. Ringel-Kulka, T.; Cheng, J.; Ringel, Y.; Salojarvi, J.; Carroll, I.; Palva, A.; de Vos, W.M.; Satokari, R. Intestinal microbiota in healthy U.S. young children and adults—A high throughput microarray analysis. PLoS ONE 2013, 8, e64315. [Google Scholar] [CrossRef]
  57. Gaboriau-Routhiau, V.; Lecuyer, E.; Cerf-Bensussan, N. Role of microbiota in postnatal maturation of intestinal T-cell responses. Curr. Opin. Gastroenterol. 2011, 27, 502–508. [Google Scholar] [CrossRef] [PubMed]
  58. Muncan, V.; Heijmans, J.; Krasinski, S.D.; Buller, N.V.; Wildenberg, M.E.; Meisner, S.; Radonjic, M.; Stapleton, K.A.; Lamers, W.H.; Biemond, I.; et al. Blimp1 regulates the transition of neonatal to adult intestinal epithelium. Nat. Commun. 2011, 2, 452. [Google Scholar] [CrossRef] [PubMed]
  59. Sepp, E.; Julge, K.; Mikelsaar, M.; Bjorksten, B. Intestinal microbiota and immunoglobulin E responses in 5-year-old Estonian children. Clin. Exp. Allergy 2005, 35, 1141–1146. [Google Scholar] [CrossRef]
  60. Stsepetova, J.; Sepp, E.; Julge, K.; Vaughan, E.; Mikelsaar, M.; de Vos, W.M. Molecularly assessed shifts of Bifidobacterium ssp. and less diverse microbial communities are characteristic of 5-year-old allergic children. FEMS Immunol. Med. Microbiol. 2007, 51, 260–269. [Google Scholar]
  61. Atarashi, K.; Tanoue, T.; Oshima, K.; Suda, W.; Nagano, Y.; Nishikawa, H.; Fukuda, S.; Saito, T.; Narushima, S.; Hase, K.; et al. Treg induction by a rationally selected mixture of Clostridia strains from the human microbiota. Nature 2013, 500, 232–236. [Google Scholar] [CrossRef] [PubMed]
  62. Sepp, E.; Naaber, P.; Voor, T.; Mikelsaar, M.; Björksten, B. Development of intestinal micro-flora during the first month of life in Estonian and Swedish infants. Microb. Ecol. Health Dis. 2000, 12, 22–26. [Google Scholar]
  63. Hold, G.L.; Pryde, S.E.; Russell, V.J.; Furrie, E.; Flint, H.J. Assessment of microbial diversity in human colonic samples by 16S rDNA sequence analysis. FEMS Microbiol. Ecol. 2002, 39, 33–39. [Google Scholar] [CrossRef]
  64. Louis, P.; Duncan, S.H.; McCrae, S.I.; Millar, J.; Jackson, M.S.; Flint, H.J. Restricted distribution of the butyrate kinase pathway among butyrate-producing bacteria from the human colon. J. Bacteriol. 2004, 186, 2099–2106. [Google Scholar] [CrossRef]
  65. Lopez-Siles, M.; Duncan, S.H.; Garcia-Gil, L.J.; Martinez-Medina, M. Faecalibacterium prausnitzii: From microbiology to diagnostics and prognostics. ISME J. 2017, 11, 841–852. [Google Scholar] [CrossRef]
  66. Miquel, S.; Martin, R.; Rossi, O.; Bermudez-Humaran, L.G.; Chatel, J.M.; Sokol, H.; Thomas, M.; Wells, J.M.; Langella, P. Faecalibacterium prausnitzii and human intestinal health. Curr. Opin. Microbiol. 2013, 16, 255–261. [Google Scholar] [CrossRef] [PubMed]
  67. Devaux, C.A.; Million, M.; Raoult, D. The Butyrogenic and Lactic Bacteria of the Gut Microbiota Determine the Outcome of Allogenic Hematopoietic Cell Transplant. Front. Microbiol. 2020, 11, 1642. [Google Scholar] [CrossRef] [PubMed]
  68. Agans, R.; Rigsbee, L.; Kenche, H.; Michail, S.; Khamis, H.J.; Paliy, O. Distal gut microbiota of adolescent children is different from that of adults. FEMS Microbiol. Ecol. 2011, 77, 404–412. [Google Scholar] [CrossRef] [PubMed]
  69. de Meij, T.G.; Budding, A.E.; de Groot, E.F.; Jansen, F.M.; Frank Kneepkens, C.M.; Benninga, M.A.; Penders, J.; van Bodegraven, A.A.; Savelkoul, P.H. Composition and stability of intestinal microbiota of healthy children within a Dutch population. FASEB J. 2016, 30, 1512–1522. [Google Scholar] [CrossRef]
  70. Enck, P.; Zimmermann, K.; Rusch, K.; Schwiertz, A.; Klosterhalfen, S.; Frick, J.S. The effects of maturation on the colonic microflora in infancy and childhood. Gastroenterol. Res. Pract. 2009, 2009, 752401. [Google Scholar] [CrossRef]
  71. Gomez-Llorente, C.; Plaza-Diaz, J.; Aguilera, M.; Munoz-Quezada, S.; Bermudez-Brito, M.; Peso-Echarri, P.; Martinez-Silla, R.; Vasallo-Morillas, M.I.; Campana-Martin, L.; Vives-Pinera, I.; et al. Three main factors define changes in fecal microbiota associated with feeding modality in infants. J. Pediatr. Gastroenterol. Nutr. 2013, 57, 461–466. [Google Scholar] [CrossRef]
  72. Piquer-Esteban, S.; Ruiz-Ruiz, S.; Arnau, V.; Diaz, W.; Moya, A. Exploring the universal healthy human gut microbiota around the World. Comput. Struct. Biotechnol. J. 2022, 20, 421–433. [Google Scholar] [CrossRef]
  73. Hayashi, H.; Sakamoto, M.; Kitahara, M.; Benno, Y. Molecular analysis of fecal microbiota in elderly individuals using 16S rDNA library and T-RFLP. Microbiol. Immunol. 2003, 47, 557–570. [Google Scholar] [CrossRef]
  74. Makivuokko, H.; Tiihonen, K.; Tynkkynen, S.; Paulin, L.; Rautonen, N. The effect of age and non-steroidal anti-inflammatory drugs on human intestinal microbiota composition. Br. J. Nutr. 2010, 103, 227–234. [Google Scholar] [CrossRef]
  75. Zwielehner, J.; Liszt, K.; Handschur, M.; Lassl, C.; Lapin, A.; Haslberger, A.G. Combined PCR-DGGE fingerprinting and quantitative-PCR indicates shifts in fecal population sizes and diversity of Bacteroides, bifidobacteria and Clostridium cluster IV in institutionalized elderly. Exp. Gerontol. 2009, 44, 440–446. [Google Scholar] [CrossRef]
  76. Samuel, S.C.; Hancock, P.; Leigh, D.A. An investigation into Clostridium perfringens enterotoxin-associated diarrhoea. J. Hosp. Infect. 1991, 18, 219–230. [Google Scholar] [CrossRef] [PubMed]
  77. Backhed, F.; Ley, R.E.; Sonnenburg, J.L.; Peterson, D.A.; Gordon, J.I. Host-bacterial mutualism in the human intestine. Science 2005, 307, 1915–1920. [Google Scholar] [CrossRef]
  78. Echarri, P.P.; Gracia, C.M.; Berruezo, G.R.; Vives, I.; Ballesta, M.; Solis, G.; Morillas, I.V.; Reyes-Gavilan, C.G.; Margolles, A.; Gueimonde, M. Assessment of intestinal microbiota of full-term breast-fed infants from two different geographical locations. Early Hum. Dev. 2011, 87, 511–513. [Google Scholar] [CrossRef]
  79. Larsen, N.; Vogensen, F.K.; van den Berg, F.W.; Nielsen, D.S.; Andreasen, A.S.; Pedersen, B.K.; Al-Soud, W.A.; Sorensen, S.J.; Hansen, L.H.; Jakobsen, M. Gut microbiota in human adults with type 2 diabetes differs from non-diabetic adults. PLoS ONE 2010, 5, e9085. [Google Scholar] [CrossRef] [PubMed]
  80. Leitch, E.C.; Walker, A.W.; Duncan, S.H.; Holtrop, G.; Flint, H.J. Selective colonization of insoluble substrates by human faecal bacteria. Environ. Microbiol. 2007, 9, 667–679. [Google Scholar] [CrossRef]
  81. Scott, K.P.; Gratz, S.W.; Sheridan, P.O.; Flint, H.J.; Duncan, S.H. The influence of diet on the gut microbiota. Pharmacol. Res. 2013, 69, 52–60. [Google Scholar] [CrossRef]
  82. Hold, G.L.; Smith, M.; Grange, C.; Watt, E.R.; El-Omar, E.M.; Mukhopadhya, I. Role of the gut microbiota in inflammatory bowel disease pathogenesis: What have we learnt in the past 10 years? World J. Gastroenterol. 2014, 20, 1192–1210. [Google Scholar] [CrossRef]
  83. Hijova, E.; Chmelarova, A. Short chain fatty acids and colonic health. Bratisl. Lek. Listy 2007, 108, 354–358. [Google Scholar] [PubMed]
  84. Roy, J.; Denovan-Wright, E.M.; Linsdell, P.; Cowley, E.A. Exposure to sodium butyrate leads to functional downregulation of calcium-activated potassium channels in human airway epithelial cells. Pflugers Arch. 2006, 453, 167–176. [Google Scholar] [CrossRef]
  85. Mikelsaar, M.; Sepp, E.; Stsepetova, J.; Songisepp, E.; Mandar, R. Biodiversity of Intestinal Lactic Acid Bacteria in the Healthy Population. Adv. Exp. Med. Biol. 2016, 932, 1–64. [Google Scholar] [CrossRef]
  86. Chen, J.J.; He, S.; Fang, L.; Wang, B.; Bai, S.J.; Xie, J.; Zhou, C.J.; Wang, W.; Xie, P. Age-specific differential changes on gut microbiota composition in patients with major depressive disorder. Aging 2020, 12, 2764–2776. [Google Scholar] [CrossRef]
  87. Tiihonen, K.; Tynkkynen, S.; Ouwehand, A.; Ahlroos, T.; Rautonen, N. The effect of ageing with and without non-steroidal anti-inflammatory drugs on gastrointestinal microbiology and immunology. Br. J. Nutr. 2008, 100, 130–137. [Google Scholar] [CrossRef] [PubMed]
  88. Cani, P.D.; Delzenne, N.M. The role of the gut microbiota in energy metabolism and metabolic disease. Curr. Pharm. Des. 2009, 15, 1546–1558. [Google Scholar] [CrossRef]
  89. Vaughan, E.E.; Heilig, H.G.; Ben-Amor, K.; de Vos, W.M. Diversity, vitality and activities of intestinal lactic acid bacteria and bifidobacteria assessed by molecular approaches. FEMS Microbiol. Rev. 2005, 29, 477–490. [Google Scholar] [CrossRef]
  90. Thorasin, T.; Hoyles, L.; McCartney, A.L. Dynamics and diversity of the ‘Atopobium cluster’ in the human faecal microbiota, and phenotypic characterization of ‘Atopobium cluster’ isolates. Microbiology 2015, 161, 565–579. [Google Scholar] [CrossRef] [PubMed]
  91. Karlsson, F.H.; Fak, F.; Nookaew, I.; Tremaroli, V.; Fagerberg, B.; Petranovic, D.; Backhed, F.; Nielsen, J. Symptomatic atherosclerosis is associated with an altered gut metagenome. Nat. Commun. 2012, 3, 1245. [Google Scholar] [CrossRef]
  92. Qin, J.; Li, Y.; Cai, Z.; Li, S.; Zhu, J.; Zhang, F.; Liang, S.; Zhang, W.; Guan, Y.; Shen, D.; et al. A metagenome-wide association study of gut microbiota in type 2 diabetes. Nature 2012, 490, 55–60. [Google Scholar] [CrossRef] [PubMed]
  93. Harmsen, H.J.; Wildeboer-Veloo, A.C.; Grijpstra, J.; Knol, J.; Degener, J.E.; Welling, G.W. Development of 16S rRNA-based probes for the Coriobacterium group and the Atopobium cluster and their application for enumeration of Coriobacteriaceae in human feces from volunteers of different age groups. Appl. Environ. Microbiol. 2000, 66, 4523–4527. [Google Scholar] [CrossRef]
  94. Moore, W.E.; Holdeman, L.V. Human fecal flora: The normal flora of 20 Japanese-Hawaiians. Appl. Microbiol. 1974, 27, 961–979. [Google Scholar] [CrossRef]
  95. Belenguer, A.; Duncan, S.H.; Holtrop, G.; Anderson, S.E.; Lobley, G.E.; Flint, H.J. Impact of pH on lactate formation and utilization by human fecal microbial communities. Appl. Environ. Microbiol. 2007, 73, 6526–6533. [Google Scholar] [CrossRef]
  96. Flint, H.J.; Scott, K.P.; Duncan, S.H.; Louis, P.; Forano, E. Microbial degradation of complex carbohydrates in the gut. Gut Microbes 2012, 3, 289–306. [Google Scholar] [CrossRef] [PubMed]
  97. Kushkevych, I.; Coufalova, M.; Vitezova, M.; Rittmann, S.K.R. Sulfate-Reducing Bacteria of the Oral Cavity and Their Relation with Periodontitis-Recent Advances. J. Clin. Med. 2020, 9, 2347. [Google Scholar] [CrossRef] [PubMed]
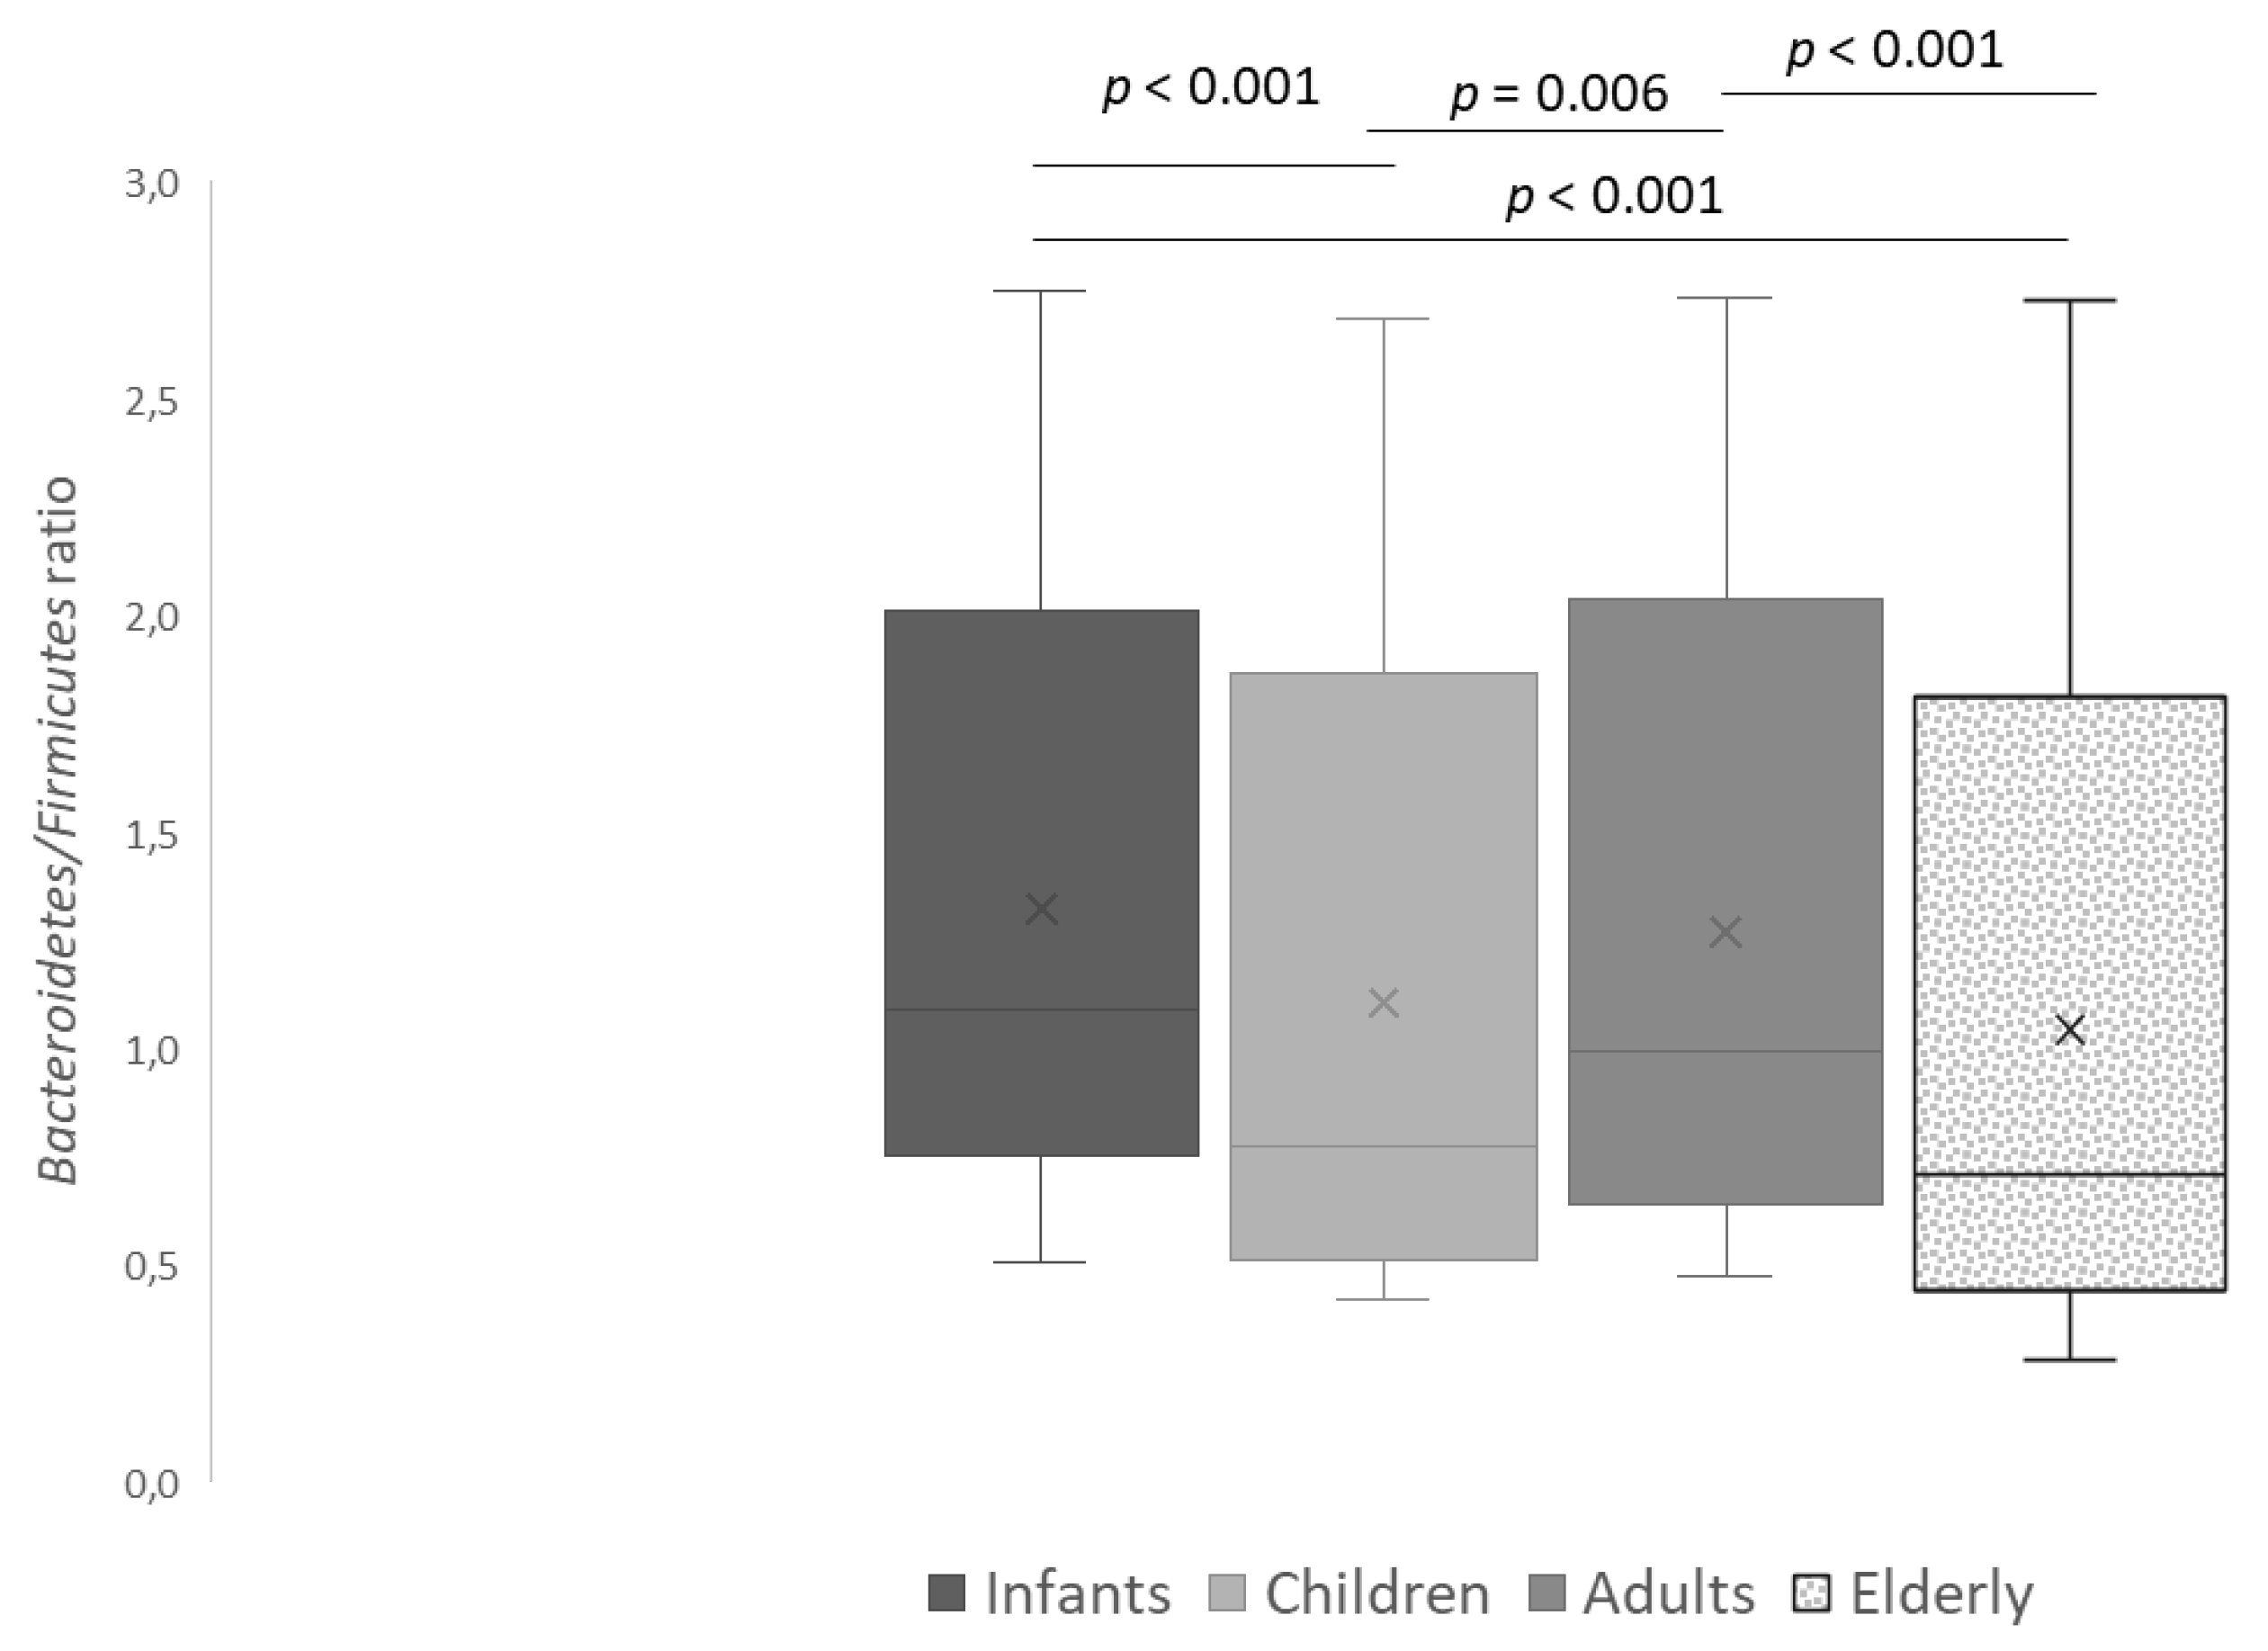
Figure 1. Bacteroidetes/Firmicutes ratio in different age groups. Boxplot shows the changes in B/F ratio between the investigated groups (infants, children, adults and the elderly) that occur with ageing. Error bars represent the standard deviation.
Microbiolres 16 00060 g001
Figure 2. Bacterial diversity indices (Shannon index, H’) for faecal samples from different age groups. Boxplot shows the changes in the diversity index between the investigated groups (infants, children, adults and the elderly) that occur with ageing. Error bars represent the standard deviation.
Microbiolres 16 00060 g002
Figure 3. Principal coordinate analysis (PCoA) plot showing the differences in microbiota composition between each faecal sample (inter-individual variability). Each dot corresponds to the unique composition of a single faecal sample. The distance between dots represents the degree of variability of microbiota composition among samples. Samples from infants are indicated in yellow, children in blue, adults in aqua and the elderly in violet.
Microbiolres 16 00060 g003
Figure 4. Sperman’s rank correlation between age and counts of different bacterial groups.
Microbiolres 16 00060 g004
Figure 5. Heatmap of the Spearman correlations (r2) between bacterial groups. Heatmap shows tightest correlations for B. coccoides-E. rectale, C. leptum (incl. F. prausnitzii), Bacteroides-Prevotella and Atopobium groups. Correlations were assessed between each bacterial group within each study group (infants, 5-year-old children, adults and the elderly). * p ≥ 0.05; ** p ≥ 0.01; *** p ≥ 0.001.
Microbiolres 16 00060 g005
Table 1. Age and sex of study group participants.
Group (No. Participants)Age (Yrs.)Sex (No. Male/Female)
Mean ± SDRange
Infants (n = 25)1.0 ± 0.050.8–1.117/8
Children (n = 25)5.3 ± 0.25.1–5.613/12
Adults (n = 25)48.2 ± 6.627–584/21
Elderly (n = 23)72.9 ± 5.066–849/14
Table 2. List of primers and probes used in this study.
Target Groups (Amplicon Length, Tm, Assay)Primers/ProbesSequence (5′–3′)References
Total bacteria (466 bp, 60 °C, TaqMan)Univ-fTGGAGCATGTGGTTTAATTCGA[45]
Univ-rTGCGGGACTTAACCCAACA
Univ (Probe)CACGAGCTGACGACA(AG)CCATGCA
Firmicutes phylum (126 bp, 60 °C, Sybr)Firm934fGGAGYATGTGGTTTAATTCGAAGCA[46]
Firm1060rAGCTGACGACAACCATGCAC
Bacteroides-Prevotella group (140 bp, 58 °C, Sybr)Bact303-fGGTGTCGGCTTAAGTGCCAT[25]
Bact708-rCGGACGTAAGGGCCGTGC
Blautia coccoides-Eubacterium rectale group (429 bp, 55 °C, Sybr)Ccocc-rAGTTTYATTCTTGCGAACG[25]
Ccocc-fCGGTACCTGACTAAGAAGC
C. leptum group (239 bp, 50 °C, Sybr)Clept-fGCACAAGCAGTGGAGT[32]
Clept-rCTTCCTCCGTTTTGTCAA
F. prausnitzii (158 bp, 61 °C, Sybr)Fprau-fGTCGCAGGATGTCAAGAC[25]
Fprau-rCCCTTCAGTGCCGCAGT
C. perfringens group (120 bp, 55 °C, Sybr)Cperf-fATGCAAGTCGACCGAKG[25]
Cperf-rTATGCGGTATTAAATCTYCCTTT
C. difficile (177 bp, 60 °C, TaqMan)Cdif398GAAAGTCCAAGTTTACGCTCAAT[47]
Cdif399GCTGCACCTAAACTTACACCA
Cdif(Probe)ACAGATGCAGCCAAAGTGGTTGAATT
Veillonella sp. (343 bp, 62 °C, Sybr)Veilon-fA(C/T) CAACCTGCCCTTCAGA[25]
Veilon-rCGTCCCGATTAACAGAGCTT
Lactobacillus sp. (92 bp, 60 °C, TaqMan)AllLacto-fTGGATGCCTTGGCACTAGGA[48]
AllLacto-rAAATCTCCGGATCAAAGCTTACTTAT
AllLacto (Probe)TATTAGTTCCGTCCTTCATC
Staphylococcus sp. (560 bp, 62 °C, Sybr)TStaG422GGCCGTGTTGAACGTGGTCAAATCA[49]
TStaG765TIACCATTTCAGTACCTTCTGGTAA
Enterococcus sp. (144 bp, 61 °C Sybr)Enteroc-fCCCTTATTGTTAGTTGCCATCATT[25]
Enteroc-rACTCGTTGTACTTCCCATTGT
Streptococcus sp. (343 bp, 58 °C, Sybr)Tut-Strep-FGAAGAATTGCTTGAATTGGTTGAA[49]
Tut-Strep-RGGACGGTAGTTGTTGAAGAATGG
Bifidobacterium sp. (231 bp, 60 °C, TaqMan)Allbif-fGGGATGCTGGTGTGGAAGAGA[50]
Allbif-rTGCTCGCGTCCACTATCCAGT
AllBif (Probe)TCAAACCACCACGCGCCA
Atopobium group (120 bp, 61 °C, Sybr)c-Atopo-F:ACCGCTTTCAGCAGGGA[51]
c-Atopo-R:ACGCCAATGAATCCGGAT
Enterobacteriacea (195bp,58 °C, Sybr)Eco1457-fCATTGACGTTACCCGCAGAAGAAGC[21]
Eco1652-CTCTACGAGACTCAAGCTTGC
Desulfovibrio sp. (135 bp, 63 °C, Sybr)Dsv691-fCCGTAGATATCTGGAGGAACATCAG[52]
Dsv826-rACATCTAGCATCCATCGTTTACAGC
Table 3. The count (log10 plasmid gene copies/g faeces) of different bacteria groups in faeces from individuals of different ages.
DomainPhylumClassGenus/Bacterial GroupInfantsChildrenAdultsElderlyp Value
BacteriaTotalTotalTotal bacteriaa,b 11.0 ± 0.5a,c 10.5 ± 0.9c,d 11.0 ± 0.9b,d 10.1 ± 0.7c p = 0.002
a,b,d p < 0.001
BacteroidetesBacteroidiaBacteroides-Prevotella groupa,b 9.7 ± 1.6a,c 8.1 ± 2.09.0 ± 1.8b,c 6.8 ± 1.5a p = 0.012
b,c p < 0.001
FirmicutesClostridiaFirmicutes groupa,b 9.2 ± 0.3a,c 10.2 ± 0.7c,d 9.4 ± 0.4b,d 10.1 ± 0.1a,b,c,d p < 0.001
B. coccoides-E. rectale groupa 9.7 ± 1.18.9 ± 2.0c 9.6 ± 0.6a,c 7.9 ± 1.1a,c p < 0.001
C. leptum group7.7 ± 0.97.3 ± 1.47.8 ± 0.97.8 ± 0.8NS
F. prausnitziia,b,c 8.0±0.7a,d 7.3 ± 1.6b,d,e 9.2 ± 0.9c,e 7.5 ± 0.5a,b,c p < 0.001
d p = 0.005
C. perfringens groupa,b,c 6.0 ± 0.4a,d 5.0 ± 0.5b,e 5.1 ± 0.2c,d,e 4.0 ± 0.4a,b,c,d,e p < 0.001
C. difficile2.5±1.11.0 ± 0.4ND1.9 ± 0.7c p < 0.001
d p = 0.005
BacilliLactobacillus sp.a,b,c 6.3±1.2a,c 7.5 ± 0.6c,d 5.6 ± 0.9b,d 7.7 ± 0.5a,c,d p < 0.001
b p = 0.019
Enterococcus sp.a,b,c 7.5 ± 0.3a 7.1 ± 0.5b,d 6.8 ± 0.7c,d 6.1 ± 1.0a p = 0.002
b,c p < 0.001
d p = 0.007
Streptococcus sp.a,b,c 7.5 ± 0.4a 6.9 ± 0.8b 6.9 ± 0.6c 6.8 ± 0.9a p = 0.003
c p = 0.001
b p < 0.001
Staphylococcus sp.4.3 ± 0.44.4 ± 0.74.3 ± 0.54.9 ± 1.5NS
NegativicutesVeillonella sp.a,b,c 7.8 ± 1.2a 5.8 ± 1.8b,d 6.8 ± 1.0c,d 5.8 ± 1.0a,c,d p < 0.001
b p = 0.003
ActinobacteriaActinobacteriaBifidobacterium sp.7.1 ± 1.3a 7.6 ± 0.9a 6.6 ± 1.46.9 ± 1.4a p = 0.003
Atopobium group6.8 ± 1.0a 7.2 ± 1.16.6 ± 1.2a 6.5 ± 0.8a p = 0.003
ProteobacteriaProteobacteriaEnterobacteriaceaea,b,c 8.0 ± 1.0a 7.1 ± 0.7b 6.2 ± 1.3c 6.3 ± 1.4a p = 0.009
b,c p < 0.001
Desulfovibrio sp.4.2 ± 1.44.7 ± 1.4c 5.8 ± 1.8c 4.5 ± 1.0c p = 0.005
a–e—indicates significant bacterial differences between study groups; NS—not significant; ND—not detected.
Disclaimer/Publisher’s Note: The statements, opinions and data contained in all publications are solely those of the individual author(s) and contributor(s) and not of MDPI and/or the editor(s). MDPI and/or the editor(s) disclaim responsibility for any injury to people or property resulting from any ideas, methods, instructions or products referred to in the content.