Article

Isolation of Bacillus paralichenifromis BL-1 and Its Potential Application in Producing Bioflocculants Using Phenol Saline Wastewater

1
College of Life Sciences, Huzhou University, Huzhou 313000, China
2
School of Life and Health Sciences, Huzhou College, Huzhou 313000, China
3
Faculty of Biology, Shenzhen MSU-BIT University, Shenzhen 518172, China
*
Author to whom correspondence should be addressed.
Microbiol. Res. 2025, 16(1), 23; https://doi.org/10.3390/microbiolres16010023
Submission received: 5 December 2024 / Revised: 29 December 2024 / Accepted: 8 January 2025 / Published: 17 January 2025

Abstract

:
Phenolic compounds are harmful organic pollutants found in wastewater from the chemical and pharmaceutical industries, which are frequently accompanied by high saline concentrations. Microorganism-based biodegradation represents an environmentally friendly and cost-effective strategy for phenol removal. In this study, we isolated a bioflocculant-producing Bacillus paralicheniformis BL-1 that is capable of phenol degradation in high-salinity conditions. Differential gene expression analysis revealed the down-regulation of genes related to the synthesis of extracellular polymeric substances and the up-regulation of poly-γ-glutamate biosynthesis in 10% NaCl conditions. These findings indicate that poly-γ-glutamate is the main large biomolecule produced by B. paralicheniformis BL-1. A further investigation suggested that salinity stress resulted in the down-regulated expression of the genes involved in iron homeostasis. Therefore, alleviating iron limitation by supplying excess iron could improve cell growth and, thus, increase the phenol removal rate and flocculating activity. The productivity of poly-γ-glutamate reached 2.23 g/L, and the phenol removal rate reached 73.83% in the synthetic medium supplemented with 10% NaCl, 500 mg/L phenol, and 250 μM FeCl3.

1. Introduction

Phenol is a widely utilized compound in the pharmaceutical and chemical industries and petroleum refining processes [1]. Market trends have predicted that the demand for phenol will grow at a compound annual growth rate of 4.9% during the period of 2024–2032 [2]. The growing market demand will also pose challenges in environmental and ecological management. The contamination of water sources by phenol results from the discharge of industrial effluents via inappropriate disposal or poor treatment methods. Domestic and municipal activities all contribute to the emission of phenol into water sources. Many products, such as soaps, perfumes, lacquers, and paints, contain phenol. All these everyday goods are frequently dumped directly into public drains, contaminating municipal water [3]. The detection of these compounds in aquatic environments has been widely documented in many regions and countries [4]. The presence of widely distributed phenolic compounds across a vast area emphasizes the need to tackle ecological difficulties; however, removing phenol is still a challenging problem [5].
Phenolic compounds with varying solubilities, stability, biodegradability, and mobility, even at low concentrations, pose a significant threat to human health, as they are highly toxic and can irritate the skin, eyes, and mucous membranes upon inhalation or dermal contact. Consequently, there have been considerable efforts aimed at effectively removing phenol from contaminated environments. Traditional chemical oxidative processes for phenol wastewater treatment using ozonation, Fenton’s reagent, UV, and hydrogen peroxide are costly, environmentally harmful, and inefficient in large wastewater volumes [6]. Recently, the bio-removal of phenol using microorganisms has emerged as a promising approach that is not only cost-effective but also environmentally friendly, as it is considered to cause no secondary pollution [7].
Numerous bacteria have been discovered that degrade phenol, including Pseudomonas, Acinetobacter, Halomonas, Bacillus spp., etc. Among these, Bacillus spp. have been isolated from a diverse range of habitats and possess the capability to degrade phenol through phenol metabolism or by excreting enzymes for phenol oxidation, such as peroxidase [8] and laccase [9]. However, the complex physical properties of industrial wastewater, particularly its high salt content, significantly impact the phenol degradation ability of these microorganisms. Industries, like oil refining, fish processing, meat canning, dairy products, and tanning processes, generate wastewaters that not only contain organic pollutants but also have high-salt concentrations [10]. It is well known that high salinity can severely inhibit the effectiveness of both aerobic and anaerobic biological wastewater treatment processes [11]. When exposed to a high-salinity environment, these bacteria will generally not survive and lose metabolic activities due to cell dehydration and plasmolysis [12]. Therefore, screening for halotolerant strains has become crucial to mitigate the detrimental effects of salinity on the overall performance of bioprocesses [13].
The production of bioflocculants has received considerable attention because of bioflocculants’ biodegradability and cost-effectiveness. Bacillus spp. are well known for their high flocculant-producing capability [14]. B. licheniformis X14 produces glycoprotein as a bioflocculant consisting of 91.5% polysaccharide and 8.4% protein [15]. Thermotolerant Bacillus sp. ISTVK1 produces extracellular polymeric substances (EPSs) for flocculating aromatic contaminants [16].
Poly-γ-glutamic acid (γ-PGA) is a non-toxic, water-soluble, and edible biopolymer with versatile industrial applications, such as in food, cosmetics, agriculture, and wastewater treatment [17]. γ-PGA is produced by bacteria, especially in Bacillus species [18]. Moreover, many reports have discovered that Bacillus spp. can produce bioflocculants in high-salt conditions. B. agaradhaerens C9 achieves the highest flocculating activity at a concentration of 20 g/L NaCl [19]. The production of γ-PGA by B. licheniformis WX-02 is salt-inducible and has the highest yield at 8% NaCl [20]. However, while bioflocculant production by halotolerant Bacillus spp. has been well studied, most of this research has focused on optimizing productivity in bioprocesses rather than exploring the potential of using phenol-contaminated saline wastewater for bioflocculant production.
In this study, we isolated a B. paralicheniformis strain, BL-1, capable of producing γ-PGA and degrading phenol in synthetic phenol saline medium. Transcriptomic and phenotypic analyses revealed that the production of bioflocculants and phenol degradation could be enhanced by alleviating iron starvation under salinity stress. This study not only contributes to our understanding of the mechanisms underlying bioflocculant production and phenol degradation in Bacillus spp. but also demonstrates the potential of using industrial wastewater as a resource to produce valuable bioflocculants.

2. Materials and Methods

2.1. Chemical and Culture Medium

To isolate salinity-resistant bacteria, Luria-Bertani (LB) agar supplemented with 50 g/L of NaCl (LB50) was used. To simulate phenol saline wastewater, a synthetic phenol saline medium (SPSM) was utilized for the growth of isolate BL-1 strain. The SPSM medium contained a modified basic mineral salt solution (MSS) [21] with 4.0 g/L of NaNO3, 3.61 g/L of Na2HPO4, 1.75 g/L of KH2PO4, 0.2 g/L of MgSO4·7H2O, 0.05 g/L of CaCl2·2H2O, 1.0 mg/L of FeSO4·5H2O, 50 μg/L of CuSO4·5H2O, 10 μg/L of Na2MoO3, 10 μg/L of MnSO4, and 5 g/L of yeast extract. The NaCl concentration in the SPSM was varied from 5 g/L to 120 g/L, as specified. Additionally, the initial phenol concentration in the SPSM was adjusted within a range of 0 mg/L to 2000 mg/L.

2.2. Strain Isolation

For the isolation of salinity-resistant bacteria, 0.5 g of filtered soil was mixed with 25 mL of sterile ddH2O and vortexed thoroughly at room temperature for 10 min. One milliliter of the resulting suspension was 10-fold serially diluted and spread onto LB agar plates supplemented with 50 g/L of NaCl (LB50). The plates were then aerobically incubated at 37 °C for 48 h. After incubation, individual colonies were purified by restreaking them twice onto LB50 agar plates.

2.3. Determination of Flocculating Activity

The flocculating activity was determined using kaolin clay assay [14]. To prepare the suspension, 0.5 g of kaolin clay was mixed into 500 mL of sterile ddH2O. For the assay, 1 mL of culture medium and 3 mL of a 1.0% CaCl2 solution were combined with 200 mL of the kaolin clay suspension. The mixture was thoroughly shaken and then allowed to settle for 5 min at room temperature. The optical density of the resulting clarified solution was measured spectrophotometrically at a wavelength of 550 nm. A control was prepared by replacing the culture medium with unfermented broth medium. The flocculating activity was calculated as: flocculating activity % = (Ctrl − M)/Ctrl × 100%, where Ctrl and M represent the optical density of the control and measured samples at 550 nm, respectively. Each sample was measured in triplicate and significant differences were determined using two-tailed t-test (p < 0.05).

2.4. Quantification of γ-PGA

To isolate and purify flocculants from the fermentation broths, 50 µL of the culture brothsin triplicate was collected and centrifuged at 5000× g for 30 min. The supernatants were transferred to a new centrifuge tube, and 100 mL of ice-cold ethanol was added to precipitate the flocculants overnight at 4 °C. The crude flocculants were then collected by centrifugation at 5000× g for 30 min at room temperature. The crude flocculants were redissolved in 40 mL of ddH2O, and cetyl-trimethyl-ammonium bromide (CTAB) was slowly added to a final concentration of 2% with stirring. The mixture was maintained at room temperature for 3 h, and the pellets were collected by centrifugation. The pellets were redissolved in 0.5 mL of 0.5 M NaCl, and 1 mL of ice-cold ethanol was added to precipitate the flocculants again at 4 °C for 4 h. The precipitates were collected by centrifugation at 5000 × g for 30 min at room temperature and washed three times with 1 mL of room temperature ethanol. The purified flocculants were then briefly evaporated and stored directly at −80 °C for use in subsequent experiments. This process ensures that the flocculants are isolated and purified to a high degree, ready for further analysis and characterization. The γ-PGA was weighed to quantify the yield. The significant difference was calculated by using two-tailed t-test (p < 0.05).

2.5. Determination of Phenol Concentration

The residual phenol concentration in the medium was analyzed according to the method described by Banerjee and Ghoshal [21]. Five milliliters of samples were collected at specified intervals and centrifuged at 7000 rpm for 10 min to separate the cell pellets from the supernatants. The supernatants were then filtered through a 0.22 μm filter (Agilent, Beijing, China). The filtrate extract (20 μL) was analyzed with 1260 Infinity HPLC (Agilent, Santa Clara, CA, USA) on a Poroshell 120 EC-C18 (3.0 × 50 mm, 2.7 µm) column (Agilent, Santa Clara CA, USA) at 25 °C with a mobile phase of acetonitrile (80% vol) and water (20% vol) at a flow rate of 0.8 mL/min equipped with DAD detector (Agilent, Santa Clara, CA, USA) at wavelength of 280 nm.

2.6. Genome Analysis of Isolate BL-1

The genome analysis of isolate BL-1 was prepared according to previously described method [22]. Briefly, genomic DNA of strain BL-1 was extracted using the Quick-DNA Kits (ZymoResearch, Irvine, CA, USA). A total of 500 ng of genomic DNA was quantified using Qubit dsDNA HS Assay Kit (ThermoFisher, Waltham, MA, USA), and then DNA library was generated by using NEB Next Ultra DNA Library Prep Kit (Illumina, San Diego, CA, USA). The DNA library was quantified by Qubit 4.0 (ThermoFisher, Waltham, MA, USA) and electrophoresed to ensure the quality. Genome sequencing was performed on Illumina HiSeq 4000 platform (Illumina, San Diego, CA, USA) in 150 bp paired-end mode. The raw reads with low quality were filtered, de novo assembled by SPAdes [23]. The gaps were closed by GapFiller 1.11 [24] and corrected by PrInSeS-G 1.0 [25]. Genomes of B. paralicheniformis BL-1 are available on https://www.ncbi.nlm.nih.gov/ (accessed on 30 June 2024) with accession number PRJNA1109274.
For genome annotation, Prokka 1.10 was used for prediction of coding genes and non-coding RNAs. RepeatMasker 4.1 was used for screening of interspersed repeats [26]. Annotation was performed by using the Cluster of Orthologous Groups of proteins (COG) [27], SwissProt [28], TrEMBL [28], Protein family (PFAM) [29], Conserved Domain Database (CDD) [30], Kyoto Encyclopedia of Genes and Genomes (KEGG) database [31], and NR database [32] through a BLAST+ search. Gene Ontology (GO) annotation [33] was performed by using the results from SwissProt and TrEMBL. A graphical circular map of the genome was created with Proksee [34].
The gyrA gene sequences of closely related Bacilli strains were clustered by ClustalW [35], and the phylogenetic tree was constructed via Neighbor-Joining method by MEGA 7 with bootstrap value of 1000 replicates [36].
To classify the isolate at species level, the in silico DNA-DNA hybridization (DDH) using Genome-to-Genome Distance Calculator (GGDC) [37] was performed following the instructions provided on the website.

2.7. RNA Extraction and qRT-PCR

The B. paralicheniformis BL-1 was cultured in 50 mL of SPSM containing 500 mg/L of phenol supplemented with 0.5% (Control group) or 10% of NaCl (Salt group), respectively, with three replicates. The cultured bacteria were centrifuged at 4 °C and immediately stored at −80 °C in RNAlater (ThermoFisher, Waltham, MA, USA). Total RNA was extracted by using TRIzol reagent (ThermoFisher, Waltham, MA, USA). The resuspended RNA was treated with DNase I (ThermoFisher, Waltham, MA, USA) and purified by using the RNA Clean & Con-centrator kit (ZymoResearch, Irvine, CA, USA). The resulting RNA concentration was determined by Biospectrometer (Eppendorf, Hamburg, Germany). The RNA was immediately distributed and frozen at −80 °C.
The cDNA synthesis and qRT-PCR were performed following previously described methods with 16S rRNA gene used as housekeeping gene reference [22]. Changes in transcript abundance were calculated automatically using the ΔΔCT method. Significant differences were calculated by using two-tailed t-test (p < 0.05). Primers used for qPCR were designed using a primer design tool and are listed in Table S3.

3. Results

3.1. Isolation and Identification of Bioflocculant-Producing Strain

Screening for salinity-resistant bacteria was conducted on LB agar plates containing 10% NaCl. Soil suspensions were serially diluted and spread onto these plates. One of the isolates, designated BL-1, was identified as a Bacillus species through 16S rDNA sequencing, showing a 100% identity match to B. licheniformis. Strain BL-1 was characterized as a long, rod-shaped, Gram-positive, aerobic bacterium capable of forming spores. The pure strain BL-1 demonstrated resistance to at least 12% NaCl and exhibited optimal growth at a salt concentration of 1% in LB medium (Figure 1a). Colony morphologies on regular LB medium and LB medium containing 10% NaCl are different (Figure S1). Specifically, BL-1 colonies grown on the 10% NaCl plate appeared circular, slimy, and had an ambiguous smooth surface.
The supernatants of strain BL-1 cultures exhibited a high flocculating rate under saline conditions. No flocculant production was observed when NaCl concentration was below 6%. However, the flocculating activity of the supernatants exceeded 60% after 16 h of incubation in LB medium containing 10% to 12% NaCl, indicating that the production of bioflocculants by strain BL-1 is induced by saline conditions (Figure 1b).

3.2. Genome Analysis of Strain BL-1

The evolutionary relationship of strain BL-1 was inferred using the Neighbor-Joining method based on the gyrA gene [38]. Strain BL-1 is phylogenetically closely related to B. paralicheniformis CEW 1W and B. paralicheniformis Bac84 (Figure 2a). Genomic DNA was sequenced using the HiSeq 4000 in 150 bp pair-end mode. A total of 1.44 Gb raw data generated 9,954,616 reads encompassing a total of 1,493,192,400 bases (Table S1). The circular view showed the scaffolds, open reading frames, coding and noncoding features, and the G + C content of the genome (Figure 2b and Table S1). The draft genome of strain BL-1 was assembled into 13 scaffolds consisting 4,281,236 bp with an N50 value of 1,061,627 and average G + C content of 45.82% (Figure S2a). A total of 4453 protein-coding genes were predicted with 78 tRNA and 10 rRNA operons. Of these, 3290 (76.98%) and 3157 (73.87%) genes were functionally categorized to GO and COG, respectively (Figure S2b). Pfam and CDD domains were detected in 3522 (82.41%) and 3648 (85.35%) genes, respectively (Figure S2b). Most genes were found to have a length ranging between 200 and 1000 bp (Figure S2c). A total of 3157, 3781, 1872, and 4258 genes were categorized in the COG, Swissprot, KEGG and NR database, respectively (Figure S2d). Out of 4453 genes, 1807 (40.6%) genes were annotated by all four databases (Figure S2d).
Because the 16S rRNA-based phylogenetic assay could not distinguish the BL-1 at the species level, we stimulated DNA-DNA hybridization (DDH) by using Genome-to-Genome Distance Calculator (GGDC) to determine the taxonomy of strain BL-1 (Table S2). The draft genome of strain BL-1 was compared with the genomes of four published strains. The results revealed that strain BL-1 exhibited close DDH similarity of 98.77 and 98.57 to B. paralicheniformis J41TS8 and B. paralicheniformis A4-3, respectively, and low similarities to B. licheniformis WX-02 and B. licheniformis ATCC 14580. This suggests that strain BL-1 is a newly discovered strain of B. paralicheniformis.

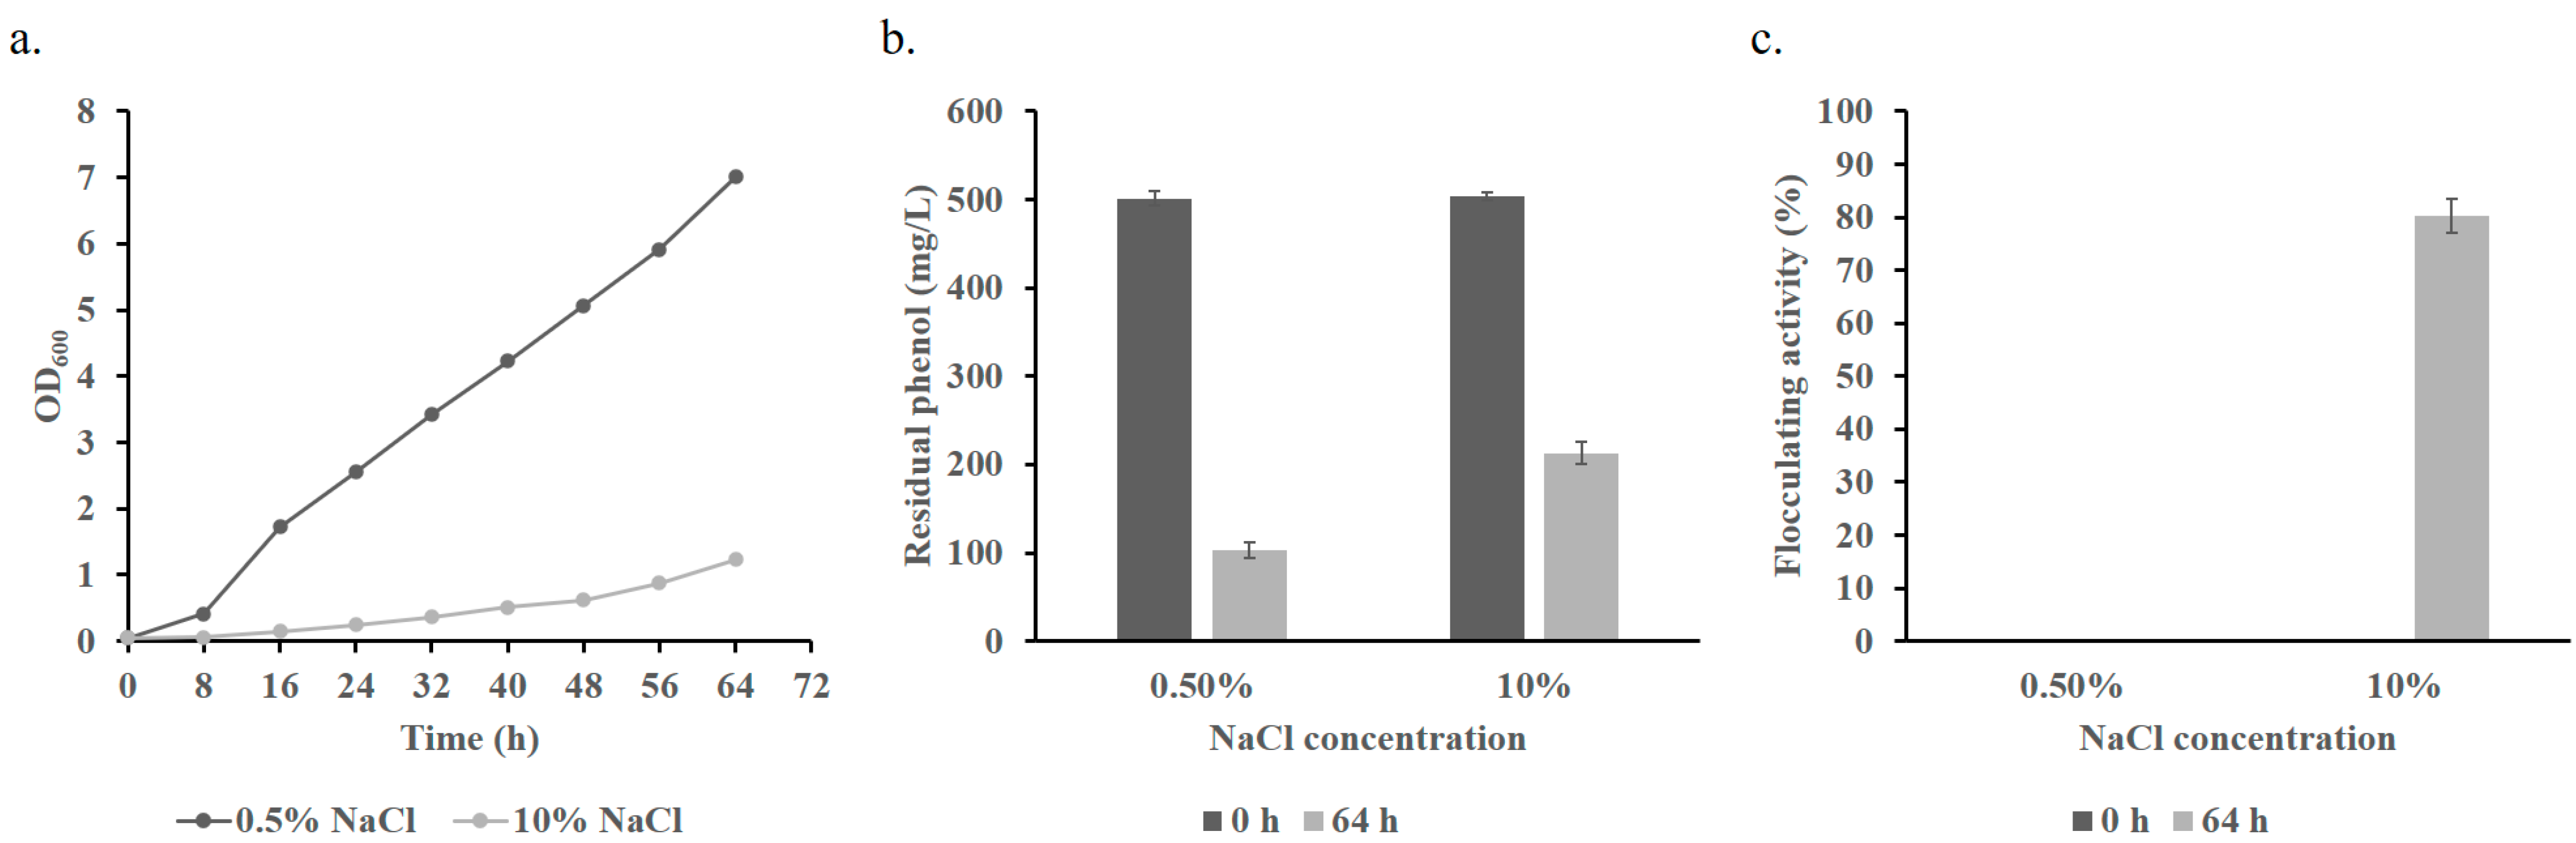
3.3. Phenol Degradation of B. paralicheniformis BL-1

A previous investigation indicated that B. licheniformis SL10 has the capability to degrade phenol, a process facilitated by intracellular catechol-2,3-dioxygenase [39]. We tested if B. licheniformis BL-1 could survive under the dual stresses of phenol and salinity. To simulate phenol-containing saline wastewater, we used synthetic phenol saline medium (SPSM). Strain BL-1 could tolerate 1800 mg/L of phenol in the SPSM with 0.5% NaCl condition. However, its tolerance decreased to 1000 mg/L of phenol when exposed to 10% NaCl (Table 1).
Next, we investigated whether strain BL-1 is capable of degrading phenol under saline conditions using 500 mg/L of phenol as the initial concentration. Strain BL-1 reached an OD600 of 7 after 64 h incubation (Table 1) and achieved a phenol removal rate of 79.44% in the normal SPSM medium (Figure 3b and Figure S3). The phenol removal rate decreased to 57.74% when strain BL-1 was grown in the 10% NaCl medium (Figure 3b), which could be attributed to the significantly lower biomass (Table 1 and Figure 3a) in a high-salt environment. Interestingly, we did not observe any flocculant production in the normal LB medium; however, the flocculating activity still reached 80% under salinity conditions (Figure 3c). This suggested that the bioflocculant production of B. paralicheniformis BL-1 is a response mechanism to salinity stress, independent of phenol degradation. Taken together, these results indicate B. paralicheniformis BL-1 is a bioflocculant-producing strain capable of facilitating phenol removal under salinity stress.

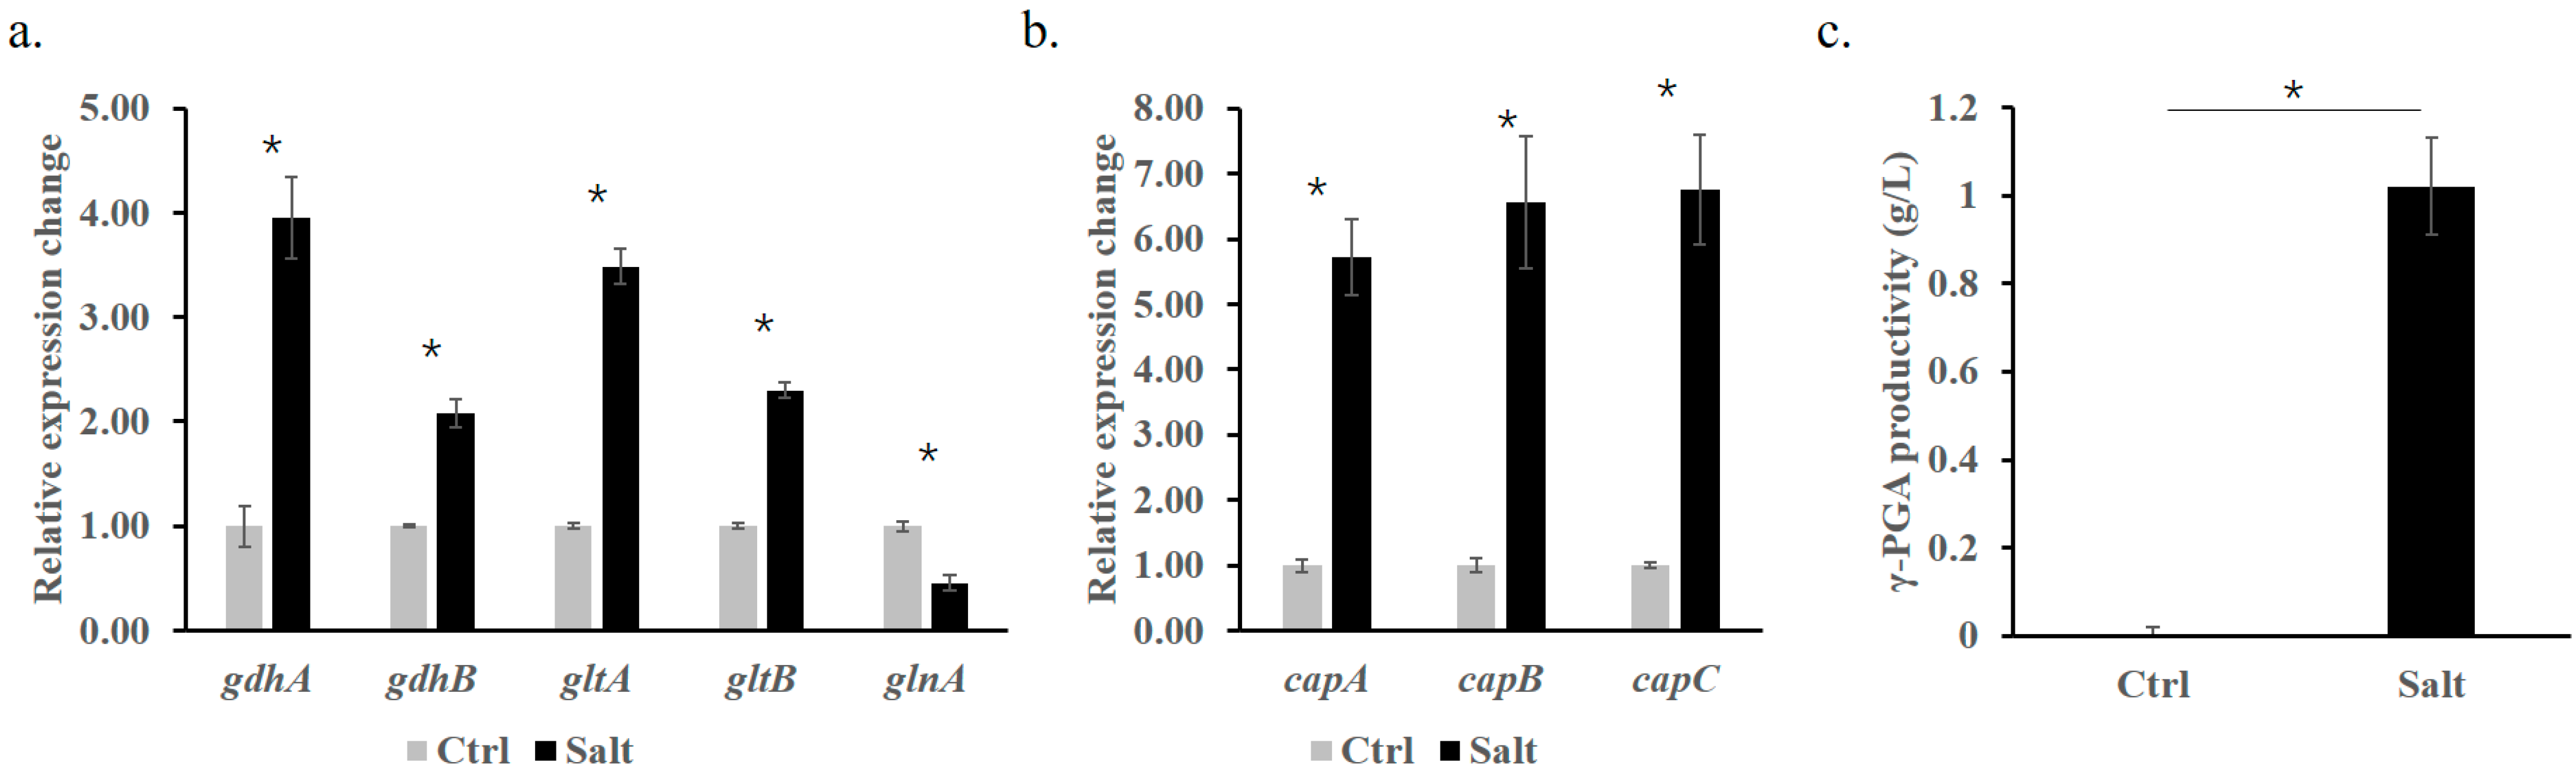
3.4. Poly-γ-glutamate Is the Main Flocculating Substance

Since the production of bioflocculants is only responsive to salinity stress, we conducted differential gene expression analysis (DEGs) between normal (0.5% NaCl) and salinity stress (10% NaCl) using the synthetic phenol medium. We observed that strain BL-1 formed a biofilm structure in static culture (Figure S1c); however, no biofilm was formed in the high-salt medium (Figure S1d), suggesting that extracellular polymeric substances (EPS) might not be the primary constituent of the bioflocculant produced by strain BL-1. In addition, most of the genes involved in EPS biosynthesis and biofilm formation were significantly down-regulated under the 10% NaCl condition (Figure S4). These indicated the EPS might not be the flocculating substance produced by B. paralicheniformis BL-1 in the salinity condition.
Research on B. licheniformis has revealed a competitive relationship between EPS and γ-PGA production [40]. Next, we investigated if B. paralicheniformis BL-1 produces γ-PGA to mitigate salinity stress, whereas glnA, which encodes glutamine synthetase for converting glutamate to glutamine, was down-regulated (Figure 4a). As expected, genes involved in γ-PGA biosynthesis, encoded by the capBCA gene cluster, were at least 5.66-fold more expressed under 10% NaCl conditions (Figure 4b). The precipitation of γ-PGA by CTAB demonstrated a yield of 1.1 g/L at 10% NaCl, while no γ-PGA production was detected at 0.5% NaCl. These findings collectively indicate that γ-PGA is one of the bioflocculants produced by B. paralicheniformis BL-1 in response to salinity stress.

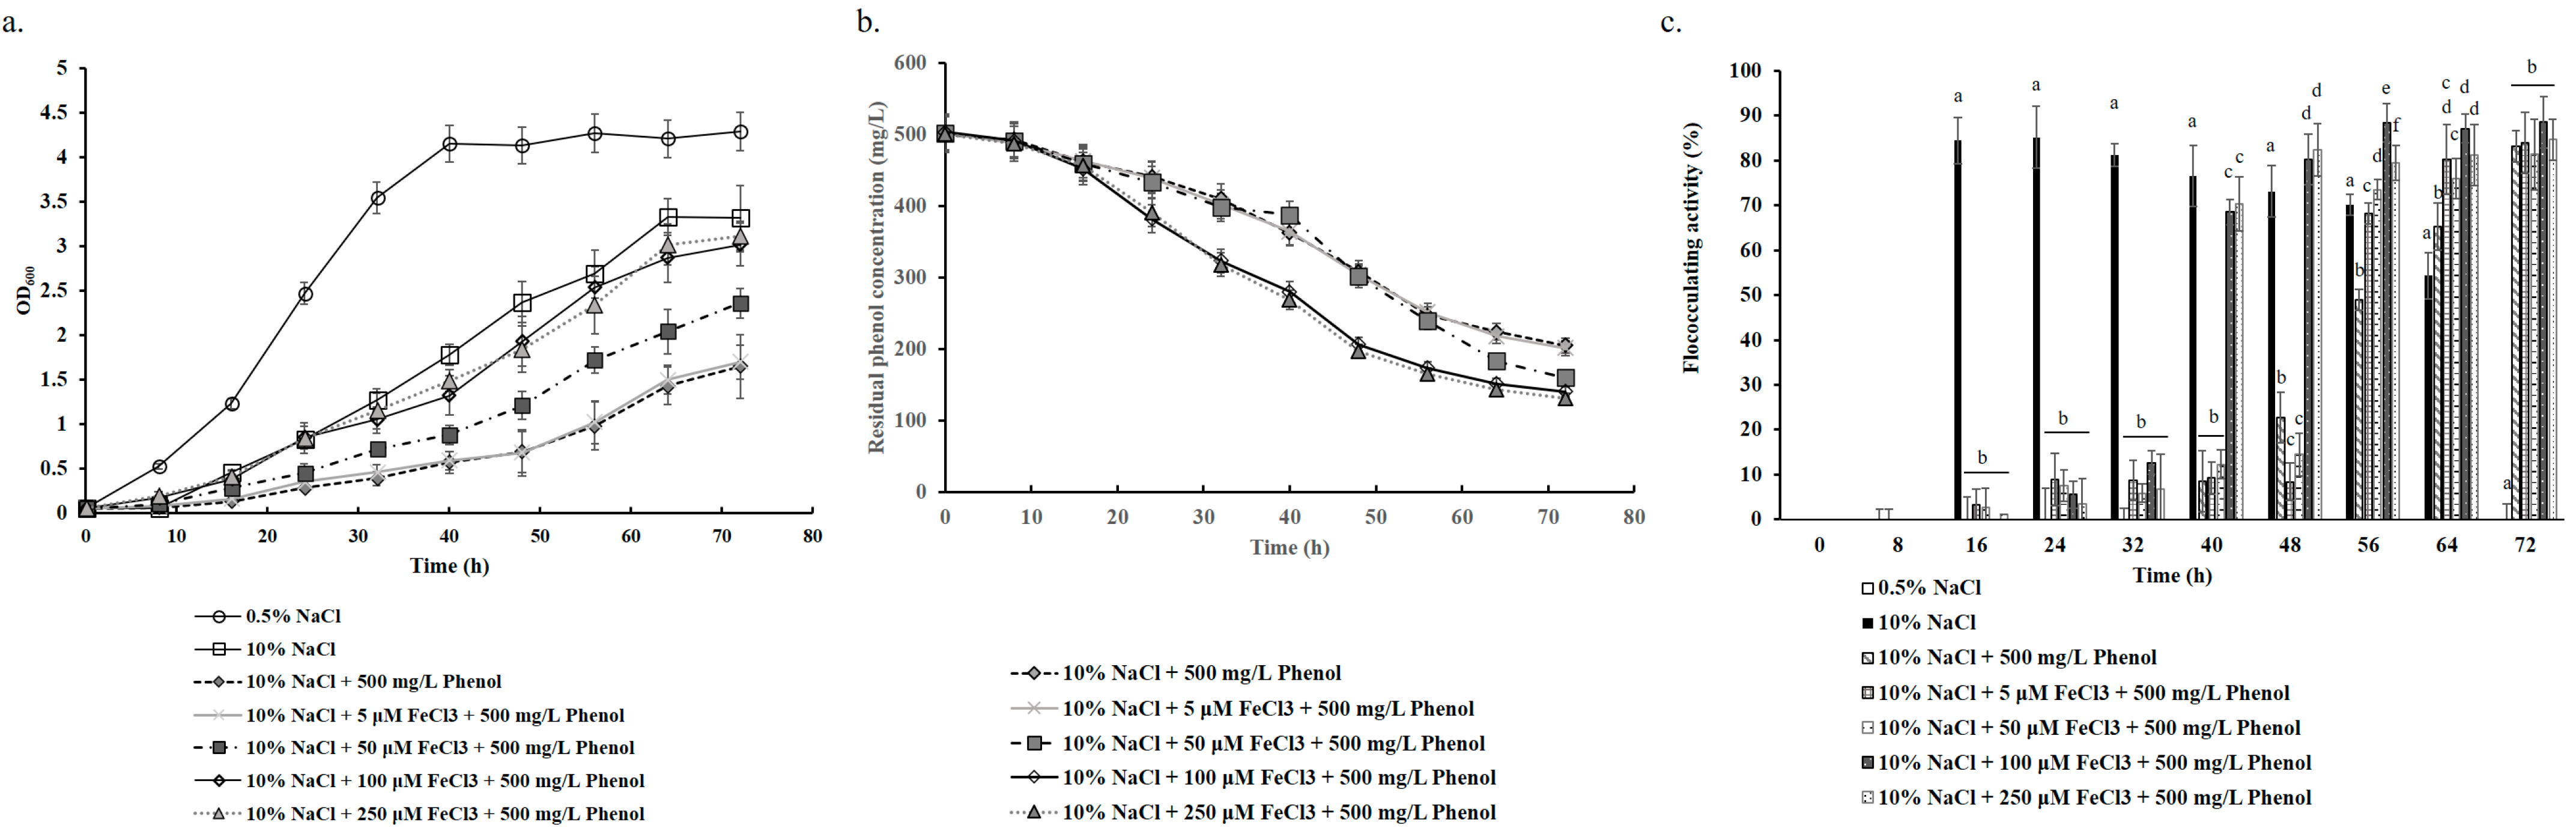
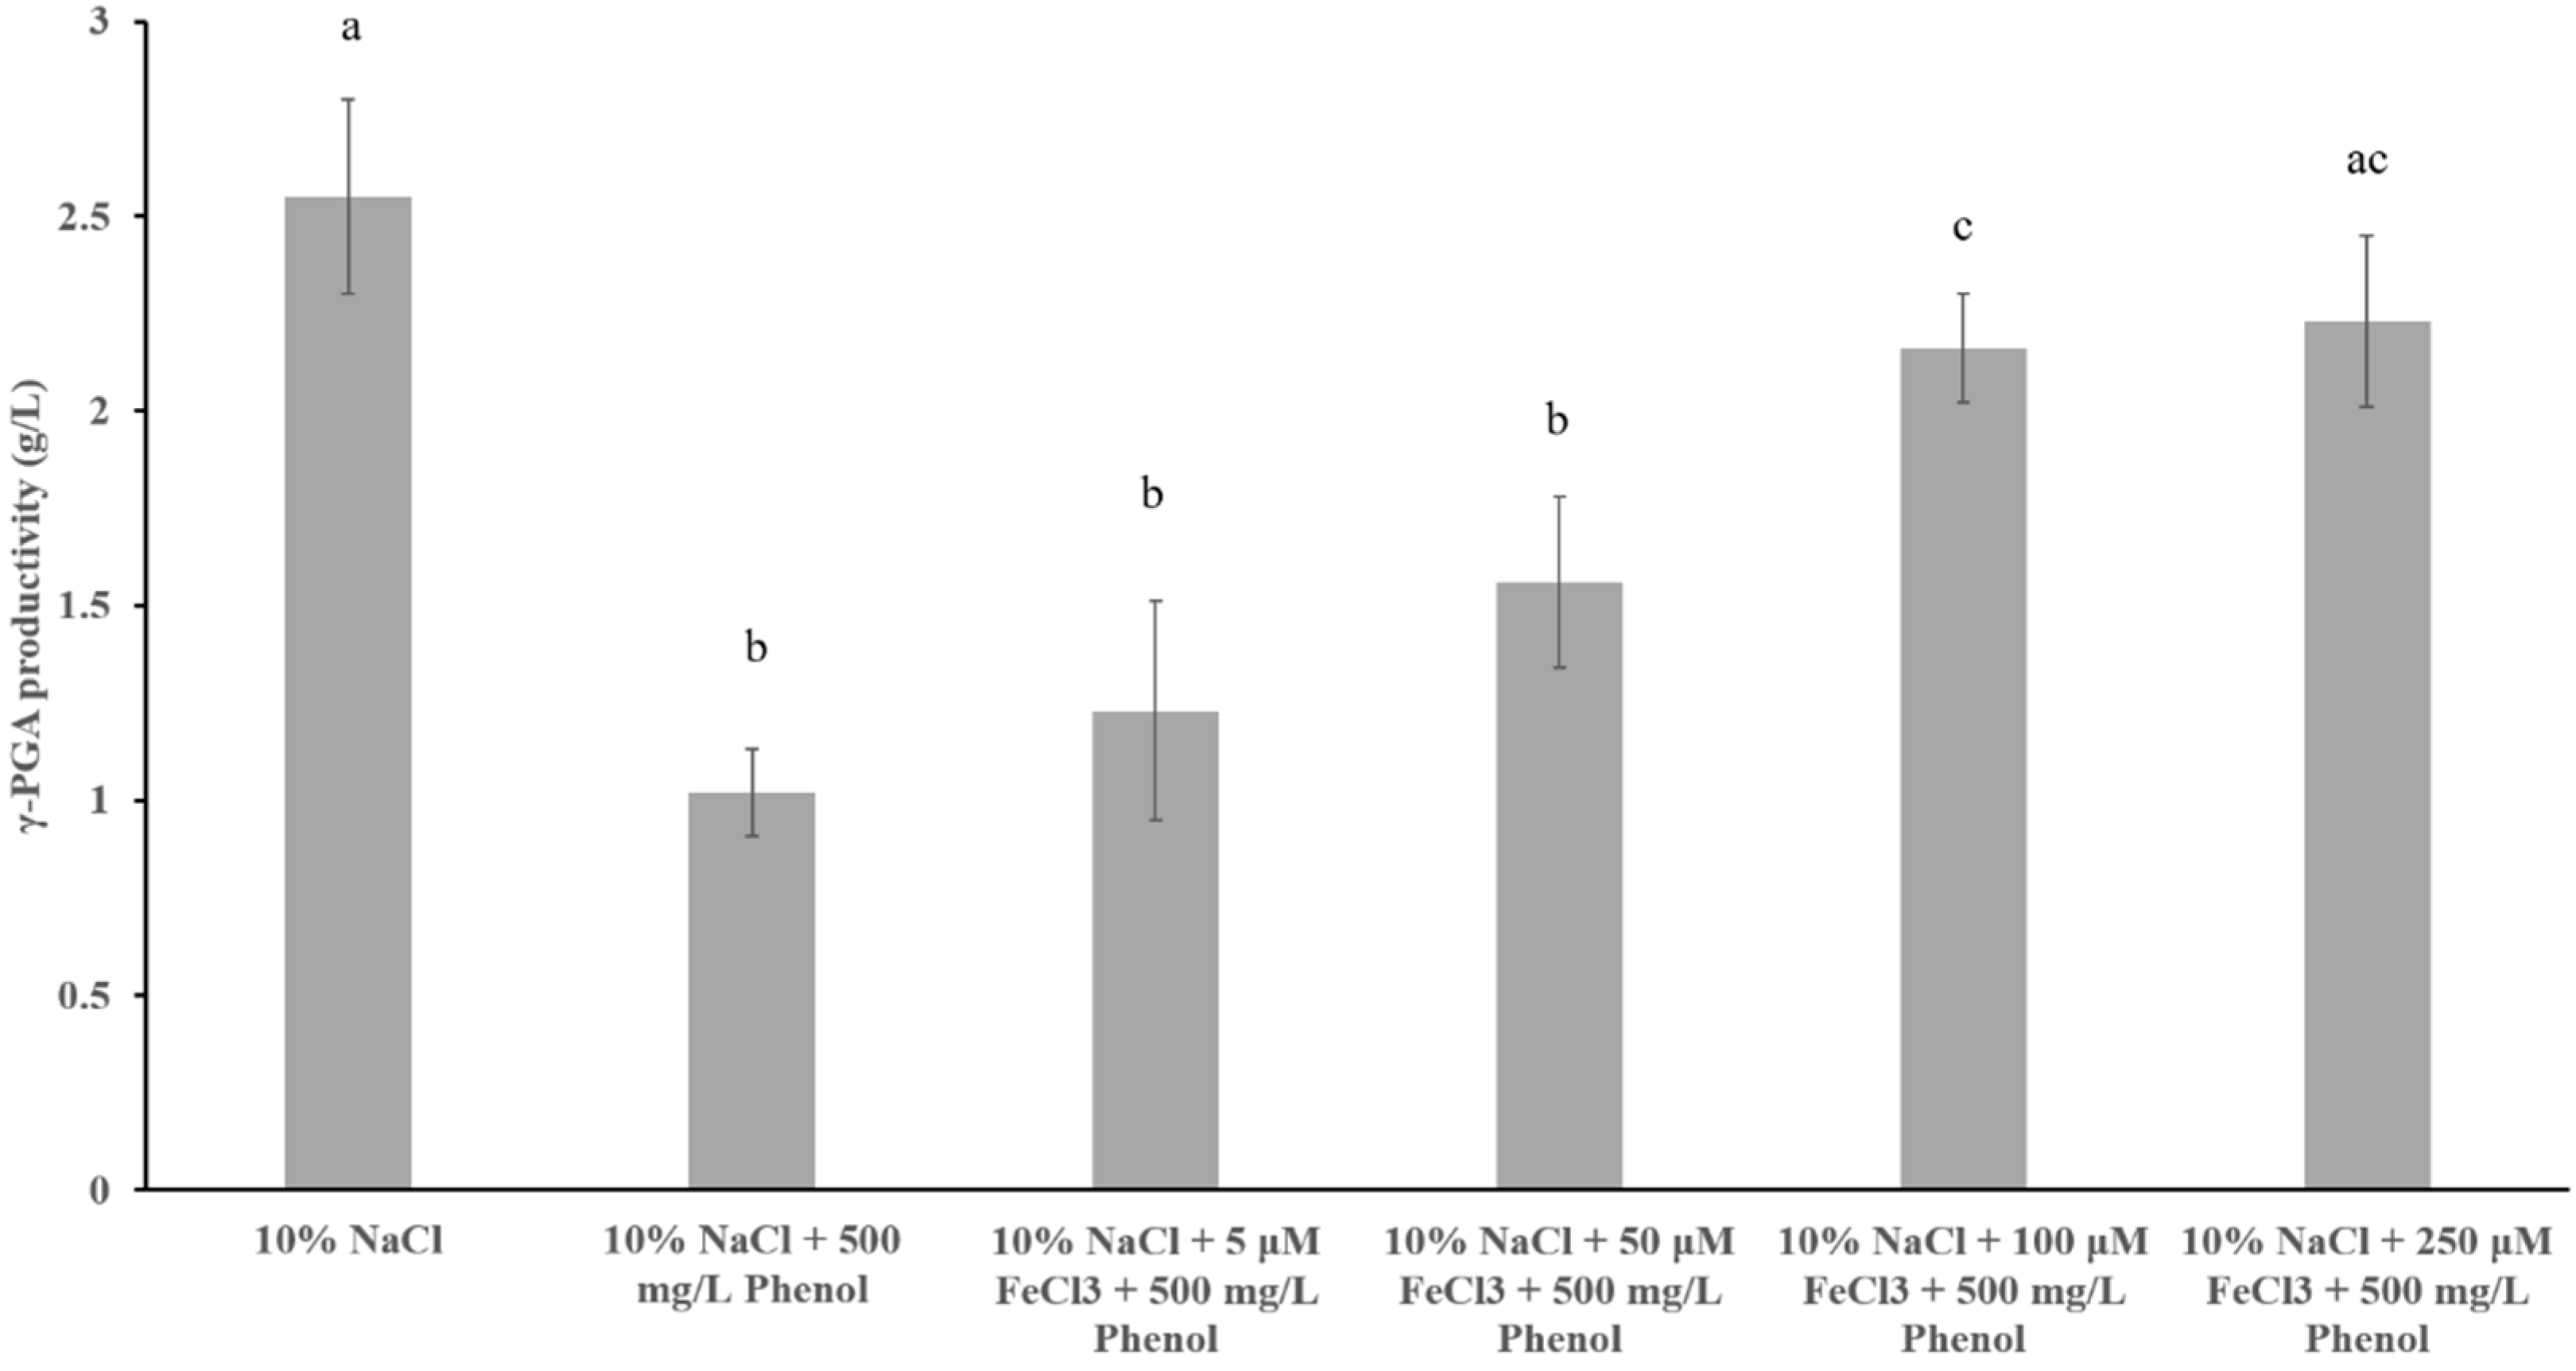
3.5. Alleviation of Iron Starvation Improves Salinity Adaptation

Previous results indicated that B. paralicheniformis BL-1 is capable of degrading phenol under salinity stress. However, the growth of strain BL-1 was significantly reduced under the dual-stress conditions (Table 1), which negatively impacted the production of growth-dependent bioflocculant (Figure 3). Therefore, improving the growth of B. paralicheniformis BL-1 would likely enhance bioflocculant production. Research on B. subtilis has indicated that high salinity can induce iron limitation, and supplying an ample amount of iron results in significantly better growth of the cells in high-salinity conditions [41]. Our DEG results indicated that most of the iron homeostasis-related genes were down-regulated in 10% NaCl conditions (Figure 5), such as the iron transporter encoding genes feoB and feuABC, Fe3+-hydroxamate-binding protein encoding gene fhuD, dhbABCEF operon involved in the synthesis of 2,3-dihydroxybenzoate (DHB), and the aerobactin-producing iucABCD operon. This suggests that B. paralicheniformis BL-1 also encounters iron starvation under salinity stress.
Therefore, we investigated whether alleviating iron starvation by supplementing excess ferric chloride could improve the adaptation of B. paralicheniformis BL-1 to the dual stresses of phenol and salinity. As shown in Figure 6, the addition of 50 μM of FeCl3 promoted the cell growth in 10% NaCl and 500 mg/L phenol stress conditions. The cell growth delay was significantly compensated when the iron concentration was increased to over 100 μM FeCl3 (Figure 6a). Furthermore, both phenol degradation in the medium and flocculating activity were dependent on cell growth, and both were improved with increasing iron concentration.
When cultured in the SPSM medium supplemented with 250 μM FeCl3, the residual phenol concentration decreased to 131 mg/L (corresponding to a removal rate of 73.83%) (Figure 6b). The maximum flocculating activity reached 84.5% (Figure 6c), and the productivity of γ-PGA reached 2.23 ± 0.22 g/L, which was close to the production of 2.55 ± 0.25 g/L in the 10% NaCl condition without phenol stress (Figure 7). These findings collectively suggest that alleviating iron starvation promotes growth-dependent phenol removal and bioflocculant production.

4. Discussion

Coagulation, flocculation and their combination processes are among the most widely applied processes for phenol wastewater treatment [42]. Untreated effluents typically contain turbidity, color, a high level of toxic chemicals, biochemical oxygen demand (BOD) and chemical oxygen demand (COD). Consequently, the cultivation of bioflocculants has gained significant attention due to their flocculating activity, biodegradability, and environmental friendliness [43].
Organic wastewater is usually accompanied by high-saline concentrations [44]. Although many strains have been reported as promising candidates for phenol wastewater treatment, cell growth is often suppressed under dual-stress conditions, such as the presence of both phenol and high-salt concentrations [44]. Therefore, screening of novel strains that exhibit high tolerance to both phenol and high-salt concentrations remains a research focus. The screened strains have been subjected to various methods, including cell immobilization [45] and the incorporation of metal ions [46]. Bacillus species are resilient microorganisms that are typically capable of surviving in harsh environments. They produce polymers, such as EPS and γ-PGA, as a means of protecting themselves under stressful conditions, such as drought, cold temperatures, high or low pH levels, salt stress, and heat. Moreover, some Bacillus species demonstrate a remarkable tolerance to organic waste, including toxic and harmful substances like phenol [21,45,47,48,49]. In this study, our results indicated that B. paralicheniformis BL-1 is capable of simultaneously producing bioflocculants during the degradation of phenol under salt stress conditions. Although the γ-PGA productivity of BL-1 is not the highest compared to other reported Bacillus strains, to the best of our knowledge, the simultaneous production of γ-PGA and bioflocculant in phenol-containing wastewater has rarely been reported.
Investigation of the phenol degradation pathway indicated that the degradation of aromatic compounds is dominated by aerobic bacteria and fungi with the help of O2 by oxygenase, which form compounds such as catechol (1,2 dihydroxybenzene) as central intermediates in bacteria [50]. The prediction of the strain BL-1 genome indicated the presence of catechol pathway-related genes. Further differential gene expressions indicated the up-regulated expressions of catechol pathway genes in the presence of 500 mg/L phenol in 10% NaCl conditions, such as mphD (putative 2-keto-4-pentenoate hydratase encoding gene), dmpH (putative 4-oxalocrotonate decarboxylase encoding gene), catD and catE (two putative catechol-2,3-dioxygenase membrane subunit encoding genes) (Figure S5). This suggests that one possible mechanism of phenol degradation in strain BL-1 could be via the meta-cleavage pathway. Thus, it is of interest to determine the activity of catechol-2,3-dioxygenase under different saline stress conditions. Additionally, genome analysis has identified a potential laccase encoding gene, yfiH, that is involved in the degradation of phenol compounds [51]. The expression of yfiH slightly increased in the presence of 500 mg/L phenol, suggesting there might be some synergy between laccase and the catechol pathway-mediated phenol degradation in B. paralicheniformis BL-1.
Iron is one of the important metal elements in biology, playing a crucial role in electron transport, oxygen metabolism, and nucleotide synthesis [52]. Siderophore production and biofilm formation are necessary for iron homeostasis in B. subtilis [53]. The high salt-induced iron deficiency may explain defective biofilm formation and low EPS production, as observed in Figure S1. Consequently, the production of γ-PGA appears to be the primary mechanism employed by B. paralicheniformis BL-1 to cope with salinity stress. Feng et al. reported that high ferric ion concentration stress led to the enhanced production of γ-PGA with a lower molecular weight in B. licheniformis ATCC 9945a [54]. A similar phenomenon was also observed in B. licheniformis CGMCC 2876 [55]. In this study, we also noticed increased γ-PGA production in B. paralicheniformis BL-1 with the addition of extra Fe3+, suggesting that ferric ions likely have a similar effect on this strain.
Although the relief of salinity stress through the production of γ-PGA and EPS by alleviating iron starvation also benefited the phenol tolerance of B. paralicheniformis BL-1, we cannot rule out the possibility that the addition of ferric ions may directly contribute to the phenol tolerance of B. paralicheniformis BL-1. Dissolved Fe3+ could be directly anaerobically oxidized by phenol [56] or be required for the activity of catechol 2,3-dioxygenases in Bacillus spp. [57]. Sui et al. reported that phenolic compounds induce ferroptosis-like death by promoting hydroxyl radical generation [58], suggesting that improved growth benefited from alleviation of iron limitation may be related to a reduction in ROS stress. Thus, it would be interesting to elucidate the relationship between iron hemostasis and phenol tolerance.

5. Conclusions

In conclusion, we reported a novel strain, B. paralicheniformis BL-1, isolated from saline soil, which exhibits potential for producing bioflocculant in phenol-containing saline wastewater. Our results revealed that γ-PGA is the primary large biomolecule produced in response to salinity stress. Further analysis indicated that an excessive supply of iron enhanced cell growth, which, in turn, facilitated phenol removal and flocculating activity, both of which are growth-dependent processes. This study highlights the potential of B. paralicheniformis BL-1 as a promising candidate for the bioremediation of phenol-contaminated saline wastewaters.

Supplementary Materials

The following supporting information can be downloaded at: https://www.mdpi.com/article/10.3390/microbiolres16010023/s1, Figure S1: Colony and biofilm morphology of isolate BL-1. Colony morphology of isolate BL-1 is shown on (a) LB agar plate and (b) LB agar plate with 10% NaCl, as well as biofilm formation in (c) LB medium and (d) LB medium with 10% NaCl.; Figure S2: Genome features of B. paralicheniformis BL-1. (a) Distribution of GC content; (b) Percentage of annotated genes in the indicated databases; (c) distribution of predicted gene length predicted in the strain BL-1 genome; and (d) A Venn diagram showing the number of genes annotated in each database.; Figure S3: Phenol tolerance of B. paralicheniformis BL-1 under salinity stress conditions. An overnight culture of B. paralicheniformis BL-1 was used to inoculate 200 μL of SPSM medium at an OD600 of 0.05, with the indicated concentrations of NaCl and phenol. The cultures were incubated at 37 °C for 48 h. The OD600 was measured by Tecan microplate reader.; Figure S4: Down-regulation of EPS and biofilm formation related genes. Relative expression levels of EPS synthesis and biofilm formation-related genes under 0.5% NaCl (Ctrl) and 10% NaCl (Salt) conditions in SPSM containing 500 mg/L phenol. The bars represented the mean of three biological replicates, each with three technical replicates, and the error bars indicate the standard error of the mean (mean ± SD, n = 3).; Figure S5: Differential expression of genes related to phenol degradation. Relative expressions of catechol pathway genes and one laccase encoding gene were analyzed in SPSM with 10% NaCl supplemented with or without 500 mg/L phenol. The bars represented the mean of three biological replicates, each with three technical replicates, and the error bars indicate the standard error of the mean (mean ± SD, n = 3).; Table S1: Genome features of isolate BL-1; Table S2: Stimulated DNA-DNA hybridization performed by GGDC; Table S3: Primer list for RT-qPCR. Genomes of B. paralicheniformis BL-1 are available on NCBI (https://www.ncbi.nlm.nih.gov/) with accession number PRJNA1109274.

Author Contributions

Conceptualization of the project and design: L.Y., T.Z. and R.G. Strain isolation and phenotypic analysis: F.L., L.Z., L.L. and R.Z.; Sequencing data analysis: C.S. and J.Z.; Drafting the article or critically revising it for important intellectual content: L.Y., R.G. and F.D.; Critical analysis of data and reviewing manuscript: T.Z., R.G., F.L., L.Z., R.Z., C. S., J.Z., F.D. and L.Y. All authors have read and agreed to the published version of the manuscript.

Funding

This work was supported by the National Natural Science Foundation of China, under Grants [number: 31801102].

Institutional Review Board Statement

Not applicable.

Informed Consent Statement

Not applicable.

Data Availability Statement

Data are contained within the article and Supplementary Materials.

Conflicts of Interest

The authors declare that they have no known competing financial interests or personal relationships that could have appeared to influence the work reported in this paper.

References

  1. Grace Pavithra, K.; Sundar Rajan, P.; Arun, J.; Brindhadevi, K.; Hoang Le, Q.; Pugazhendhi, A. A review on recent advancements in extraction, removal and recovery of phenols from phenolic wastewater: Challenges and future outlook. Environ. Res. 2023, 237, 117005. [Google Scholar] [CrossRef] [PubMed]
  2. Phenol Market Size, Industry Share & Forecasts Report 2032. Available online: https://www.persistencemarketresearch.com/market-research/phenol-market.asp (accessed on 1 May 2022).
  3. Careghini, A.; Mastorgio, A.F.; Saponaro, S.; Sezenna, E. Bisphenol A, nonylphenols, benzophenones, and benzotriazoles in soils, groundwater, surface water, sediments, and food: A review. Environ. Sci. Pollut. Res. Int. 2015, 22, 5711–5741. [Google Scholar] [CrossRef] [PubMed]
  4. Luo, Y.; Guo, W.; Ngo, H.H.; Nghiem, L.D.; Hai, F.I.; Zhang, J.; Liang, S.; Wang, X.C. A review on the occurrence of micropollutants in the aquatic environment and their fate and removal during wastewater treatment. Sci. Total Environ. 2014, 473–474, 619–641. [Google Scholar] [CrossRef] [PubMed]
  5. Ahmaruzzaman, M.; Mishra, S.R.; Gadore, V.; Yadav, G.; Roy, S.; Bhattacharjee, B.; Bhuyan, A.; Hazarika, B.; Darabdhara, J.; Kumari, K. Phenolic compounds in water: From toxicity and source to sustainable solutions—An integrated review of removal methods, advanced technologies, cost analysis, and future prospects. J. Environ. Chem. Eng. 2024, 12, 112964. [Google Scholar] [CrossRef]
  6. Li, H.; Meng, F.; Duan, W.; Lin, Y.; Zheng, Y. Biodegradation of phenol in saline or hypersaline environments by bacteria: A review. Ecotoxicol. Environ. Saf. 2019, 184, 109658. [Google Scholar] [CrossRef]
  7. Viggor, S.; Joesaar, M.; Soares-Castro, P.; Ilmjarv, T.; Santos, P.M.; Kapley, A.; Kivisaar, M. Microbial metabolic potential of phenol degradation in wastewater treatment plant of crude oil refinery: Analysis of metagenomes and characterization of isolates. Microorganisms 2020, 8, 652. [Google Scholar] [CrossRef]
  8. Elmetwalli, A.; Allam, N.G.; Hassan, M.G.; Albalawi, A.N.; Shalaby, A.; El-Said, K.S.; Salama, A.F. Evaluation of Bacillus aryabhattai B8W22 peroxidase for phenol removal in waste water effluents. BMC Microbiol. 2023, 23, 119. [Google Scholar] [CrossRef]
  9. Chauhan, P.S.; Goradia, B.; Saxena, A. Bacterial laccase: Recent update on production, properties and industrial applications. 3 Biotech 2017, 7, 323. [Google Scholar] [CrossRef]
  10. Lefebvre, O.; Moletta, R. Treatment of organic pollution in industrial saline wastewater: A literature review. Water Res. 2006, 40, 3671–3682. [Google Scholar] [CrossRef]
  11. Zhao, Y.; Zhuang, X.; Ahmad, S.; Sung, S.; Ni, S.Q. Biotreatment of high-salinity wastewater: Current methods and future directions. World J. Microbiol. Biotechnol. 2020, 36, 37. [Google Scholar] [CrossRef]
  12. Castillo-Carvajal, L.C.; Sanz-Martin, J.L.; Barragan-Huerta, B.E. Biodegradation of organic pollutants in saline wastewater by halophilic microorganisms: A review. Environ. Sci. Pollut. Res. Int. 2014, 21, 9578–9588. [Google Scholar] [CrossRef] [PubMed]
  13. Zhao, Y.; Zeng, D.; Wang, H.; Sun, N.; Xin, J.; Yang, H.; Lei, L.; Khalique, A.; Rajput, D.S.; Pan, K.; et al. Analysis of miRNA Expression in the ileum of broiler chickens during Bacillus licheniformis H2 supplementation against subclinical necrotic enteritis. Probiotics Antimicrob. Proteins 2021, 13, 356–366. [Google Scholar] [CrossRef] [PubMed]
  14. Xiong, Y.; Wang, Y.; Yu, Y.; Li, Q.; Wang, H.; Chen, R.; He, N. Production and characterization of a novel bioflocculant from Bacillus licheniformis. Appl. Environ. Microbiol. 2010, 76, 2778–2782. [Google Scholar] [CrossRef]
  15. Li, Z.; Zhong, S.; Lei, H.Y.; Chen, R.W.; Yu, Q.; Li, H.L. Production of a novel bioflocculant by Bacillus licheniformis X14 and its application to low temperature drinking water treatment. Bioresour. Technol. 2009, 100, 3650–3656. [Google Scholar] [CrossRef]
  16. Dermlim, W.; Prasertsan, P.; Doelle, H. Screening and characterization of bioflocculant produced by isolated Klebsiella sp. Appl. Microbiol. Biotechnol. 1999, 52, 698–703. [Google Scholar] [CrossRef]
  17. Luo, Z.; Guo, Y.; Liu, J.; Qiu, H.; Zhao, M.; Zou, W.; Li, S. Microbial synthesis of poly-gamma-glutamic acid: Current progress, challenges, and future perspectives. Biotechnol. Biofuels. 2016, 9, 134. [Google Scholar] [CrossRef]
  18. Halmschlag, B.; Putri, S.P.; Fukusaki, E.; Blank, L.M. Poly-gamma-glutamic acid production by Bacillus subtilis 168 using glucose as the sole carbon source: A metabolomic analysis. J. Biosci. Bioeng. 2020, 130, 272–282. [Google Scholar] [CrossRef]
  19. Li, J.; Yun, Y.Q.; Xing, L.; Song, L. Novel bioflocculant produced by salt-tolerant, alkaliphilic strain Oceanobacillus polygoni HG6 and its application in tannery wastewater treatment. Biosci. Biotechnol. Biochem. 2017, 81, 1018–1025. [Google Scholar] [CrossRef]
  20. Wei, X.; Ji, Z.; Chen, S. Isolation of halotolerant Bacillus licheniformis WX-02 and regulatory effects of sodium chloride on yield and molecular sizes of poly-gamma-glutamic acid. Appl. Biochem. Biotechnol. 2010, 160, 1332–1340. [Google Scholar] [CrossRef]
  21. Banerjee, A.; Ghoshal, A.K. Phenol degradation by Bacillus cereus: Pathway and kinetic modeling. Bioresour. Technol. 2010, 101, 5501–5507. [Google Scholar] [CrossRef]
  22. Yu, L.; Zhang, T.; Yang, J.; Zhang, R.; Zhou, J.; Ding, F.; Shao, C.; Guo, R. Isolation of a novel multiple-heavy metal resistant Lampropedia aestuarii GYF-1 and investigation of its bioremediation potential. BMC Microbiol. 2023, 23, 330. [Google Scholar] [CrossRef] [PubMed]
  23. Bankevich, A.; Nurk, S.; Antipov, D.; Gurevich, A.A.; Dvorkin, M.; Kulikov, A.S.; Lesin, V.M.; Nikolenko, S.I.; Pham, S.; Prjibelski, A.D.; et al. SPAdes: A new genome assembly algorithm and its applications to single-cell sequencing. J. Comput. Biol. 2012, 19, 455–477. [Google Scholar] [CrossRef] [PubMed]
  24. Nadalin, F.; Vezzi, F.; Policriti, A. GapFiller: A de novo assembly approach to fill the gap within paired reads. BMC Bioinform. 2012, 13 (Suppl. S14), S8. [Google Scholar] [CrossRef]
  25. Massouras, A.; Hens, K.; Gubelmann, C.; Uplekar, S.; Decouttere, F.; Rougemont, J.; Cole, S.T.; Deplancke, B. Primer-initiated sequence synthesis to detect and assemble structural variants. Nat. Methods 2010, 7, 485–486. [Google Scholar] [CrossRef]
  26. Tarailo-Graovac, M.; Chen, N. Using RepeatMasker to identify repetitive elements in genomic sequences. Curr. Protoc. Bioinform. 2009, 25, 4–10. [Google Scholar] [CrossRef]
  27. Galperin, M.Y.; Kristensen, D.M.; Makarova, K.S.; Wolf, Y.I.; Koonin, E.V. Microbial genome analysis: The COG approach. Brief. Bioinform. 2019, 20, 1063–1070. [Google Scholar] [CrossRef]
  28. Bairoch, A.; Apweiler, R. The SWISS-PROT protein sequence database and its supplement TrEMBL in 2000. Nucleic Acids Res. 2000, 28, 45–48. [Google Scholar] [CrossRef]
  29. Mistry, J.; Chuguransky, S.; Williams, L.; Qureshi, M.; Salazar, G.A.; Sonnhammer, E.L.L.; Tosatto, S.C.E.; Paladin, L.; Raj, S.; Richardson, L.J.; et al. Pfam: The protein families database in 2021. Nucleic Acids Res. 2021, 49, D412–D419. [Google Scholar] [CrossRef]
  30. Lu, S.; Wang, J.; Chitsaz, F.; Derbyshire, M.K.; Geer, R.C.; Gonzales, N.R.; Gwadz, M.; Hurwitz, D.I.; Marchler, G.H.; Song, J.S.; et al. CDD/SPARCLE: The conserved domain database in 2020. Nucleic Acids Res. 2020, 48, D265–D268. [Google Scholar] [CrossRef]
  31. Ogata, H.; Goto, S.; Sato, K.; Fujibuchi, W.; Bono, H.; Kanehisa, M. KEGG: Kyoto Encyclopedia of Genes and Genomes. Nucleic Acids Res. 1999, 27, 29–34. [Google Scholar] [CrossRef]
  32. Pruitt, K.D.; Tatusova, T.; Brown, G.R.; Maglott, D.R. NCBI Reference Sequences (RefSeq): Current status, new features and genome annotation policy. Nucleic Acids Res. 2012, 40, D130–D135. [Google Scholar] [CrossRef] [PubMed]
  33. Ashburner, M.; Ball, C.A.; Blake, J.A.; Botstein, D.; Butler, H.; Cherry, J.M.; Davis, A.P.; Dolinski, K.; Dwight, S.S.; Eppig, J.T.; et al. Gene ontology: Tool for the unification of biology. The Gene Ontology Consortium. Nat. Genet. 2000, 25, 25–29. [Google Scholar] [CrossRef] [PubMed]
  34. Grant, J.R.; Enns, E.; Marinier, E.; Mandal, A.; Herman, E.K.; Chen, C.Y.; Graham, M.; Van Domselaar, G.; Stothard, P. Proksee: In-depth characterization and visualization of bacterial genomes. Nucleic Acids Res. 2023, 51, W484–W492. [Google Scholar] [CrossRef]
  35. Larkin, M.A.; Blackshields, G.; Brown, N.P.; Chenna, R.; McGettigan, P.A.; McWilliam, H.; Valentin, F.; Wallace, I.M.; Wilm, A.; Lopez, R.; et al. Clustal W and Clustal X version 2.0. Bioinformatics 2007, 23, 2947–2948. [Google Scholar] [CrossRef]
  36. Kumar, S.; Stecher, G.; Tamura, K. MEGA7: Molecular Evolutionary Genetics Analysis version 7.0 for bigger datasets. Mol. Biol. Evol. 2016, 33, 1870–1874. [Google Scholar] [CrossRef]
  37. Meier-Kolthoff, J.P.; Carbasse, J.S.; Peinado-Olarte, R.L.; Goker, M. TYGS and LPSN: A database tandem for fast and reliable genome-based classification and nomenclature of prokaryotes. Nucleic Acids Res. 2022, 50, D801–D807. [Google Scholar] [CrossRef]
  38. Liu, Y.; Stefanic, P.; Miao, Y.; Xue, Y.; Xun, W.; Zhang, N.; Shen, Q.; Zhang, R.; Xu, Z.; Mandic-Mulec, I. Housekeeping gene gyrA, a potential molecular marker for Bacillus ecology study. AMB Express 2022, 12, 133. [Google Scholar] [CrossRef]
  39. Chris Felshia, S.; Aswin Karthick, N.; Thilagam, R.; Chandralekha, A.; Raghavarao, K.; Gnanamani, A. Efficacy of free and encapsulated Bacillus lichenformis strain SL10 on degradation of phenol: A comparative study of degradation kinetics. J. Environ. Manag. 2017, 197, 373–383. [Google Scholar] [CrossRef]
  40. Wei, X.; Chen, Z.; Liu, A.; Yang, L.; Xu, Y.; Cao, M.; He, N. Advanced strategies for metabolic engineering of Bacillus to produce extracellular polymeric substances. Biotechnol. Adv. 2023, 67, 108199. [Google Scholar] [CrossRef]
  41. Hoffmann, T.; Schutz, A.; Brosius, M.; Volker, A.; Volker, U.; Bremer, E. High-salinity-induced iron limitation in Bacillus subtilis. J. Bacteriol. 2002, 184, 718–727. [Google Scholar] [CrossRef]
  42. Achak, M.; Elayadi, F.; Boumya, W. Chemical coagulation/flocculation processes for femoval of phenolic compounds from olive mill wastewater: A comprehensive review. Am. J. Appl. Sci. 2019, 16, 59–91. [Google Scholar] [CrossRef]
  43. Shahadat, M.; Teng, T.T.; Rafatullah, M.; Shaikh, Z.A.; Sreekrishnan, T.R.; Ali, S.W. Bacterial bioflocculants: A review of recent advances and perspectives. Chem. Eng. J. 2017, 328, 1139–1152. [Google Scholar] [CrossRef]
  44. Gong, Y.; Ding, P.; Xu, M.J.; Zhang, C.M.; Xing, K.; Qin, S. Biodegradation of phenol by a halotolerant versatile yeast Candida tropicalis SDP-1 in wastewater and soil under high salinity conditions. J. Environ. Manag. 2021, 289, 112525. [Google Scholar] [CrossRef] [PubMed]
  45. Zhou, X.; Liang, M.; Zheng, Y.; Zhang, J.; Liang, J. Sustained degradation of phenol under extreme conditions by polyurethane-based Bacillus sp. ZWB3. Water Sci. Technol. 2023, 88, 1194–1206. [Google Scholar] [CrossRef]
  46. Zhang, J.; Bing, W.; Hu, T.; Zhou, X.; Zhang, J.; Liang, J.; Li, Y. Enhanced biodegradation of phenol by microbial collaboration: Resistance, metabolite utilization, and pH stabilization. Environ. Res. 2023, 238, 117269. [Google Scholar] [CrossRef]
  47. Wu, S.; Zhong, J.; Lei, Q.; Song, H.; Chen, S.F.; Wahla, A.Q.; Bhatt, K.; Chen, S. New roles for Bacillus thuringiensis in the removal of environmental pollutants. Environ. Res. 2023, 236, 116699. [Google Scholar] [CrossRef]
  48. Wrobel, M.; Sliwakowski, W.; Kowalczyk, P.; Kramkowski, K.; Dobrzynski, J. Bioremediation of heavy metals by the genus Bacillus. Int. J. Environ. Res. Public. Health 2023, 20, 4964. [Google Scholar] [CrossRef]
  49. Hasan, S.A.; Jabeen, S. Degradation kinetics and pathway of phenol by Pseudomonas and Bacillus species. Biotechnol. Biotechnol. Equip. 2015, 29, 45–53. [Google Scholar] [CrossRef]
  50. Fuchs, G.; Boll, M.; Heider, J. Microbial degradation of aromatic compounds—From one strategy to four. Nat. Rev. Microbiol. 2011, 9, 803–816. [Google Scholar] [CrossRef]
  51. Xia, T.T.; Feng, M.; Liu, C.L.; Liu, C.Z.; Guo, C. Efficient phenol degradation by laccase immobilized on functional magnetic nanoparticles in fixed bed reactor under high-gradient magnetic field. Eng. Life Sci. 2021, 21, 374–381. [Google Scholar] [CrossRef]
  52. Zhang, S.; Deng, Z.; Borham, A.; Ma, Y.; Wang, Y.; Hu, J.; Wang, J.; Bohu, T. Significance of soil siderophore-producing bacteria in evaluation and elevation of crop yield. Horticulturae 2023, 9, 370. [Google Scholar] [CrossRef]
  53. Rizzi, A.; Roy, S.; Bellenger, J.P.; Beauregard, P.B. Iron homeostasis in Bacillus subtilis requires siderophore production and biofilm formation. Appl. Environ. Microbiol. 2019, 85, e02439-18. [Google Scholar] [CrossRef] [PubMed]
  54. Feng, J.; Shi, Q.; Zhou, G.; Wang, L.; Chen, A.; Xie, X.; Huang, X.; Hu, W. Improved production of poly-γ-glutamic acid with low molecular weight under high ferric ion concentration stress in Bacillus licheniformis ATCC 9945a. Process Biochem. 2017, 56, 30–36. [Google Scholar] [CrossRef]
  55. Wei, X.; Yang, L.; Chen, Z.; Xia, W.; Chen, Y.; Cao, M.; He, N. Molecular weight control of poly-gamma-glutamic acid reveals novel insights into extracellular polymeric substance synthesis in Bacillus licheniformis. Biotechnol. Biofuels. 2024, 17, 60. [Google Scholar] [CrossRef]
  56. Lovley, D.R.; Lonergan, D.J. Anaerobic oxidation of toluene, phenol, and p-cresol by the dissimilatory iron-reducing organism, GS-15. Appl. Environ. Microbiol. 1990, 56, 1858–1864. [Google Scholar] [CrossRef]
  57. Adewale, P.; Lang, A.; Huang, F.; Zhu, D.; Sun, J.; Ngadi, M.; Yang, T.C. A novel Bacillus ligniniphilus catechol 2,3-dioxygenase shows unique substrate preference and metal requirement. Sci. Rep. 2021, 11, 23982. [Google Scholar] [CrossRef]
  58. Sui, X.; Wang, J.; Zhao, Z.; Liu, B.; Liu, M.; Liu, M.; Shi, C.; Feng, X.; Fu, Y.; Shi, D.; et al. Phenolic compounds induce ferroptosis-like death by promoting hydroxyl radical generation in the Fenton reaction. Commun. Biol. 2024, 7, 199. [Google Scholar] [CrossRef]
Figure 1. Growth and flocculation rate of B. paralicheniformis BL-1 in saline LB medium. Overnight culture of B. paralicheniformis BL-1 was inoculated into 50 mL of LB medium at OD600 of 0.05 with indicated NaCl concentration at 37 °C. The (a) OD600 and (b) flocculating activity were measured at indicated time. Different letters above the columns indicate significant difference between the seven NaCl concentrations at the same sampling time point as determined by two-tailed t-test (p < 0.05). Bars without letters indicated no significant difference. Bars with error bars represent means ± SD (n = 3).
Microbiolres 16 00023 g001
Figure 2. Identification of B. paralicheniformis BL-1. (a) Phylogenetic analysis of B. paralicheniformis BL-1 based on gyrA sequences. B. paralicheniformis BL-1 is highlight in red font (b) Draft genome of B. paralichenmiformis BL-1 performed with Proksee. From the outside to the center, ring 1 and ring 7 in purple show coding sequences, tRNA, rRNA, repeat region, and tmRNA on both the forward and reverse strand. Ring 2 and ring 4 in blue represent ORFs, with strand orientation indicated. The ring 3 in dark grey and light grey shows all the scaffolds. Ring 5 in black shows GC content, and ring 6 in green or rose red shows GC skew.
Microbiolres 16 00023 g002
Figure 3. Growth of B. paralicheniformis BL-1 in synthetic phenol saline wastewater. An overnight culture of B. paralicheniformis BL-1 was inoculated at an OD600 of 0.05 into 50 mL of SPSM medium with 500 mg/L phenol and 0.5% (dark grey line) or 10% (light grey line) NaCl con-centration, at 37 °C. The (a) OD600, (b) residual phenol concentration, and (c) flocculating activity was measured at indicated time.
Microbiolres 16 00023 g003
Figure 4. Response of γ-PGA biosynthesis to salinity stress Relative expressions of (a) glutamate synthesis pathways and (b) γ-PGA biosynthesis related genes between 0.5% NaCl (Ctrl) and 10% NaCl (Salt) in SPSM with 500 mg/L phenol are shown. (c) The comparison of γ-PGA production between 0.5% NaCl (Ctrl) and 10% NaCl (Salt) condition in SPSM with 500 mg/L of phenol is presented. The bars represented the mean of three biological replicates, each with three technical replicates, and the error bars represent the standard error of the mean (mean ± SD, n = 3). Significant differences were determined using a two-tailed t-test as shown as: * above the columns, p < 0.01.
Microbiolres 16 00023 g004
Figure 5. Regulation of iron homeostasis-related genes responses to salinity stress. Relative expressions of (a) iron transporter encoding genes, (b) the dbhABCEF operon, and (c) aerobactin producing genes between 0.5% NaCl (Ctrl) and 10% NaCl (Salt) in SPSM with 500 mg/L phenol are shown. The bars represented the mean of three biological replicates with three technical replicates of each and the error bars the standard error of the mean (mean ± SD, n = 3). Significant differences were calculated using two-tailed t-test as shown as: * above the columns, p < 0.01.
Microbiolres 16 00023 g005
Figure 6. Growth of salt-stressed B. paralicheniformis BL-1 in the presence of excess iron. An overnight culture of B. paralicheniformis BL-1 was inoculated into SPSM medium at an OD600 of 0.05 containing 500 mg/L phenol and the indicated NaCl and FeCl3 concentration, and incubated at 37 °C. The (a) OD600, (b) residual phenol concentration, and (c) flocculating activity was measured at indicated time with three replicates. Different letters above the columns indicate significant differences at the same sampling time point, as determined by a two-tailed t-test (p < 0.05). Bars not sharing any letter means no significant difference. Bars with error bars represent means ± SD.
Microbiolres 16 00023 g006
Figure 7. Production of γ-PGA in synthetic phenol saline wastewater. An overnight culture of B. paralicheniformis BL-1 was inoculated into SPSM medium at OD600 of 0.05 with 500 mg/L phenol and the indicated NaCl and FeCl3 concentration, and incubated at 37 °C. The γ-PGA was extracted and purified using the CTAB method with three replicates. Different letters a, b, c, ac, above the columns indicate statistically significant differences as deter-mined by two-tailed t-test (p < 0.05).
Microbiolres 16 00023 g007
Table 1. Phenol tolerance of B. paralicheniformis BL-1 in synthetic phenol saline wastewater.
Phenol (mg/L)0200400600800100012001400160018002000
0.5% NaCl+++ a+++ a+++ a+++ a+++ a+++ a+++ a+++ a+++ a++ a/ b
10% NaCl+++ a++ b+++ b++ b+ b+ b/ b/ b/ b/ b/ b
‘/’ means OD600 < 0.1; ‘+’ means OD600 < 0.2; ‘++’ means 0.2 < OD600 < 0.4; ‘+++’ means OD600 > 0.4, respectively, after 72 h aerobic incubation at 37 °C. An overnight-grown seed culture in SPSM medium containing 0.5% NaCl was inoculated into 50 mL of phenol saline SPSM medium as indicated at an OD600 of 0.05 with three replicates (n = 3). Lower case superscript letters (within each column for a given phenol concentration) indicate significant difference between the two NaCl concentrations as determined by two-tailed t-test (p < 0.05).
Disclaimer/Publisher’s Note: The statements, opinions and data contained in all publications are solely those of the individual author(s) and contributor(s) and not of MDPI and/or the editor(s). MDPI and/or the editor(s) disclaim responsibility for any injury to people or property resulting from any ideas, methods, instructions or products referred to in the content.

