Abstract
Colorectal cancer (CRC) is the third most commonly diagnosed cancer globally, and is a significant contributor to both morbidity and mortality rates. Emerging research has promptly highlighted the potential role of the gut microbiome in the development and progression of CRC. This study aims to investigate the differences in gut microbiota between CRC patients and healthy individuals in Iraq, using 16S rRNA metagenomic sequencing on Illumina NovaSeq (PE250-Seq). A total of 21 stool samples were analyzed: 12 from early-stage CRC patients and nine from healthy controls. Bacterial DNA was extracted, followed by 16S rRNA amplicon sequencing to profile the microbial communities. The results indicated significant differences between the fecal microbiome of the two groups. Remarkably, CRC patients exhibited a marked reduction in Bacteroidota and an increase in Verrucomicrobiota compared to healthy controls. At the genus level, Prevotella, Faecalibacterium, Roseburia, Barnesiella, Eubacterium Lachnospiraceae_UCG_004, and Lachnospira were significantly less abundant in CRC patients compared to the healthy individuals, while Actinomyces, Monoglobus, Desulfovibrio, Akkermansia, and Bacteroides were highly enriched. In addition, diversity analyses further indicated decreased α-diversity and distinct β-diversity patterns in the CRC patients, suggesting significant shifts in the gut microbial composition. These findings underscore the potential of microbiome-based diagnostics and therapeutic strategies, with microbial alterations serving as biomarkers for CRC diagnosis. Further research needs to focus on elucidating the causal relationships and therapeutic potential of these microbiome changes in CRC management.
1. Introduction
Cancer was responsible for approximately 10 million deaths worldwide in 2020, making it the first or second most common cause of mortality before the age of 70 years in 112 of 183 countries []. It is characterized by the dysfunction and dysregulation of cell division in body fluids and specific tissues, leading to uncontrolled cellular proliferation that can invade neighboring tissues []. Colorectal cancer (CRC) is the third most diagnosed cancer, accounting for 6.1% of diagnoses, and is the second leading cause of cancer-related mortality, responsible for 9.2% of deaths []. Risk factors for CRC include a family and genetic history of cancer or related issues such as colon polyps, inflammatory bowel diseases, diabetes mellitus, undergoing cholecystectomy, and various lifestyle factors. Evidence suggests that CRC risk is also heightened by being overweight or obese, lack of physical activity, cigarette smoking, alcohol consumption, and poor dietary habits (low in fiber, fruits, vegetables, calcium, and dairy products, and high in processed food and red meats) [,]. Recent studies have reported that additional factors such as the gut microbiome, age, gender, race, and socioeconomic status also influence colorectal cancer risk [,]. The gut microbiome consists of a diverse and abundant population of bacteria [], maturing into a stable microbiome over 2 to 3 years []. It is estimated that the human gut harbors around 40 trillion different types of microorganisms [], with the colon being the most densely populated area of the digestive system, housing approximately 70% of the human microbiota []. In its balanced state (eubiosis), the microbiome performs numerous essential functions, such as aiding digestion, producing vitamins, and regulating the immune response []. Conversely, an imbalance (dysbiosis) can deteriorate health and lead to severe infections and metabolic disorders [,,,], including colorectal cancer []. Dysbiosis occurs when the gut loses beneficial bacteria and becomes populated with harmful bacteria that promote cancer-related behaviors such as angiogenesis, reduced apoptosis, and increased cell proliferation. Thus, the composition of the microbiome significantly impacts tumor formation in the colon [,].
Recent studies in Iraq have reported that the number of cancers significantly increased over the last 10 years [], and colorectal carcinoma has been documented as the most common among middle aged groups in Misan []. To our knowledge, this is the first study aiming to investigate the gut bacteria taxa in healthy subjects and CRC patients and the impact of gut microbiome differences between these two groups using metagenomic of 16S rRNA sequencing.
2. Materials and Methods
2.1. Sample Collection and Standards
In this study, 21 indoor stool samples were collected from participants aged 40 and 60 years in the Maysan Governorate, Iraq, from September 2023 to January 2024. Twelve stool samples were collected after the first dose of chemotherapy from patients diagnosed with colorectal cancer (CRC) by an oncologist from the oncology department of Al-Sader Teaching Hospital in the Maysan Governorate, and another nine samples from healthy volunteers in the same city were collected for comparison.
2.2. Including & Excluding Criteria for Diagnosis
Patients with CRC were investigated and included in this study by the oncologists and physicians at Al-Shifaa Oncology Center, Al-Sadder Teaching Hospital, Misan city. The criteria that have been excluded including the following: a history of chronic diseases such as hypertension, diabetes, renal failure, irritable bowel syndrome, and familial history of CRC, or recent use of antibiotics, anti-inflammatory drugs, probiotics, prebiotics, radiotherapy, and chemotherapy within the past month prior to stool sample collection.
2.3. Ethics Statement and Consent Form
The approval for conducting this study was provided by the Ethical Committee of Misan Health Research Ethics at the Misan Health Directorate Training & Human Development Center (No.: 3369, date 20 September 2023). This study was conducted in accordance with the local legislation and institutional requirements of a research protocol, as per the Ministry of Health Republic of Iraq (Form number 02/2021). Written informed consent was requested from each participant in accordance with the local and national legislation and institutional requirements.
2.4. Bacterial DNA Extraction and 16S rRNA Sequencing
During a short time in the early morning and under cold conditions, indoor stool samples were collected. Around 220 mg of each individual’s stool sample was used for bacterial DNA extraction using the QIAamp® PowerFecal® Pro DNA Kit (QIAGEN, Hilden, Germany) following the manufacturer’s protocol.
Purified bacterial DNA were sent for next-generation sequencing (NGS)-based 16S Amplicon Sequencing on an Illumina NovaSeq (PE250-Seq) instrument with 2 × 300 base paired-end reads from BMKGENE Biomarker Technologies (Hong Kong) Company Limited, China (www.bmkgene.com). The universal primers of the 16S rRNA genes were used to amplify the V3–V4 hypervariable regions. The raw sequences were processed with QIIME2 as described previously [,,], with using 242 as the truncation length and both 20 trims in DADA2 [] and use Silva 138 SSURef NR99 515F/806R region taxonomy for precise bacterial taxonomic classification [].
2.5. Statistical Analysis
The data were normalized for each sample and the relative abundance is presented as mean ± SEM. Differences within and between groups were assessed using the SRplot tool (https://www.bioinformatics.com.cn/srplot, accessed on 20 June 2024). Stack bars with fill were used to visualize the relative abundance of the taxa and the Wilcox test was used to compare the ratios of two taxa between the groups. The alpha and beta diversities and Heat tree analysis of the microbial communities were assessed using several methods available from MicrobiomeAnalyst (https://www.microbiomeanalyst.ca/, accessed on 1 May 2024). A p value of <0.05 was considered significant.
3. Results
3.1. Basic Statistics of Sequence Reads in Stool Samples
Basic statistics for the number of reads and clusters of similar sequences from stool samples of 22 participants: 9 healthy and 12 colorectal cancer (CRC) patients were analyzed using QIIME II software. Initially, the total number of reads was 1,439,888 for the healthy group and 1,920,681 for the CRC group. Good quality reads were overlapped to merge paired reads of each individual samples. These sequences were then assigned and filtered to remove uncombinable read pairs, resulting in a total of 1,708,083 combined reads: 1,082,877 from CRC patients and a total of 1,139,200 combined reads from healthy volunteers (Table 1). Using these combined readings, the final analysis of each individual sample was performed.

Table 1.
Basic statistic reads of quality control for sequence data processing of healthy control (A) and CRC participants (B).
3.2. Phylogenetic Composition and Relative Abundance
A total of 451 taxa from 11 phyla (Actinobacteriota, Bacteroidota, Cyanobacteria, Desulfobacterota, Elusimicrobiota, Firmicutes, Fusobacteriota, Patescibacteria, Proteobacteria, Synergistota, and Verrucomicrobiota), encompassing 182 genera. The composition and abundance of the gut microbiome differed significantly between healthy individuals and those with colorectal cancer (CRC).
The analysis of gut microbiota at the phylum level is illustrated in Figure 1 and Appendix A. Figure 1a shows that Firmicutes was the predominant phylum, representing 55.68% in healthy individuals and 62.09% in patients with CRC. This was followed by Bacteroidota, which comprised 36.25% in healthy participants and only 16.94% in CRC patients. The less abundant phyla were Actinobacteriota (4.89% in healthy individuals and 9.29% in CRC patients), Proteobacteria (2.55% in healthy individuals and 6.33% in CRC patients), and Verrucomicrobiota (0.00% in healthy individuals and 3.89% in CRC patients). Additionally, less than 1% of other phyla were observed in both groups. The proportion of Bacteroidota was significantly reduced in CRC patients compared to healthy controls, while the abundance of Verrucomicrobiota was significantly increased (Figure 1b). Figure 1c illustrates that the ratio of Firmicutes to Bacteroidota was higher in CRC patients compared to healthy individuals, whereas the ratio of Bacteroidota to both Actinobacteriota and Proteobacteria was lower in CRC patients.
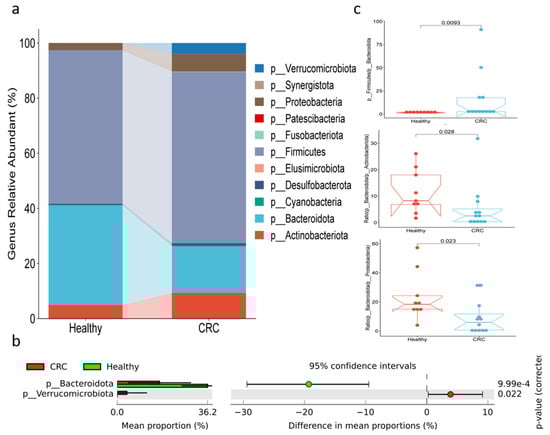
Figure 1.
Bacterial compositions at phylum level in fecal samples of healthy and CRC patients. (a) The relative abundance, (b) differences in abundance, and (c) the ratios among phyla.
At the genus level, as illustrated in the details in Figure 2, Prevotella (26.6%) was the most prevalent in healthy individuals, followed by Faecalibacterium (12.2%). In contrast, these genera were significantly less abundant in individuals with colorectal cancer (CRC), where their prevalence dropped to approximately 7.5%. Other genera, such as Bacteroides, Bifidobacterium, and Streptococcus, were found in lower amounts in CRC patients, around 4.7%, compared to their proportions in healthy individuals (3.4% Bacteroides, 2.1% Bifidobacterium, and 0.4% Streptococcus). Akkermansia was present in 3.8% of CRC patients, but was absent in healthy subjects. Conversely, in healthy individuals, genera like Dialister (3.3%), Mitsuokella (2.5%), Agathobacter (2.1%), and Alloprevotella (2.1%) were more abundant compared to CRC patients, where their proportions were reduced by at least half. Genera with less than 1% abundance were not included in (Figure 2a). The abundance of Prevotella, Faecalibacterium, and Mitsuokella was significantly reduced in CRC patients compared to healthy individuals. On the other hand, the levels of Eggerthella, Eubacterium hallii group, Blautia, Christensenellaceae R-7 group, Clostridia UCG-014, and Akkermansia were significantly elevated in CRC patients (Figure 2b). Figure 2c illustrates that the ratios of Prevotella to Blautia and the Christensenellaceae R-7 group, as well as the ratio of Prevotella to Bacteroides, were significantly reduced in CRC patients compared to healthy individuals.
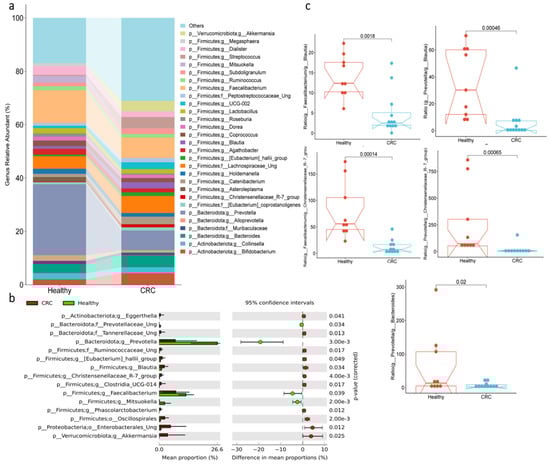
Figure 2.
Bacterial compositions at genus level in fecal samples of healthy and CRC subjects. (a) The relative abundance, (b) differences in abundance, and (c) the ratios among families.
3.3. Microbial Shifts Associated with Colorectal Cancer Detected by Metacoder Tree Analysis
The analysis of microbial taxa using the Metacoder Tree revealed significant reductions in various taxa between colorectal cancer (CRC) patients and healthy controls, spanning from the phylum to the genus level (Figure 3). Within the Bacteroidota phylum (p = 0.003), remarkable reductions were observed at multiple taxonomic levels: Bacteroidia class (p = 0.003), Bacteroidales order (p = 0.002), and the families Prevotellaceae (p = 0.001) and Barnesiellaceae (p = 0.021). Specifically, the genera Barnesiella (p = 0.008) and Prevotella (p = 0.002) within these families showed significant decreases. Although no significant change was detected at the phylum level for Firmicutes, several taxa at different levels within this phylum exhibited substantial reductions. These include the Negativicutes class (p = 0.006), the Veillonellales_Selenomonadales order (p = 0.005), and the families Veillonellaceae (p = 0.009) and Selenomonadaceae (p = 0.003). Within the Selenomonadaceae family, the genus Mitsuokella (p = 0.001) was notably reduced. Additionally, in the Clostridia class, five genera showed significant reductions, particularly within the Lachnospiraceae family of the Lachnospirales order. These include the Eubacterium eligens group (p = 0.016), Coprococcus (p = 0.021), Lachnospira (p = 0.006), and Lachnospiraceae UCG 004 (p = 0.013). The genus Faecalibacterium (p = 0.019) from the Ruminococcaceae family in the Oscillospirales order also showed a significant reduction. In the Bacilli class, a notable decrease was observed in the genus Asteroleplasma (p = 0.049) from the Erysipelatoclostridiaceae family in the Erysipelotrichales order. In addition, within the Proteobacteria phylum, the genus Sutterella (p = 0.004) from the Sutterellaceae family (p = 0.004) and the Burkholderiales order (p = 0.002) was significantly reduced.
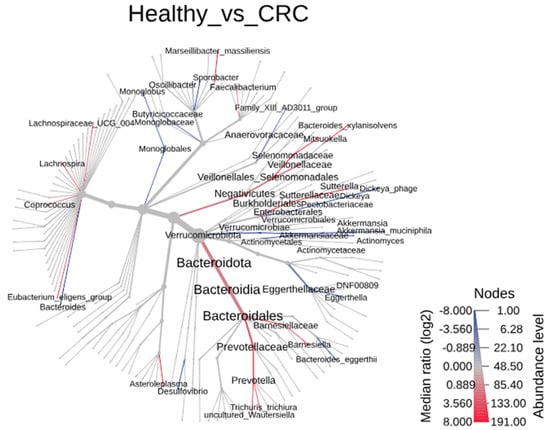
Figure 3.
The heat tree analysis of microbial taxa showing the taxonomic differences of fecal microbiota between CRC subjects and healthy controls using Metacoder.
In contrast, several taxa showed significant increases at various levels in patients with CRC compared to the healthy controls. Notably, within the Firmicutes phylum and Clostridia class, three genera exhibited marked increases across different orders. These include Monoglobus (p = 0.018) from the Monoglobaceae family in the Monoglobales order (p = 0.019), Sporobacter (p = 0.013) from the Oscillospiraceae family in the Oscillospirales order, and the Family_XIII_AD3011_group (p = 0.011) from the Anaerovoracaceae family in the Peptostreptococcales-Tissierellales order (p = 0.017).
Moreover, significant increases were observed in genera from various phyla and classes. Bacteroides (p = 0.032) from the Bacteroidaceae family (p = 0.014) within the Bacteroidales order of the Bacteroidia class in the Bacteroidota phylum showed an increase. Similarly, Eggerthella (p = 0.027) from the Eggerthellaceae family in the Coriobacteriales order of the Coriobacteriia class within the Actinobacteriota phylum was elevated. Additionally, Dickeya (p = 0.014) from the Pectobacteriaceae family (p = 0.014) in the Enterobacterales order (p = 0.042) of the Gammaproteobacteria class within the Proteobacteria phylum was increased. Finally, Akkermansia (p = 0.005) from the Akkermansiaceae family (p = 0.006) in the Verrucomicrobiales order (p = 0.006) of the Verrucomicrobiae class (p = 0.003) within the Verrucomicrobiota phylum (p = 0.017) also demonstrated a significant rise.
3.4. The Diversity of the Bacterial Communities
The diversity of taxa between healthy individuals and those with CRC was analyzed using both α-diversity and β-diversity metrics. For α-diversity, metrics such as the observed features, Pielou evenness, and doubles showed significant reductions in CRC patients compared to healthy individuals. However, the Shannon, Chao1, and Simpson indices did not reveal any notable differences between the two groups (Figure 4a). For β-diversity, bacterial community differences between CRC patients and healthy individuals were assessed using the Bray–Curtis index, the Jaccard index, and the Jensen–Shannon divergence (Figure 4b). In all three β-diversity measures, there was a clear clustering of healthy individuals, with distinct separation from CRC patients in the distance matrices.
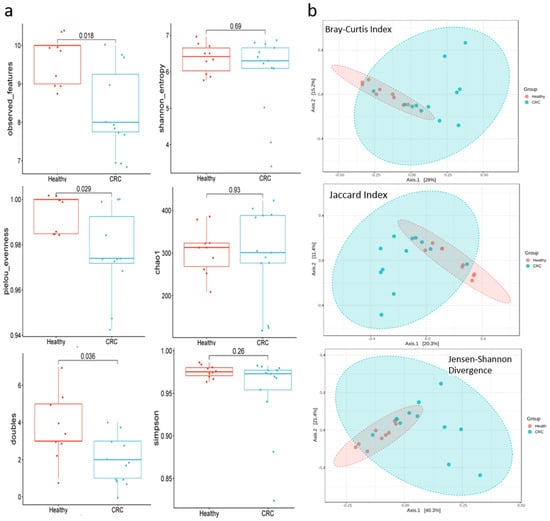
Figure 4.
The α- and β-diversity of bacteria communities, along with the differential abundance of taxa based on balance metrics, were compared between healthy individuals and CRC patients. (a) Alpha Diversity of Colorectal cancer (CRC) patients exhibit lower species richness (Observed Features), evenness (Pielou’s Evenness), and “doubles” metrics compared to healthy individuals. However, similar Alpha diversity of the Shannon, Simpson, and Chao1 indices show no significant differences between the two groups. A p value of <0.05 was considered significant. (b) Beta Diversity: PCoA plots illustrate between-sample diversity using three distance metrics (Bray-Curtis, Jaccard Index, and Jensen-Shannon Divergence). Healthy individuals (red) display a distinct, narrower clustering pattern, indicating a more consistent microbial community structure. In contrast, CRC patients (blue) show a clear separation, highlighting the divergent microbiome composition associated with CRC.
4. Discussion
Research on the microbiome, particularly gut microbiome, and its vital role in human health is underrepresented among Iraq Iraqi academics and researchers. Previously, the gut microbiota was referred to the “forgotten organ” of the human body [], the direct and indirect impact of the gut microbiome on health and diseases is still not fully understood by Iraqi experts and scientists. Therefore, this study was the first to describe the structure and composition of gut microbiota in healthy individuals and CRC patients in Iraq.
In this study, Firmicutes was the predominant phylum, followed by Bacteroidota, while other phyla were much less abundant in both participant groups. Although an increase in Firmicutes was observed in CRC patients, this difference was not statistically significant when compared to healthy controls. A significant reduction in Bacteroidota phylum was observed in CRC patients, and similar changes have been observed in previous findings [,]. Additionally, Verrucomicrobiota was found to be significantly higher in CRC patients compared to healthy individuals and this is a consistent with previous studies [,,]. Furthermore, the ratio of Firmicutes to Bacteroidota was higher in CRC patients compared to healthy individuals, which aligns with findings from previous studies [,]. These previous studies recorded that the relative abundance of bacteria and their ratios are a key indicator of gut health, and any significant changes indicate a biomarker of gut dysbiosis. Indeed, the ratio of Firmicutes/Bacteroidetes is closely associated with the development of inflammatory bowel diseases (IBDs) and the progression of CRC [,]. Although there was no significant increase found in both Actinobacteriota and Proteobacteria in CRC patients, the ratio of these phyla to Bacteroidota was significantly reduced in these patients and these ratios had not been previously documented in cases of CRC. A recent study indicated that Proteobacteria may promote the risk of metabolic diseases and CRC, and play a crucial role in tumors [].
Further analysis revealed significant differences at the genus level between healthy people and CRC patients. Notably, there was a marked decline in the genus of Roseburia in CRC patients compared to healthy individuals, which aligns with findings from previously conducted studies [,]. This Gram-positive anaerobic bacterium has crucial roles in digestion and the production of short-chain fatty acids []. Additionally, Roseburia contributes to host immune regulation and exhibits anti-inflammatory properties, as it acts as a PD-1 (programmed death 1) antagonist that stimulates T cells to target and kill cancer cells []. Similarly, a reduction in Sutterella was also observed in CRC patients and this anaerobic Gram-negative bacterium is linked to the pathogenesis of inflammatory bowel disease and metabolic diseases []. This reduction further underscores the potential role of gut microbiota in CRC pathogenesis. Furthermore, Barnicella levels were also reduced in CRC patients and this result is in line with a recent study by []. This bacterium has been associated with an anti-cancer immune response as it enhances the response of some types of helper T cells []. Similarly, the relative abundance of Faecalibacterium was also decreased in CRC patients compared to healthy people, which aligns with findings from previously conducted studies [,]. These previous studies have confirmed a positive correlation between Faecalibacterium and healthy subjects, and it has a crucial role as an anti-tumor bacteria which works to prevent invasion, promote programmed cell death, and limit the spread of various cancer cells in various organs, such as breast, lung, colorectal, and colon cells. In addition, the abundance of Prevotella was also reduced in CRC patients and this finding is supported by Yang et al. []. Yang and his colleagues noted that presence of Prevotella is linked to a diet rich in fiber, its levels increased in cases of reduced CRC mortality rate compared with high mortality cases. Other genera such as Eubacterium, Lachnospira, and Lachnospiraceae_UCG_004 were also found to be less abundant in CRC patients, and these finding were similar to those in recent studies [,,,]. A reduced abundance of Eubacterium and Lachnospira species in the intestines leads to deficit in SCFAs such as valerate and butyrate and other metabolites like folic acid. These deficits may promote intestinal lymphomagenesis [,].
In contrast, several genera were revealed to be increased in CRC patients compared to healthy individuals. Evidently, Bacteroides and Blautia were more abundant in cases of CRC and these findings are similar to those of previous studies [,,]. Indeed, certain Bacteroides species have the ability to invade colonic epithelial cells and induce pro-inflammatory cytokines, which are major contributors to ulcerative colitis and the pathogenesis of IBD []. Additionally, Bacteroides species may promote colorectal carcinogens by increasing the aberrant crypt foci, which in turn may promote colorectal carcinogenesis []. Cai et al. [] reported that the relative abundance of Blautia was significantly higher in colorectal neoplasms. This bacterium is positively correlated with the expression of two types of cytokines, which are associated with a poorer prognosis in colorectal cancer treatment. Furthermore, Actinomyces levels were also elevated in the CRC patients compared to the healthy people, and this result is in accordance with a recent study by Xu et al. []. Actinomyces activates the TLR2/NF-κB signaling pathway and diminishes the number of effective CD8+ T cells in the CRC environment, particularly when co-localized with the cancer-associated fibroblasts found in colorectal cancer []. Consequently, this bacterium is considered a tumoral microbiota that facilitates tumor formation. Xu and his colleagues also further emphasised that a higher abundance of Actinomyces, along with other changes in pro-tumor taxa, are considered key to the microbiota that related to diagnosis the CRC in young patients.
In addition, a significant increase in Akkermansia spp. was observed in CRC patients compared with healthy people, and this result was matched in recent human and mice studies [,]. Wang and his colleagues reported that a high abundance of Akkermansia in the gastrointestinal tract of mice elevated the early levels of inflammation and promoted the proliferation of intestinal epithelial cells, which enhances the formation of CRC []. However, other studies have shown that a reduction in Akkermansia abundance is associated with severe symptoms of CRC. This indicates that the role of Akkermansia is unclear in the development of CRC and further investigation is needed on this bacterium []. Similarly, an increase in Desulfovibrio abundance has also been noted in CRC patients compared with healthy people, and this result is consistent with the recent findings of research by [,,]. Species of Desulfovibrio, a known intestinal sulfate-reducing bacteria [,], exhibit high abundance that leads to elevated the production of hydrogen sulfide []. An increase of the H2S levels in the intestine have toxic effects on intestinal cells, impacting the mucosal lining, progression of leaky gut, and then cause intestinal cell DNA damage, and potentially contributing to inflammatory bowel diseases and carcinogenesis [].
The limitations of this study include a relatively small sample size and restrication to a single geographic area.
5. Conclusions
It is noted that the observed differences in alpha diversity, with certain indices showing a significant difference in some parameters in CRC patients compared to healthy controls, highlight notable alterations in the gut microbiota. These changes, along with the clear differences and separations of β-diversity in bacterial communities between CRC vs. healthy individuals, as well as the significant changes in the gut microbiota, suggest marked gut microbiome dysbiosis in patients with CRC. Despite receiving doses of cancer chemotherapy, the gut microbiome remains distinct from healthy individuals. Further research is necessary to elucidate the impact of different immunological and biological therapies, including the implication of probiotics and prebiotics, on the richness and diversity of the gut microbiome and the switch towards eubiosis.
Author Contributions
Conceptualization, Z.S.A. and K.S.I.; methodology, F.J.K. and Z.S.A.; software, K.S.I.; validation, Z.S.A. and K.S.I.; formal analysis, F.J.K. and K.S.I.; investigation, F.J.K.; resources, F.J.K. and Z.S.A.; data curation, F.J.K. and K.S.I.; writing—original draft preparation, F.J.K. and K.S.I.; writing—review and editing, F.J.K., Z.S.A. and K.S.I.; visualization, K.S.I. supervision, Z.S.A. and K.S.I.; project administration, Z.S.A. All authors have read and agreed to the published version of the manuscript.
Funding
This research received no external funding.
Acknowledgments
We would like to express our sincere gratitude to Haider Saadoon Qasim Alhilfi, for his invaluable assistance in diagnosing colorectal cancer in the patients who participated in this study at the Al-Shifaa Oncology Center, Al-Sadder Teaching Hospital, Misan city, Iraq. We also extend our thanks to the medical staff who contributed to the study, particularly Ibtissam Abood Jabber and Yaurb Karim Mutashar for their essential support in providing materials and resources in the same hospital. Also, we are grateful to all the participants and medical staff who contributed to this study.
Conflicts of Interest
The authors declare no conflicts of interest.
Appendix A. Relative Abundance of Bacterial Phyla in (A) Healthy Control Subjects and (B) CRC Subjects
| A | |||||||||||||||
| Healthy | Healthy1 | Healthy2 | Healthy3 | Healthy4 | Healthy5 | Healthy6 | Healthy7 | Healthy8 | Healthy9 | Mean | Standard Deviation | StandardError | |||
| p__Actinobacteriota | 6.11 | 1.89 | 12.14 | 4.32 | 1.85 | 5.52 | 7.35 | 2.05 | 2.81 | 4.89 | 3.38 | 1.13 | |||
| p__Bacteroidota | 21.50 | 49.40 | 20.26 | 31.54 | 39.00 | 45.48 | 50.33 | 37.03 | 31.69 | 36.25 | 11.07 | 3.69 | |||
| p__Cyanobacteria | 0.11 | 0.08 | 0.00 | 0.00 | 0.00 | 0.00 | 0.00 | 1.08 | 0.18 | 0.16 | 0.35 | 0.12 | |||
| p__Desulfobacterota | 0.00 | 0.00 | 0.00 | 0.71 | 0.04 | 0.08 | 0.02 | 2.14 | 0.61 | 0.40 | 0.71 | 0.24 | |||
| p__Elusimicrobiota | 0.00 | 0.00 | 0.00 | 0.00 | 0.00 | 0.00 | 0.00 | 0.35 | 0.06 | 0.05 | 0.12 | 0.04 | |||
| p__Firmicutes | 71.77 | 47.76 | 66.21 | 61.76 | 56.97 | 45.91 | 40.22 | 47.98 | 62.56 | 55.68 | 10.68 | 3.56 | |||
| p__Fusobacteriota | 0.00 | 0.00 | 0.00 | 0.09 | 0.00 | 0.00 | 0.00 | 0.00 | 0.00 | 0.01 | 0.03 | 0.01 | |||
| p__Patescibacteria | 0.00 | 0.00 | 0.00 | 0.00 | 0.00 | 0.00 | 0.00 | 0.00 | 0.00 | 0.00 | 0.00 | 0.00 | |||
| p__Proteobacteria | 0.49 | 0.86 | 1.39 | 1.57 | 2.13 | 3.02 | 2.07 | 9.36 | 2.10 | 2.55 | 2.66 | 0.89 | |||
| p__Synergistota | 0.02 | 0.00 | 0.00 | 0.00 | 0.00 | 0.00 | 0.00 | 0.00 | 0.00 | 0.00 | 0.01 | 0.00 | |||
| p__Verrucomicrobiota | 0.00 | 0.00 | 0.00 | 0.01 | 0.00 | 0.01 | 0.00 | 0.01 | 0.00 | 0.00 | 0.00 | 0.00 | |||
| B | |||||||||||||||
| CRC | CRC-1 | CRC-2 | CRC-3 | CRC-4 | CRC-5 | CRC-6 | CRC-7 | CRC-8 | CRC-9 | CRC-10 | CRC-11 | CRC-12 | Mean | Standard Deviation | StandardError |
| p__Actinobacteriota | 9.76 | 15.55 | 1.34 | 8.31 | 2.57 | 4.15 | 5.22 | 13.14 | 24.32 | 16.96 | 6.25 | 3.95 | 9.29 | 6.93 | 2.00 |
| p__Bacteroidota | 20.77 | 4.02 | 42.45 | 24.13 | 25.60 | 33.22 | 17.87 | 4.32 | 0.65 | 12.36 | 1.21 | 16.74 | 16.94 | 13.20 | 3.81 |
| p__Cyanobacteria | 0.00 | 0.01 | 0.00 | 1.29 | 0.99 | 0.24 | 0.45 | 0.18 | 0.00 | 0.00 | 0.17 | 0.24 | 0.30 | 0.42 | 0.12 |
| p__Desulfobacterota | 1.13 | 1.18 | 0.24 | 1.96 | 0.61 | 2.56 | 0.05 | 0.14 | 0.33 | 0.00 | 0.97 | 0.77 | 0.83 | 0.79 | 0.23 |
| p__Elusimicrobiota | 0.00 | 0.01 | 0.00 | 0.00 | 0.15 | 0.02 | 0.00 | 0.00 | 0.00 | 0.00 | 0.00 | 0.12 | 0.03 | 0.05 | 0.02 |
| p__Firmicutes | 58.15 | 68.96 | 53.53 | 61.25 | 69.06 | 52.88 | 75.84 | 81.66 | 59.03 | 52.09 | 60.84 | 51.77 | 62.09 | 9.81 | 2.83 |
| p__Fusobacteriota | 0.00 | 0.00 | 0.00 | 0.00 | 0.00 | 1.53 | 0.00 | 0.00 | 0.00 | 0.00 | 0.00 | 0.91 | 0.20 | 0.49 | 0.14 |
| p__Patescibacteria | 0.00 | 0.00 | 0.00 | 0.00 | 0.00 | 0.00 | 0.00 | 0.00 | 0.01 | 0.00 | 0.00 | 0.00 | 0.00 | 0.00 | 0.00 |
| p__Proteobacteria | 4.81 | 10.18 | 2.44 | 2.74 | 0.83 | 3.39 | 0.56 | 0.57 | 4.32 | 18.59 | 2.22 | 25.32 | 6.33 | 7.88 | 2.27 |
| p__Synergistota | 0.00 | 0.06 | 0.00 | 0.00 | 0.07 | 0.94 | 0.00 | 0.00 | 0.00 | 0.00 | 0.00 | 0.06 | 0.09 | 0.27 | 0.08 |
| p__Verrucomicrobiota | 5.37 | 0.03 | 0.00 | 0.31 | 0.11 | 1.06 | 0.02 | 0.00 | 11.35 | 0.00 | 28.33 | 0.11 | 3.89 | 8.42 | 2.43 |
References
- Sung, H.; Ferlay, J.; Siegel, R.L.; Laversanne, M.; Soerjomataram, I.; Jemal, A.; Bray, F. Global Cancer Statistics 2020: GLOBOCAN Estimates of Incidence and Mortality Worldwide for 36 Cancers in 185 Countries. CA Cancer J. Clin. 2021, 71, 209–249. [Google Scholar] [CrossRef] [PubMed]
- Pelizzer, T.; Dias, C.P.; Poeta, J.; Torriani, T.; Roncada, C. Colorectal Cancer Prevalence Linked to Human Papillomavirus: A Systematic Review with Meta-Analysis. Rev. Bras. Epidemiol. 2016, 19, 791–802. [Google Scholar] [CrossRef] [PubMed]
- Song, M.; Chan, A.T.; Sun, J. Influence of the Gut Microbiome, Diet, and Environment on Risk of Colorectal Cancer. Gastroenterology 2020, 158, 322–340. [Google Scholar] [CrossRef] [PubMed]
- Sawicki, T.; Ruszkowska, M.; Danielewicz, A.; Niedźwiedzka, E.; Arłukowicz, T.; Przybyłowicz, K.E. A Review of Colorectal Cancer in Terms of Epidemiology, Risk Factors, Development, Symptoms and Diagnosis. Cancers 2021, 13, 2025. [Google Scholar] [CrossRef]
- Saus Martínez, E.; Iraola Guzman, S.; Willis, J.R.; Brunet-Vega, A.; Gabaldón Estevan, J.A. Microbiome and Colorectal Cancer: Roles in Carcinogenesis and Clinical Potential. Mol. Asp. Med. 2019, 69, 93–106. [Google Scholar] [CrossRef]
- Loke, Y.L.; Chew, M.T.; Ngeow, Y.F.; Lim, W.W.D.; Peh, S.C. Colon Carcinogenesis: The Interplay between Diet and Gut Microbiota. Front. Cell. Infect. Microbiol. 2020, 10, 603086. [Google Scholar] [CrossRef]
- Pandey, H.; Tang, D.W.T.; Wong, S.H.; Lal, D. Gut Microbiota in Colorectal Cancer: Biological Role and Therapeutic Opportunities. Cancers 2023, 15, 866. [Google Scholar] [CrossRef]
- Sekirov, I.; Russell, S.L.; Antunes, L.C.M.; Finlay, B.B. Gut Microbiota in Health and Disease. Physiol. Rev. 2010, 90, 859–904. [Google Scholar] [CrossRef]
- Ibrahim, K.S. Biochemical Interactions Between the Gut Microbiome and Host in Obesity/Type II Diabetes. Ph.D. Thesis, Glasgow Caledonian University, Glasgow, UK, 2017. [Google Scholar]
- Ibrahim, K.S.; Bourwis, N.; Dolan, S.; Craft, J.A. In Silico Analysis of Bacterial Metabolism of Glutamate and GABA in the Gut in a Rat Model of Obesity and Type 2 Diabetes. Biosci. Microbiota Food Health 2022, 41, 195–199. [Google Scholar] [CrossRef]
- Ibrahim, K.S.; Bourwis, N.; Dolan, S.; Lang, S.; Spencer, J.; Craft, J.A. Characterisation of Gut Microbiota of Obesity and Type 2 Diabetes in a Rodent Model. Biosci. Microbiota Food Health 2021, 40, 65–74. [Google Scholar] [CrossRef]
- Lucas, C.; Barnich, N.; Nguyen, H.T.T. Microbiota, Inflammation and Colorectal Cancer. Int. J. Mol. Sci. 2017, 18, 1310. [Google Scholar] [CrossRef] [PubMed]
- Sherafat, S.J.; Alebouyeh, M.; Moghim, S.; Amoli, H.A.; Ghasemian-Safaei, H. Role of Gut Microbiota in the Pathogenesis of Colorectal Cancer. Gastroenterol. Hepatol. Bed Bench 2018, 11, 101–109. [Google Scholar]
- Hussain, A.M.A.; Lafta, R.K. Cancer Trends in Iraq 2000–2016. Oman Med. J. 2021, 36, e219. [Google Scholar] [CrossRef] [PubMed]
- Alhilfi, H.S.Q.; Almohammadawi, K.O.M.; Alsaad, R.K.A.; Ameen, N.A.; Aliedani, B.K.A.; Aldubaisi, H.J.I.; Alshewered, A.S.H. Colorectal Cancer Epidemiology and Clinical Study in Misan. J. Coloproctol. 2019, 39, 159–162. [Google Scholar] [CrossRef]
- Cao, Y.; Ibrahim, K.S.; Li, X.; Wong, A.; Wu, Y.; Yu, X.-D.; Zhou, X.; Tan, Z.; He, Z.; Craft, J.A. Chinese Medicine, Qijudihuang Pill, Mediates Cholesterol Metabolism and Regulates Gut Microbiota in High-Fat Diet-Fed Mice, Implications for Age-Related Macular Degeneration. Front. Immunol. 2023, 14, 1274401. [Google Scholar] [CrossRef]
- Ibrahim, K.S.; Craft, J.A.; Biswas, L.; Spencer, J.; Shu, X. Etifoxine Reverses Weight Gain and Alters the Colonic Bacterial Community in a Mouse Model of Obesity. Biochem. Pharmacol. 2020, 180, 114151. [Google Scholar] [CrossRef]
- Biswas, L.; Ibrahim, K.S.; Li, X.; Zhou, X.; Zeng, Z.; Craft, J.; Shu, X. Effect of a TSPO Ligand on Retinal Pigment Epithelial Cholesterol Homeostasis in High-Fat Fed Mice, Implication for Age-Related Macular Degeneration. Exp. Eye Res. 2021, 208, 108625. [Google Scholar] [CrossRef]
- Callahan, B.J.; McMurdie, P.J.; Rosen, M.J.; Han, A.W.; Johnson, A.J.A.; Holmes, S.P. DADA2: High-Resolution Sample Inference from Illumina Amplicon Data. Nat. Methods 2016, 13, 581–583. [Google Scholar] [CrossRef]
- Robeson, M.S.; O’Rourke, D.R.; Kaehler, B.D.; Ziemski, M.; Dillon, M.R.; Foster, J.T.; Bokulich, N.A. RESCRIPt: Reproducible Sequence Taxonomy Reference Database Management. PLoS Comput. Biol. 2021, 17, e1009581. [Google Scholar] [CrossRef]
- O’Hara, A.M.; Shanahan, F. The Gut Flora as a Forgotten Organ. EMBO Rep. 2006, 7, 688–693. [Google Scholar] [CrossRef]
- Qin, J.; Li, R.; Raes, J.; Arumugam, M.; Burgdorf, K.S.; Manichanh, C.; Nielsen, T.; Pons, N.; Levenez, F.; Yamada, T. A Human Gut Microbial Gene Catalogue Established by Metagenomic Sequencing. Nature 2010, 464, 59–65. [Google Scholar] [CrossRef]
- Wang, T.; Cai, G.; Qiu, Y.; Fei, N.; Zhang, M.; Pang, X.; Jia, W.; Cai, S.; Zhao, L. Structural Segregation of Gut Microbiota between Colorectal Cancer Patients and Healthy Volunteers. ISME J. 2012, 6, 320–329. [Google Scholar] [CrossRef] [PubMed]
- Baxter, N.T.; Zackular, J.P.; Chen, G.Y.; Schloss, P.D. Structure of the Gut Microbiome Following Colonization with Human Feces Determines Colonic Tumor Burden. Microbiome 2014, 2, 20. [Google Scholar] [CrossRef] [PubMed]
- Weir, T.L.; Manter, D.K.; Sheflin, A.M.; Barnett, B.A.; Heuberger, A.L.; Ryan, E.P. Stool Microbiome and Metabolome Differences between Colorectal Cancer Patients and Healthy Adults. PloS ONE 2013, 8, e70803. [Google Scholar] [CrossRef]
- Wang, Z.; Dan, W.; Zhang, N.; Fang, J.; Yang, Y. Colorectal Cancer and Gut Microbiota Studies in China. Gut Microbes 2023, 15, 2236364. [Google Scholar] [CrossRef]
- Sun, J.; Kato, I. Gut Microbiota, Inflammation and Colorectal Cancer. Genes Dis. 2016, 3, 130–143. [Google Scholar] [CrossRef]
- Xu, Y.; Zhao, J.; Ma, Y.; Liu, J.; Cui, Y.; Yuan, Y.; Xiang, C.; Ma, D.; Liu, H. The Microbiome Types of Colorectal Tissue Are Potentially Associated with the Prognosis of Patients with Colorectal Cancer. Front. Microbiol. 2023, 14, 1100873. [Google Scholar] [CrossRef]
- Tamanai-Shacoori, Z.; Smida, I.; Bousarghin, L.; Loreal, O.; Meuric, V.; Fong, S.B.; Bonnaure-Mallet, M.; Jolivet-Gougeon, A. Roseburia Spp.: A Marker of Health? Future Microbiol. 2017, 12, 157–170. [Google Scholar] [CrossRef]
- Kang, X.; Liu, C.; Ding, Y.; Ni, Y.; Ji, F.; Lau, H.C.H.; Jiang, L.; Sung, J.J.Y.; Wong, S.H.; Yu, J. Roseburia Intestinalis Generated Butyrate Boosts Anti-PD-1 Efficacy in Colorectal Cancer by Activating Cytotoxic CD8+ T Cells. Gut 2023, 72, 2112–2122. [Google Scholar] [CrossRef]
- Hiippala, K.; Kainulainen, V.; Kalliomäki, M.; Arkkila, P.; Satokari, R. Mucosal Prevalence and Interactions with the Epithelium Indicate Commensalism of Sutterella Spp. Front. Microbiol. 2016, 7, 1706. [Google Scholar] [CrossRef]
- Sarhadi, V.; Lahti, L.; Saberi, F.; Youssef, O.; Kokkola, A.; Karla, T.; Tikkanen, M.; Rautelin, H.; Puolakkainen, P.; Salehi, R. Gut Microbiota and Host Gene Mutations in Colorectal Cancer Patients and Controls of Iranian and Finnish Origin. Anticancer Res. 2020, 40, 1325–1334. [Google Scholar] [CrossRef] [PubMed]
- Battal, B.; Akgun, V.; Karaman, B. Value of 3T 1H-Magnetic Resonance Spectroscopy in the Differentiation of Benign and Malignant Breast Tumors. Acta Radiol. 2014, 55, 416–417. [Google Scholar] [CrossRef]
- Ma, J.; Sun, L.; Liu, Y.; Ren, H.; Shen, Y.; Bi, F.; Zhang, T.; Wang, X. Alter Between Gut Bacteria and Blood Metabolites and the Anti-Tumor Effects of Faecalibacterium Prausnitzii in Breast Cancer. BMC Microbiol. 2020, 20, 82. [Google Scholar] [CrossRef] [PubMed]
- Yang, J.; McDowell, A.; Kim, E.K.; Seo, H.; Lee, W.H.; Moon, C.-M.; Kym, S.-M.; Lee, D.H.; Park, Y.S.; Jee, Y.-K. Development of a Colorectal Cancer Diagnostic Model and Dietary Risk Assessment through Gut Microbiome Analysis. Exp. Mol. Med. 2019, 51, 1–15. [Google Scholar] [CrossRef] [PubMed]
- Lu, H.; Xu, X.; Fu, D.; Gu, Y.; Fan, R.; Yi, H.; He, X.; Wang, C.; Ouyang, B.; Zhao, P. Butyrate-Producing Eubacterium Rectale Suppresses Lymphomagenesis by Alleviating the TNF-Induced TLR4/MyD88/NF-ΚB Axis. Cell Host Microbe 2022, 30, 1139–1150. [Google Scholar] [CrossRef]
- James, A. Focal Lesions of the Liver: Imaging Appearances and Management. Br. J. Hosp. Med. 2020, 81, 1–22. [Google Scholar] [CrossRef]
- Du, X.; Li, Q.; Tang, Z.; Yan, L.; Zhang, L.; Zheng, Q.; Zeng, X.; Chen, G.; Yue, H.; Li, J. Alterations of the Gut Microbiome and Fecal Metabolome in Colorectal Cancer: Implication of Intestinal Metabolism for Tumorigenesis. Front. Physiol. 2022, 13, 854545. [Google Scholar] [CrossRef]
- Yuan, L.; Zhang, S.; Li, H.; Yang, F.; Mushtaq, N.; Ullah, S.; Shi, Y.; An, C.; Xu, J. The Influence of Gut Microbiota Dysbiosis to the Efficacy of 5-Fluorouracil Treatment on Colorectal Cancer. Biomed. Pharmacother. 2018, 108, 184–193. [Google Scholar] [CrossRef]
- Cai, C.; Zhang, X.; Liu, Y.; Shen, E.; Feng, Z.; Guo, C.; Han, Y.; Ouyang, Y.; Shen, H. Gut Microbiota Imbalance in Colorectal Cancer Patients, the Risk Factor of COVID-19 Mortality. Gut Pathog. 2021, 13, 70. [Google Scholar] [CrossRef]
- Cuív, P.Ó.; De Wouters, T.; Giri, R.; Mondot, S.; Smith, W.J.; Blottière, H.M.; Begun, J.; Morrison, M. The Gut Bacterium and Pathobiont Bacteroides Vulgatus Activates NF-ΚB in a Human Gut Epithelial Cell Line in a Strain and Growth Phase Dependent Manner. Anaerobe 2017, 47, 209–217. [Google Scholar] [CrossRef]
- Xu, Z.; Lv, Z.; Chen, F.; Zhang, Y.; Xu, Z.; Huo, J.; Liu, W.; Yu, S.; Tuersun, A.; Zhao, J. Dysbiosis of Human Tumor Microbiome and Aberrant Residence of Actinomyces in Tumor-Associated Fibroblasts in Young-Onset Colorectal Cancer. Front. Immunol. 2022, 13, 1008975. [Google Scholar] [CrossRef] [PubMed]
- Nasir, N.; Jamil, B.; Siddiqui, S.; Talat, N.; Khan, F.A.; Hussain, R. Mortality in Sepsis and Its Relationship with Gender. Pak. J. Med. Sci. 2015, 31, 1201. [Google Scholar] [CrossRef] [PubMed]
- Wang, F.; Cai, K.; Xiao, Q.; He, L.; Xie, L.; Liu, Z. Akkermansia Muciniphila Administration Exacerbated the Development of Colitis-Associated Colorectal Cancer in Mice. J. Cancer 2022, 13, 124. [Google Scholar] [CrossRef] [PubMed]
- Faghfuri, E.; Gholizadeh, P. The Role of Akkermansia Muciniphila in Colorectal Cancer: A Double-Edged Sword of Treatment or Disease Progression? Biomed. Pharmacother. 2024, 173, 116416. [Google Scholar] [CrossRef]
- Li, G.; Liu, H.; Yu, Y.; Wang, Q.; Yang, C.; Yan, Y.; Wang, F.; Mao, Y. Desulfovibrio Desulfuricans and Its Derived Metabolites Confer Resistance to FOLFOX through METTL3. EBioMedicine 2024, 102, 105041. [Google Scholar] [CrossRef]
- Yan, Y.; Drew, D.A.; Markowitz, A.; Lloyd-Price, J.; Abu-Ali, G.; Nguyen, L.H.; Tran, C.; Chung, D.C.; Gilpin, K.K.; Meixell, D. Structure of the Mucosal and Stool Microbiome in Lynch Syndrome. Cell Host Microbe 2020, 27, 585–600. [Google Scholar] [CrossRef]
- Kushkevych, I.; Dordević, D.; Vítězová, M. Possible Synergy Effect of Hydrogen Sulfide and Acetate Produced by Sulfate-Reducing Bacteria on Inflammatory Bowel Disease Development. J. Adv. Res. 2021, 27, 71–78. [Google Scholar] [CrossRef]
- Windey, K.; De Preter, V.; Verbeke, K. Relevance of Protein Fermentation to Gut Health. Mol. Nutr. Food Res. 2012, 56, 184–196. [Google Scholar] [CrossRef]
- Marchesi, J.R.; Adams, D.H.; Fava, F.; Hermes, G.D.A.; Hirschfield, G.M.; Hold, G.; Quraishi, M.N.; Kinross, J.; Smidt, H.; Tuohy, K.M. The Gut Microbiota and Host Health: A New Clinical Frontier. Gut 2016, 65, 330–339. [Google Scholar] [CrossRef]
Disclaimer/Publisher’s Note: The statements, opinions and data contained in all publications are solely those of the individual author(s) and contributor(s) and not of MDPI and/or the editor(s). MDPI and/or the editor(s) disclaim responsibility for any injury to people or property resulting from any ideas, methods, instructions or products referred to in the content. |
© 2025 by the authors. Licensee MDPI, Basel, Switzerland. This article is an open access article distributed under the terms and conditions of the Creative Commons Attribution (CC BY) license (https://creativecommons.org/licenses/by/4.0/).