Communication

Comparative Analysis of Healthy Gut Microbiota in German and Korean Populations: Insights from Large-Scale Cohort Studies

1
Department of Oral Microbiology, School of Dentistry, Pusan National University, Yangsan 50612, Republic of Korea
2
Oral Genomics Research Center, Pusan National University, Yangsan 50612, Republic of Korea
3
Dental Research Institute, BK21 PLUS Project, School of Dentistry, Pusan National University, Yangsan 50612, Republic of Korea
*
Author to whom correspondence should be addressed.
These authors contributed equally to this work.
Microbiol. Res. 2024, 15(1), 109-119; https://doi.org/10.3390/microbiolres15010007
Submission received: 17 November 2023 / Revised: 21 December 2023 / Accepted: 21 December 2023 / Published: 26 December 2023

Abstract

:
Healthy individuals often have different gut microbiota, and these differences can be influenced by their country of origin or their race. This study aimed to compare the gut microbiota compositions of healthy Germans and Koreans using 16S rRNA sequencing data extracted from public sources. Two cohorts, comprising 1592 samples (804 Germans and 788 Koreans), were analyzed for alpha and beta diversity, core microbiome, and abundances of specific taxa. The Prevotella enterotype was more prevalent in Koreans, and significant diversity differences were observed depending on cohorts and enterotypes. The core microbiomes across all enterotypes and cohorts included Bacteroides, Faecalibacterium, Parabacteroides, and Lachnospira. Several common core microbiomes were also found depending on enterotype. Koreans exhibited higher abundances of Faecalibacterium, Prevotella, and Bacteroides, while Germans had higher abundances of Blautia, Subdoligranulum, and Agathobacter. Distinctive microbiomes were identified by enterotype. The study enhances comprehension of gut microbiome variations linked to enterotype and geographical factors, and emphasizes the need for additional research to establish correlations between specific microbial properties and individual health status.

1. Introduction

Understanding the healthy gut microbiome and the complex community of micro-organisms that reside in the gastrointestinal tract is essential for maintaining overall health. The human gut microbiome consists of at least 2300 genera and 15,000–36,000 species of bacteria [1,2] and plays many critical roles, including educating the immune system [3], providing protection against pathogens [4], enabling energy biogenesis [5], and producing vitamins, enzymes, and other compounds not synthesized by human cells [5]. Furthermore, detailed knowledge could be used to develop new therapies and interventions to treat diseases that are linked to imbalances or disruptions in the gut microbiome, such as inflammatory bowel disease [6], obesity [7], and metabolic disorders [8].
Studying the healthy gut microbiome can provide insights into its broader role in human health and disease, and thus, it is important to understand the nature of gut microbiota compositions and microbiomes in healthy populations [9]. Gut microbiota may exhibit unique country- and race-dependent compositions [10,11,12]. In addition, endogenous and exogeneous factors, such as age [13], ethnicity, geography [14,15], diet [16], and medications [17,18], can influence the composition and function of the gut microbiome. The majority of the studies conducted to date have been on European and American populations [19], and relatively little is known about the healthy gut microbiome in Asian populations [10].
Recently, the use of next-generation sequencing (NGS) of bacterial 16S rRNA genes has expanded understanding of the complexity of microbial communities. This technique allows comprehensive, detailed examinations of microbial communities and provides a more thorough understanding of the microbiome diversities and compositions. Additionally, NGS has greater sensitivity and accuracy for detecting low-abundance micro-organisms and provides a more comprehensive and nuanced analysis of microbial populations [20,21,22].
In the present study, the data of two large cohorts was retrieved from the European Bioinformatics Institute database and analyzed to determine the compositions of healthy gut microbiomes in Korean and German populations.

2. Materials and Methods

2.1. Dataset

We searched for human gut microbiome data in the European Bioinformatics Institute dataset repository (EBI data set; https://www.ebi.uk.ac, accessed on 16 November 2023). The selection criteria were: (1) sample size over 500, (2) same target site, (3) same sequencing platform, and (4) healthy subjects. Two of 1063 studies were finally selected, that is, PRJEB33905, submitted by the Korean Food Research Institute, which involved a study of the gut microbiomes of members of the general Korean population residing in or near Seoul [10], and PRJNA701859, submitted by the Technical University Munich, which studied gut microbiomes in a healthy southern German population [11]. Both cohort studies collected samples from the general population and included more than 800 samples targeting the V3–V4 region.

2.2. Microbiome Analysis and Statistical Analysis

Basic microbiome analysis was performed using QIIME2 (version 2020.11) [23] and its associated plugins. The Choa1 index and Shannon index methods were used to measure alpha diversities. Beta diversity was assessed by calculating distance matrices based on Bray-Curtis distances and visualized by principal coordinates analysis (PCoA). The Kruskal–Wallis test and non-parametric permutation multivariate analysis of variance (PERMANOVA) were used to assess the statistical significances of alpha and beta diversities, respectively. A pre-trained Naive Bayes classifier using the EzBioCloud 16S Database as a reference [24] was used to assign taxonomy to unique representative sequences. The core microbiome was determined at the genus level using adjustable parameters for relative abundance and prevalence [25]. Linear discriminant analysis effect size (LEfSe) [26] was applied with default settings to test for differential abundance of bacterial species in the two cohorts. Spearman’s correlation coefficients with p-value between two species were calculated to visualize internal interactions and further measurement of the microbial community. Statistical significance was accepted for p-value < 0.05. The network was visualized using Cytoscape [27]; nodes represented species and connections. Clusters of nodes that formed coherent structural subsystems of interacting units were measured with the function cluster_louvain in the graph package [28].

3. Results

3.1. Data Preprocessing Summary

The data of 815 German and 890 Korean samples were uploaded. Uploaded files of <2 Mb and broken files were excluded from the study. Thus, 804 and 788 samples were included in the analysis. The average input read counts for the German and Korean cohorts were 34,184 ± 10,067 (79,178–13,802) and 134,103 ± 111,787 (1,076,815–24,859), respectively. After trimming, pairing, and chimera removal, non-chimeric read counts for the German and Korean cohorts were 16,783 ± 5229 (39,184–3873) and 60,943 ± 46,978 (460,695–8075), respectively. The number of total operational taxonomic units (OTUs) for the German and Korean cohorts were 24,182 and 62,472, respectively. Since the input read count of the Korean cohort was much larger, this cohort produced a much larger number of OTU counts (Table 1).

3.2. Diversity and Abundance of Microbiota

Following taxonomic classification, relative abundances were calculated, and enterotypes were determined for the samples based on the abundances of Bacteroides, Prevotella, and Ruminococcus. In both cohorts, the Bacteroides enterotype was the most abundant, followed by Prevotella (Figure 1A). Alpha diversities of microbiota were estimated using the Chao1 and Shannon indices. The Korean cohort had larger Chao1 indices, which represent community richness (Figure 1B), whereas the German cohort had larger Shannon indices, which represents both microbial community richness and evenness (Figure 1C). For beta diversity analysis, Bray-Curtis distance was used to analyze the structure of the microbiota. The PERMANOVA test showed that microbiome compositions were significantly dependent on cohort and enterotype. In both cohorts, Ruminococcus enterotype were mostly observed among the Bacteroides enterotype relatively near the Prevotella enterotype (Figure 1D).
Next, average relative abundances were analyzed at various levels. The five most abundant phyla at the phylum level were Firmicutes, Bacteroidetes, Proteobacteria, Actinobacteria, and Verrucomicrobia. In both cohorts, the relative abundances of the phyla showed similar abundance depending on the enterotype. The Prevotella enterotype had the highest abundance of Bacteroidetes, while the Ruminococcus enterotype had the highest abundance of Firmicutes. The abundance of Proteobacteria was higher in the Korean cohort. Interestingly, the Fusobacteria was only noted for the Ruminococcus enterotype in the Korean cohort (Figure 2A). At the order level, the most abundant were Clostridiales, Bacteroidales, Burkholderiales, Acidaminococcales, and Bifidobacteriales, which accounted for more than 95% of the total sequences in both cohorts. The relative abundance of Bacteoidales was highest in the Prevotella enterotype and lowest in the Ruminococcus enterotype in both cohorts, while abundance of Clostidiales was highest in the Ruminococcus enterotype and lowest in the Prevotella enterotype. The abundance of Enterobacterales was greater in the Korean cohort (Figure 2B). At the family level, the most abundant family were Bacteroideceae, Lachnospiraceae, Prevotellaceae, and Ruminococcaceae (Figure 2C), and at the genus level, the top four most abundant genera were Bacteroides, Faecalibacterium, Prevotella, and Ruminococcus in both cohorts. For the Bacteroides enterotype, Bacteroides was most abundant followed by Feacalibacterium and Ruminococcus. For the Prevotella enterotype, Prevotella was the most abundant, followed by Faecalibacterium and Bacteroides, and for the Ruminococcus enterotype, Ruminococcus and Faecalibacterium were the most abundant, followed by Bacteroides and Prevotella. Faecalibacterium was more abundant in the Korean cohort, and the abundances of Clostridium, Escherichia, and Fusobacterium were prominent in the Ruminococcus enterotype of the Korean cohort (Figure 2D).
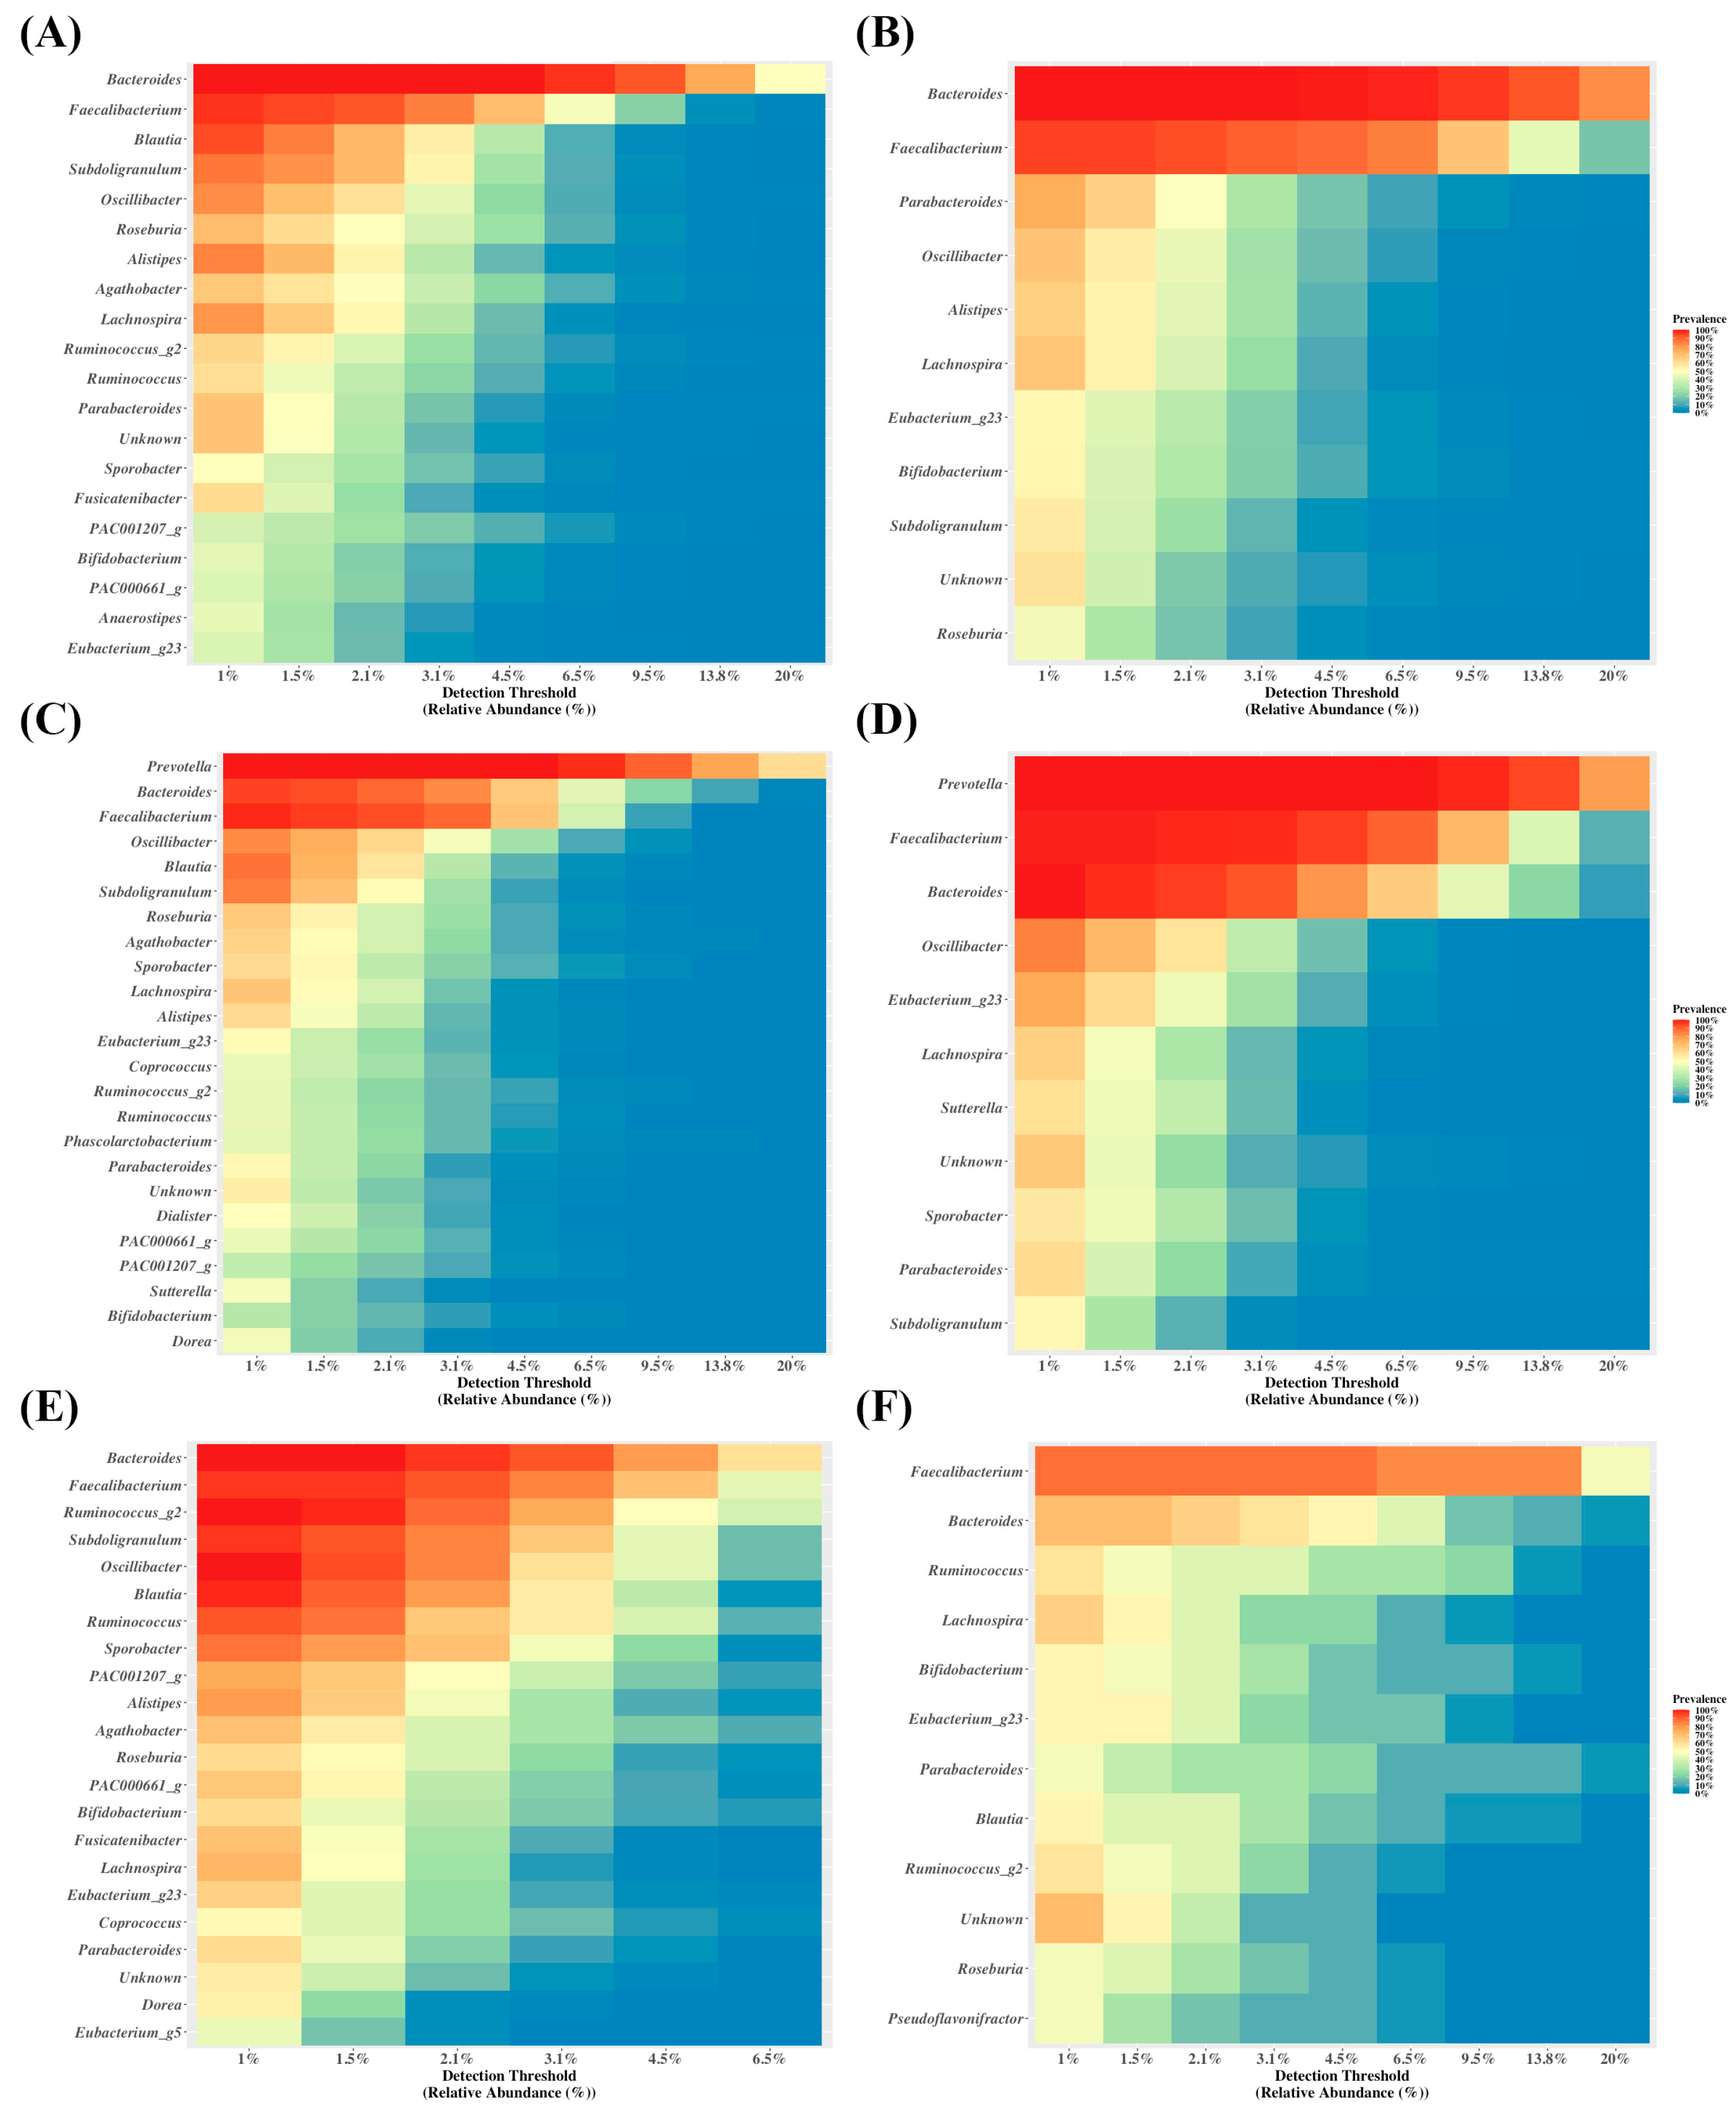
Next, the core microbiome was characterized at the genus level (Figure 3). Compared to relative abundance, the core microbiome provides the proportion of samples that share a set of microbial taxa and the relative abundances of shared taxa across the samples. The core microbiome was determined as the minimum detection threshold of 1% and minimum prevalence threshold of 50%. The German cohort had more of the core microbiomes assigned in all the enterotypes. Also, the Ruminococcus enterotype had more core microbiomes assigned than other enterotypes in both cohorts (Figure 3). In the Bacteroides enterotype, Bacteroides, Faecalibacterium, Parabacteroides, Oscillibacter, Alistipes, Lachnospira, Bifidobacterium, Subdoligranulum, and Roseburia were found as the core microbiomes (Figure 3A,B). For the Prevotella enterotype, Prevotella, Bacteroides, Faecalibacterium, Oscillibacter, Lachnospira, Sutterella, Sporobacter, Subdoligranulum, and Parabacteroides composed the core microbiome (Figure 3C,D), and for Ruminococcus enterotype, Bacteroides, Faecalibacterium, Ruminococcus, Lachnospira, Bifidobacterium, Parabacteroides, Blautia, and Roreburia composed the core microbiome (Figure 3E,F).

3.3. Species Taxa Comparison

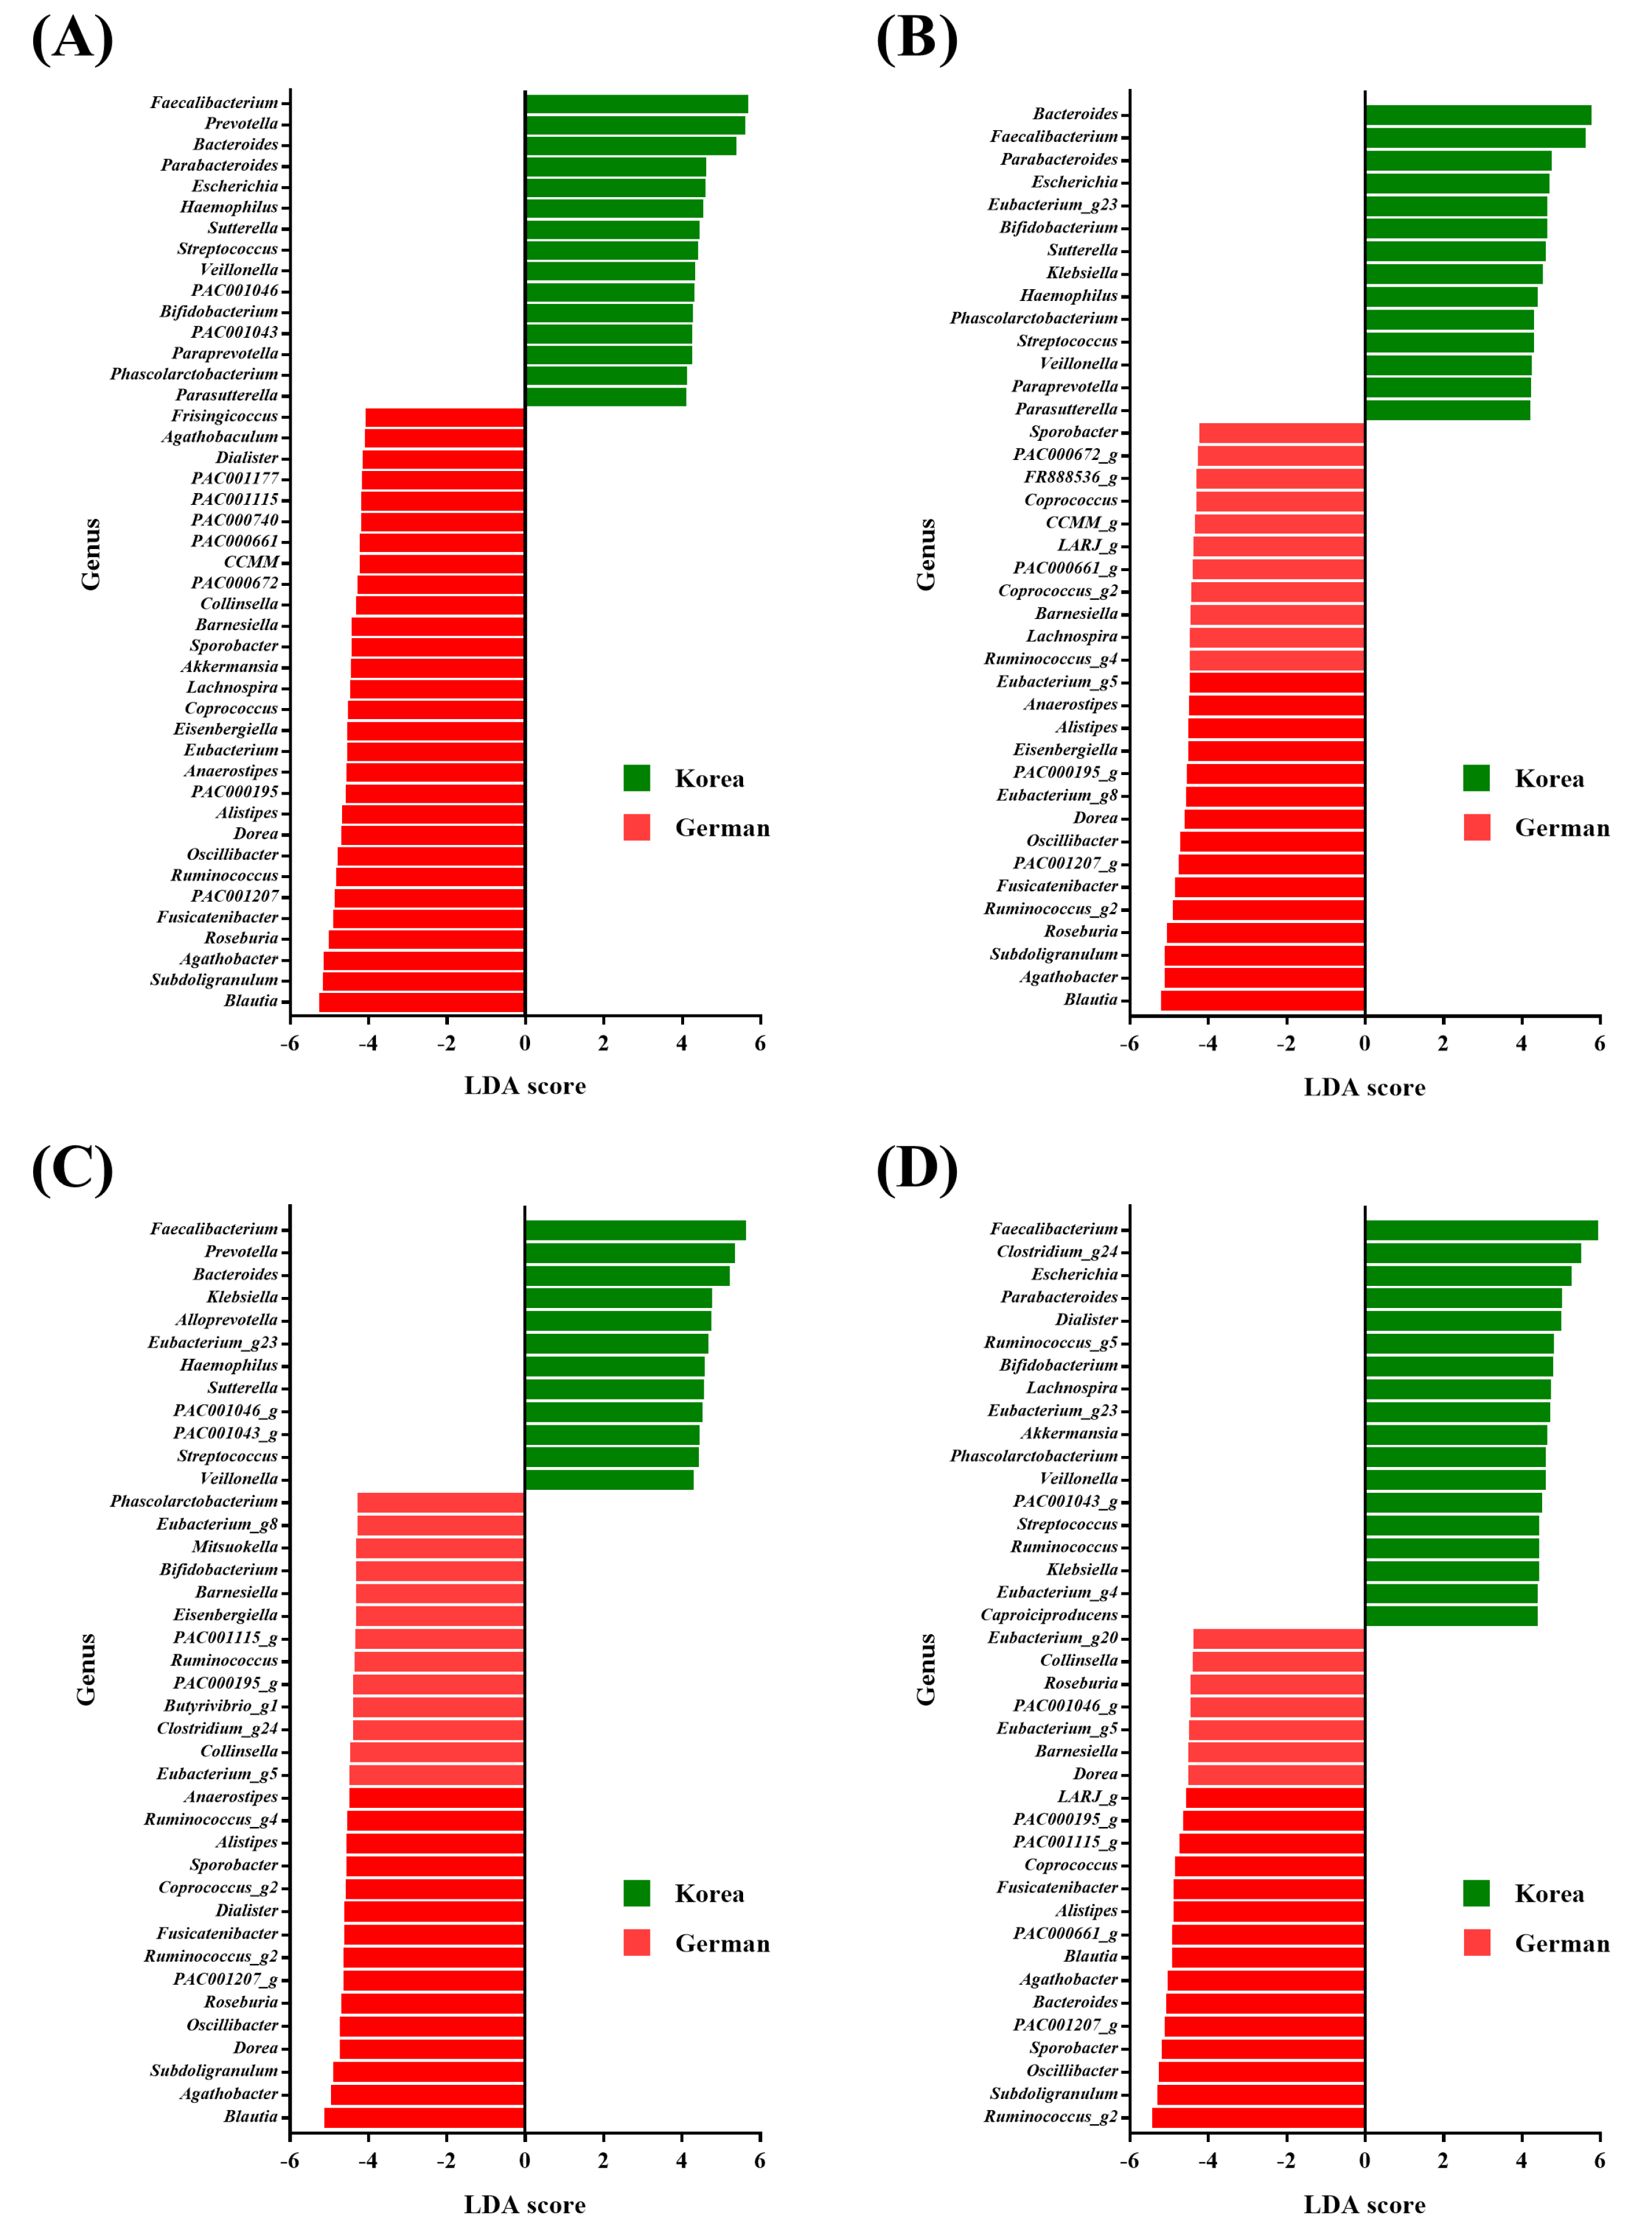
Next, LEfSe was applied to evaluate the differences in relative abundances between the German and Korean cohorts. When the genus abundances were compared, Blautia, Subdoligranulum, Agathobacter, Roseburia, and Fusicatenibacter were the top 5 taxa in the German cohort, while Faecalibacterium, Prevotella, Bacteroides, Parabacteroides, and Escherichia were the top 5 in the Korean cohort (Figure 4A). For the Bacteroides enterotype, Blautia, Subdoligranulum, Agathobacter, and Roseburia were the most abundant taxa in the German cohort, while Bacteroides, Faecalibacterium, Parabacteroides, and Escherichia were the most abundant in the Korean cohort (Figure 4B). For the Prevotella enterotype, Blautia, Agathobacter, Subdoligranulum, and Dorea were the most abundant in the German cohort, while Faecalibacterium, Prevotella, Bacteroides, Klebsiella, and Alloprevotella were the most abundant in the Korean cohort (Figure 4C). For the Ruminococcus enterotype, Ruminococcus, Subdoligranulum, Oscillibacter, and Sporobacter were the most abundant in the German cohort, while Faecalibacterium, Clostridium, Escherichia, Parabacteroides, and Dialister were the most abundant in the Korean cohort (Figure 4D).

3.4. Network Analysis

We also investigated microbial interaction networks to discern potential patterns of interaction. The Bacteroides enterotype network was the simplest, and the Ruminococcus enterotype network was the most complex network in both cohorts (Figure 5). In the Bacteroides enterotype network, Bacteroides was positively correlated with those of Blautia and Anaerostipes (Figure 5A,D). In the Prevotella enterotype network, Prevotella was positively correlated with those of Blautia, Bacteroides, and Faecalibacterium (Figure 5B,E). In the Ruminococcus enterotype network, a highly complex microbial interaction was observed in both cohorts (Figure 5C,F).

4. Discussion

A key objective in human microbiome research is to pinpoint and characterize bacterial taxa that significantly contribute to different diseases compared to individuals in good health. In the present study, relative abundances were calculated, and enterotypes were determined for each sample. Arumugam et al. found that gut microbiome samples can be stratified into three distinct robust clusters including the Bacteroides, Prevotella, and Ruminococcus enterotypes [29]. We found that the Bacteroides enterotype was the most abundant, followed by the Prevotella enterotype in both cohorts. Interestingly, the Prevotella enterotype was more abundant in the Korean cohort (35.1% vs. 14.9%). Enterotypes have been suggested to be strongly associated with diet; for example, a protein- and animal-fat-rich diet has been associated with the Bacteroides enterotype, while a carbohydrate-rich diet has been linked to the Prevotella enterotype [29]. Thus, the higher abundance of the Prevotella enterotype in the Korean cohort is consistent with a previous report [10].
Alpha diversity was estimated to evaluate the richness and evenness of the microbiome. The Korean cohort had a higher Chao1 index, which represents community richness. Since the Korean cohort had much greater input read and OTU counts, its higher Chao1 index may have been due to more input data. Regarding the Shannon index, which represents microbial community richness and evenness, the German cohort had the higher index [30]. A comparison of the structures of the microbiomes revealed that the cohort microbiome compositions were significantly different and that this was significantly dependent on enterotype. The Ruminococcus enterotype was mostly clustered within the Bacteroides enterotype. Wu et al. also reported that the Bacteroides enterotype is fused with the less well-distinguished Ruminococcus enterotype [31]. However, we found the Ruminococcus enterotype mainly clustered near the Prevotella enterotype, suggesting that these two enterotypes have features distinguishing them from the Bacteroides enterotype. Thus, we maintained three enterotypes during subsequent analysis.
When we analyzed the average relative abundance, the five most abundant phyla were Firmicutes, Bacteroidetes, Proteobacteria, Actinobacteria, and Verrucomicrobia. At the genus level, the top four most abundant genera in both cohorts were Bacteroides, Faecalibacterium, Prevotella, and Ruminococcus. Interestingly, the overall abundance of Faecalibacterium was higher in the Korean cohort compared to the German cohort. Faecalibacterium is a probiotic isolated from healthy human microbiota and has anti-inflammatory properties attributed to the production of butyrate [32,33]. Interestingly, Feacalibacterium has low abundances in Crohn’s disease and colon cancer [34,35].
Core microbiota include specific keystone species that are important for maintaining an efficiently functioning ecosystem [36]. Although the criteria used for quantifying the core microbiome vary, it is generally defined as the proportion of samples that share a set of microbial taxa, the relative abundances of shared taxa, or a combination of the two [37]. In this study, the core microbiome contained Bacteroides, Faecalibacterium, Parabacteroides, and Lachnospira. A mixture of bacteria, including Bacteroides and Parabacteroides, have been reported to suppress inflammatory responses induced by E. coli and to enhance epithelial tight junction barrier function [38]. Bacteroides, Faecalibacterium, and Lachnospira are member of butyrate producing bacteria in the gut microbiome [39]. Furthermore, butyrate is the primary source of energy for gut epithelial cells, and it also reduces inflammation and oxidative stress. Butyrate is also involved in cell growth, cell differentiation, intestinal motility, ion absorption, cholesterol synthesis, and energy expenditure [40].
Next, LEfSe was applied to evaluate the enterotype differences between the two cohorts. It has been established that gut microbiota composition depends on various factors, including age [41], geography, ethnicity [15], and lifestyle factors such as dietary habits [42] and exercise [43]. The Bacteroides enterotype exhibits a significant interaction with the Western-style diet [44], and persons with the Bacteroides enterotype have been reported to have consumed diets rich in animal protein and fat over long periods [45]. In 2015, average meat consumptions per capita in Germany and Korea were 88 and 67 kg, respectively (http://ourworlddata.org, accessed on 16 November 2023). On the other hand, the Prevotella enterotype has been strongly associated with a carbohydrate-rich diet. The Western-style carbohydrate-rich diet is characterized by high levels of refined carbohydrates, including sucrose, starch, fructose syrup, and white bread [46]. In contrast, traditional Korean diets are characterized by higher intakes of fermented vegetables and legumes such as kimchi and fermented soybean [47]. Thus, although the development of each enterotype might be dependent on overall protein or carbohydrate consumption, carbohydrate diet composition might also influence the composition of the gut microbiome.
Finally, microbial networks were analyzed to understand how microbiota interact within the community. Distinctive network complexities were observed in each enterotype group. The co-abundance of correlations in networks indicates strong community symbiosis. Furthermore, the gut is colonized by a complex community of indigenous microorganisms that interact to shape a reticular system that maintains the microbial composition [48,49,50]. However, these network maps represent patterns, not direct interactions, and many of the observed interactions may be due to microbes sharing a similar ecological niche. Further studies are required to reveal causal relationships between gut microbiota, related metabolic activity, and long-term health.
The limitation of this study is that only geographical background was considered for the analysis. More detailed analysis that addresses causal relationships between gut microbiota and clinical metadata is needed. Also, prospective observational or interventional studies should be conducted to improve understanding of the healthy gut microbiome. Furthermore, random sampling of larger sample sizes by an international consortium would be essential to define healthy gut microbiomes.
In conclusion, we investigated and compared the gut microbiome structures of healthy German and Korean subjects. Enterotype proportions different in the two cohorts and the richness and compositions of the gut microbiomes were found to depend significantly on enterotype and cohort. Based on the analysis of enterotype, we identified several common core microbiome and interaction networks, which suggests the existence of common ecological conditions. Our results expand understanding of the relationships between the gut microbiome and enterotype and geographic distribution. However, further investigations are needed to determine the nature of the relations between microbial properties and individual health statuses. We anticipate that precise enterotypes driven by age, gender, ethnicity, nutritional habits, and medication might be used to define healthy gut microbiomes and predict the health statuses of individuals.

Author Contributions

Conceptualization, H.S.N.; Formal analysis, H.S.N.; Investigation, Y.S.; Project administration, M.K.S.; Writing—original draft, M.K.S. and Y.S.; Supervision, J.C.; Writing—review & editing, J.C. and H.S.N.; Funding acquisition, Y.S. All authors have read and agreed to the published version of the manuscript.

Funding

This work was supported by a 2-Year Research Grant from Pusan National University, and supported by the Basic Science Research Program through the National Research Foundation of Korea (NRF), funded by the Ministry of Education (Grant no. NRF-2022R1I1A1A01062755).

Institutional Review Board Statement

Not applicable.

Informed Consent Statement

Not applicable.

Data Availability Statement

Publicly available datasets were analyzed in this study. This data can be found: https://www.ebi.uk.ac, accessed on 16 November 2023.

Conflicts of Interest

The authors declare no conflicts of interest.

References

  1. Frank, D.N.; Amand, A.L.S.; Feldman, R.F.; Boedeker, E.C.; Harpaz, H.; Pace, N.R. Molecular-phylogenetic characterization of microbial community imbalances in human inflammatory bowel diseases. Proc. Natl. Acad. Sci. USA 2007, 104, 13780–13785. [Google Scholar] [CrossRef] [PubMed]
  2. Leviatan, S.; Shoer, S.; Rothschild, D.; Gorodetski, M.; Segal, E. An expanded reference map of the human gut microbiome reveals hundreds of previously unknown species. Nat. Commun. 2022, 13, 3863. [Google Scholar] [CrossRef] [PubMed]
  3. Tuniyazi, M.; Li, S.; Hu, X.; Fu, Y.; Zhang, N. The Role of Early Life Microbiota Composition in the Development of Allergic Diseases. Microorganisms 2022, 10, 1190. [Google Scholar] [CrossRef] [PubMed]
  4. Khan, I.; Bai, Y.; Zha, L.; Ullah, N.; Ullah, H.; Shah, S.R.H.; Sun, H.; Zhang, C. Mechanism of the Gut Microbiota Colonization Resistance and Enteric Pathogen Infection. Front. Cell. Infect. Microbiol. 2021, 11, 716299. [Google Scholar] [CrossRef] [PubMed]
  5. Rowland, I.; Gibson, G.; Heinken, A.; Scott, K.; Swann, J.; Thiele, I.; Tuohy, K. Gut microbiota functions: Metabolism of nutrients and other food components. Eur. J. Nutr. 2018, 57, 1–24. [Google Scholar] [CrossRef] [PubMed]
  6. Haneishi, Y.; Furuya, Y.; Hasegawa, M.; Picarelli, A.; Rossi, M.; Miyamoto, J. Inflammatory Bowel Diseases and Gut Microbiota. Int. J. Mol. Sci. 2023, 24, 3817. [Google Scholar] [CrossRef] [PubMed]
  7. Igudesman, D.; Crandell, J.L.; Corbin, K.D.; Hoorper, J.; Thomas, J.M.; Bulik, C.M.; Pence, B.W.; Pratley, R.E.; Kosorok, M.R.; Maahs, D.M.; et al. Associations of Dietary Intake with the Intestinal Microbiota and Short-Chain Fatty Acids among Young Adults with Type 1 Diabetes and Overweight or Obesity. J. Nutr. 2022, 153, 1178–1188. [Google Scholar] [CrossRef] [PubMed]
  8. Stadlbauer, V. Liver-Gut-Interaction: Role of Microbiome Transplantation in the Future Treatment of Metabolic Disease. J. Pers. Med. 2023, 13, 220. [Google Scholar] [CrossRef]
  9. Clemente, J.C.; Ursell, L.K.; Laura, W.P.; Rob, K. The impact of the gut microbiota on human health: An integrative view. Cell 2012, 148, 1258–1270. [Google Scholar] [CrossRef]
  10. Lim, M.Y.; Hong, S.; Bang, S.J.; Chung, W.H.; Shin, J.H.; Kim, J.H.; Nam, Y.D. Gut Microbiome Structure and Association with Host Factors in a Korean Population. Msystems 2021, 6, e0017921. [Google Scholar] [CrossRef]
  11. Brandl, B.; Rennekamp, R.; Reitmeier, S.; Pietrynik, K.; Dirndorfer, S.; Haller, D.; Hofmann, T.; Skurk, T.; Hauner, H. Offering Fiber-Enriched Foods Increases Fiber Intake in Adults with or without Cardiometabolic Risk: A Randomized Controlled Trial. Front. Nutr. 2022, 9, 816229. [Google Scholar] [CrossRef] [PubMed]
  12. Takagi, T.; Inoue, R.; Oshima, A.; Sakazume, H.; Ogawa, K.; Tominaga, T.; Mihara, Y.; Sugaya, T.; Mizushima, K.; Uchiyama, K.; et al. Typing of the Gut Microbiota Community in Japanese Subjects. Microorganisms 2022, 10, 664. [Google Scholar] [CrossRef] [PubMed]
  13. Shi, X.; Ma, T.; Sakandar, H.A.; Menghe, B.; Sun, Z. Gut microbiome and aging nexus and underlying mechanism. Appl. Microbiol. Biotechnol. 2022, 106, 5349–5358. [Google Scholar] [CrossRef] [PubMed]
  14. Gupta, V.K.; Paul, S.; Dutta, C. Geography, Ethnicity or Subsistence-Specific Variations in Human Microbiome Composition and Diversity. Front. Microbiol. 2017, 8, 1162. [Google Scholar] [CrossRef] [PubMed]
  15. Gaulke, C.A.; Sharpton, T.J. The influence of ethnicity and geography on human gut microbiome composition. Nat. Med. 2018, 24, 1495–1496. [Google Scholar] [CrossRef]
  16. David, L.A.; Maurice, C.F.; Carmody, R.N.; Gootenberg, D.B.; Button, J.E.; Wolfe, B.E.; Ling, A.V.; Devlin, A.S.; Varma, Y.; Fischbach, M.A.; et al. Diet rapidly and reproducibly alters the human gut microbiome. Nature 2014, 505, 559–563. [Google Scholar] [CrossRef]
  17. Maier, L.; Pruteanu, M.; Kuhn, M.; Zeller, G.; Telzerow, A.; Anderson, E.E.; Brochado, A.R.; Fernandez, K.C.; Dose, H.; Mori, H.; et al. Extensive impact of non-antibiotic drugs on human gut bacteria. Nature 2018, 555, 623–628. [Google Scholar] [CrossRef]
  18. Nogacka, A.M.; Salazar, N.; Arboleya, S.; Suarez, M.; Frenandez, N.; Solís, G.; de los Reyes-Gavilán, C.G.; Gueimonde, M. Early microbiota, antibiotics and health. Cell. Mol. Life Sci. 2018, 75, 83–91. [Google Scholar] [CrossRef]
  19. Peterson, J.; Garges, S.; Giovanni, M.; Mclnnes, P.; Wang, L.; Schloss, J.A.; Bonazzi, V.; McEwen, J.E.; Wetterstrand, K.A.; Deal, C.; et al. The NIH Human Microbiome Project. Genome Res. 2009, 19, 2317–2323. [Google Scholar]
  20. Wei, L.Q.; Cheong, I.H.; Yang, G.H.; Li, X.G.; Kozlakidis, Z.; Ding, L.; Liu, N.N.; Wang, H. The Application of High-Throughput Technologies for the Study of Microbiome and Cancer. Front. Genet. 2021, 12, 699793. [Google Scholar] [CrossRef]
  21. Song, E.J.; Lee, E.S.; Nam, Y.D. Progress of analytical tools and techniques for human gut microbiome research. J. Microbiol. 2018, 56, 693–705. [Google Scholar] [CrossRef] [PubMed]
  22. Allali, I.; Arnold, J.W.; Roach, J.; Cadenas, M.B.; Butz, N.; Hassan, H.M.; Koci, M.; Ballou, A.; Mendoza, M.; Ali, R.; et al. A comparion of sequencing platforms and bioinformatics popelines for compositional analysis of the gut microbiome. BMC Microbiol. 2017, 17, 194. [Google Scholar] [CrossRef] [PubMed]
  23. Hall, M.; Beiko, R.G. 16S rRNA Gene Analysis with QIIME2. Methods Mol. Biol. 2018, 1849, 113–129. [Google Scholar] [PubMed]
  24. Yoon, S.H.; Ha, S.M.; Kwon, S.; Lim, J.; Kim, Y.; Seo, H.; Chum, J. Introducing EzBioCloud: A taxonomically united database of 16S rRNA gene sequences and whole-genome assemblies. Int. J. Syst. Evol. Microbiol. 2017, 67, 1613–1617. [Google Scholar] [CrossRef] [PubMed]
  25. Salonen, A.; Salojarvi, J.; Lahti, L.; de Vos, W.M. The adult intestinal core microbiota is determined by analysis depth and health status. Clin. Microbiol. Infect. 2012, 18, 16–20. [Google Scholar] [CrossRef]
  26. Segata, N.; Izard, J.; Waldron, L.; Gevers, D.; Miropolsky, L.; Garrett, W.S.; Huttenhower, C. Metagenomic biomarker discovery and explanation. Genome Biol. 2011, 12, R60. [Google Scholar] [CrossRef]
  27. Shannon, P.; Markiel, A.; Ozier, O.; Baliga, N.S.; Wang, J.T.; Ramage, D.; Amin, N.; Schwikowski, B.; Ideker, T. Cytoscape: A software environment for integrated models of biomolecular interaction networks. Genome Res. 2003, 13, 2498–2504. [Google Scholar] [CrossRef]
  28. Subelj, L.; Bajec, M. Unfolding communities in large complex networks: Combining defensive and offensive label propagation for core extraction. Phys. Rev. E 2011, 83, 036103. [Google Scholar] [CrossRef]
  29. Arumugam, M.; Raes, J.; Pelletier, E.; Le Paslier, D.; Yamada, T.; Mende, D.R.; Fernandes, G.R.; Tap, J.; Bruls, T.; Batto, J.-M.; et al. Enterotypes of the human gut microbiome. Nature 2011, 473, 174–180. [Google Scholar] [CrossRef]
  30. Pielou, E.C. Shannon’s formula as a measure of specific diversity: Its use and misuse. Am. Nat. 1966, 100, 463–465. [Google Scholar] [CrossRef]
  31. Wu, G.D.; Chen, J.; Hoffmann, C.; Bittinger, K.; Chen, Y.Y.; Keilbaugh, S.A.; Bewtra, M.; Knights, D.; Walters, W.A.; Knight, R.; et al. Linking long-term dietary patterns with gut microbial enterotypes. Science 2011, 334, 105–108. [Google Scholar] [CrossRef] [PubMed]
  32. Wrzosek, L.; Ciocan, D.; Borentain, P.; Spatz, M.; Puchois, V.; Hugot, C.; Ferrere, G.; Mayeur, C.; Perlemuter, G.; Cassard, A.-M. Transplantation of human microbiota into conventional mice durably reshapes the gut microbiota. Sci. Rep. 2018, 8, 6854. [Google Scholar] [CrossRef] [PubMed]
  33. Feng, J.; Tang, H.; Li, M.; Pang, X.; Wang, L.; Zhang, M.; Zhao, Y.; Zhang, X.; Shen, J. The abundance of fecal Faecalibacterium prausnitzii in relation to obesity and gender in Chinese adults. Arch. Microbiol. 2014, 196, 73–77. [Google Scholar] [CrossRef] [PubMed]
  34. Aprile, F.; Bruno, G.; Palma, R.; Mascellino, M.T.; Panetta, C.; Scalese, G.; Oliva, A.; Severi, C.; Pontone, S. Microbiota Alterations in Precancerous Colon Lesions: A Systematic Review. Cancers 2021, 13, 3061. [Google Scholar] [CrossRef] [PubMed]
  35. Andoh, A.; Nishida, A. Alteration of the Gut Microbiome in Inflammatory Bowel Disease. Digestion 2023, 104, 16–23. [Google Scholar] [CrossRef]
  36. Shetty, S.A.; Hugenholtz, H.; Lahti, L.; Smidt, H.; de Vos, W.M. Intestinal microbiome landscaping: Insight in community assemblage and implications for microbial modulation strategies. FEMS Microbiol. Rev. 2017, 41, 182–199. [Google Scholar] [CrossRef]
  37. Neu, A.T.; Allen, E.E.; Roy, K. Defining and quantifying the core microbiome: Challenges and prospects. Proc. Natl. Acad. Sci. USA 2021, 118, e2104429118. [Google Scholar] [CrossRef]
  38. Pan, M.; Barua, N.; Ip, M. Mucin-degrading gut commensals isolated from healthy faecal donor suppress intestinal epithelial inflammation and regulate tight junction barrier function. Front. Immunol. 2022, 13, 1021094. [Google Scholar] [CrossRef]
  39. Vital, M.; Karch, A.; Pieper, D.H. Colonic Butyrate-Producing Communities in Humans: An Overview Using Omics Data. Msystems 2017, 2, e00130-17. [Google Scholar] [CrossRef]
  40. Canani, R.B.; Costanzo, M.D.; Leone, L.; Pedata, M.; Meli, R.; Calignano, A. Potential beneficial effects of butyrate in intestinal and extraintestinal diseases. World J. Gastroenterol. 2011, 17, 1519–1528. [Google Scholar] [CrossRef]
  41. Odamaki, T.; Kato, K.; Sugahara, H.; Hashikura, N.; Takahashi, S.; Xiao, J.Z.; Abe, F.; Osawa, R. Age-related changes in gut microbiota composition from newborn to centenarian: A cross-sectional study. BMC Microbiol. 2016, 16, 90. [Google Scholar] [CrossRef] [PubMed]
  42. Zmora, N.; Suez, J.; Elinav, E. You are what you eat: Diet, health and the gut microbiota. Nat. Rev. Gastroenterol. Hepatol. 2019, 16, 35–56. [Google Scholar] [CrossRef] [PubMed]
  43. Allen, J.M.; Mailing, L.J.; Niemiro, G.M.; Moore, R.; Cook, M.D.; White, B.A.; Holscher, H.D.; Woods, J.A. Exercise Alters Gut Microbiota Composition and Function in Lean and Obese Humans. Med. Sci. Sport. Exerc. 2018, 50, 747–757. [Google Scholar] [CrossRef] [PubMed]
  44. Cabral, D.J.; Wurster, J.I.; Korry, B.J.; Penumutchu, S.; Belenky, P. Consumption of a Western-Style Diet Modulates the Response of the Murine Gut Microbiome to Ciprofloxacin. Msystems 2020, 5, e00317-20. [Google Scholar] [CrossRef] [PubMed]
  45. Fuczmarski, M.K.; Bodt, B.A.; Shupe, E.S.; Zonderman, A.B.; Evans, M.K. Dietary Patterns Associated with Lower 10-Year Atherosclerotic Cardiovascular Disease Risk among Urban African-American and White Adults Consuming Western Diets. Nutrients 2018, 10, 158. [Google Scholar] [CrossRef] [PubMed]
  46. Statovci, D.; Aguilera, M.; MacSharry, J.; Melgar, S. The Impact of Western Diet and Nutrients on the Microbiota and Immune Response at Mucosal Interfaces. Front. Immunol. 2017, 8, 838. [Google Scholar] [CrossRef]
  47. Patra, J.K.; Das, G.; Paramithiotis, P.; Shin, H.S. Kimchi and Other Widely Consumed Traditional Fermented Foods of Korea: A Review. Front. Microbiol. 2016, 7, 1493. [Google Scholar] [CrossRef]
  48. Aleti, G.; Baker, J.L.; Tang, X.; Alvarez, R.; Dinis, M.; Tran, N.C.; Melnik, A.V.; Zhong, C.; Ernst, M.; Dorrestein, P.C.; et al. Identification of the Bacterial Biosynthetic Gene Clusters of the Oral Microbiome Illuminates the Unexplored Social Language of Bacteria during Health and Disease. mBio 2019, 10, e00321-e19. [Google Scholar] [CrossRef]
  49. Mark Welch, J.L.; Rossetti, B.J.; Rieken, C.W.; Dewhirst, F.E.; Borisy, G.G. Biogeography of a human oral microbiome at the micron scale. Proc. Natl. Acad. Sci. USA 2016, 113, E791–E800. [Google Scholar] [CrossRef]
  50. Bowen, W.H.; Burne, R.A.; Wu, H.; Koo, H. Oral Biofilms: Pathogens, Matrix, and Polymicrobial Interactions in Microenvironments. Trends Microbiol. 2018, 26, 229–242. [Google Scholar] [CrossRef]
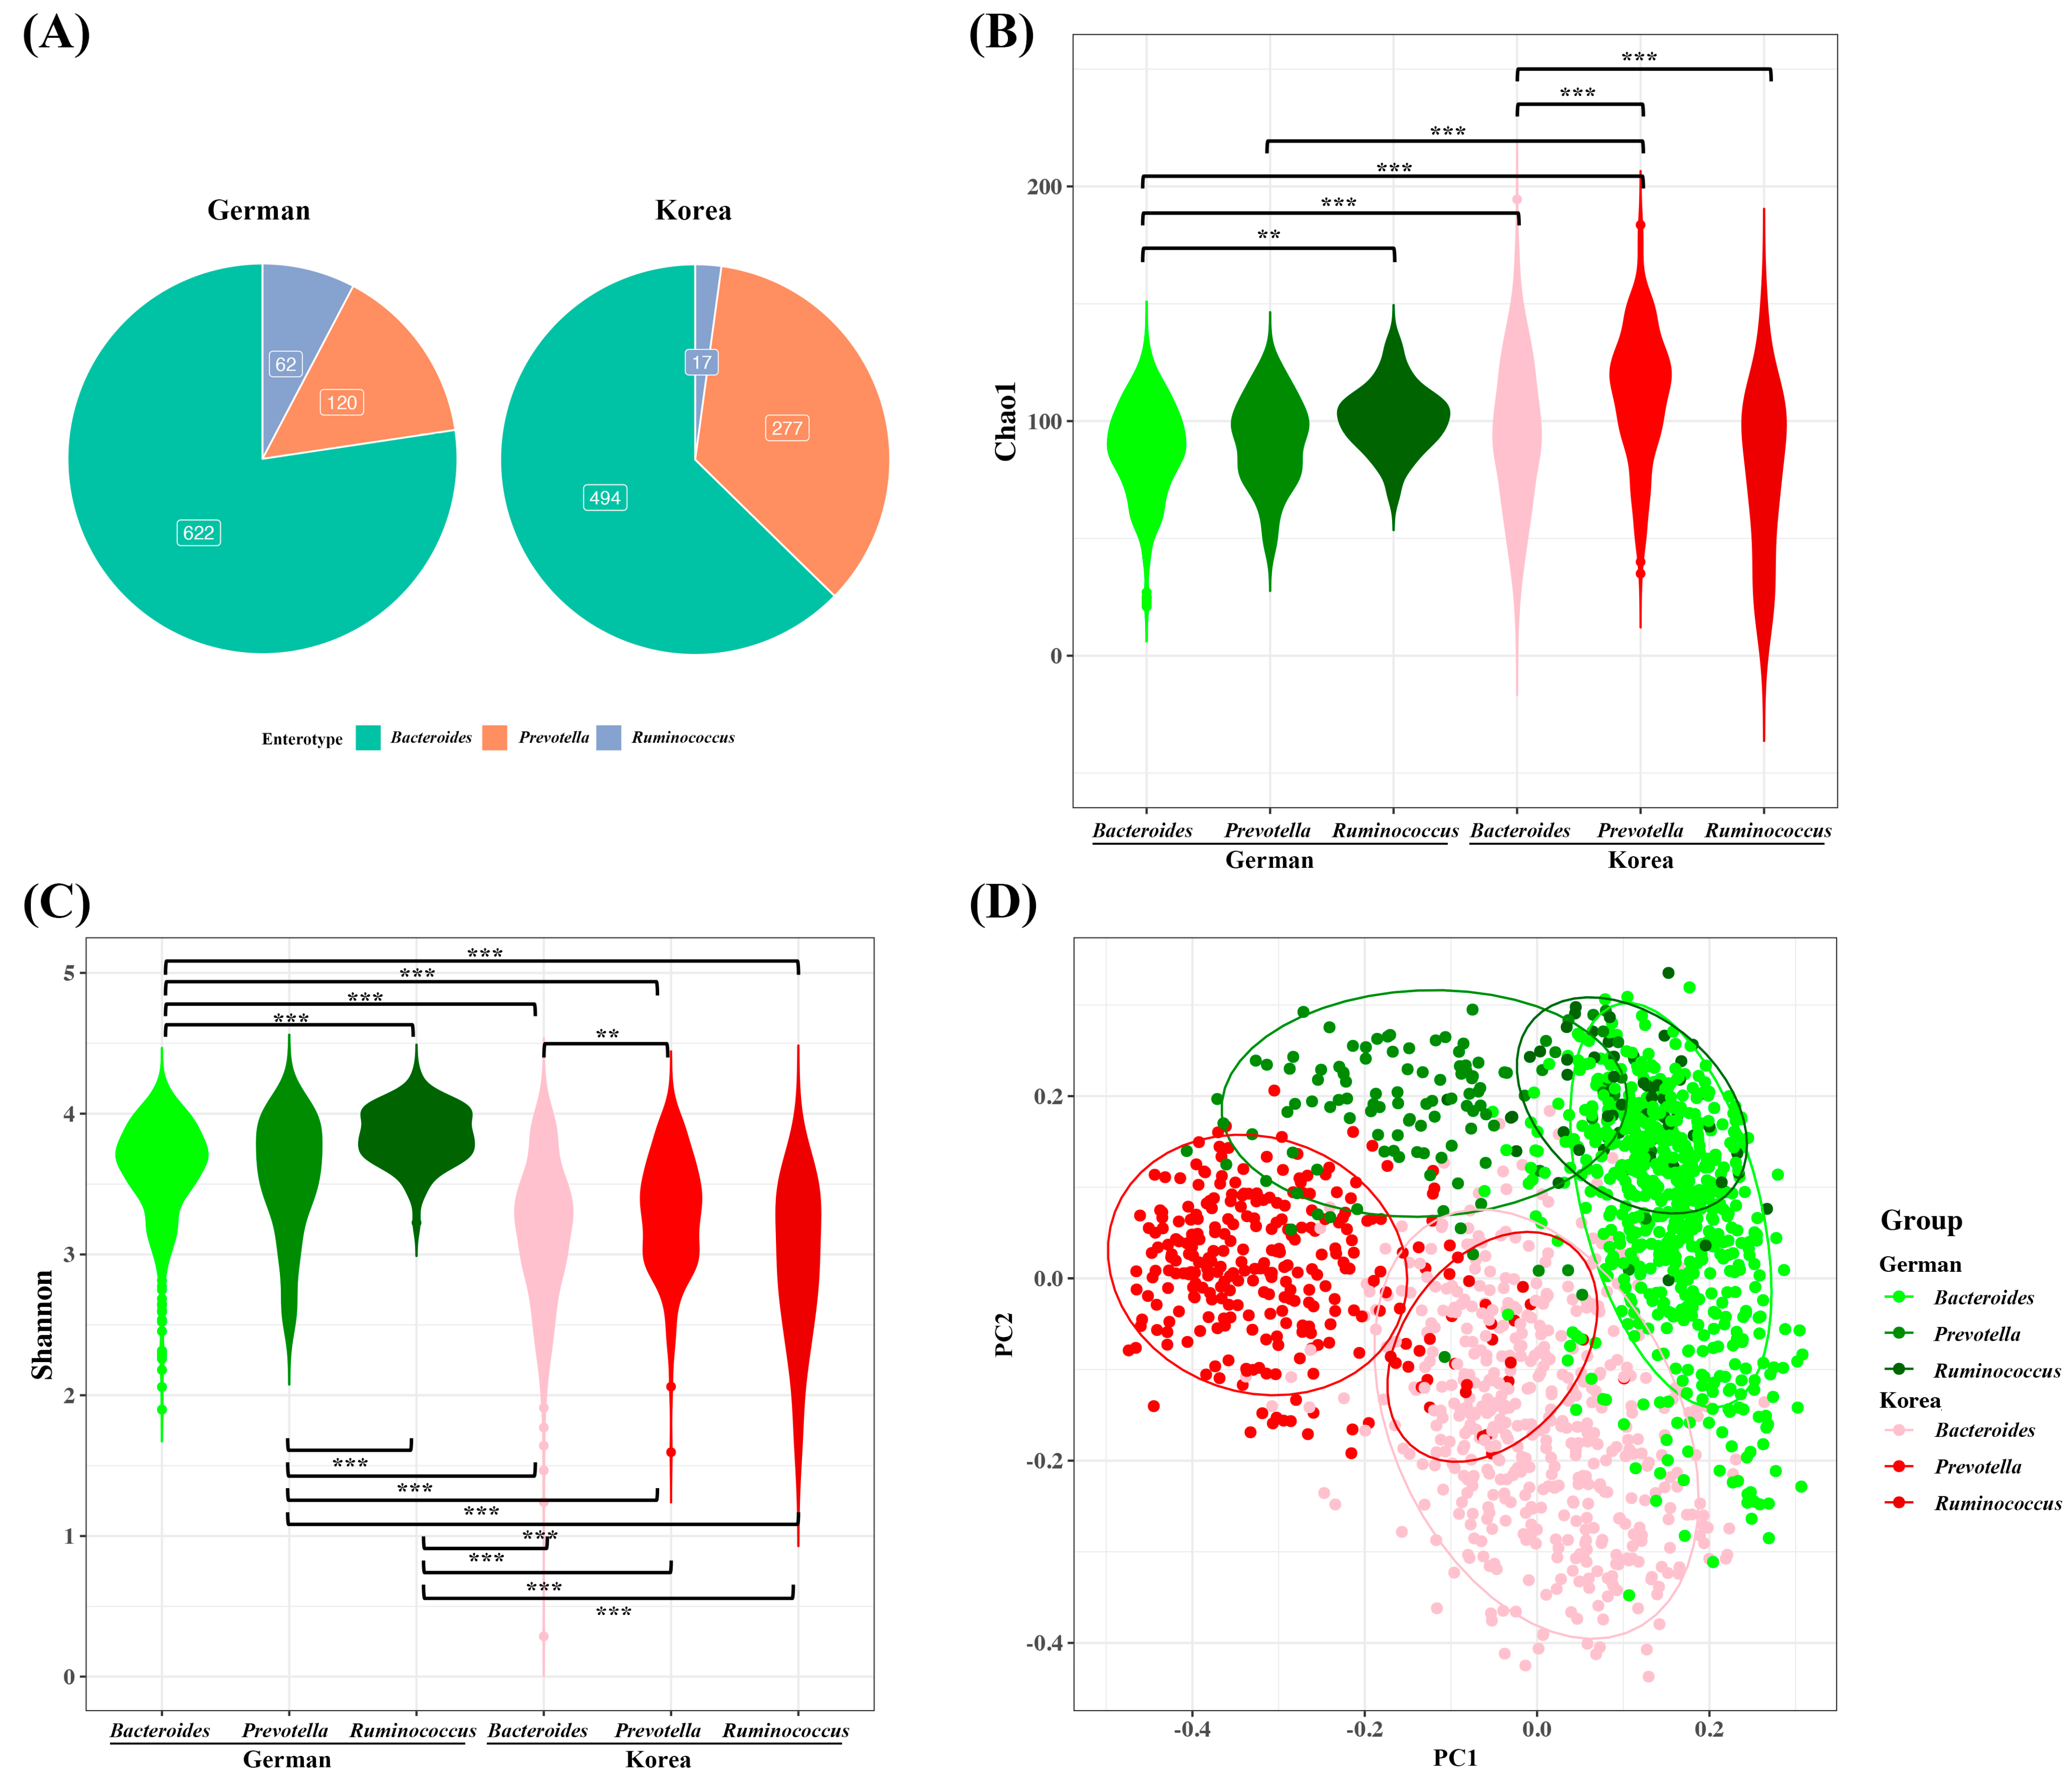
Figure 1. Bacterial community comparisons between the two cohorts. (A) Pie charts showing sample numbers of the different enterotypes in the two cohorts. (B,C) Alpha diversity. (B) Chao1 and (C) Shannon indices. (D) Beta diversity of the microbiome. Principal coordinates analysis (PCoA) was performed based on OTU abundances. ** p < 0.01, *** p < 0.001.
Microbiolres 15 00007 g001
Figure 2. Relative microbiome abundances by enterotype in the German and Korean cohorts at (A) phylum, (B) order, (C) family, and (D) genus levels.
Microbiolres 15 00007 g002
Figure 3. Heat map of the core microbiome by enterotype at the genus level. (A) German Bacteroides enterotype, (B) Korean Bacteroides enterotype, (C) German Prevotella enterotype, (D) Korean Prevotella enterotype, (E) German Ruminococcus enterotype, and (F) Korean Ruminococcus enterotype.
Microbiolres 15 00007 g003
Figure 4. Comparisons of the LDA scores of microbiota and significant taxa in the German and the Korean cohort (A) Total, (B) Bacteroides enterotype, (C) Prevotella enterotype, and (D) Ruminococcus enterotype. The analysis has been performed using linear discriminant analysis effect size (LefSe) method.
Microbiolres 15 00007 g004
Figure 5. Gut microbiome network analysis by enterotype at the genus level. (A) German Bacteroides enterotype, (B) German Prevotella enterotype, (C) German Ruminococcus enterotype, (D) Korean Bacteroides enterotype, (E) Korean Prevotella enterotype, and (F) Korean Ruminococcus enterotype. Bubbles represent a genus whose color varied with phylum according to the legend. A connection between two bubbles indicates the existence of a correlation between the corresponding genera. Green and red lines represent positive and negative correlations. Clusters of nodes that form coherent structural subsystems of interacting units are represented as distinct modules.
Microbiolres 15 00007 g005
Table 1. Summary of OTU* and sequence read counts during data pre-processing.
German Cohort
(PRJNA701859)
Korean Coort
(PRJEB33905)
Sample number804788
Input read count34,184 ± 10,067
(79,178–13,802)
134,103 ± 111,787
(1,076,815–24,859)
Filtered read count24,448 ± 764094,568 ± 73,972
Denoised read count23,548 ± 744992,642 ± 73,051
Merged read count21,364 ± 692488,912 ± 71,105
Non-chimeric read count16,783 ± 5229
(39,184–3873)
60,943 ± 46,978
(460,695–8075)
Percentage of input non-chimeric (%)49.1 ± 5.566.3 ± 12.4
Total OTU count24,18262,472
Paired read length432.1 ± 12.5432.6 ± 17.3
OTU*: Operational taxonomic unit.
Disclaimer/Publisher’s Note: The statements, opinions and data contained in all publications are solely those of the individual author(s) and contributor(s) and not of MDPI and/or the editor(s). MDPI and/or the editor(s) disclaim responsibility for any injury to people or property resulting from any ideas, methods, instructions or products referred to in the content.