Article

Enhancing Understanding of the Impact of Climate Change on Malaria in West Africa Using the Vector-Borne Disease Community Model of the International Center for Theoretical Physics (VECTRI) and the Bias-Corrected Phase 6 Coupled Model Intercomparison Project Data (CMIP6)

1
Laboratoire Environnement-Ingénierie-Télécommunication-Energies Renouvelables (LEITER), Unité de Formation et de Recherche de Sciences Appliquées et de Technologie, Université Gaston Berger de Saint-Louis, BP 234, Saint-Louis 32000, Senegal
2
Laboratoire de Physique de l’Atmosphère et de l’Océan–Siméon Fongang (LPAO-SF), Ecole Supérieure Polytechnique de l’Université Cheikh Anta Diop (UCAD), BP 5085, Dakar-Fann, Dakar 10700, Senegal
3
Programme National de Lutte Contre le Paludisme (PNLP), BP 5085, Dakar-Fann, Dakar 10700, Senegal
4
ESPACE-DEV, Université Montpellier, IRD, Université Guyane, Université Réunion, Université Antilles, Université Avignon, CEDEX 05, 34093 Montpellier, France
5
Laboratoire d’Océanographie et du Climat: Expérimentations et Approches Numériques (LOCEAN), Sorbonne Université, IRD, CNRS, MNHN, 75005 Paris, France
*
Author to whom correspondence should be addressed.
Microbiol. Res. 2023, 14(4), 2148-2180; https://doi.org/10.3390/microbiolres14040145
Submission received: 27 August 2023 / Revised: 27 November 2023 / Accepted: 14 December 2023 / Published: 18 December 2023

Abstract

:
In sub-Saharan Africa, temperatures are generally conducive to malaria transmission, and rainfall provides mosquitoes with optimal breeding conditions. The objective of this study is to assess the impact of future climate change on malaria transmission in West Africa using community-based vector-borne disease models, TRIeste (VECTRI). This VECTRI model, based on bias-corrected data from the Phase 6 Coupled Model Intercomparison Project (CMIP6), was used to simulate malaria parameters, such as the entomological inoculation rate (EIR). Due to the lack of data on confirmed malaria cases throughout West Africa, we first validated the forced VECTRI model with CMIP6 data in Senegal. This comparative study between observed malaria data from the National Malaria Control Program in Senegal (Programme National de Lutte contre le Paludisme, PNLP, PNLP) and malaria simulation data with the VECTRI (EIR) model has shown the ability of the biological model to simulate malaria transmission in Senegal. We then used the VECTRI model to reproduce the historical characteristics of malaria in West Africa and quantify the projected changes with two Shared Socio-economic Pathways (SSPs). The method adopted consists of first studying the climate in West Africa for a historical period (1950–2014), then evaluating the performance of VECTRI to simulate malaria over the same period (1950–2014), and finally studying the impact of projected climate change on malaria in a future period (2015–2100) according to the ssp245 ssp585 scenario. The results showed that low-latitude (southern) regions with abundant rainfall are the areas most affected by malaria transmission. Two transmission peaks are observed in June and October, with a period of high transmission extending from May to November. In contrast to regions with high latitudes in the north, semi-arid zones experience a relatively brief transmission period that occurs between August, September, and October, with the peak observed in September. Regarding projections based on the ssp585 scenario, the results indicate that, in general, malaria prevalence will gradually decrease in West Africa in the distant future. But the period of high transmission will tend to expand in the future. In addition, the shift of malaria prevalence from already affected areas to more suitable areas due to climate change is observed. Similar results were also observed with the ssp245 scenario regarding the projection of malaria prevalence. In contrast, the ssp245 scenario predicts an increase in malaria prevalence in the distant future, while the ssp585 scenario predicts a decrease. These findings are valuable for decision makers in developing public health initiatives in West Africa to mitigate the impact of this disease in the region in the context of climate change.

1. Introduction

Climate change and malaria exhibit intricate connections in West Africa. Malaria, a disease transmitted by mosquitoes primarily of the Anopheles genus, is caused by protozoan parasites belonging to the Plasmodium genus [1,2]. The transmission of malaria is influenced by environmental factors that render it highly responsive to shifts in climate patterns. Research focusing on the ramifications of climate change on malaria transmission underscores that even minor fluctuations in temperature or rainfall can trigger a rapid upsurge in disease propagation [3]. Moreover, rainfall plays a pivotal role in the proliferation of malaria by fostering suitable breeding sites for mosquito larvae and facilitating the expansion of mosquito populations [4]. As such, climatic variables stand as pivotal determinants in the transmission dynamics of malaria [5].
Malaria stands as one of the most pervasive and lethal diseases globally, with Africa, in particular, shouldering a substantial burden [6]. The 2022 report by the World Health Organization [7] reveals a continued increase in malaria cases from 2020 to 2021, albeit at a more moderate pace compared to the period spanning from 2019 to 2020. The global tally of malaria cases reached 247 million in 2021, in contrast to 245 million in 2020 and 232 million in 2019. The estimated count of malaria-related fatalities worldwide in 2021 was 619,000, a figure slightly lower than the 625,000 reported during the inaugural year of the COVID-19 pandemic. Preceding the pandemic, in 2019, malaria claimed 568,000 lives. Notably, the burden of malaria on Africa is disproportionately heavy, accounting for 95% of all cases and 96% of deaths within sub-Saharan Africa. Alarmingly, 80% of all malaria-related deaths across the continent occur in children under the age of five [7].
In West Africa, numerous studies have been conducted to understand the dynamics of mosquito populations and their connection to malaria using various dynamic models, such as LMM [8], MARA [9], and MIASMA [10]. These models have significantly enhanced our knowledge of the spread and evolution of malaria by considering the influence of average rainfall and temperature on malaria transmission. However, the VECTRI model distinguishes itself from others by not only incorporating the variability of climatic parameters but also considering surface hydrology and population densities in malaria transmission [11]. This integration makes the VECTRI model potentially more accurate in predicting malaria incidence compared to models that do not encompass these elements. Surface hydrology inputs are crucial in a malaria transmission model, as they provide essential information about potential breeding sites for vectors and capture the impact of rainfall on disease dynamics [12]. Despite the VECTRI model’s high potential for predicting malaria transmission dynamics, comprehensive studies utilizing this model in West Africa to forecast malaria transmission and distribution in the region are unfortunately lacking.
In our previous research, we have explored the relationship between climate and malaria [13] and examined the predictability of high malaria occurrences in Senegal [14]. Through these studies, we have already demonstrated the efficacy of the VECTRI model in simulating malaria transmission in this region. This has enabled us to employ the VECTRI model to investigate the impact of climate change on malaria in Senegal. In this study, we extend this earlier work to malaria scenarios in the context of climate change in West Africa. The focus of our study, presented in this paper, is to evaluate the past and current influence of seasonal and interannual climate variability on climate-sensitive diseases, specifically malaria, in West Africa. A previous study [15] conducted a rigorous validation of several malaria models, including the VECTRI model, in Africa. It showed that, although the VECTRI model tends to overestimate prevalence, the spatial pattern of simulated malaria prevalence rates by the VECTRI model is directly comparable to the gold standard datasets for spatial malaria risk estimation (MAP). Additionally, it is worth mentioning that the VECTRI model has been successfully validated in various African countries, including Uganda, Rwanda, Malawi, Kenya, Ghana, and Cameroon, as demonstrated by previous studies [12,16,17,18]. These studies have shown satisfactory results in terms of the model’s performance.
These findings enable us to use the VECTRI model for simulating climate change in West Africa, since the performance and limitations of the model have been carefully documented in [15]. To complement this study, we also perform a validation of the VECTRI model in Senegal, where high-quality data on malaria cases were available.
To conduct this assessment, we will utilize the VECTRI model, which is driven by bias-corrected CMIP6 data using the cumulative distribution function transformation (CDF-t) method. To achieve our objective, we will first evaluate the bias-corrected data derived from the global climate model (GCM). This allows to quantify the sensitivity of the bias-corrected data, thereby enhancing our understanding of the impact of climate change on malaria.

2. Materials and Methods
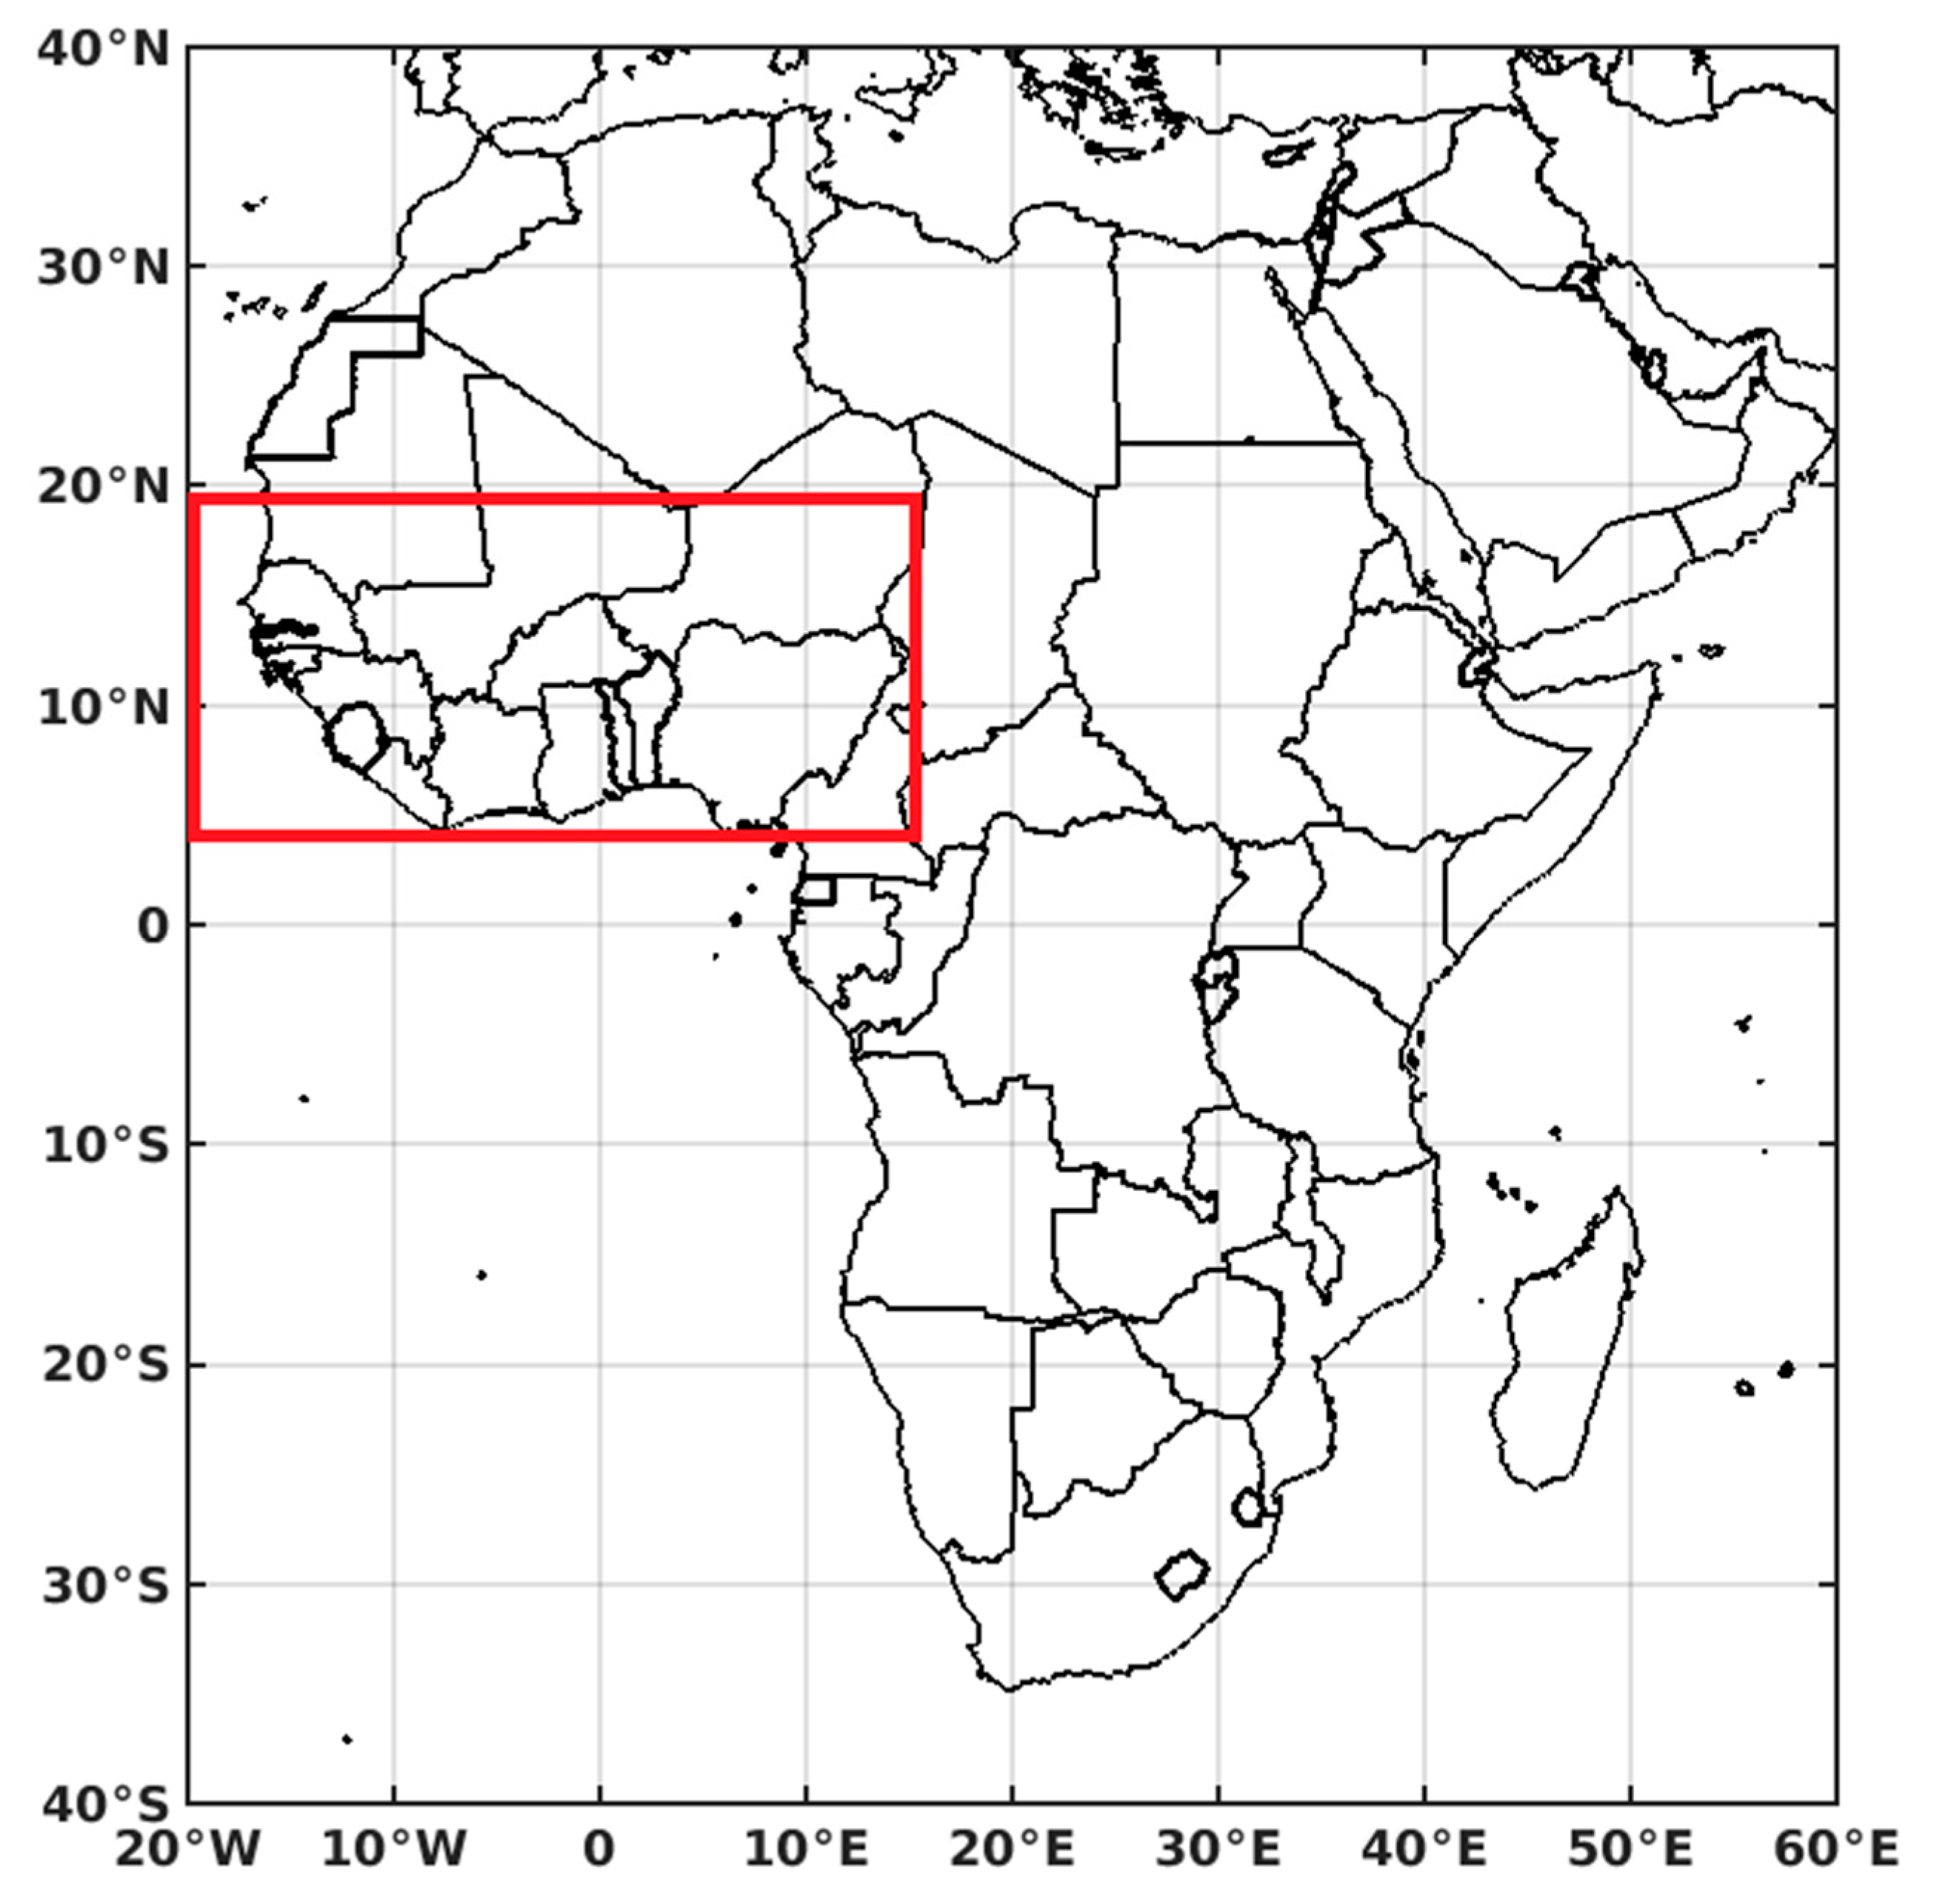
2.1. Study Area

This study focuses on the West African region, located between latitudes 4° N to 18° N and longitudes 20° W to 5° W. This area encompasses 16 member countries: Benin, Burkina Faso, Côte d’Ivoire, Cape Verde, Gambia, Ghana, Guinea, Guinea-Bissau, Liberia, Mali, Mauritania, Niger, Nigeria, Senegal, Sierra Leone, and Togo, with an estimated population exceeding 412 million (Figure 1). Malaria is endemic in this region, characterized by significant consequences for the entire population.
In 2021, West Africa documented around 63.2 million cases of malaria, accounting for 92.5% of the total cases within the region, with reported deaths of 26,500 [7]. The region undergoes two distinct seasons, the rainy season and the dry season, resulting from the interaction between two migrating air masses—the warm, dry continental tropical air mass and the moisture-laden maritime or equatorial tropical air mass [19,20]. The climatic conditions, particularly high temperatures and year-round rainfall, establish a conducive environment, including vegetation, that supports the reproduction and survival of malaria vectors [1]. The countries have been represented on Figure 1 using the coordinates shown in Table 1.

2.2. Malaria Surveillance Data

This study utilizes clinical data on the number of confirmed malaria cases, which were obtained from the National Malaria Control Program (Programme National de Lutte contre le Paludisme, PNLP) in Senegal. The data, collected annually and categorized by region, cover the period from 2009 to 2014 and encompass all age groups. The confirmed malaria cases included in this study originate from various health districts across Senegal’s 14 administrative regions: Dakar, Diourbel, Fatick, Kaffrine, Kaolack, Kédougou, Kolda, Louga, Matam, Saint-Louis, Sédhiou, Tambacounda, Thiès, and Ziguinchor. The PNLP conducts surveys in these health districts and hospitals to gather and record this information. The National Malaria Control Program (NMCP) envisions working collaboratively with all sectors to alleviate malaria as a burden that impedes the country’s socio-economic development. The regions were located from the coordinates presented in Table 2.

2.3. Bias-Corrected CMIP6 GCM Models Used in This Study

In recent years, the issue of bias correction in global climate models (GCMs) has gained significant attention in dynamic downscaling studies [21,22,23]. The ability to project the Earth’s future climate on a finer scale is crucial for climate-related research, particularly in understanding the impacts of extreme weather events on health, water resources, agriculture, air quality, and wind energy [24]. The traditional approach to dynamic downscaling involves integrating a regional climate model (RCM) with the initial and boundary conditions from a general circulation model (GCM) [25,26,27]. In this study, the CDF-t method developed by [28] was employed to correct the dynamic distribution of key climate parameters for impact simulations using CMIP6 data. The Cumulative Distribution Function-transform (CDF-t) approach was then applied to temperature and precipitation [29,30,31,32]. This method was recently used for the bias correction of the CMIP5 data by [33], which served as a model for the bias correction of the CMIP6 data for West Africa. This downscaling technique has significantly improved the accuracy of dynamic simulations, enabling more reliable projections of the Earth’s future climate, as demonstrated in the work of [34,35].
The CMIP6 data simulations cover the period from 1850 to 2014 (historical) and from 2015 to 2100 (projections) on a daily time scale. In its sixth report [36], the Intergovernmental Panel on Climate Change (IPCC) refers to five scenarios known as “Shared Socio-economic Pathways” (SSPs) to examine potential future impacts. Unlike Representative Concentration Pathways (RCPs), SSPs are scenarios of projected global socio-economic change up to 2100, representing five different future societies with very different challenges in terms of climate change mitigation and adaptation. These trends are then used to design greenhouse gas (GHG) emission trajectories using integrated assessment models (IAM). These SSP scenario experiments fall into two main categories: SSPs and RCPs. Indeed, the three numbers in the name of each experiment indicate the two paths. The first number reflects the SSP scenario, representing the socio-economic challenges of mitigation and adaptation. The five scenario categories are: SSP1 “Green and sustainable pathway”, SSP2 “Middle of the road”, SSP3 “regional rivalry”, SSP4 “inequality”, and SSP5 “Fossil-fuel-fueled development”. The second and third digits of each experiment denote the associated Radiative Climate Forcing (RCP) (for example, SSP1-2.6, SSP2-4.5, and SSP5-8.5) [37,38]. The numbering indicates the amount of radiative forcing measured in watts per square meter that would be achieved by 2100 (i.e., 2.6, 4.5, 6.0, and 8.5 W/m2 change compared with the pre-industrial period) [39].
The models used in this study are listed in Table 3. They are available at various spatial resolutions, as shown in Table 3. The reference period chosen for this study extends from 1950 to 2014.

2.4. VECTRI Malaria Model

For this study, the vector-borne disease community model of ICTP, Trieste (VECTRI), was utilized. The VECTRI model is a newly developed community dynamic model of malaria by the Abdus Salam International Center for Theoretical Physics (ICTP). It incorporates the influence of two crucial meteorological parameters, temperature and rainfall, along with population density, on malaria transmission. The model is based on a set of equations that capture the life cycles of malaria vectors and parasites, specifically focusing on Anopheles gambiae mosquitoes and the Plasmodium falciparum parasite responsible for malaria. The VECTRI model explicitly resolves the growth of immature stages (egg, larva, and pupa), as well as the gonotrophic and sporogonic cycles, using compartments for each process. The larvae are divided into different compartments, representing various stages of development and reflecting the density of larvae at each growth stage. The vector’s life cycle is divided into the development of the egg into the female and the infective state. The vectors progress through their developmental stages until they reach the final compartment, becoming infective to humans [11]. This study utilizes the VECTRI_v1.6 version.
The larval growth rate is determined according to the degree-day concept [47]. It is related to water temperature (Twat) by the following function:
R L = T wat T L , m i n K L
Larval development is influenced by larval overpopulation, which results from competition for resources [48]. This variable is taken into account in the VECTRI model by reducing the survival rate proportionally as a function of a factor associated with resource constraints and is given by:
P L ,   surv = 1 M L w M L , m a x K flush   P L ,   surv   0
Egg development follows a rhythm determined by the local air temperature at 2 m (T2m), again using the degree-day concept [49]. Gonotrophic and sprogonic development rhythms are therefore defined, respectively, as follows:
R gono = T 2 m T gono   m i n K gono
R sporo = T 2 m T sporo , min   K sporo
High air temperatures tend to increase vector mortality. According to the studies [50,51], the survival rate is given as a quadratic function of temperature:
P V ,   surv   1 = K m a r   1,0 + K m a r   1,1 T 2 m + K m a r   1,2 T 2 m 2
The VECTRI model has the unique feature of integrating interactions between the human host (H) and vectors using the human bite rate (hbr), which can be expressed as follows:
h b ¯ r = 1 e H τ zoo j = 1 N sparo     V ( 1 , j ) H
Factor 1—eτzoo—represents the vector’s level of preference for different members of the species. The exponential factor reflects this, the population density of the e-fold for the effect, and it is set at τzoo = 50 km−2. This allows the model to avoid producing high bite rates and EIRs for sparsely populated areas.
The probability of transmission from an infectious vector to a host after a single bite is denoted P v h . If its value is assumed to be constant, the transmission probability for an individual receiving n infectious bites is given by ( 1 ( 1 P v h ) n ) . The overall daily transmission probability per person is then expressed as follows [11]:
P v h = n = 1 G E I R ( 1 ( 1 P v h ) n )
The VECTRI model has a simple surface hydrology scheme that gives, at each time step, a calculation of the fractional coverage of each model mesh by potential breeding sites for the malaria vector obtained by:
w = w p e r m + w p o n d
Determining the fractional aggregated net cover with permanent pools, wperm, is a major challenge. The VECTRI model sets wperm to zero by default in every grid cell, as it is a significant challenge. However, by knowing the permanent water bodies for an area wperm can be set appropriately in the model. As a result, the availability of breeding sites is dominated by ephemeral seasonal ponds. In the current version of the model used, the fractional coverage of temporary ponds, wpond, derived from a simple water balance model is expressed as follows [11].
d w p o n d d t = K w P w m a x w p o n d w p o n d   E + I
The default values of these parameters used by the VECTRI model are shown in Table 4 below.
Following the simulation, the output data provide various variables, as listed in Table 5.

2.5. Method

Firstly, we validated the VECTRI model using bias-corrected CMIP6 data, specifically in Senegal, covering the period from 2009 to 2014. This validation aims to compare the EIR variable with the number of confirmed malaria cases to assess the ability of global climate models, implemented through the VECTRI model, to simulate this disease. It is important to acknowledge the challenge of limited observational data in West Africa, which restricts the possibility of conducting a comprehensive validation in this region. Hence, this initial step will be focused on Senegal, where reliable data on confirmed malaria cases are available for a span of six years. Our study serves as a starting point, and as more comprehensive data on malaria cases covering the entire West African region become available, further refinements and validations can be made to improve the accuracy and generalizability of our findings. This study best allows us to see the link between climate and the transmission of malaria in West Africa.
Subsequently, we proceed with an impact study that involves replicating the historical trends of malaria in West Africa. We will then quantify the projected changes under two socio-economic scenarios: ssp245 and ssp585. The SSP2-4.5 scenario of the “medium” socio-economic family SSP2 with a nominal radiative forcing level of 4.5 W m−2 by 2100 corresponds approximately to the RCP-4.5 scenario, and the “higher” scenario SSP5-8.5 marks the upper limit of the SSP scenario spectrum with a high reference scenario in a world with high fossil fuel development throughout the 21st century, corresponding to scenario RCP-8.5 [57]. To do so, we use climate data from global climate models, which have been corrected to develop malaria indices for different climatological periods. These periods include the historical timeframe from 1950 to 2014, as well as the future period spanning from 2015 to 2100.
Climate data from the CMIP6 project, which have been corrected to eliminate any bias, were obtained with daily temporal resolution for two variables, precipitation (in mm/day) and temperature (in °C), covering both historical (1950–2014) and future periods (2014–2100). These data were then used as inputs to run the VECTRI model. Specific geographical areas, in this case Senegal and West Africa, were extracted using the CDO (Climate Data Operators) tool based on the following coordinates: 12° to 17° latitude and −18° to −11° longitude for Senegal and 4° to 18° latitude and −20° to −5° longitude for West Africa.
After the simulations, various variables were generated as outputs, the details of which are listed in Table 5. One of these variables, the EIR (entomological inoculation rate), which is one of the malaria parameters linking this disease to climatic conditions through precipitation and temperature, was extracted from these outputs and analyzed in depth throughout the study to assess climate-influenced malaria transmission. The determinant of the EIR depends on climatic and environmental conditions. The EIR directly quantifies parasitized mosquitoes and their propensity to transmit parasites to humans. Estimates of the EIR therefore make it possible to link the biting activity of Anopheles vectors to humans directly to climate [58,59,60].
Subsequently, all variables (rainfall, temperature, the EIR, and confirmed cases) were converted to monthly data in order to conduct a spatio-temporal study. This study included an analysis of annual and interannual cycles, spatial distributions, annual and interannual Hovmöller diagrams, and intra- and interannual Hovmöller diagrams. Matlab software (version: R2022b) was used for these analyses.
With regard to data collection, the specific geographical coordinates of each West African country are provided in Table 1, while those of Senegal’s regions are listed in Table 2.

3. Results and Discussion

3.1. Models’ Evaluation

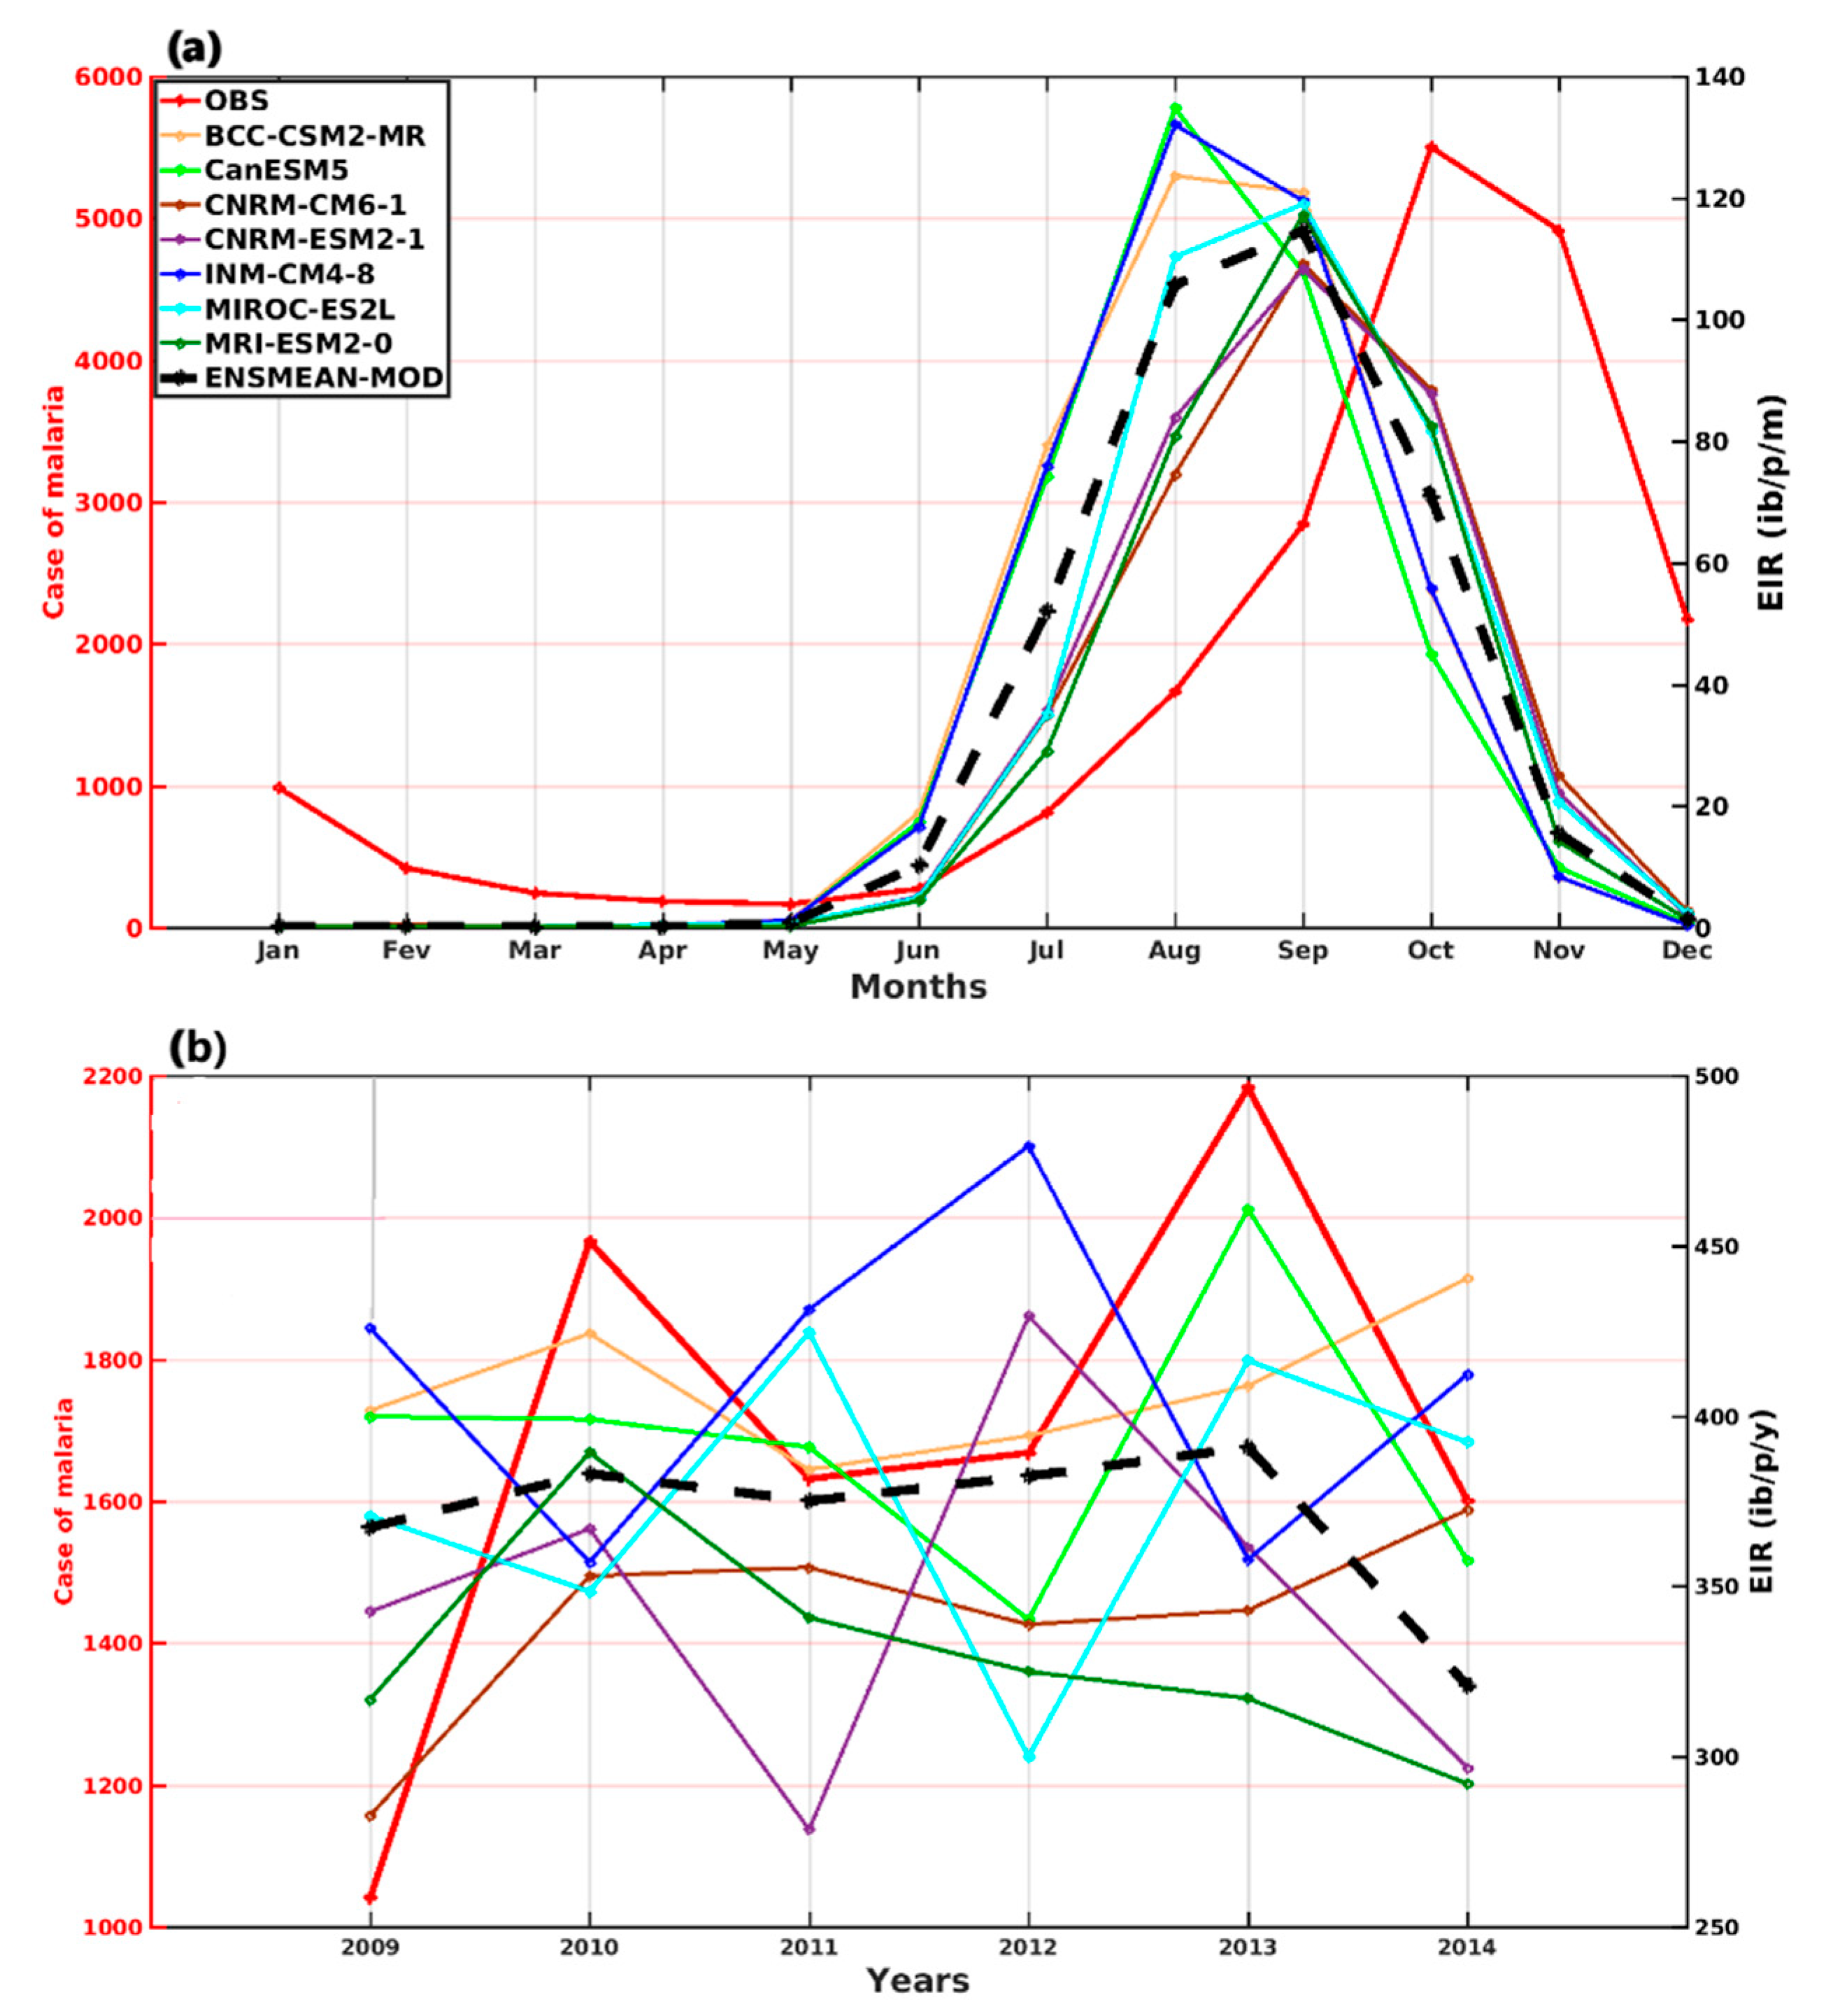
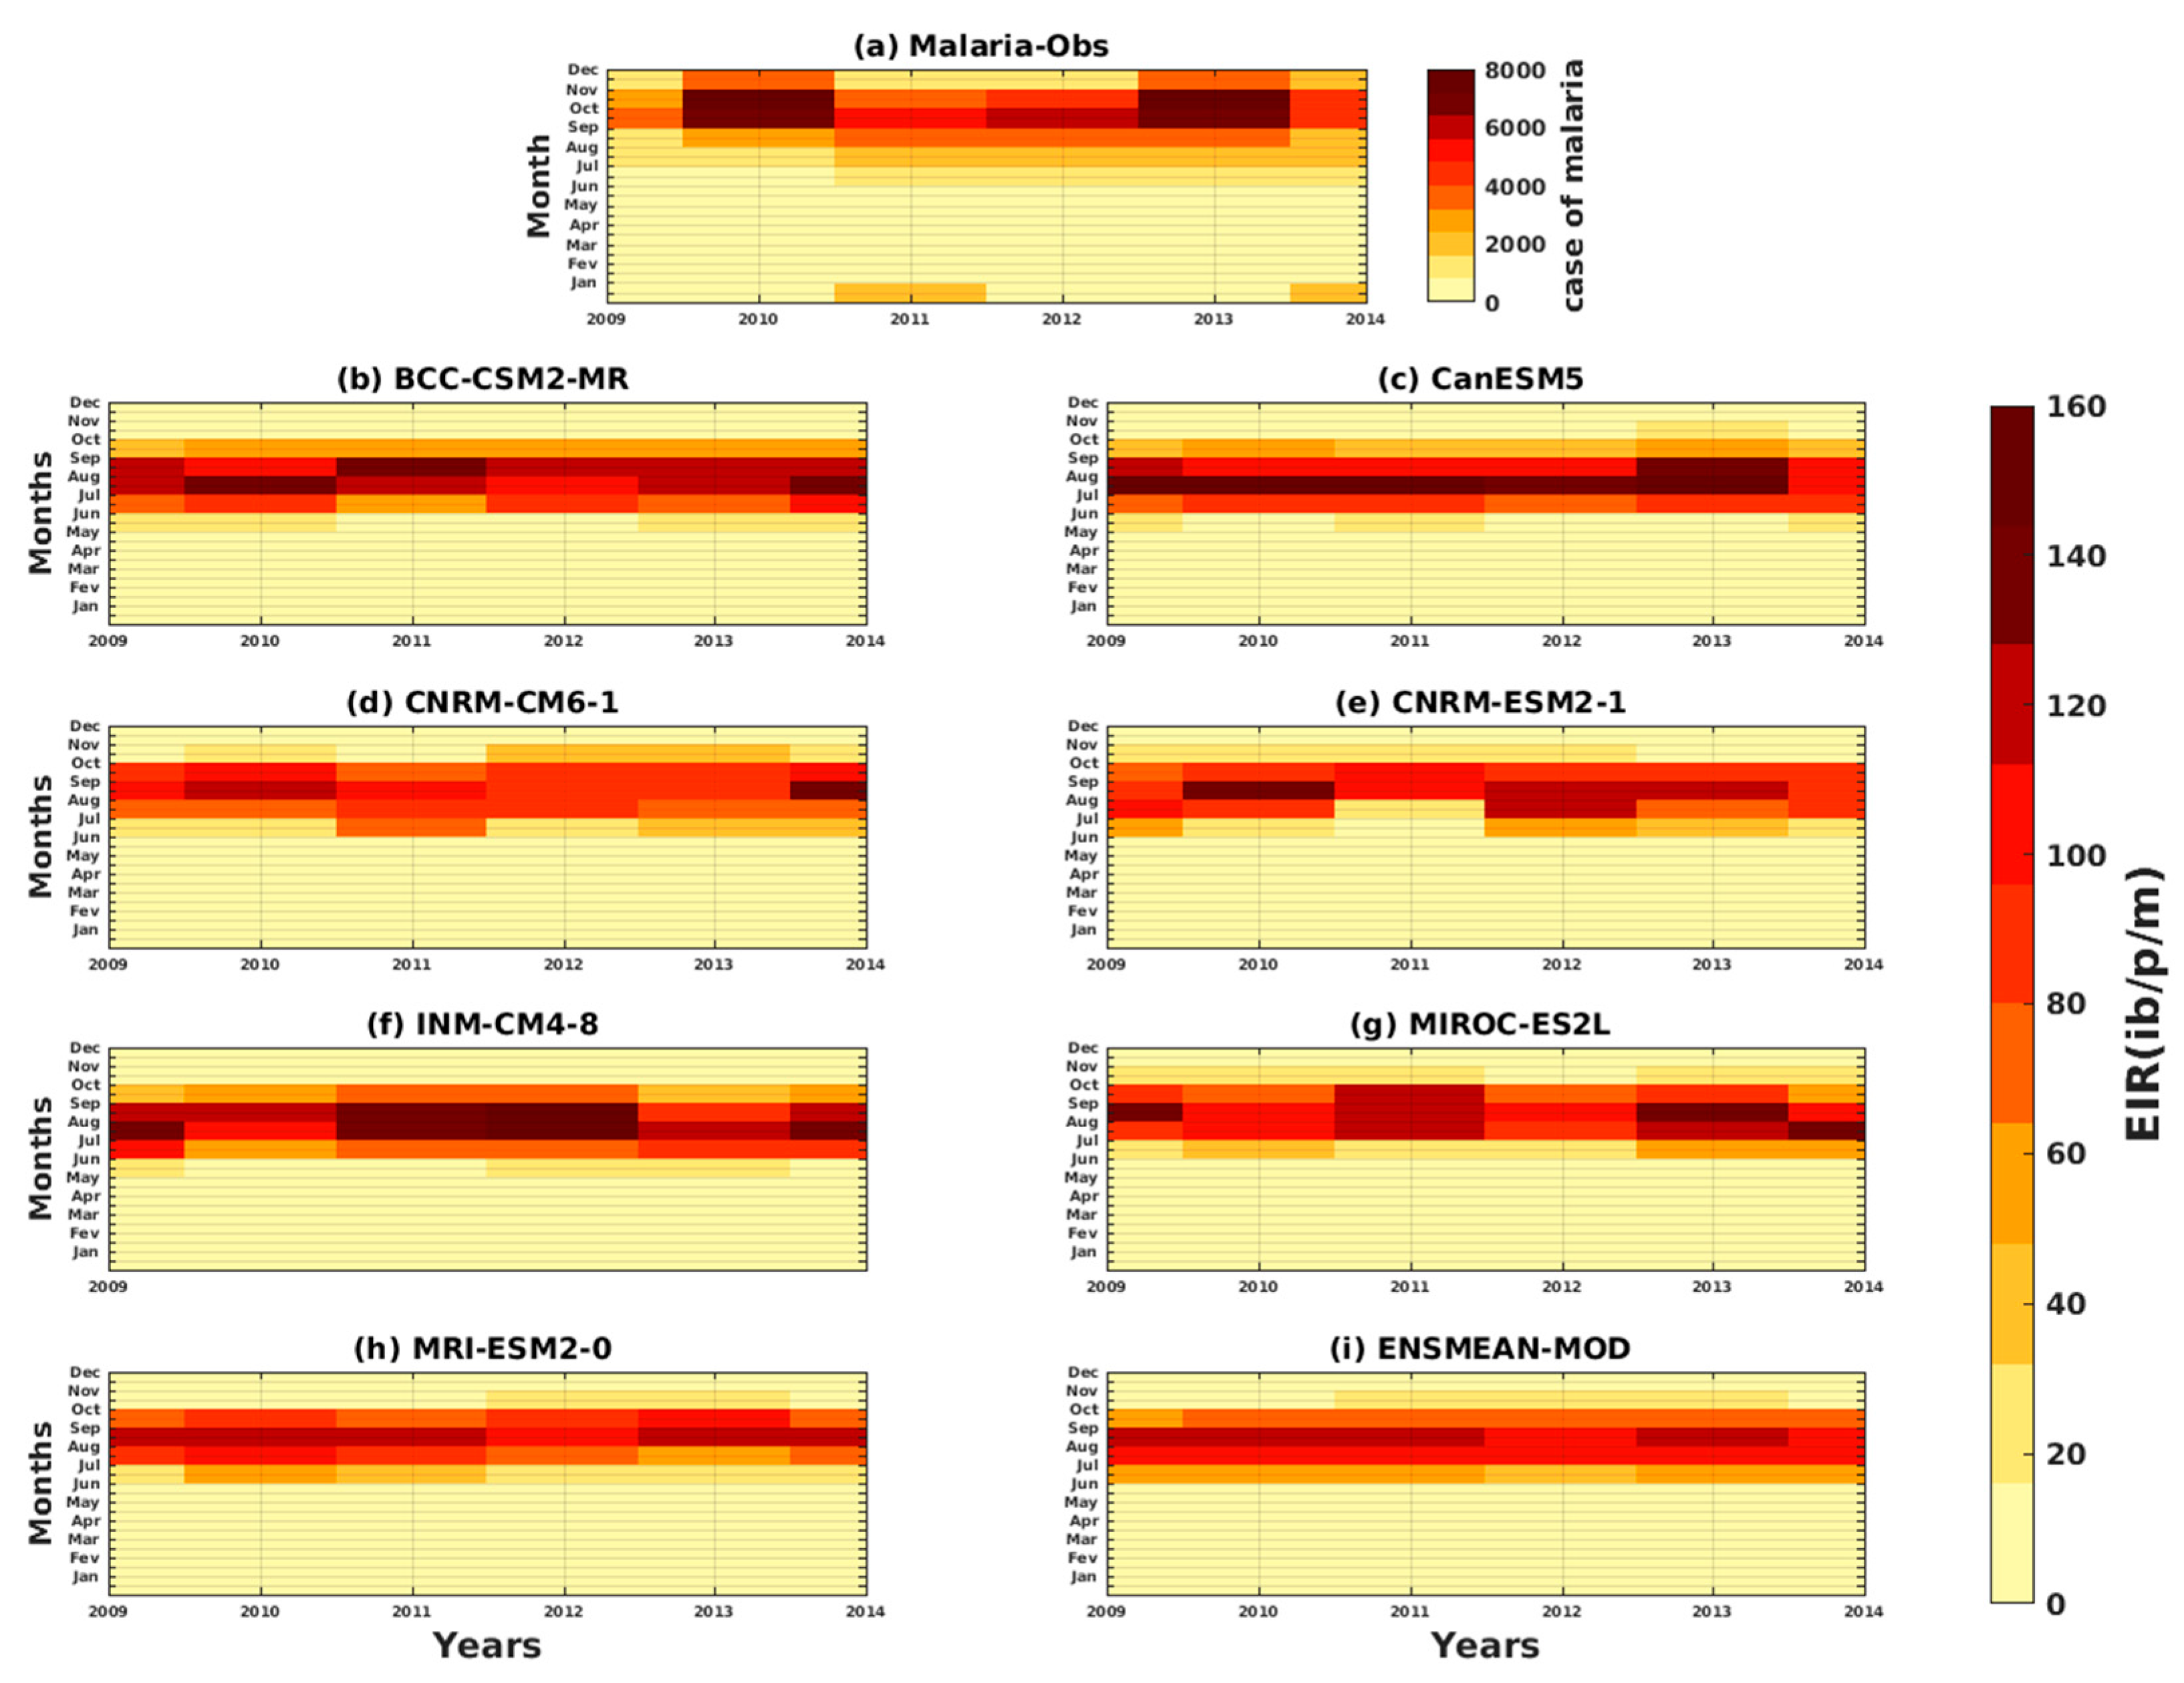
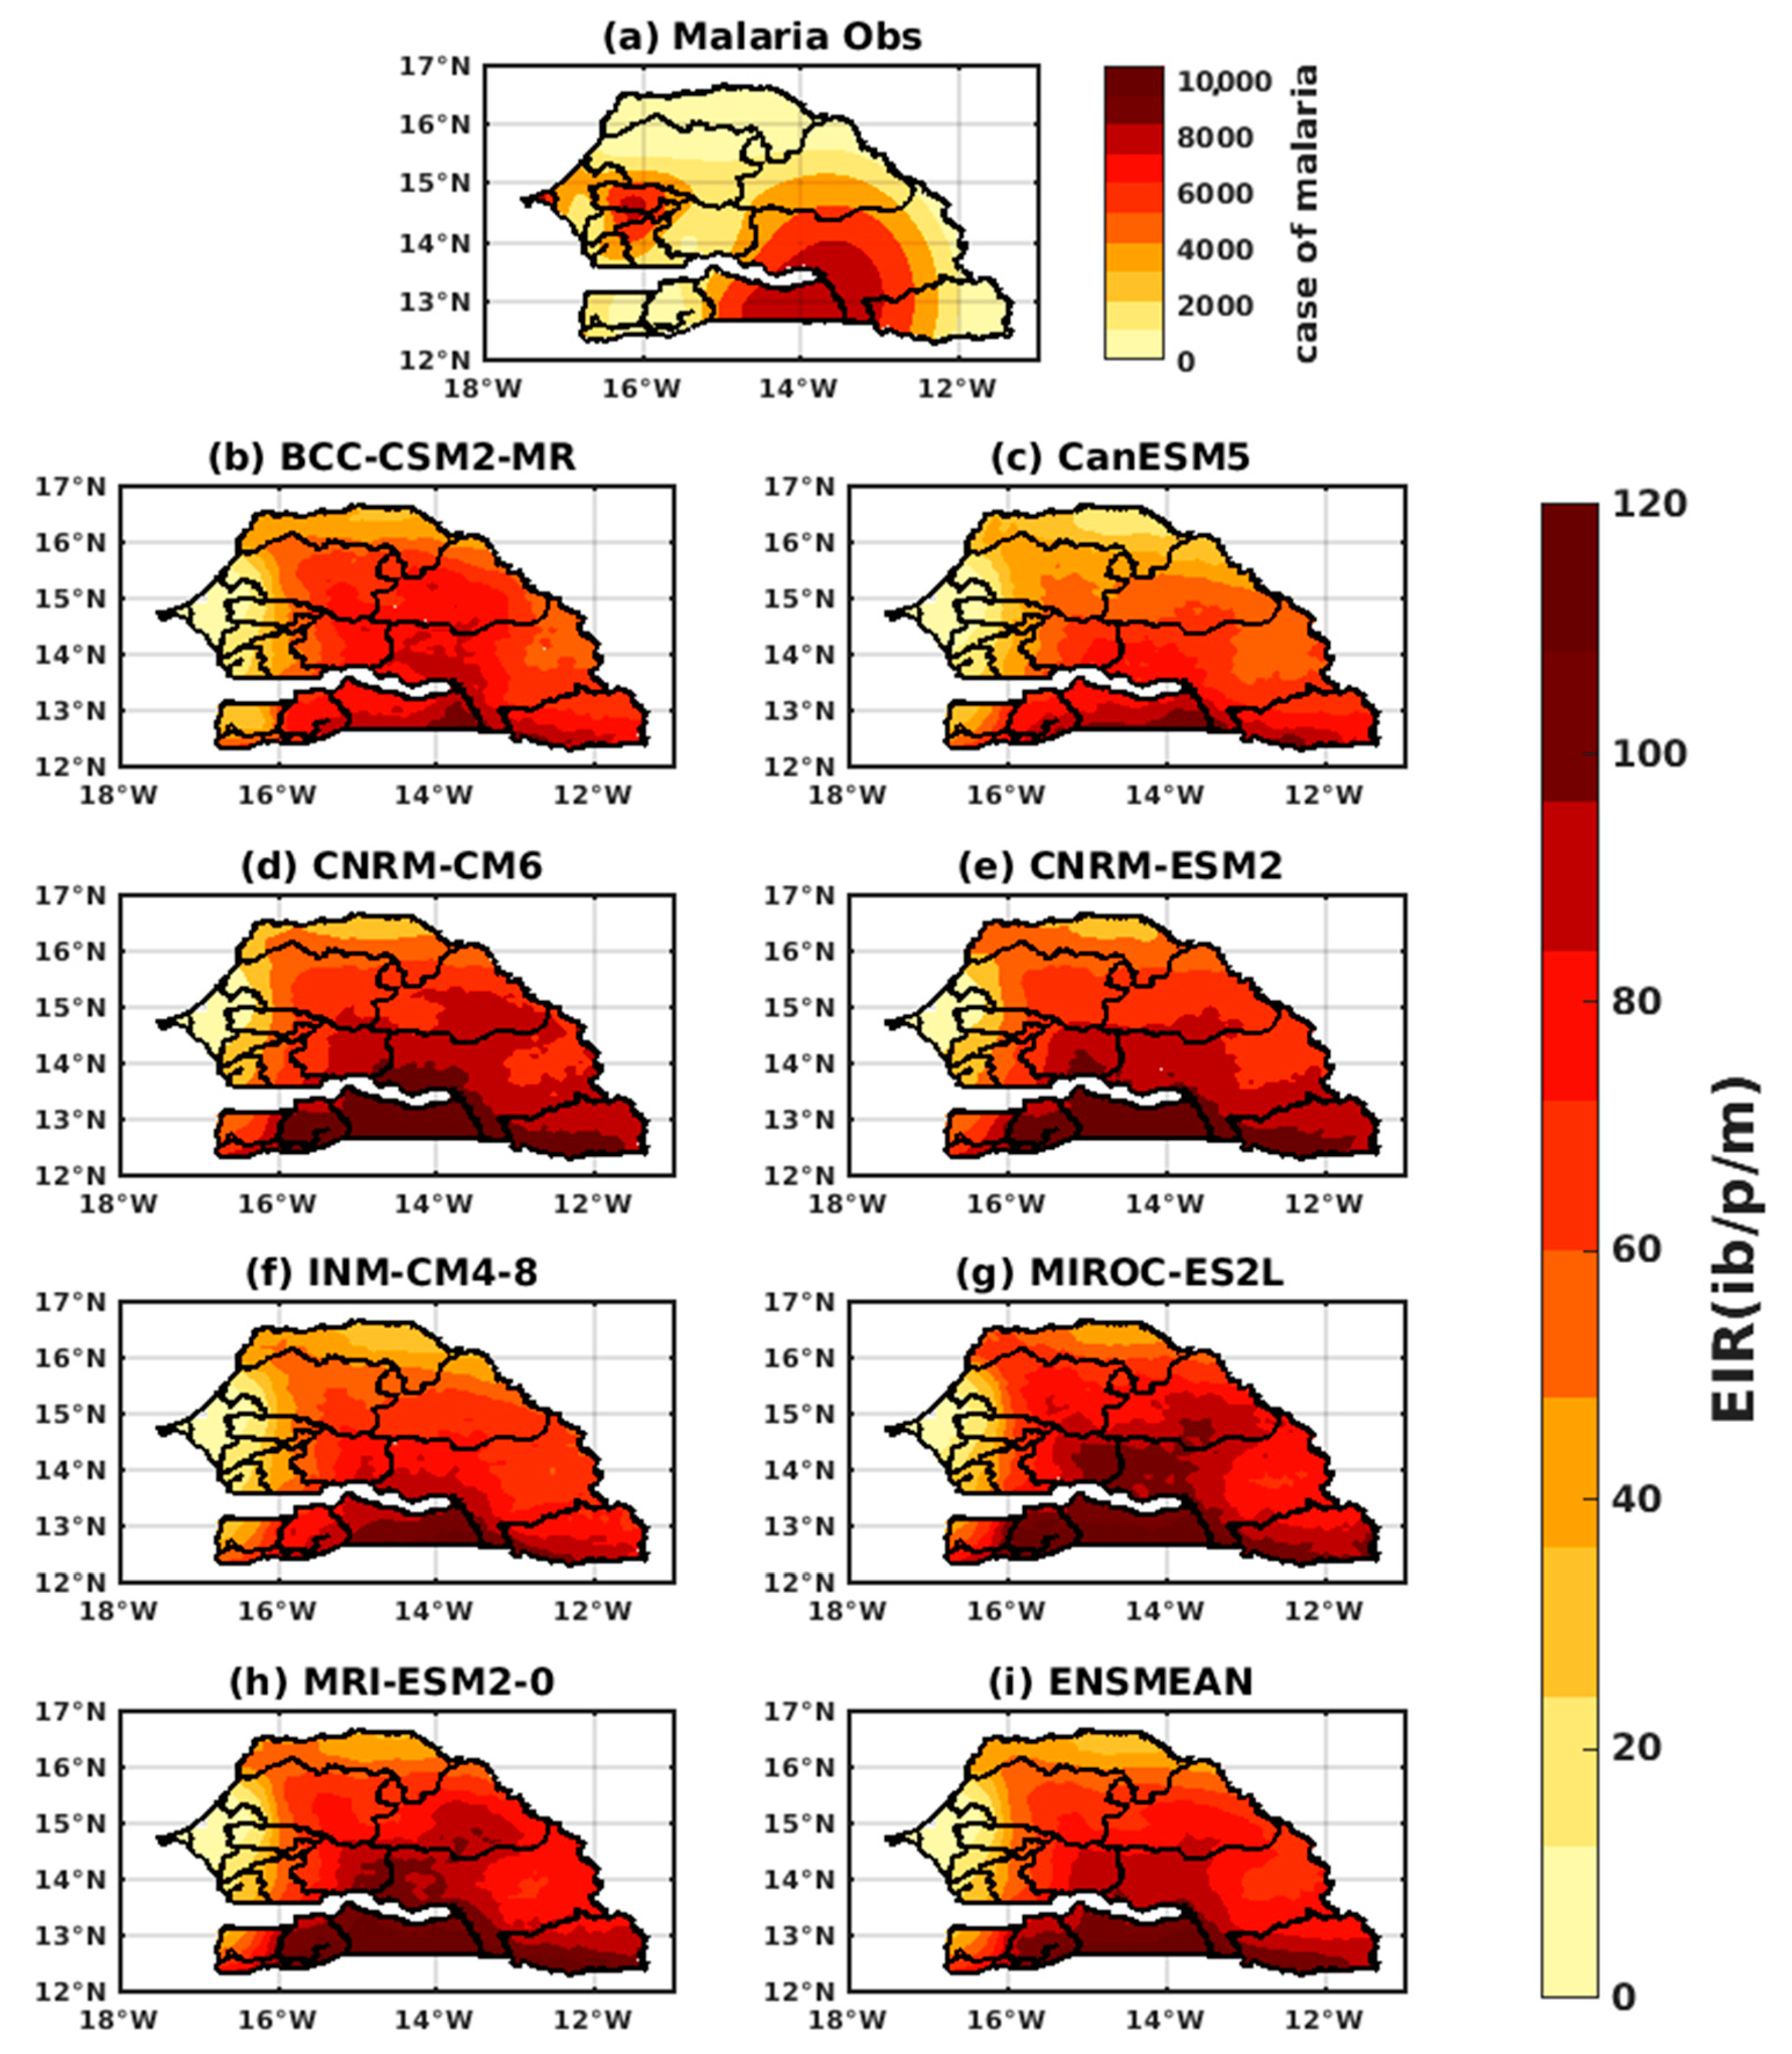
3.1.1. VECTRI Model’s Performance with Observed Malaria Cases in Senegal

Figure 2 provides a comprehensive overview of the temporal variability, interannual variability, and long-term trends in malaria cases and the EIR in Senegal from 2009 to 2014. Figure 2a shows the annual cycle of temporal variability in the number of confirmed malaria cases and the EIR in Senegal from 2009 to 2014. It illustrates the fluctuation in both variables over a year, with peaks and troughs indicating periods of higher and lower numbers of malaria cases and EIRs. The highest number of malaria cases occurs in October. Regarding the simulated EIR variable using the VECTRI model, certain models (BCC-CSM2-MR, CanESM5, and INM-CM4-8) exhibit the peak in August, coinciding with the peak rainfall in Senegal. In contrast, other models (CNRM-CM6-1, CNRM-ESM2-1, MIROC-ES2L, MRI-ESM2-0, and the overall average) show their maximum peak in September, one month after the peak rainfall. The models that exhibit an August peak poorly simulate malaria transmission, as there is a mismatch between the rainfall that creates breeding sites for Anopheles mosquitoes, such as puddles, marshes, and temporary rivers [13,14]. Figure 2b demonstrates the interannual variability in malaria cases and the EIR. It highlights the variation in these variables from year to year, showcasing the differences in malaria transmission and the EIR over the study period. It is observed that the overall average is similar in trend to the observations throughout the entire study period.
Figure 3 presents the intra-annual/interannual variations in the number of confirmed malaria cases and the EIR (in ib/p/m, i.e., infectious bites per person per month) in Senegal from 2009 to 2014. The simulations are based on the VECTRI model, which is forced by rainfall and temperature data. The diagram consists of nine panels, labeled from (a) to (i), each representing a different simulation. Panel (a), labeled “Malaria-Obs”, represents the observed data on malaria cases and the EIR. Panels (b) to (i) represent the simulations based on different climate models, including BCC-CSM2-MR, CanESM5, CNRM-CM6-1, CNRM-ESM2-1, INM-CM4-8, MIROC-ES2L, MRI-ESM2-0, and ENSMEAN-MOD. Figure 3 presents the temporal variations along the x-axis and monthly variations along the y-axis. Each cell in the diagram represents the number of malaria cases and the EIR at a specific time and location.
This figure provides valuable insights into how the different climate models simulate the variations in malaria cases and the EIR in Senegal over the study period. It allows for a comparison between the observed data and the simulations, helping to assess the performance of the VECTRI model and the climate models in capturing the temporal and spatial patterns of malaria transmission in Senegal. Figure 3 illustrates that the period of high transmission, as observed, occurs between September, October, and November for confirmed malaria cases. In contrast, for the EIR variable, this period is observed between August, September, and October. The one-month lag between the two variables can be attributed to the fact that the EIR represents the number of mosquito bites leading to the disease, while the number of confirmed cases represents individuals who have tested positive for malaria after the parasite has developed in their bodies and can be detected through diagnostics [61].
Figure 4 presents the spatial distribution of the EIR (ib/p/m, i.e., infectious bites per person per month) in Senegal from 2009 to 2014. The simulations were conducted using the VECTRI model, which was driven by rainfall and temperature data from the assessment period. Figure 4 includes nine panels, labeled from (a) to (i), each representing a different simulation. Figure 4a, labeled “Malaria-Obs”, represents the observed malaria data. Figure 4b–i represent the simulations based on different climate models, including BCC-CSM2-MR, CanESM5, CNRM-CM6-1, CNRM-ESM2-1, INM-CM4-8, MIROC-ES2L, MRI-ESM2-0, and ENSMEAN-MOD.
The figure provides a visual representation of the spatial distribution of the malaria cases and the EIR across Senegal during the study period. Each panel shows the EIR values in different regions or locations of Senegal, allowing for a comparison between the observed data and the simulated EIRs from different climate models. This figure is useful for understanding the spatial patterns of malaria transmission intensity in Senegal and how well the VECTRI model, driven by different climate models, captures these patterns in terms of the EIR. Figure 4 clearly illustrates that the southern part of the country, which receives the highest rainfall amount, experiences the highest number of malaria cases. In contrast, the northern areas, which have lower amounts of rainfall, have a lower transmission rate of malaria. The observations indicate that the southwestern part of the country, specifically the Sédhiou, Kédougou, and Tambacounda regions, have the highest number of malaria cases. This is followed by the central regions, including Diourbel and Dakar. The models were able to replicate this trend, although there were some discrepancies in the central regions. The models underestimated the number of cases compared to the actual observations

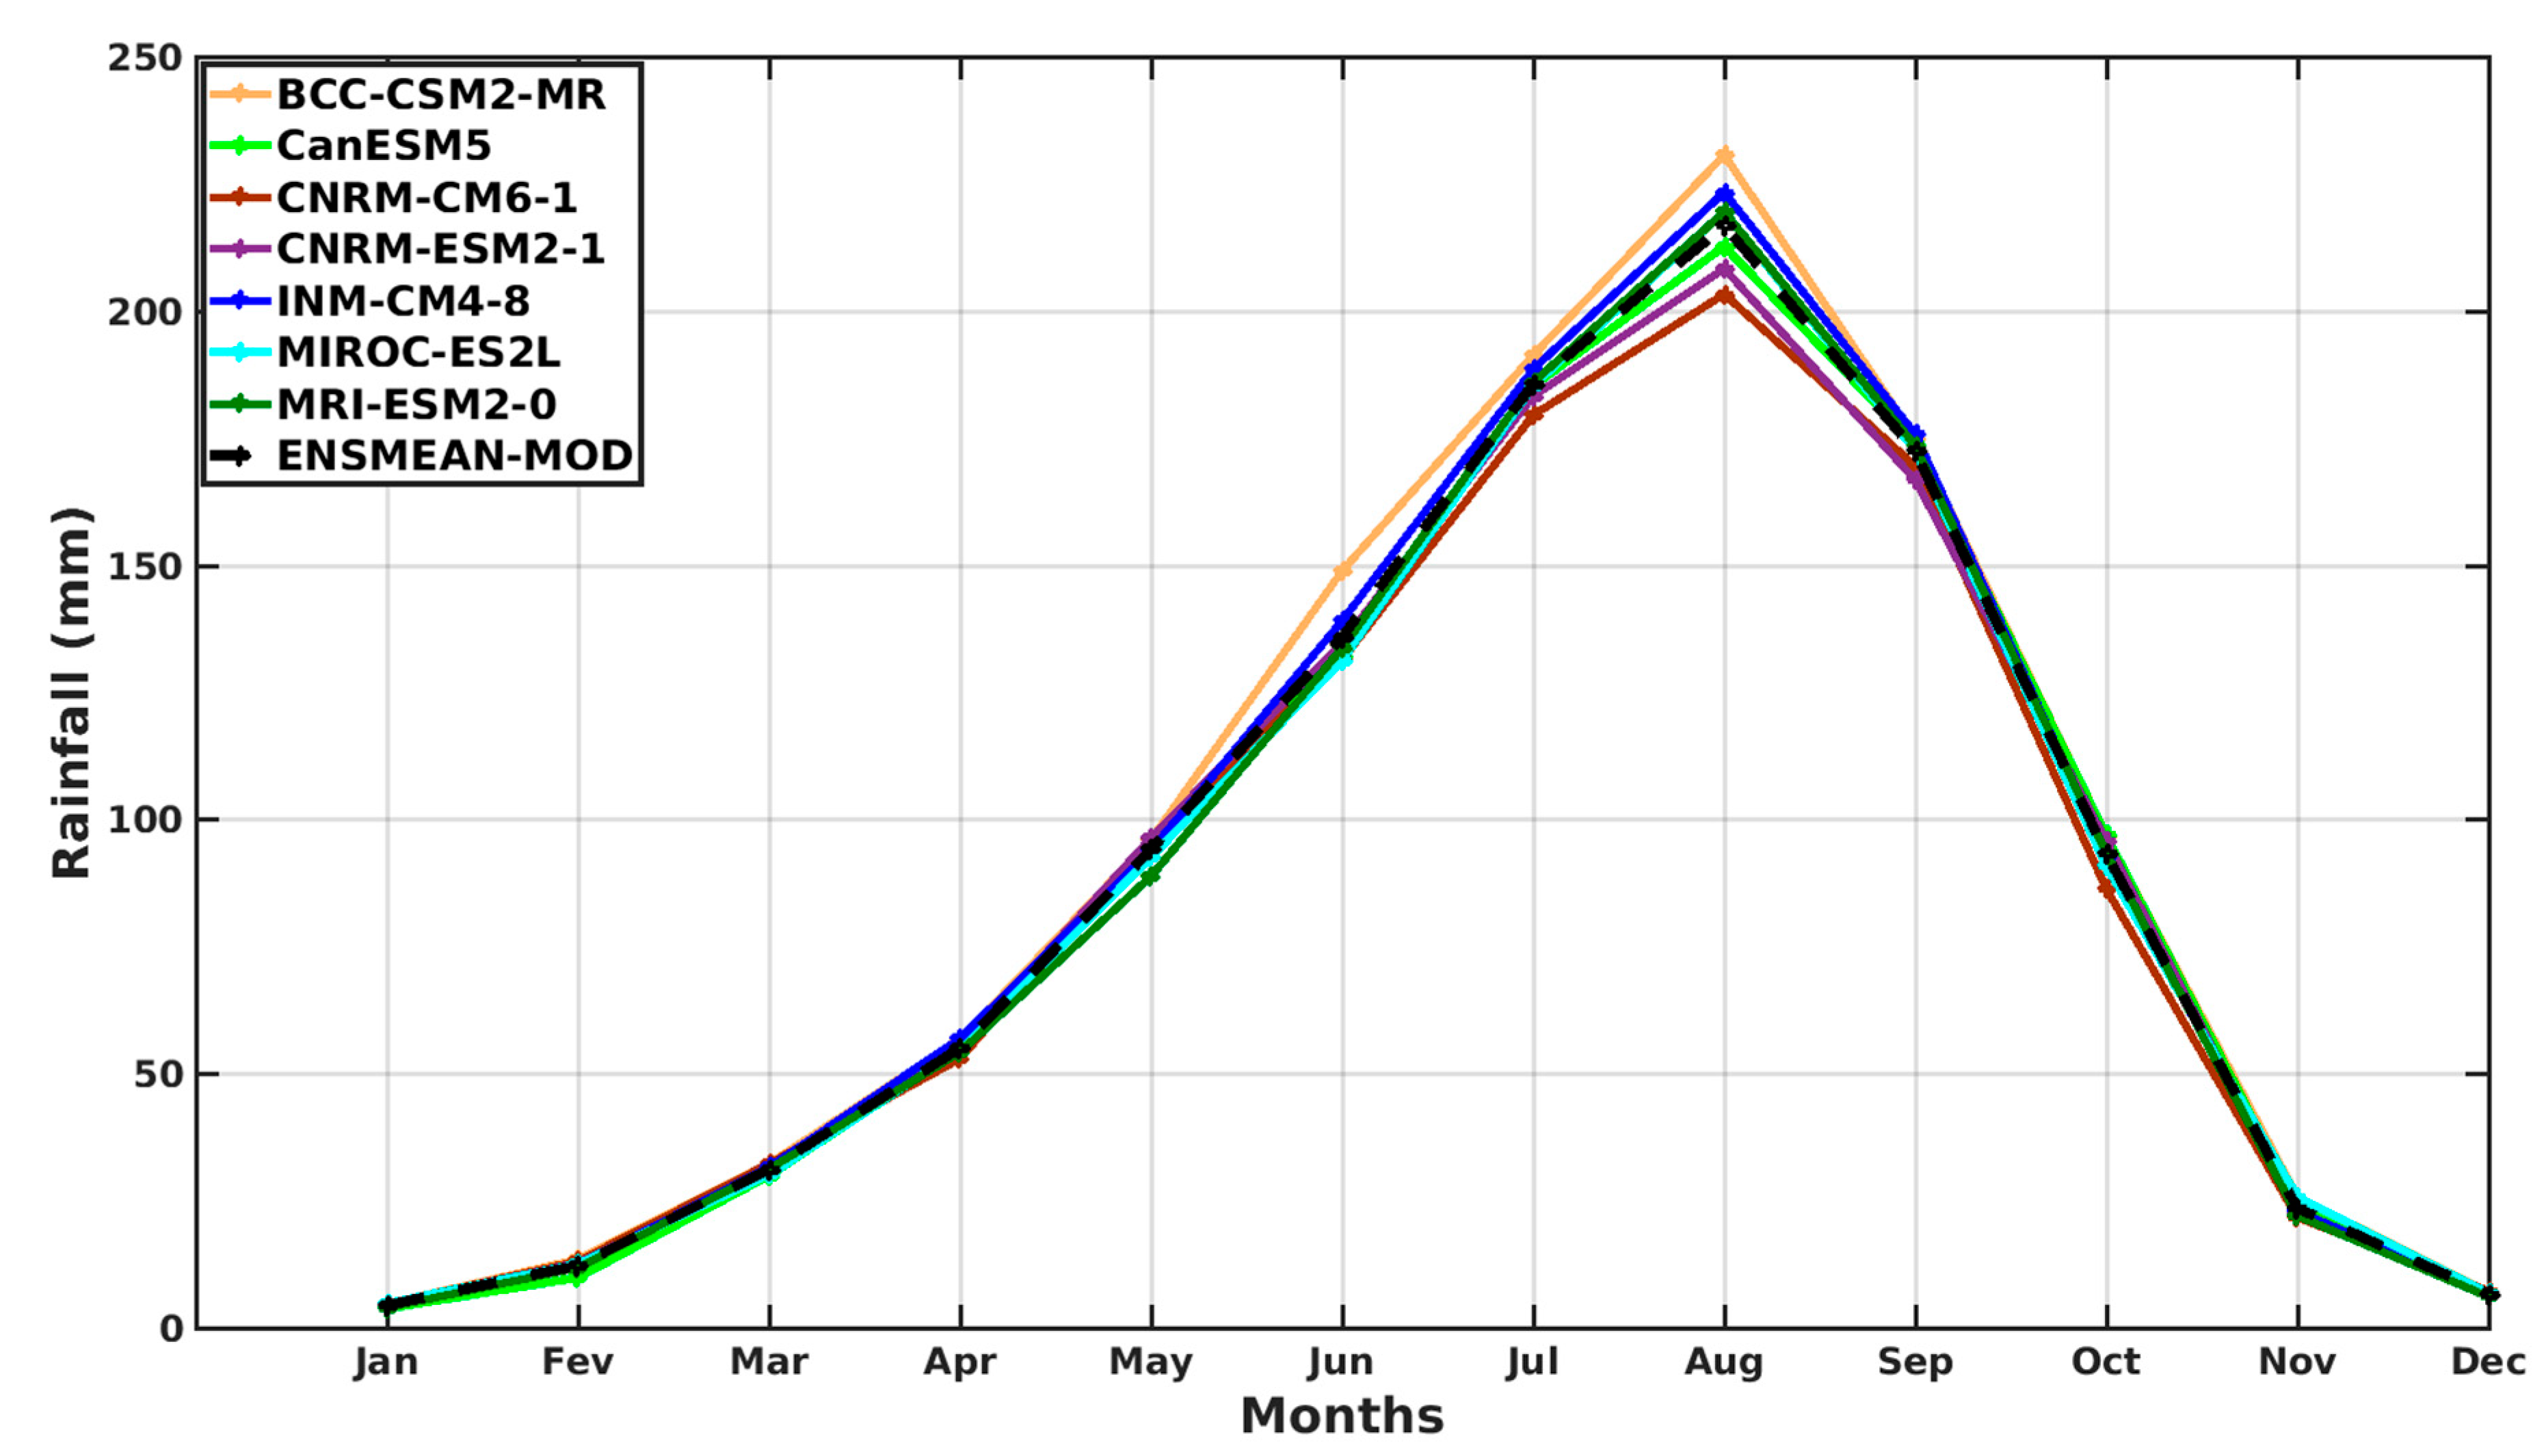
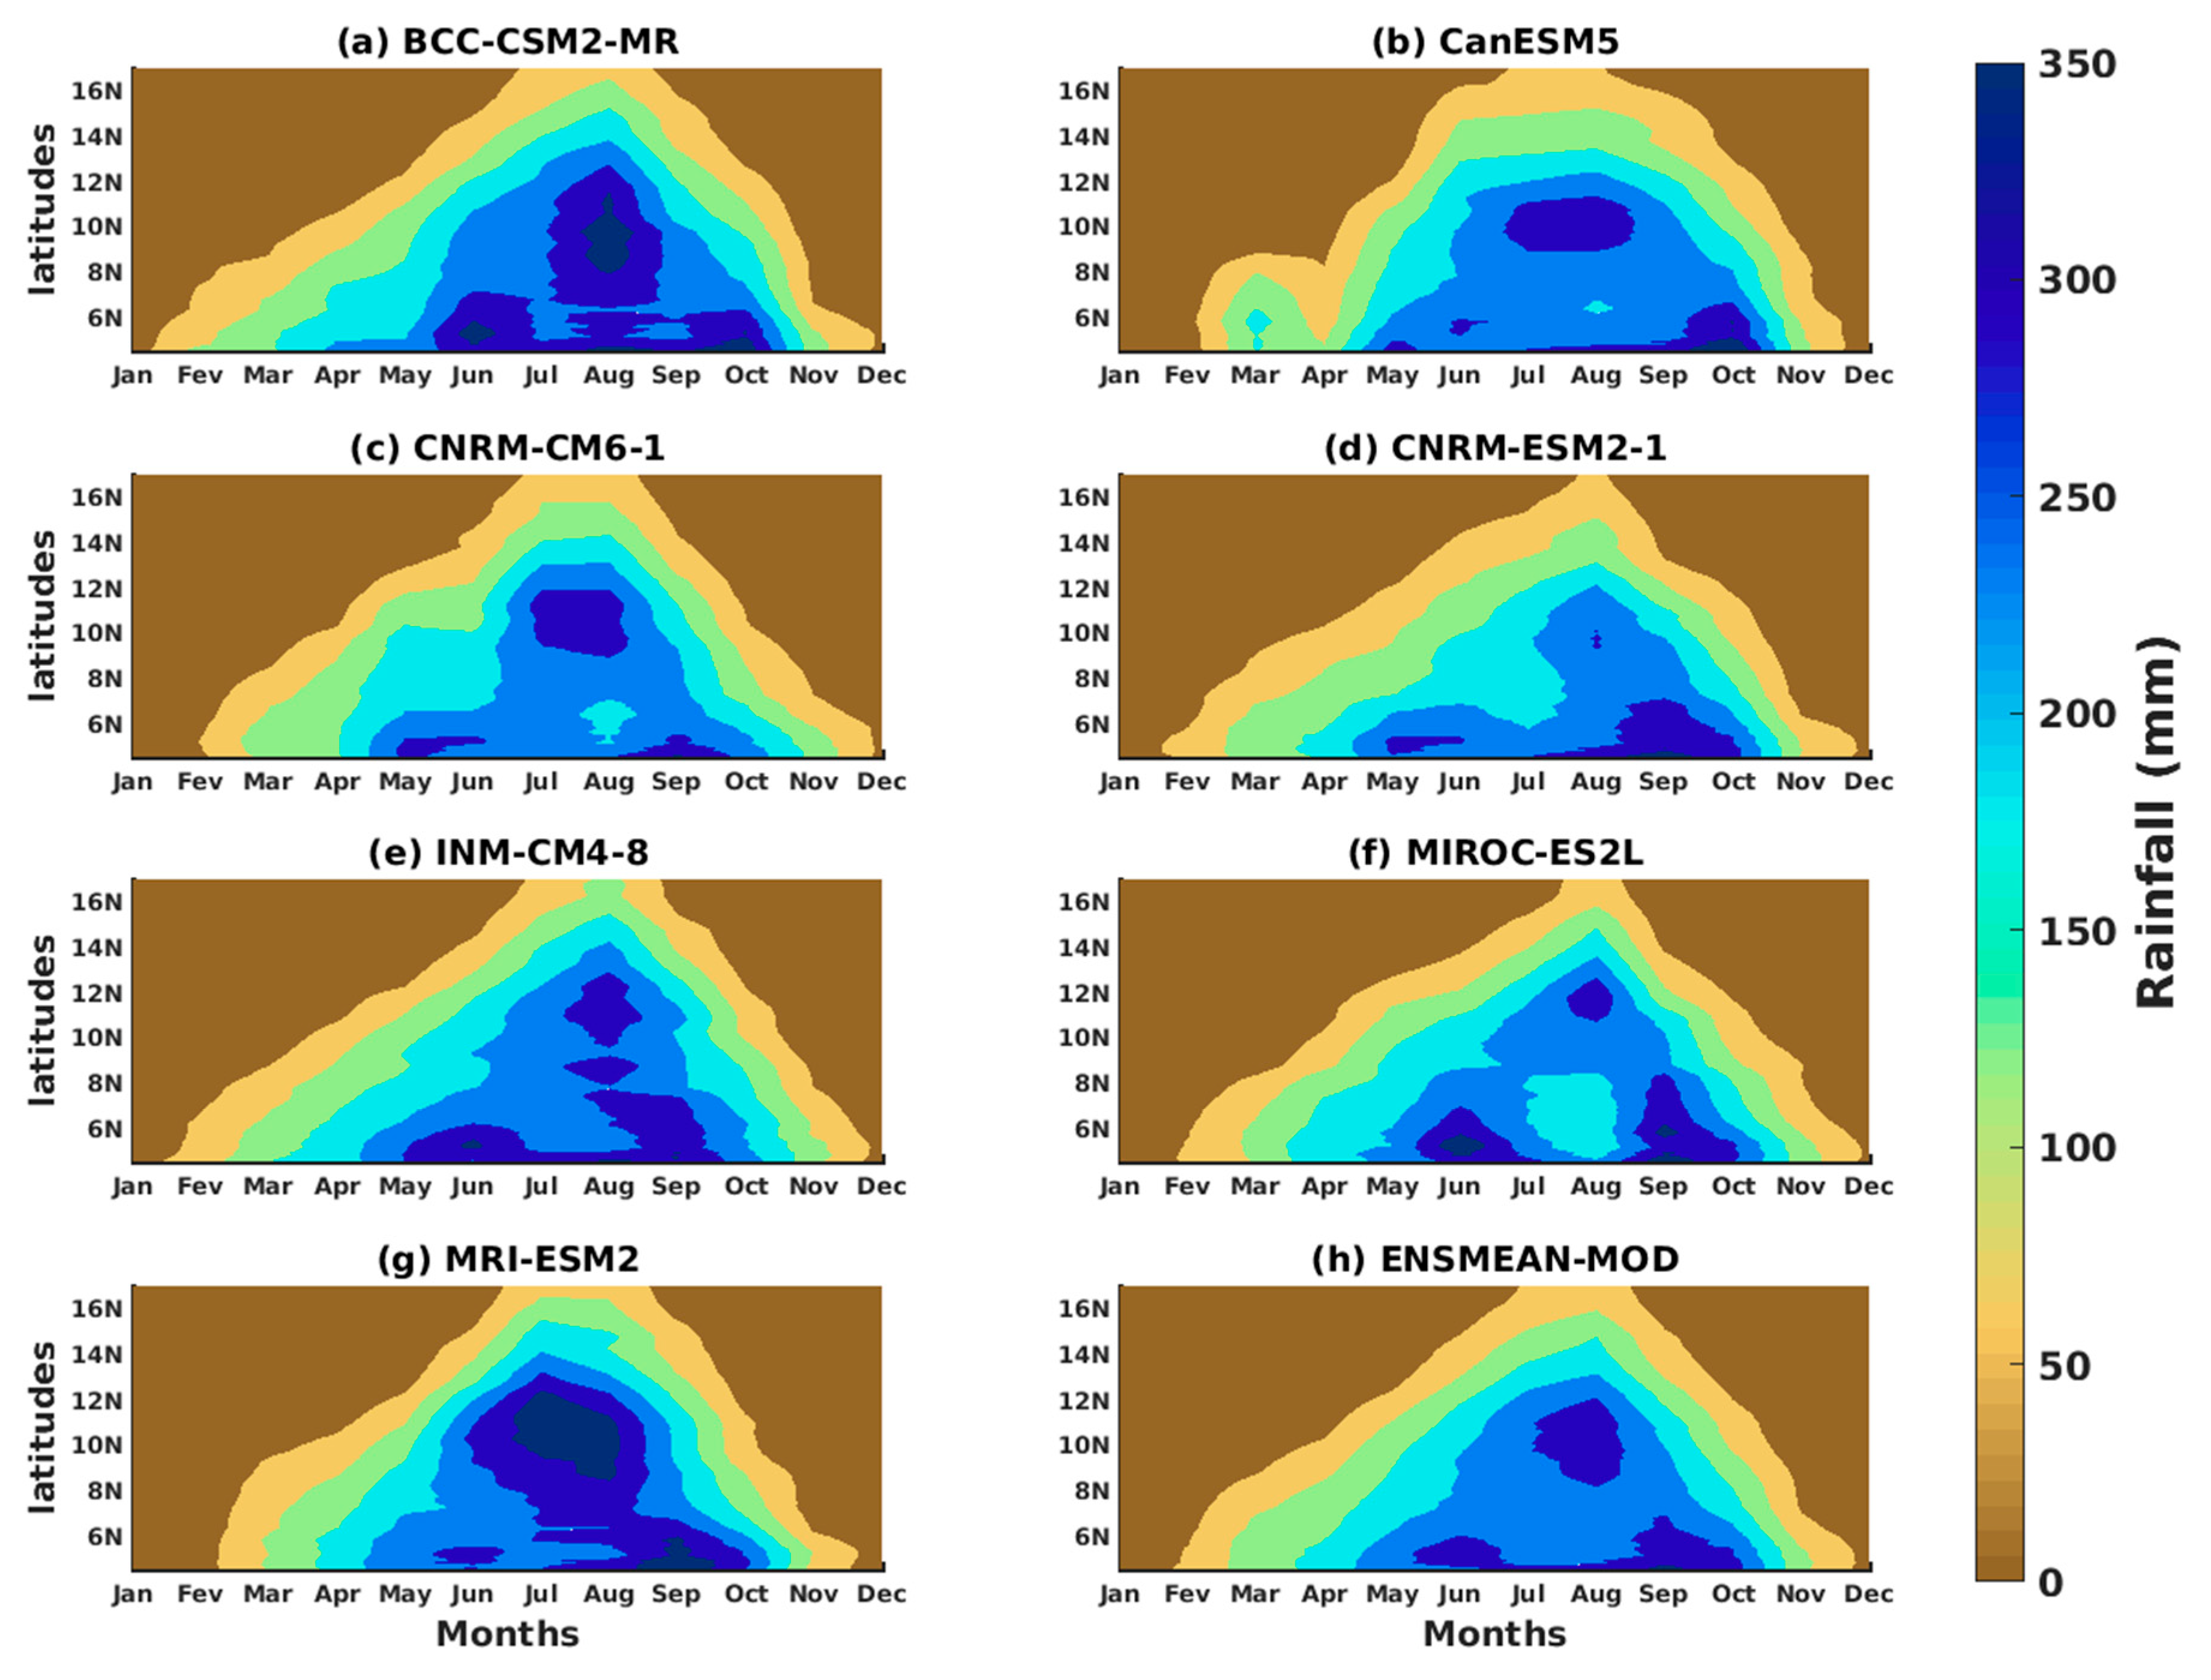
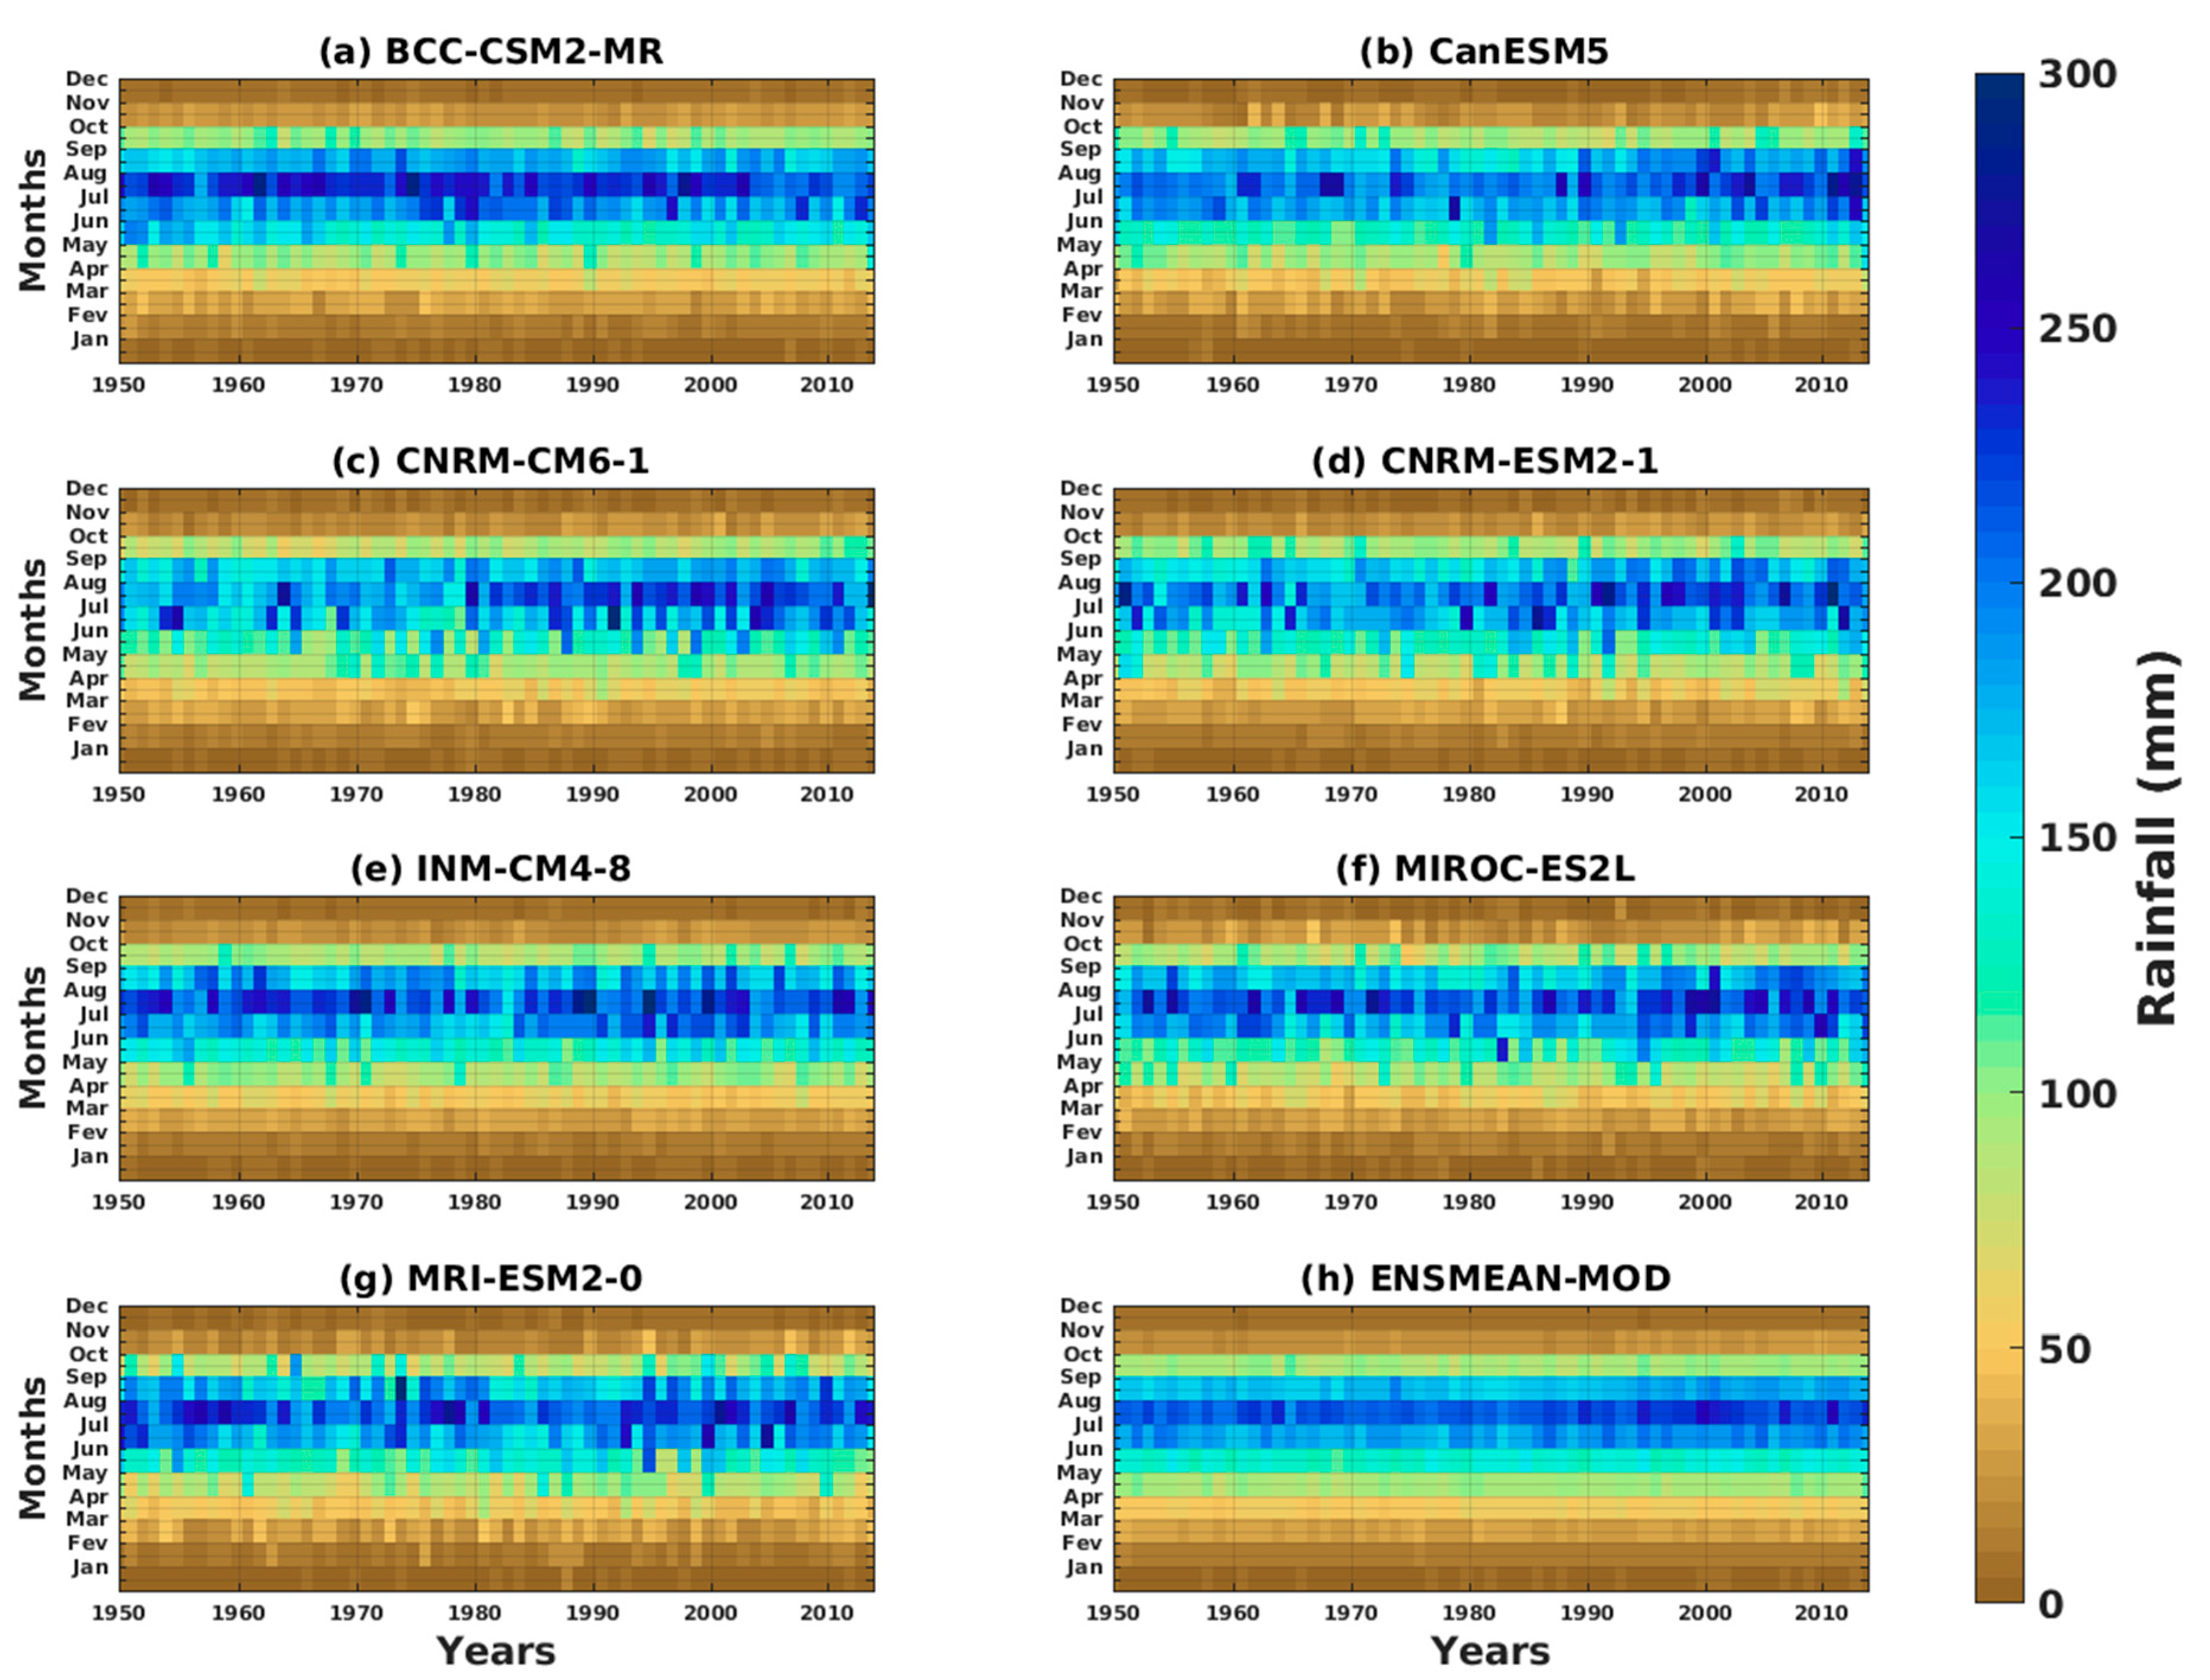
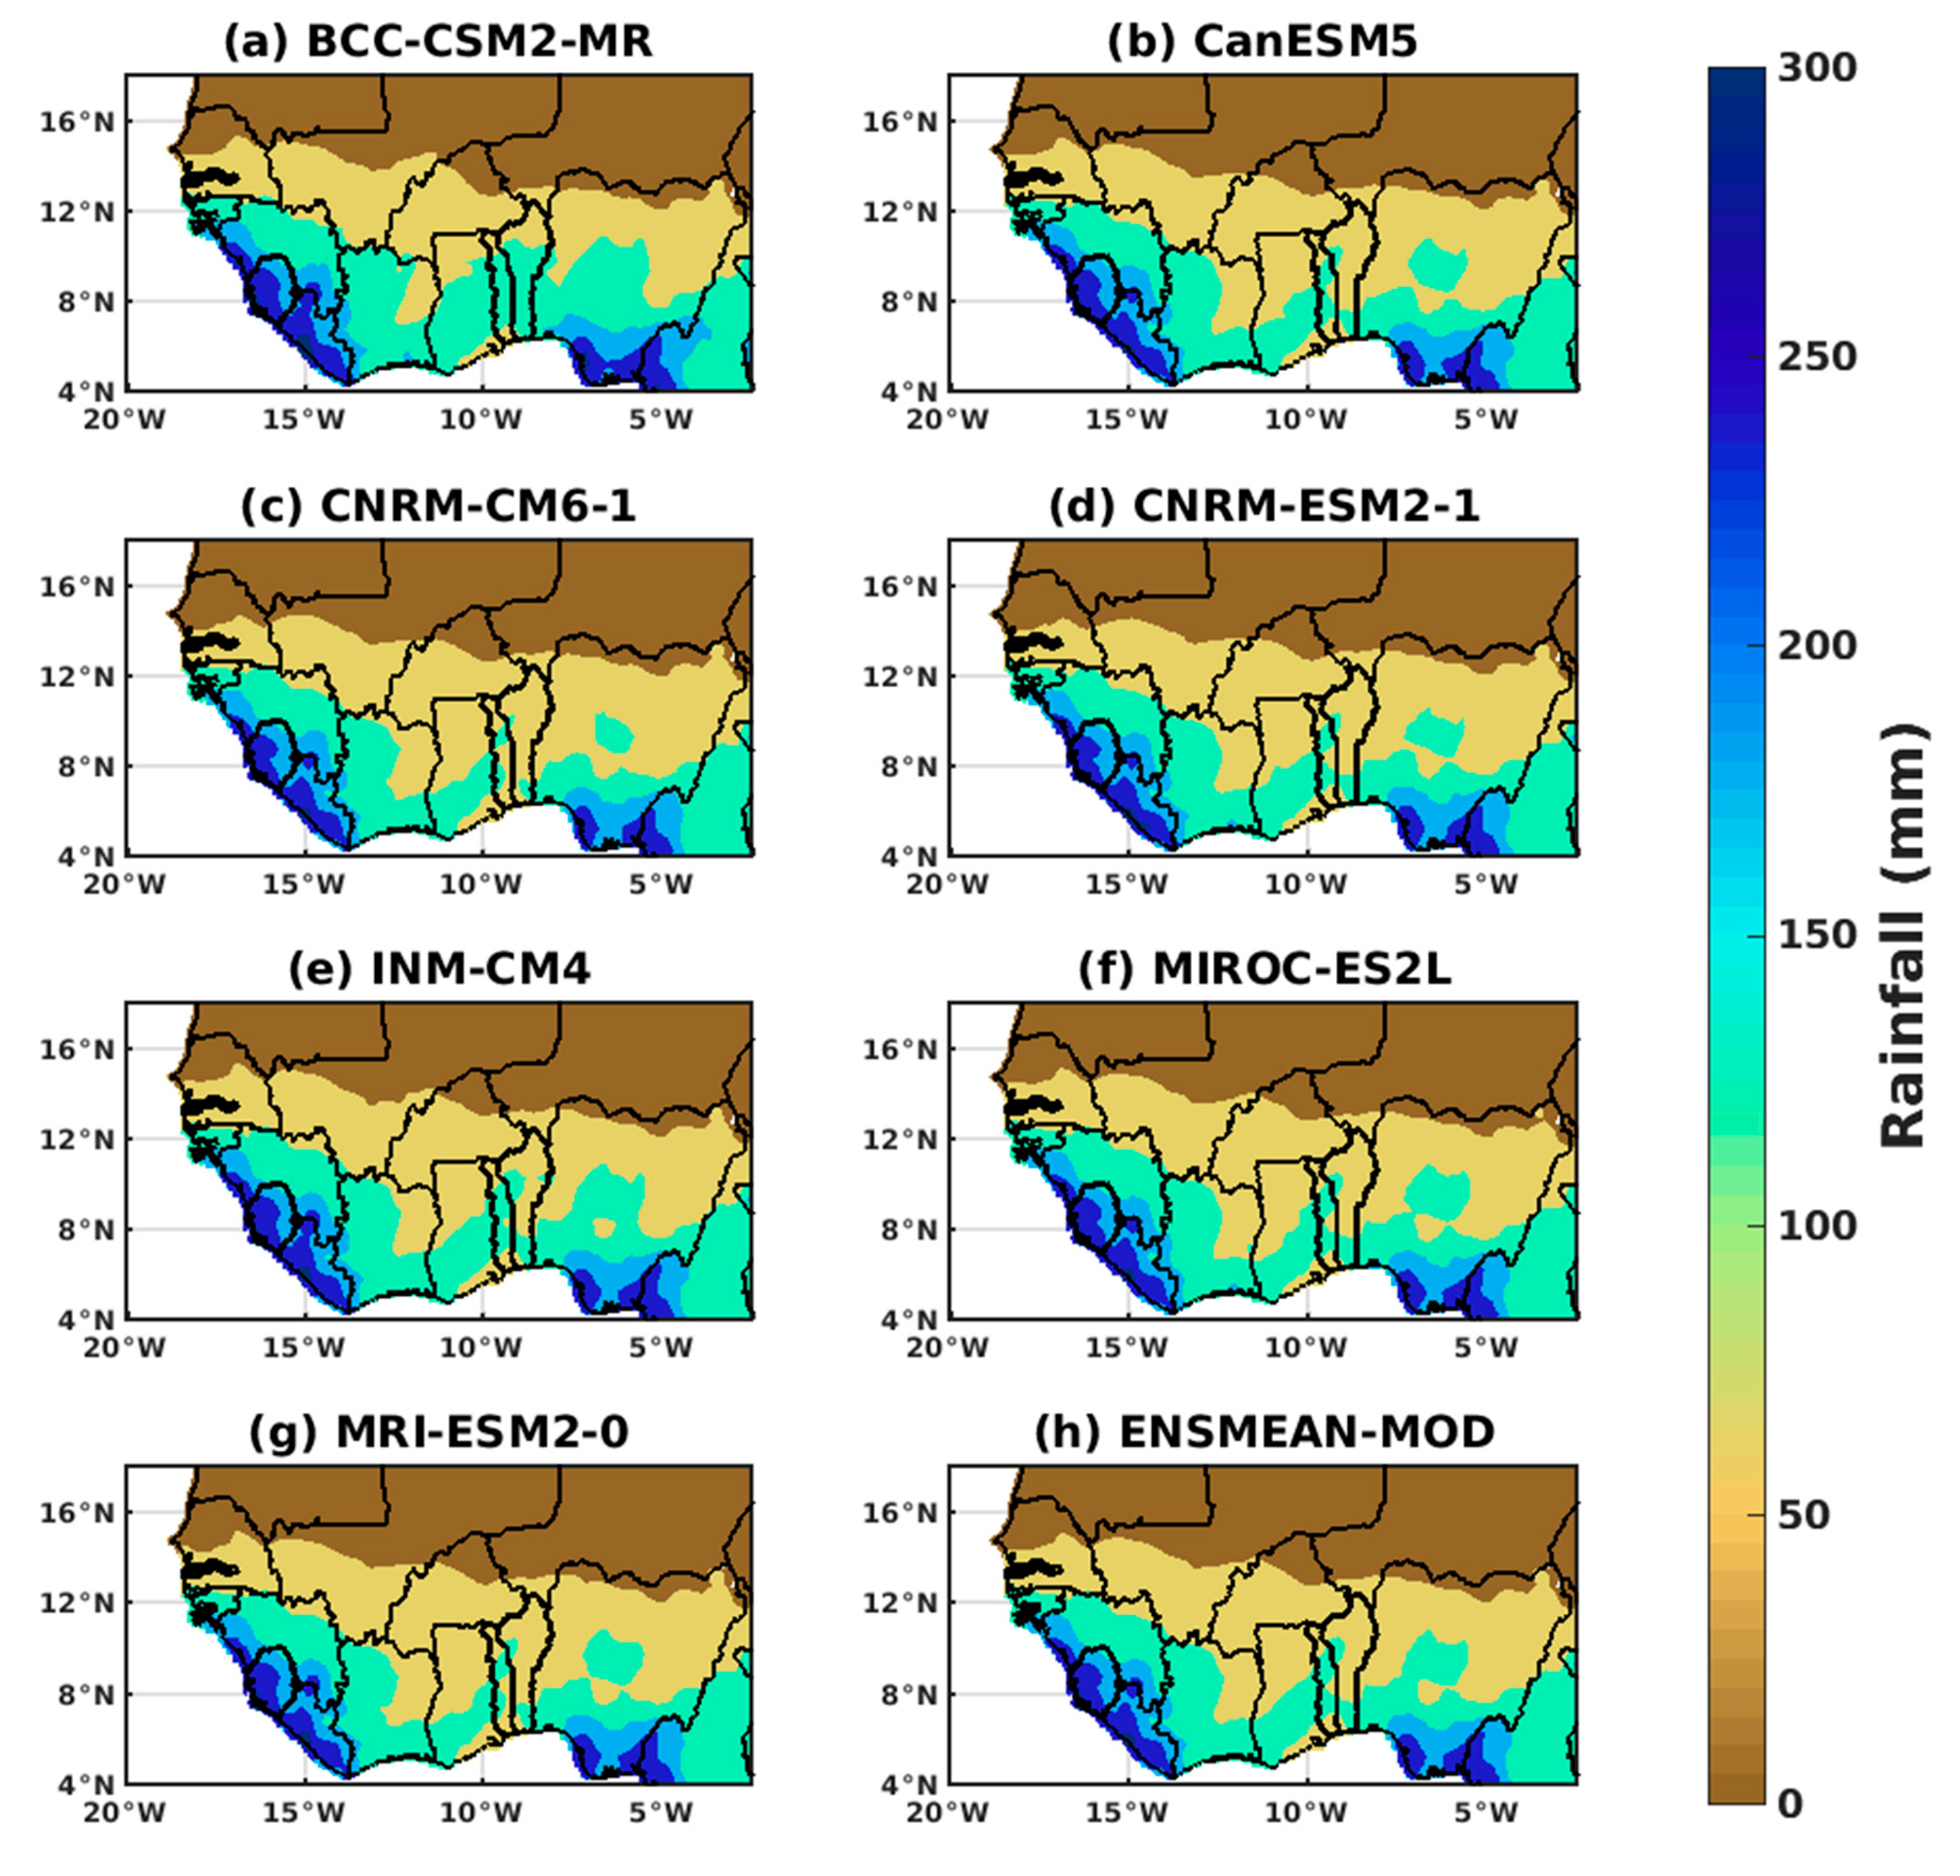
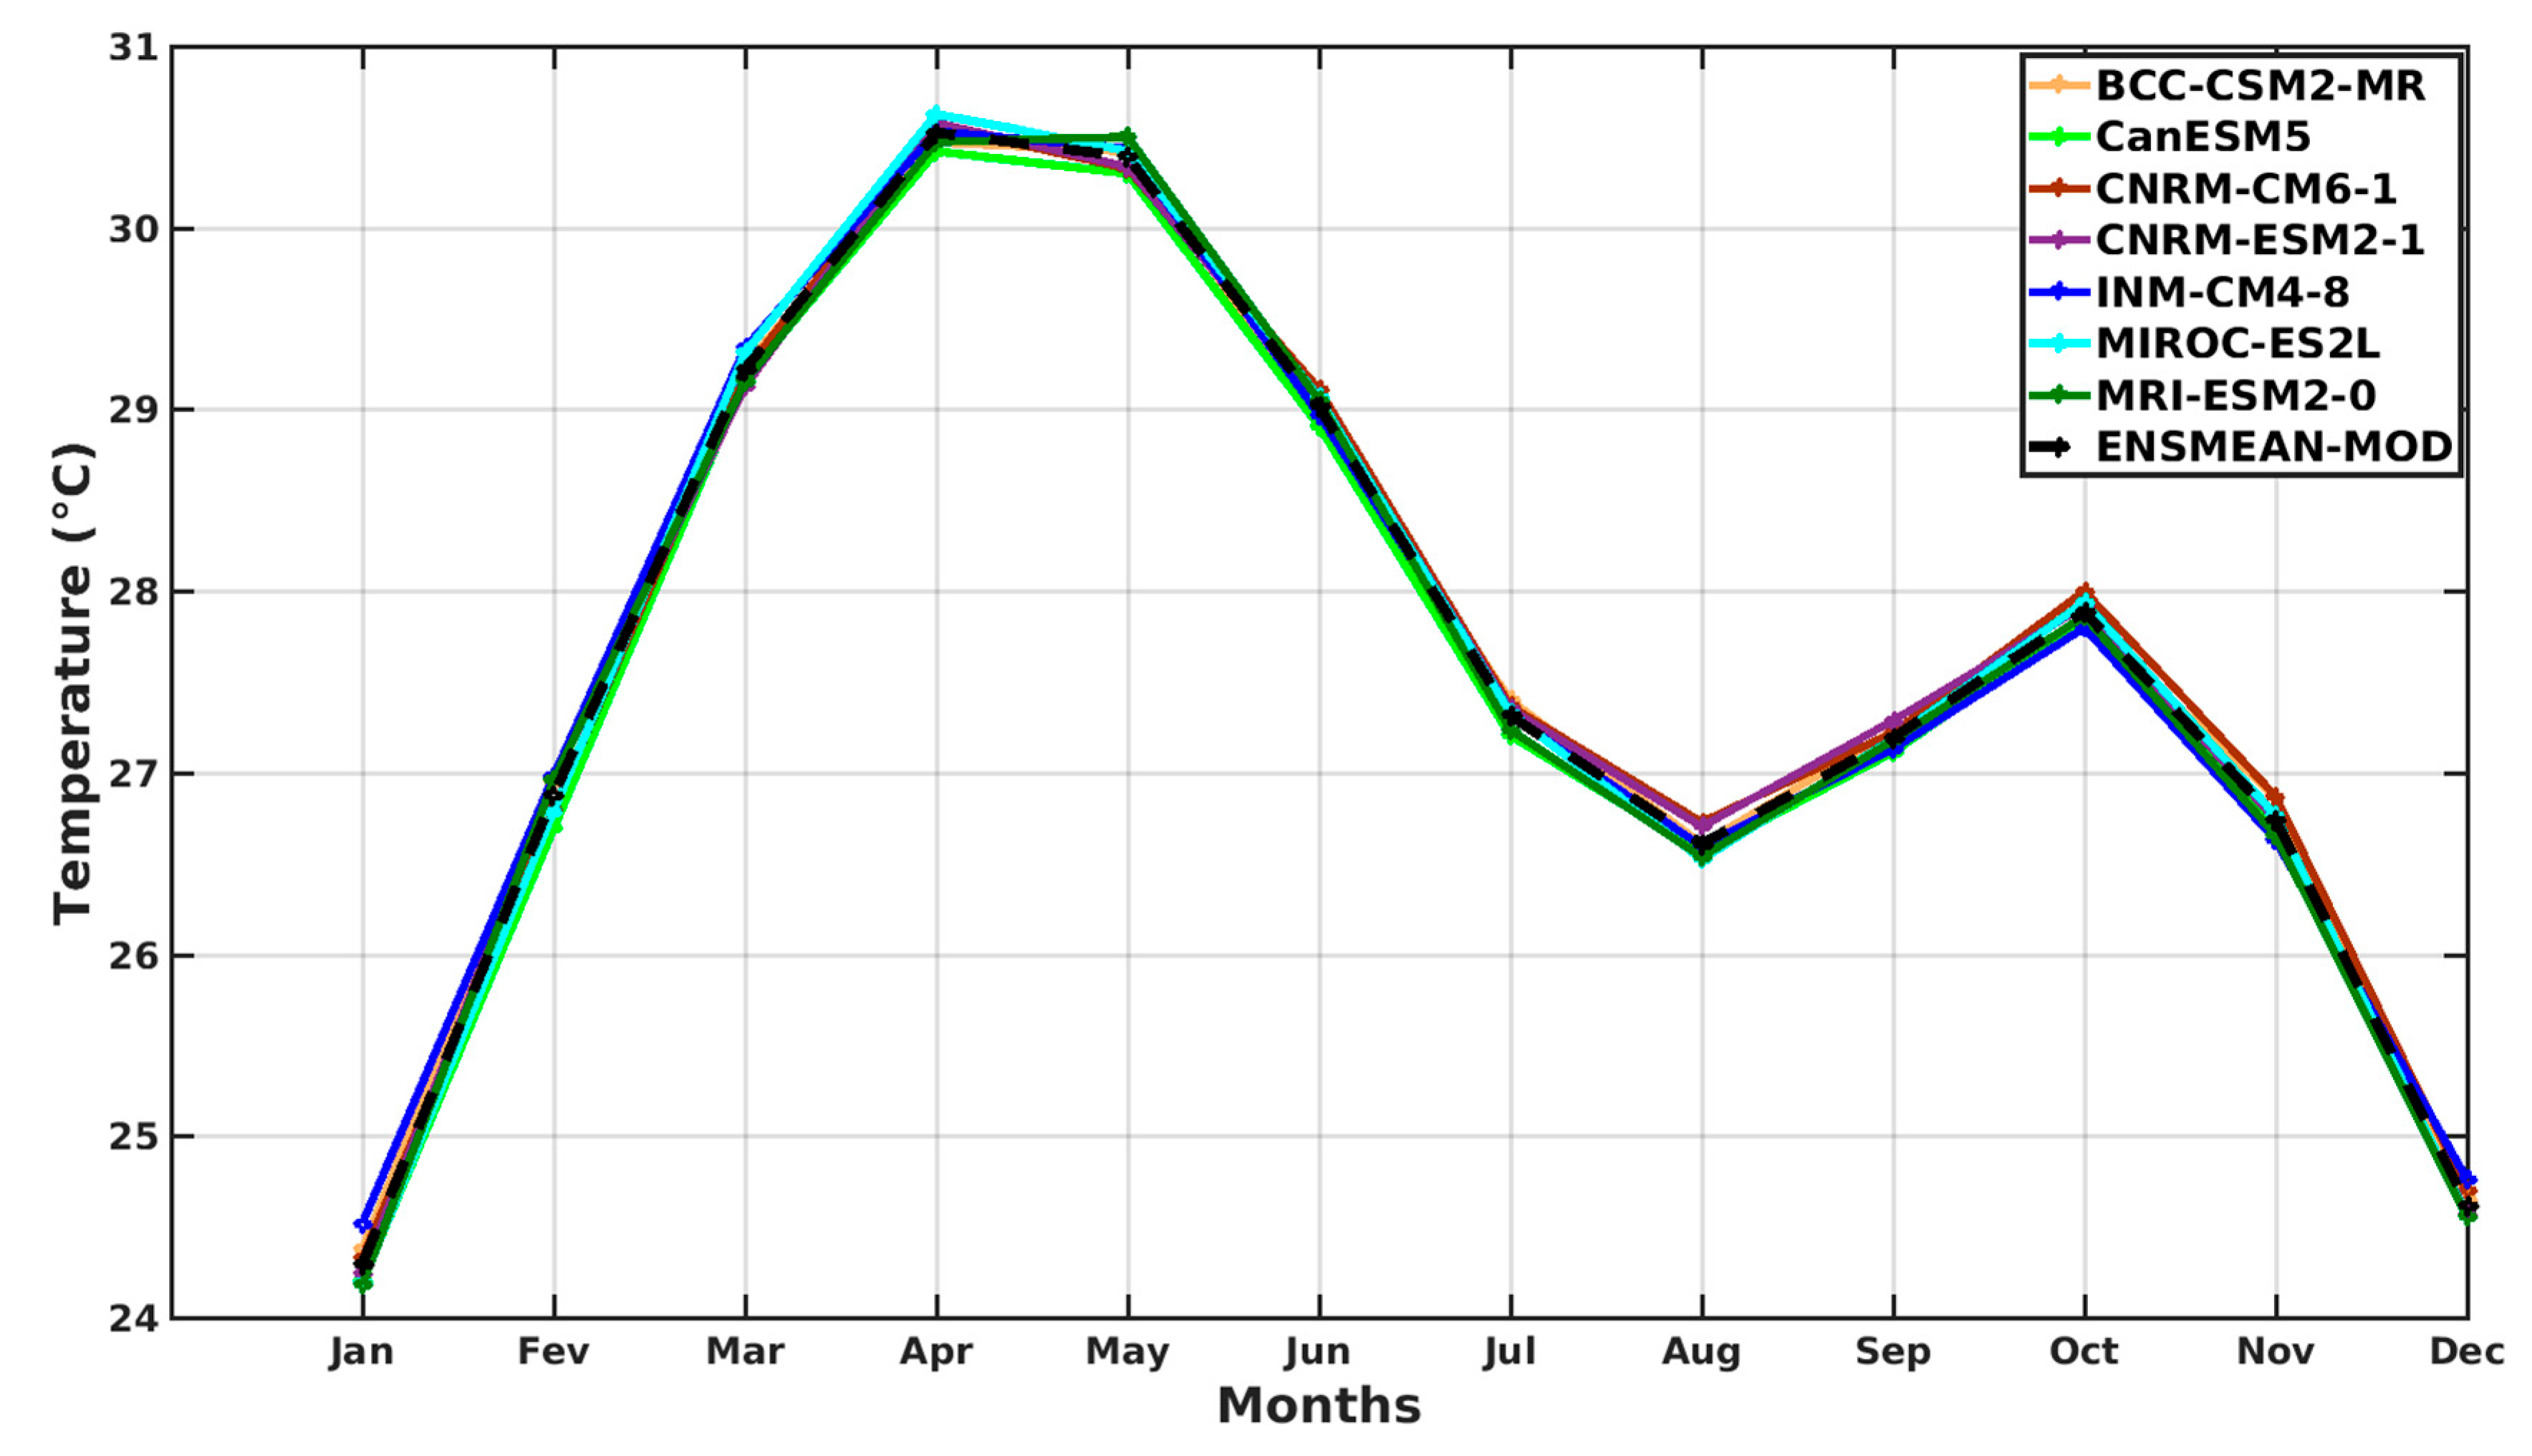
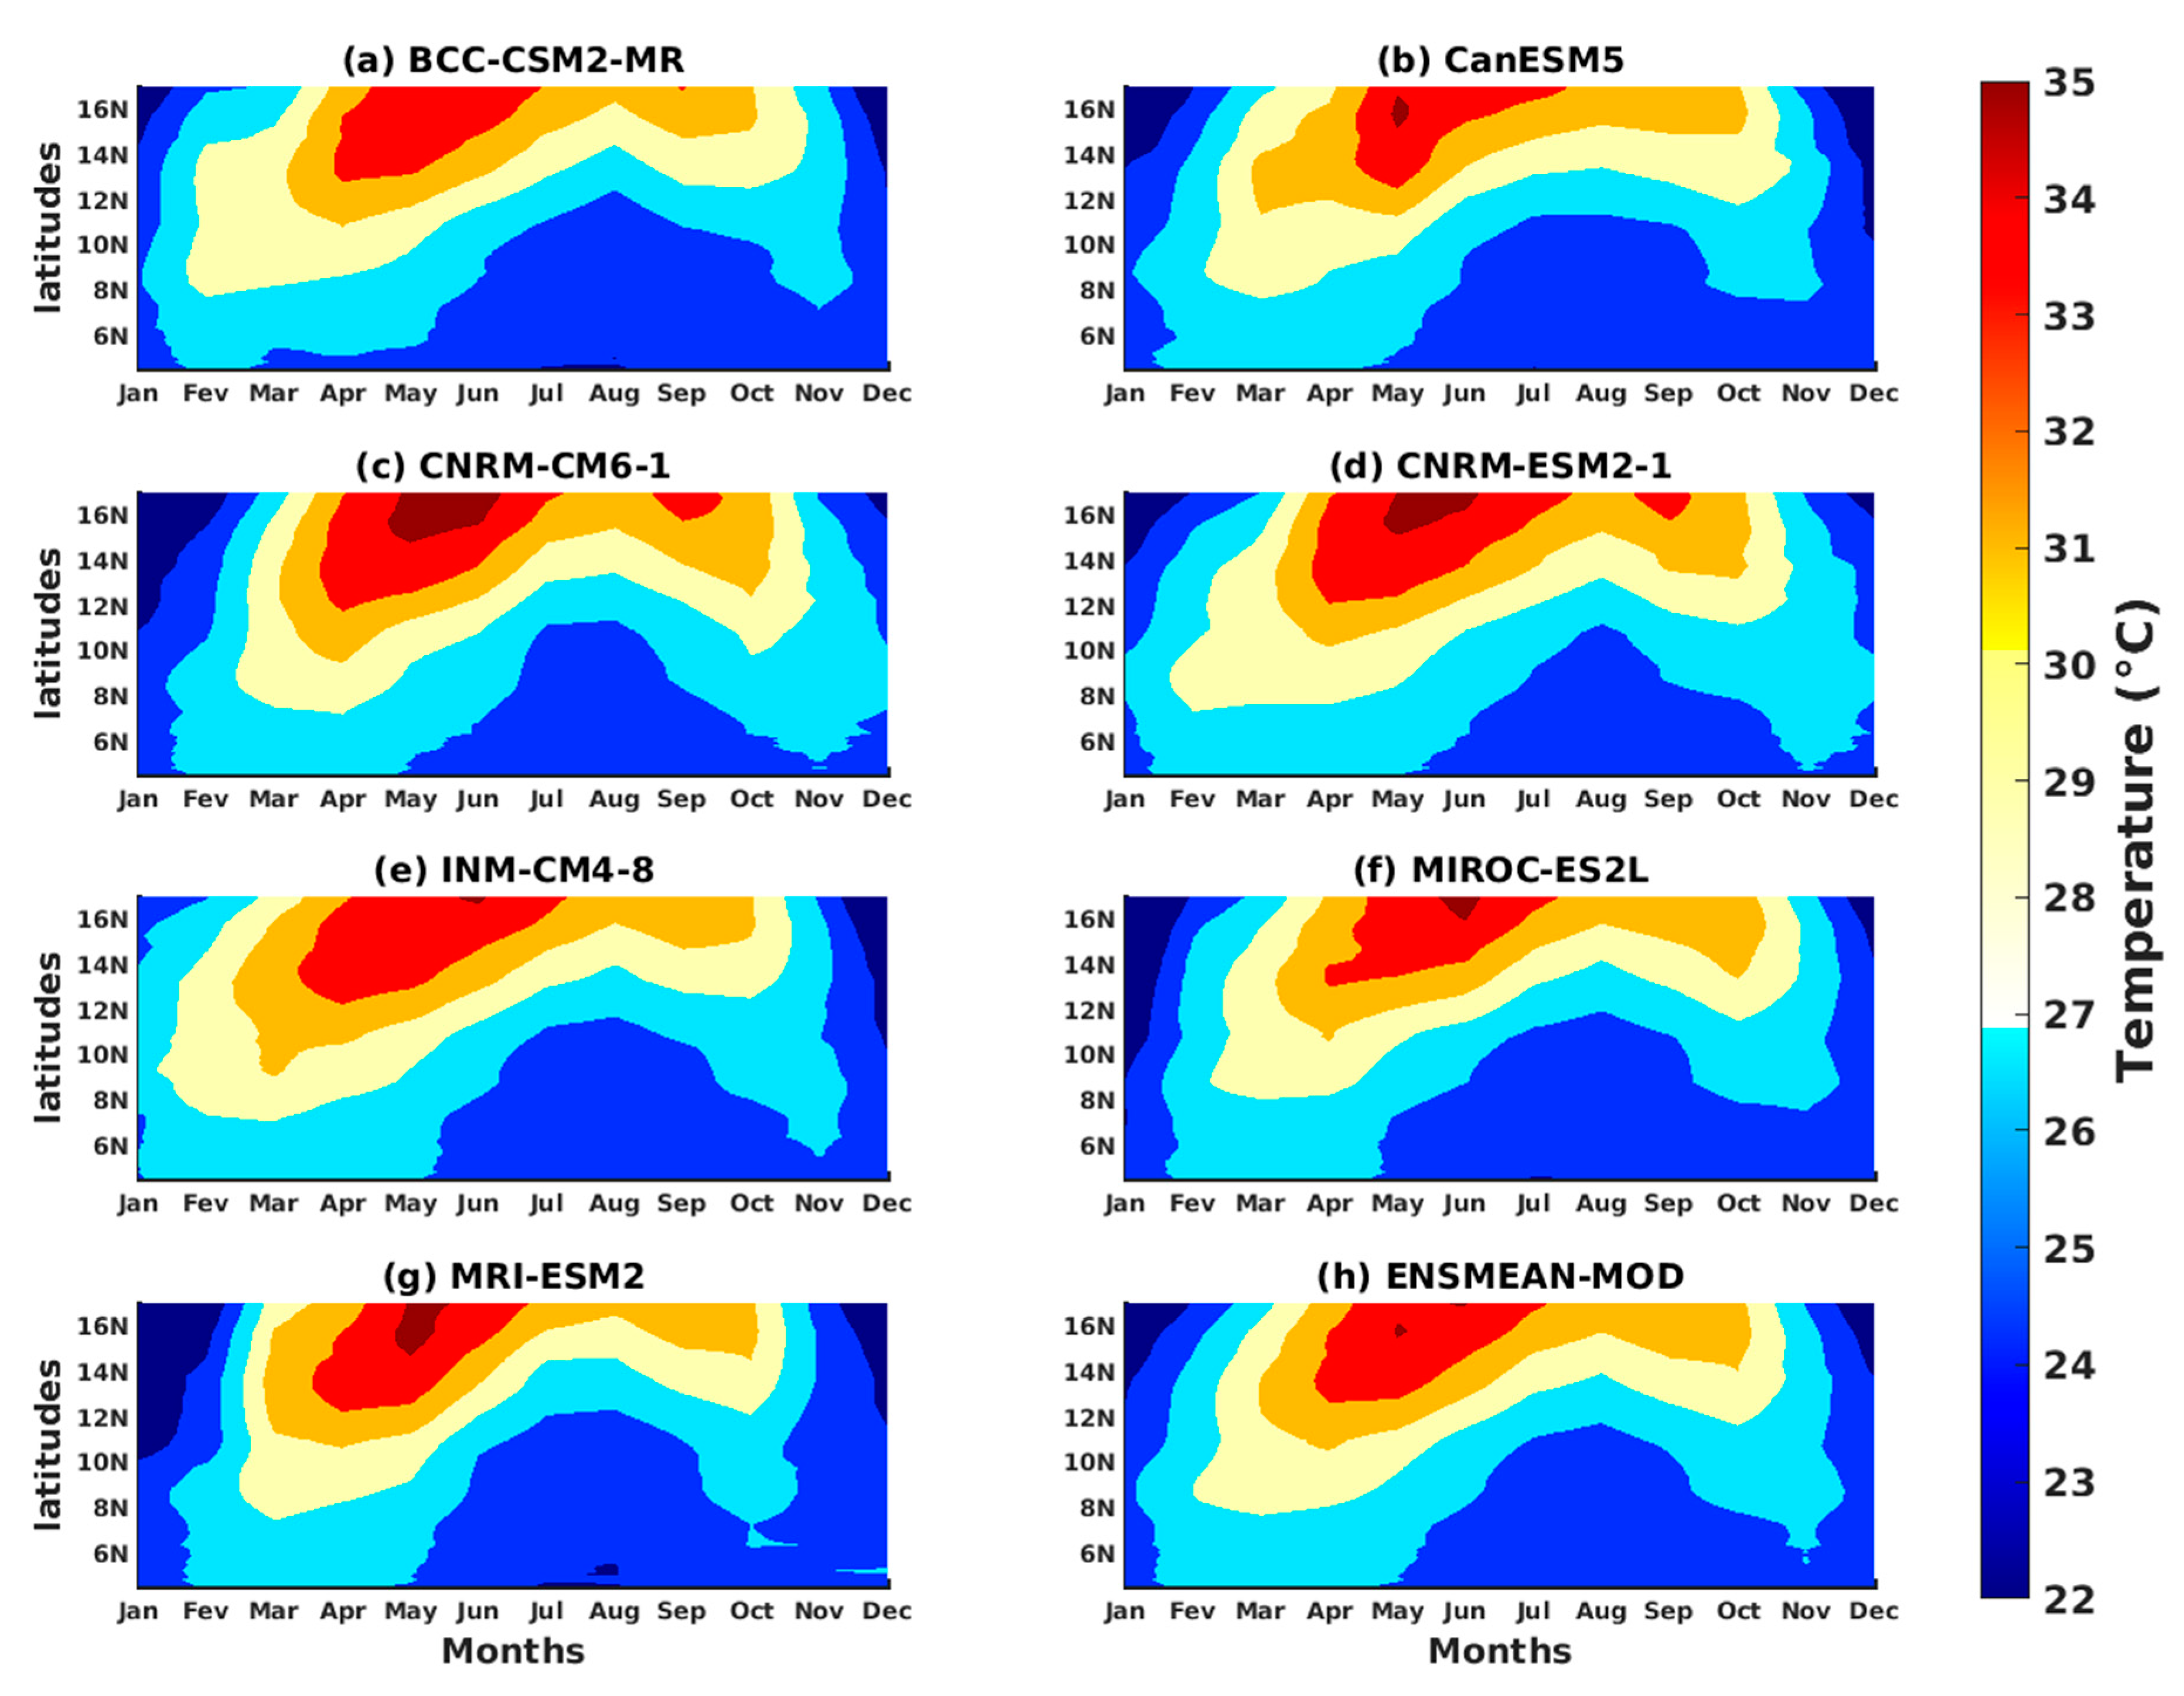
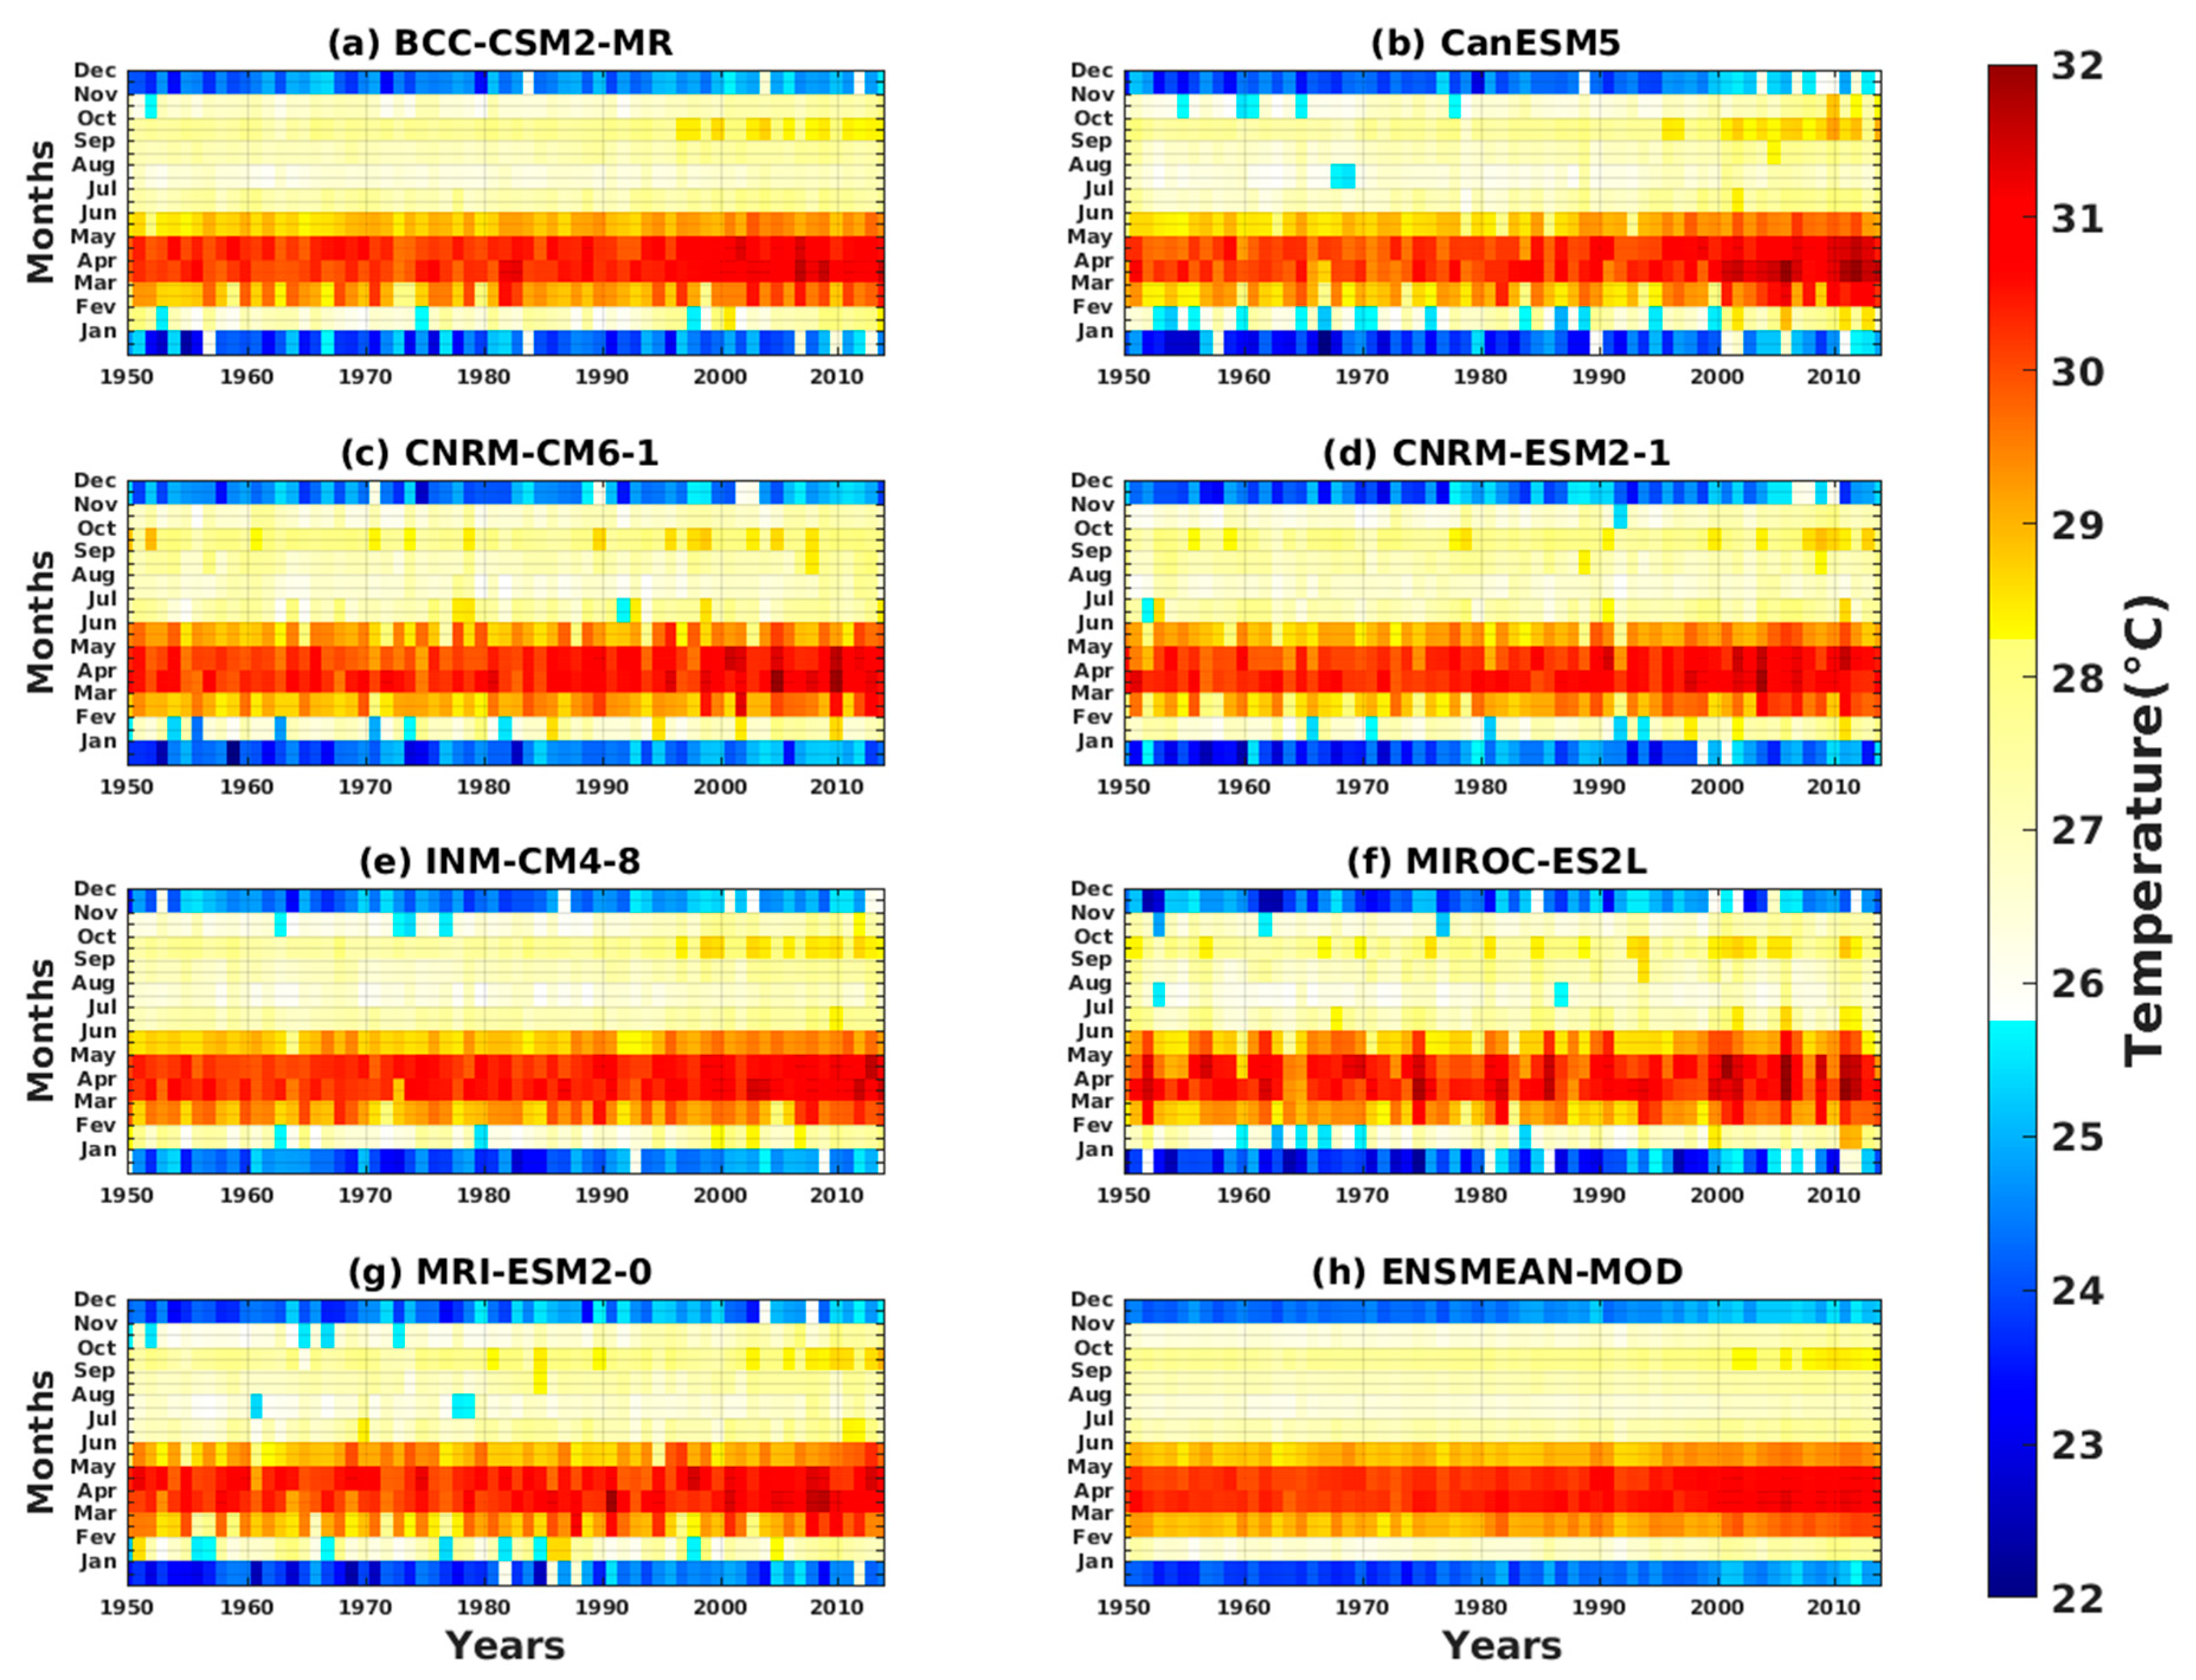
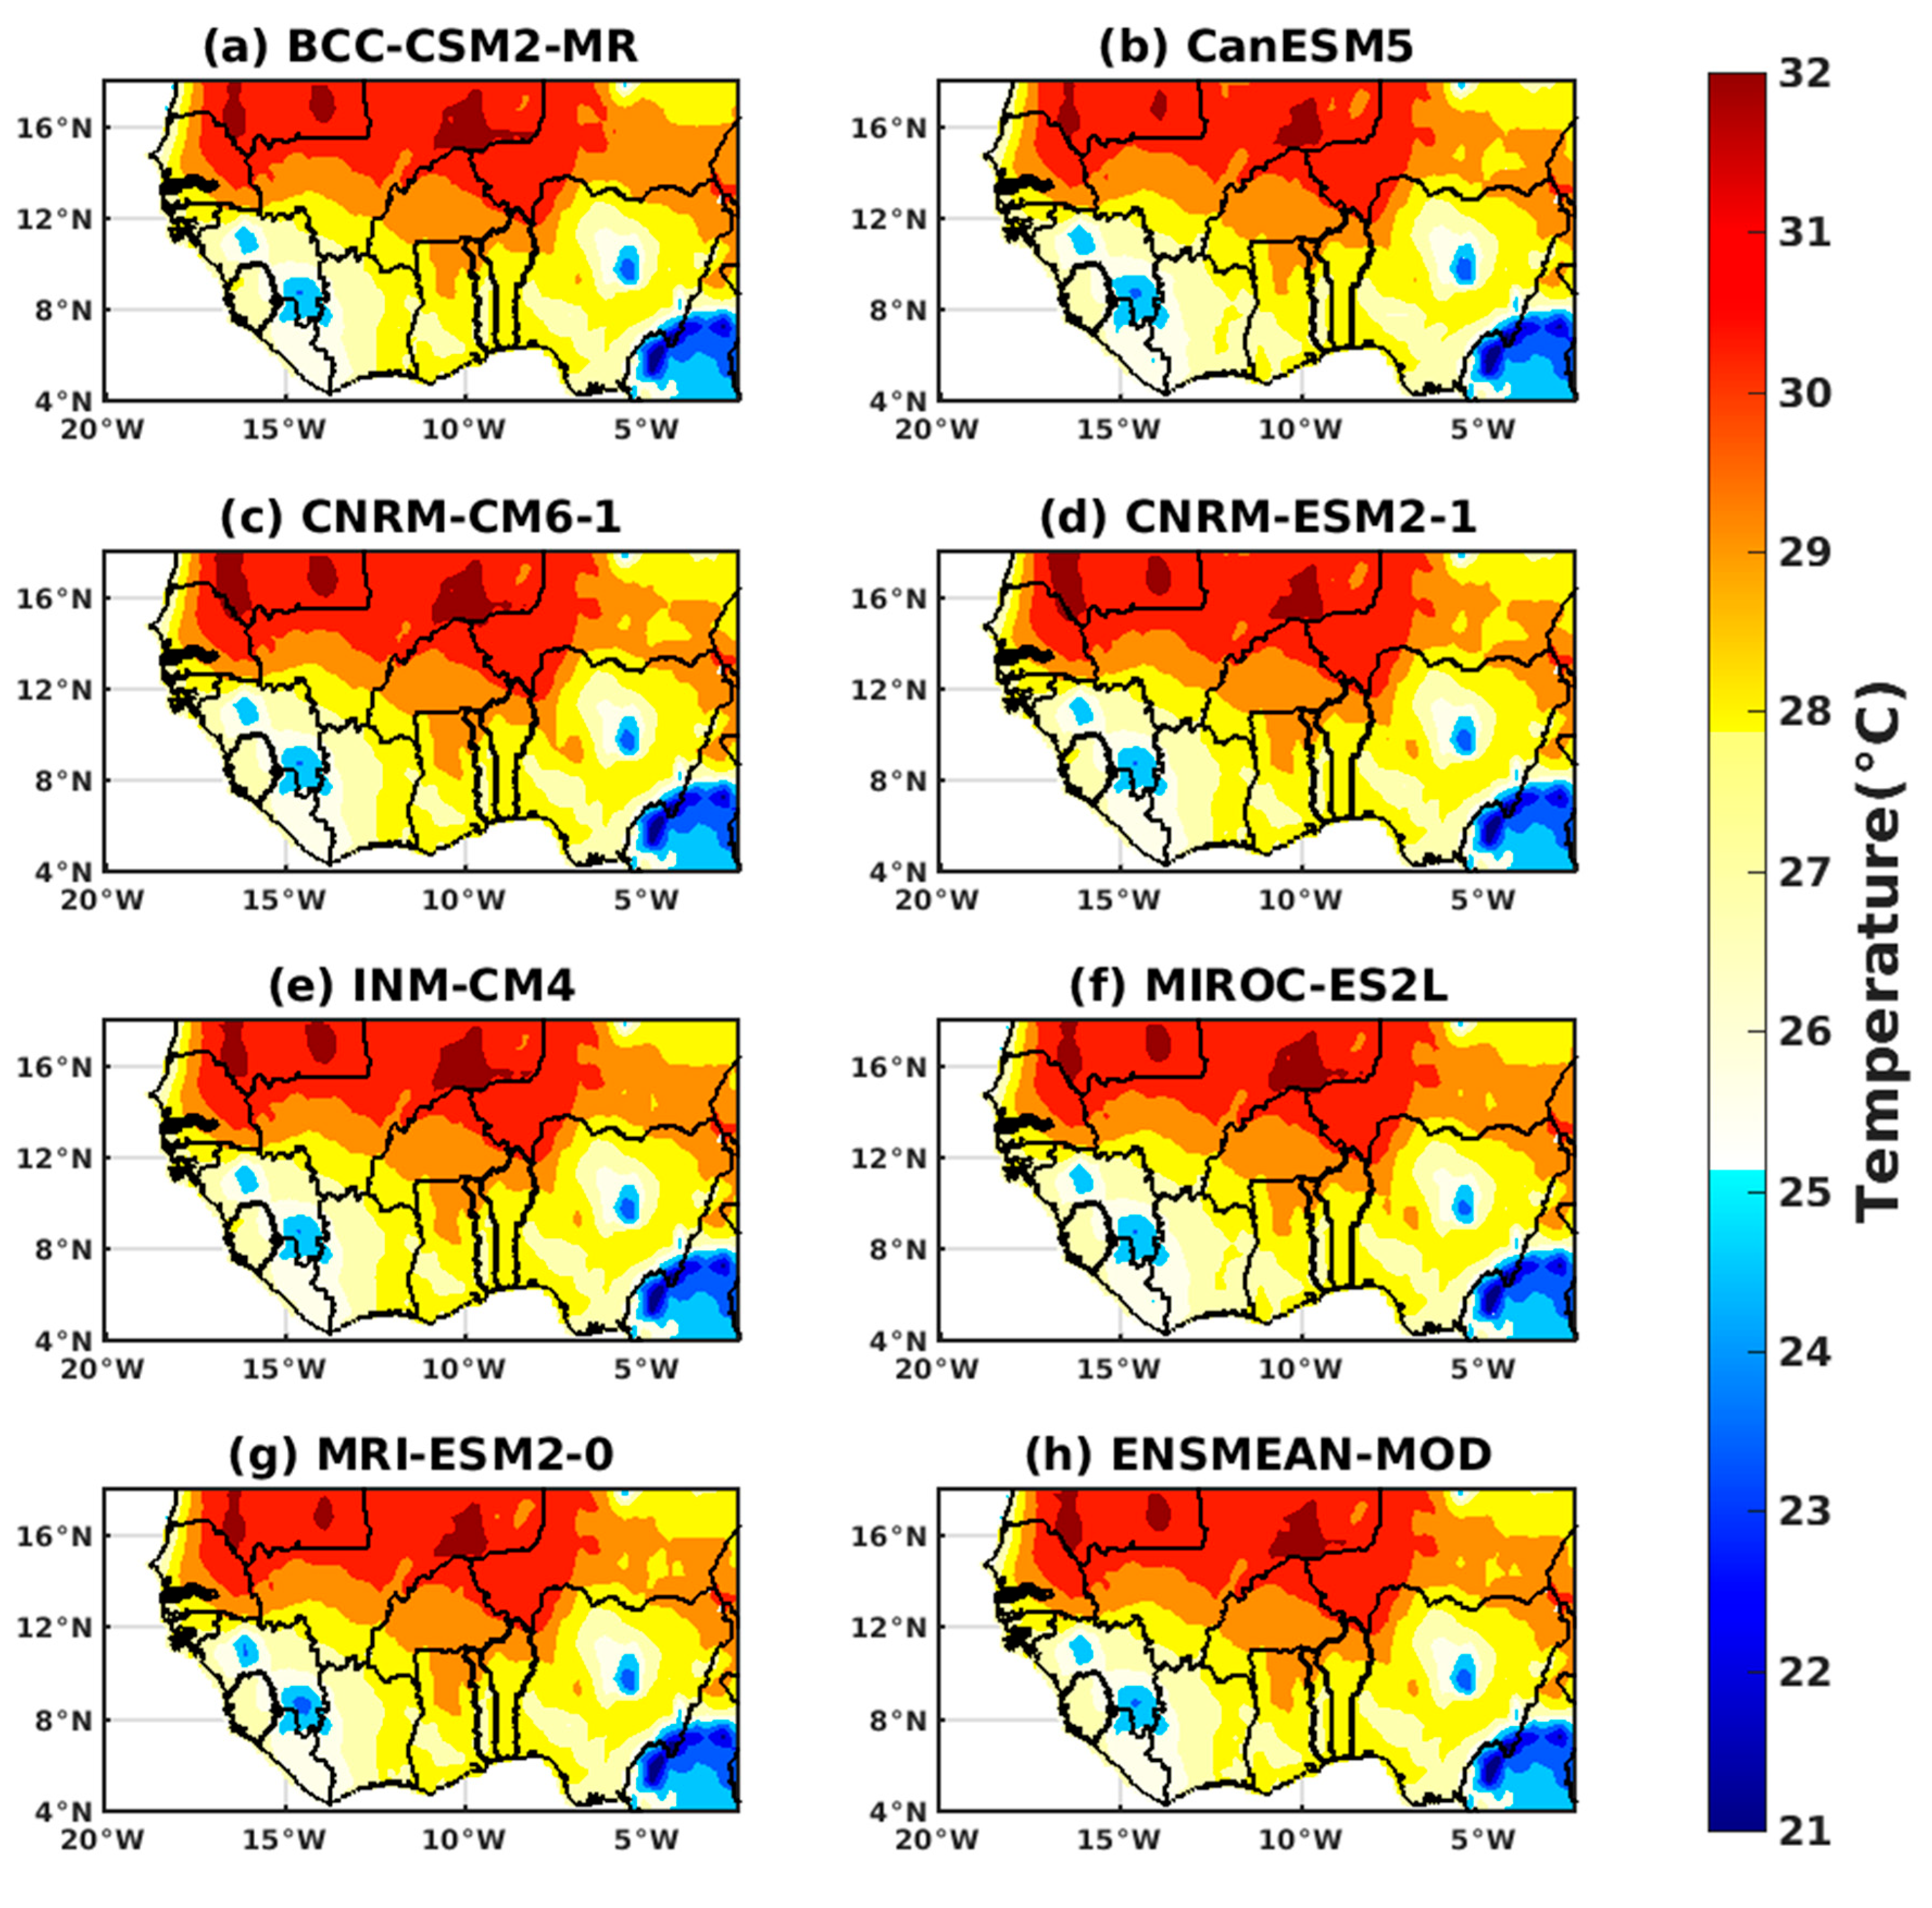
3.1.2. Spatio-Temporal Variability of Rainfall and Temperature over West Africa Using CMIP6 Data

Figure 5 presents the annual cycle of rainfall for the period 1950–2014 using bias-corrected GCM data. The figure includes data from various climate models, namely BCC-CSM2-MR, CanESM5, CNRM-CM6-1, CNRM-ESM2-1, INM-CM4-8, MIROC-ES2L, MRI-ESM2-0, and ENSMEAN-MOD. It illustrates the variation in rainfall throughout the year, showing the monthly rainfall values for each climate model. It allows for a comparison of the annual cycles of rainfall between the different models.
This Figure 5 is valuable for understanding the seasonal patterns of rainfall in the study area over a long-term period. It provides insights into the differences and similarities in the timing and intensity of rainfall among the climate models. Figure 5 shows that the rainy season typically occurs from May to October. The peak rainfall is observed in August, which is consistent with previous studies [62]. During this period, the rainfall amounts exceed 200 mm. All the models analyzed in this study accurately capture this rainy season and its peak, indicating that they successfully replicate the spatio-temporal variability of rainfall in West Africa.
Figure 6 presents a Hovmöller diagram that illustrates the intra-annual variation in rainfall for the period 1950–2014 using bias-corrected CMIP6 data. The diagram includes panels (a) to (h), each representing a different climate model, namely BCC-CSM2-MR, CanESM5, CNRM-CM6-1, CNRM-ESM2-1, INM-CM4-8, MIROC-ES2L, MRI-ESM2-0, and ENSMEAN-MOD. The Hovmöller diagram allows for the visualization of temporal variations along the x-axis and spatial variations along the y-axis. Each cell in the diagram represents the value of rainfall at a specific time and location. This figure provides insights into the intra-annual patterns of rainfall for each climate model over the study period. It allows for a comparison between the models, showcasing any similarities or differences in the timing, duration, and intensity of rainfall events. Figure 6 illustrates the significant latitudinal variation in rainfall in West Africa, with a gradient from north to south. This variation is primarily influenced by climate systems, monsoons, and prevailing air masses at different latitudes. The southern coastal and equatorial regions generally receive higher amounts of rainfall, characterized by a prolonged and intense rainy season from May to October (approximately 4–8° N). The central regions experience intermediate rainfall with a shorter rainy season from June to September (around 10–12° N). In contrast, the northern regions, including the Sahara and Sahel, have very low amounts of rainfall, with a short and unpredictable rainy season (approximately 14–16° N) [63]. While there may be some differences in the intensity and extent of the rainfall signal, the models generally agree in simulating the latitudinal variation.
Figure 7 depicts the intra-annual and interannual variability in rainfall for the period 1950–2014 utilizing bias-corrected CMIP6 data. The figure includes eight different climate models: BCC-CSM2-MR, CanESM5, CNRM-CM6-1, CNRM-ESM2-1, INM-CM4-8, MIROC-ES2L, MRI-ESM2-0, and ENSMEAN-MOD. This figure provides a comprehensive representation of both the short-term and long-term variations in rainfall. It allows for the examination of the annual cycles of rainfall across different months and years, as well as the year-to-year variability in rainfall patterns. By comparing the different panels in the figure, one can assess the similarities and differences in rainfall variability among the climate models. This information is essential for understanding the reliability and consistency of the models in capturing the observed rainfall patterns. Overall, Figure 7 offers valuable insights into the intra-annual and interannual characteristics of rainfall variability, providing a basis for climate analyses. Figure 7 shows that the maximum rainfall (y-axis) occurs during the JAS season (July to September). In terms of interannual variability (x-axis), we observe an irregular rainfall pattern during the study period. From 1950 to 1980, the rainfall can be described as average, while the period from 1990 to 2014 is characterized by alternating wet and dry years [64,65]. Notably, the research in [62,66] indicates that the entire Sahelian region, including West Africa, experienced a severe drought during the 1970–1980 period. This was followed by alternating years of drought and wet conditions between 1980 and 1990. However, beyond this period, a trend towards wetter years began to emerge.
Figure 8 presents the spatial distribution of rainfall for the period 1950–2014 using bias-corrected CMIP6 data. The figure includes eight panels, labeled from (a) to (h), each representing a different climate model: BCC-CSM2-MR, CanESM5, CNRM-CM6-1, CNRM-ESM2-1, INM-CM4-8, MIROC-ES2L, MRI-ESM2-0, and ENSMEAN-MOD. The figure provides a visual representation of the spatial patterns of rainfall across the study area. Each panel showcases the distribution of rainfall values in different regions or locations, allowing for a comparison between the climate models. By examining the different panels in the figure, one can assess the similarities and differences in the spatial distribution of rainfall among the climate models. Figure 8 clearly depicts the substantial variation in rainfall between southern and northern West Africa. The southern regions, located along the coasts and near the equator, generally experience higher levels of rainfall due to the influence of the summer monsoon and other weather systems. In contrast, the northern regions of West Africa have an arid or semi-arid climate with significantly lower levels of rainfall. The central regions lie between these two extremes and receive intermediate amounts of rain. This pattern is consistent with previous research [67].
Figure 9 presents the annual cycle of temperature for the period 1950–2014 using bias-Corrected GCM data. The figure includes data from eight different climate models: BCC-CSM2-MR, CanESM5, CNRM-CM6-1, CNRM-ESM2-1, INM-CM4-8, MIROC-ES2L, MRI-ESM2-0, and ENSMEAN-MOD. The graph illustrates the variation in temperature throughout the year, showcasing the monthly temperature values for each climate model. By examining the figure, one can compare the annual cycles of temperature among the different models. This figure provides valuable insights into the seasonal patterns of temperature over the study period. It allows for the identification of similarities and differences in the timing, magnitude, and duration of temperature highs and lows among the climate models. Understanding the annual cycle of temperature is crucial for various fields, including malaria outbreaks. Figure 9 contributes to this understanding by presenting the annual variability in temperature from multiple climate models, enhancing our knowledge of the temporal patterns of temperature. In West Africa, average temperatures generally exhibit a bimodal trend, characterized by two distinct peaks: the first reaching its maximum in April–May with an average of 30.5 °C, and the second reaching its minimum in October at approximately 28 °C. The first peak aligns with the onset of the rainy season, while the second peak aligns with its conclusion [68]. The different CMIP6 simulation data clearly depict this bimodal temperature distribution in the region.
Figure 10 presents a Hovmöller diagram depicting the temperature variations for the period 1950–2014 using bias-corrected CMIP6 data. The figure consists of eight panels, labeled from (a) to (h), representing different climate models: BCC-CSM2-MR, CanESM5, CNRM-CM6-1, CNRM-ESM2-1, INM-CM4-8, MIROC-ES2L, MRI-ESM2-0, and ENSMEAN-MOD. The Hovmöller diagram allows for the visualization of temporal variations along the x-axis and spatial variations along the y-axis. Each cell in the diagram represents the temperature value at a specific time and location. This figure provides a comprehensive view of the temperature patterns over time and space, allowing for a comparison between the different climate models. By examining the panels, one can assess the similarities and differences in temperature variations among the models. Figure 10 contributes to this understanding by presenting the temperature variations across different months and years, offering insights into the performance of the climate models in capturing the observed temperature patterns. Figure 10 illustrates the latitudinal temperature variation in West Africa, which represents the changes in temperature along the region’s north–south gradient. It is observed that temperatures tend to increase as one moves towards higher latitudes. Higher latitudes (above 10° N) exhibit higher temperatures, with two distinct peaks: one in May, characterized by a very strong signal, and the other in October, with a slightly less intense signal. On the other hand, lower latitudes (below 8° N) experience lower temperatures. This temperature disparity between high and low latitudes is partly explained by the diversity of climates found in the region, ranging from humid equatorial zones to the semi-arid zones of the Sahel [69,70,71].
Figure 11 illustrates the intra-annual and interannual variability of temperature for the period 1950–2014 using bias-corrected CMIP6 data. The figure includes eight panels labeled from (a) to (h), representing different climate models: BCC-CSM2-MR, CanESM5, CNRM-CM6-1, CNRM-ESM2-1, INM-CM4-8, MIROC-ES2L, MRI-ESM2-0, and ENSMEAN-MOD. This figure provides insights into the temporal variations in temperature, both within each year and from year to year. It allows for the examination of the annual cycles of temperature across different months and the year-to-year variability in temperature patterns. By comparing the different panels, one can assess the similarities and differences in temperature variability among the climate models. This information is valuable for understanding the reliability and consistency of the models in capturing the observed temperature patterns. Figure 11 offers important insights into the intra-annual and interannual characteristics of temperature variability, providing a basis for climate analyses and impact assessments, and illustrates the year-on-year variability, highlighting significant temperature fluctuations. High temperatures were recorded over the 1970s and 1980s. In contrast to the period of the 1950s, the situation is markedly different. The period from 1990 to 2014 exhibits a noticeable temperature rise compared to the other two periods, especially during the spring season (March–April–May), which is the hottest season in West Africa. During this period, temperatures can reach exceptionally high levels [66].
Figure 12 presents the spatial distribution of temperature for the period 1950–2014 using bias-corrected CMIP6 data. The figure consists of eight panels, labeled from (a) to (h), representing different climate models: BCC-CSM2-MR, CanESM5, CNRM-CM6-1, CNRM-ESM2-1, INM-CM4-8, MIROC-ES2L, MRI-ESM2-0, and ENSMEAN-MOD. This figure provides a visual representation of the spatial patterns of temperature across the study area. Each panel showcases the distribution of temperature values in different regions or locations, allowing for a comparison between the climate models. By examining the different panels in the figure, one can assess the similarities and differences in the spatial distribution of temperature among the climate models. This information is valuable for understanding the model’s ability to capture the observed temperature patterns and for identifying areas with varying temperature levels. The temperature gradient in West Africa exhibits a gradual increase from south to north. This phenomenon can be attributed to the north–south movement of the intertropical convergence zone (ITCZ) in conjunction with the progression of the West African monsoon, which brings in fresh and humid air to the region. The maritime air, carried by the trade winds, acts as a thermal regulator, resulting in relatively moderate temperatures during summer and winter in coastal areas and the Guinean zone to the south [72]. Conversely, in the northern regions, corresponding to the Sahel, temperatures are notably higher due to the influx of hot and dry air from the Sahara Desert, known as the harmattan [73].

3.1.3. Evaluation of the VECTRI Model in West Africa

Figure 13 illustrates the annual cycle of the EIR (in ib/p/m, i.e., infectious bites per person per month) in Senegal from 1950 to 2014, representing the historical period. The data for this figure were generated through simulations conducted using the VECTRI model. The model incorporated daily rainfall and daily temperature as inputs, derived from the bias-corrected CMIP6 data of several models, including BCC-CSM2-MR, CanESM5, CNRM-CM6-1, CNRM-ESM2-1, INM-CM4-8, MIROC-ES2L, MRI-ESM2-0, and ENSMEAN-MOD. This figure provides valuable insights into the seasonal variations and trends of the EIR in Senegal over the specified time period, contributing to a better understanding of disease dynamics and potential impacts on public health. Figure 13 reveals that the peak of the EIR is observed in September, with a time lag of approximately one month in relation to the characteristic rainfall peak in West Africa. All the CMIP6 models used in this study, except for the BCC-CSM2-MR model, demonstrate a consistent peak in September. Generally, the occurrence of malaria cases aligns with a combination of high temperatures and rainfall [18,74,75,76]. The development of the Plasmodium sporogonic stage varies depending on climatic conditions, lasting between 9 and 20 days (at temperatures ranging from 30 °C to 20 °C) [77].
Figure 14 presents a Hovmöller diagram depicting the EIR (in ib/p/m, i.e., infectious bites per person per month) in West Africa from 1950 to 2014, representing the historical period. The data for this figure were generated through simulations conducted using the VECTRI model, which was driven by rainfall and temperature data from the bias-corrected CMIP6 dataset. The models used in the simulations include BCC-CSM2-MR, CanESM5, CNRM-CM6-1, CNRM-ESM2-1, INM-CM4-8, MIROC-ES2L, MRI-ESM2-0, and ENSMEAN-MOD. This figure provides a visual representation of the spatio-temporal patterns and variations of the EIR in West Africa, offering valuable insights into the distribution and dynamics of infectious bites in the region over the specified time period. Figure 14 highlights a notable occurrence of the disease in the West African region. In the Golf of Guinean region (between 4° N and 8° N) at lower latitudes, there is significant malaria transmission with an extended period of transmission that exhibits two distinct peaks in June and November. This region corresponds to the area where rainfall in West Africa reaches its highest levels. As latitudes increase beyond 10° N, malaria transmission gradually decreases, reaching its peak in September, with a shorter transmission period between August and October [78]. This pattern is observed in all the models used this study, although the CNRM-ESM2-1 model demonstrates a higher intensity.
Figure 15 provides a comprehensive analysis of the intra-annual and interannual variability of the EIR (in ib/p/m, i.e., infectious bites per person per month) of malaria in West Africa from 1950 to 2014, representing the historical period. The simulations conducted using the VECTRI model incorporated daily rainfall and daily temperature data from the bias-corrected CMIP6 dataset. The models utilized in the simulations include BCC-CSM2-MR, CanESM5, CNRM-CM6-1, CNRM-ESM2-1, INM-CM4-8, MIROC-ES2L, MRI-ESM2-0, and ENSMEAN-MOD. This figure provides a comprehensive overview of the temporal variations and patterns of malaria transmission in West Africa, highlighting both short-term fluctuations and long-term trends. The intra-annual/interannual variability of the EIR, as presented in Figure 15, depicts the changes in malaria occurrence throughout the years across different months. In West Africa, the transmission period generally spans from April to November, with a peak observed between August and September. Over the studied period from 1950 to 2014, there was an overall increasing trend in transmission. From 1950 to 1980, a moderate variation can be observed, while a more pronounced variation is evident between 1980 and 2014. This fluctuation in transmission is influenced by both precipitation and temperature. Our previous results showed that over the period 1990–2014, the values of these two variables were important, with heavy rainfall and temperatures favorable to malaria transmission. Strong rainfall combined with high temperatures create favorable conditions for malaria transmission [5,75]
Figure 16 presents a spatial distribution map of the EIR (in ib/p/m, i.e., infectious bites per person per month) of malaria in West Africa from 1950 to 2014, representing the historical period. The simulations conducted using the VECTRI model utilized inputs of rainfall and temperature from the bias-corrected CMIP6 dataset. The models employed in the simulations include BCC-CSM2-MR, CanESM5, CNRM-CM6-1, CNRM-ESM2-1, INM-CM4-8, MIROC-ES2L, MRI-ESM2-0, and ENSMEAN-MOD. This figure provides a visual representation of the spatial patterns and distribution of malaria transmission intensity across West Africa over the specified time period. The map allows for a better understanding of the geographical variations in malaria risk and can aid in targeted interventions and resource allocation for malaria control efforts in the region. Figure 16 shows that the coastal regions located in the southern area are the most affected by malaria. These regions experience a higher amount of rainfall [9]. Additionally, the southern part benefits from high temperatures and favorable vegetation cover, which promote the proliferation of mosquitoes and the spread of malaria-causing parasites [79]. In contrast, the northern zone has climatic conditions and aridity that limit the survival and ability of adult Anopheles mosquitoes to contribute to parasite transmission.

3.2. Future Climate Impacts on Malaria

Figure 17 represents a Hovmöller diagram depicting the EIR (in ib/p/m, i.e., infectious bites per person per month) in West Africa during the projected period. The simulations were conducted using the VECTRI model, which utilized rainfall and temperature data from the bias-corrected CMIP6 dataset. The figure consists of panels (a) to (h), representing the results obtained from different climate models, BCC-CSM2-MR, CanESM5, CNRM-CM6-1, CNRM-ESM2-1, INM-CM4-8, MIROC-ES2L, MRI-ESM2-0, and ENSMEAN-MOD, specifically for the ssp585 scenario. This figure provides valuable insights into the potential future changes in the EIR in West Africa under different climate model projections. Figure 17 illustrates that the EIR is higher in the ssp585 scenario compared to the ssp245 scenario. Projections suggest an expansion of the transmission period, particularly in the southern part of West Africa (between 4° N and 8° N). Despite this, there is a decrease in signal intensity, indicating a reduction in malaria cases in the future, especially in higher latitudes (above 10° N) to the north. This reduction can be attributed, in part, to the effects of climate change, such as decreased rainfall and very hot temperatures. It appears that the survival patterns of adult mosquitoes and parasites are influenced by warm temperatures [80]. However, even with this decline in malaria, the two maximum peaks observed in the Guinean zone to the south and the single peak observed in the Sahelian zone to the north, as observed in the historical period, remain consistent regardless of the scenario. Additional figures for the ssp245 scenario can be found in Supplementary Materials (see Figure S1).
Figure 18 shows that the period of high EIRs is generally between May and November, with a peak in September for the ssp585 scenario. Moreover, the results indicate that the EIR will gradually decline in West Africa in future periods, both in the short term (2015–2045) and in the long term (2075–2100). However, this reduction is more pronounced in the far future. In contrast, the transmission has a stronger signal in the medium future (2045–2075) compared to the other two periods. In other words, malaria will be more prevalent in the mean future period compared to periods in the near future and the distant future, where the signal is less pronounced. The models predict very high future temperatures [73] that will adversely affect the life cycle of mosquitoes and parasites [81]. Although the risk of malaria transmission in Africa follows both a peak at 25 °C and a decline above 28 °C [82], the effects of climate change will result in temperatures higher than those of the decline. In addition, the expected decrease in rainfall in the future will reduce mosquito breeding sites, which will slow their multiplication [83]. The INM-CM4-8 model projects an increase in malaria prevalence into the distant future. This trend of increasing malaria in the far future has also been observed with the INM-CM4-8, CanESM5, CNRM-ESM2-1, and MIROC-ES2L models for the ssp245 scenario (see Figure S2 in Supplementary Materials).
Figure 19 presents the spatial distribution of the EIR of malaria in West Africa from 2014 to 2100. The data are generated through simulations using the VECTRI model, which is driven by rainfall and temperature data from the bias-corrected CMIP6 dataset. The EIR values are expressed in infectious bites per person per month (ib/p/m). The figure is divided into eight panels, labeled (a) to (h), each representing a different climate model. The climate models used in the simulations are BCC-CSM2-MR, CanESM5, CNRM-CM6-1, CNRM-ESM2-1, INM-CM4-8, MIROC-ES2L, MRI-ESM2-0, and ENSMEAN-MOD for ssp585. Figure 19 provides a visual representation of how the EIR of malaria is distributed across West Africa during the specified time period under different climate scenarios. By comparing the panels, one can observe the variations in malaria transmission intensity across the region as influenced by different climate models and their associated rainfall and temperature patterns. This figure provides a comprehensive depiction of the temporal variations and patterns of malaria transmission intensity in West Africa over the specified time period, considering both short-term fluctuations (2015–2045) and long-term trends (2075–2100). Figure 19 shows that for the ssp585 scenario, the EIR is shifting southward. This is because the northern part of West Africa, which is a semi-arid region close to the Sahel [2], will become less suitable for malaria transmission in the future. This will result in a decrease in the prevalence of the disease [84]. However, it is important to note that even in the southern regions where transmission will predominate, the distribution of malaria will be reduced, especially in warm climate areas where transmission currently occurs due to favorable temperatures [85]. Despite these trends, the southern coastal areas will continue to be the most affected by malaria [86]. The ssp245 scenario shows similar findings to the ssp585 scenario, but with a much stronger signal intensity. You can refer to Figure S3 in Supplementary Materials for more details.
Climate change, encompassing global warming and changes in rainfall patterns, has significant implications for malaria transmission [87,88]. This study examines the relationship between the impact of climate change on the spread of malaria using the EIR variable. in West Africa using the dynamic VECTRI model driven by CMIP6 bias-corrected data. The findings indicate that low-latitude regions in West Africa experience abundant rainfall, leading to the creation of stagnant water that is favorable for the proliferation of malaria-vector mosquitoes. These areas have a longer transmission period (May to November) compared to high latitudes, where the period is shorter (August–September–October) (refer to Figure 14 and Figure 17). The optimal temperatures accompanying this rainfall support the reproduction and survival of malaria-carrying mosquitoes [89]. In warmer conditions, these mosquitoes multiply more rapidly, with an estimated duration of 9 to 20 days (between 30 °C and 20 °C) for P. falciparum and a slightly faster rate for P. vivax at similar temperatures, but more prolonged for P. malariae [90]. This situation increases the risk of malaria transmission, which explains the high prevalence observed between 1990 and 2010, a period characterized by intense malaria transmission. Abundant vegetation cover in low-latitude areas further contributes to the presence of mosquito breeding sites. Conversely, regions in northern West Africa are less affected by malaria due to the type of soil in these semi-arid areas, which reduces the lifespan of mosquito breeding sites [91]. Additionally, the climatic conditions near the Sahel limit the survival and development of mosquitoes (spatial map). Some studies suggest that climate change may decrease malaria transmission in the future [85,92]. Our own results, based on the ssp585 scenario (the most pessimistic), support this hypothesis. Climate projections indicate an increase in extreme events like flooding, drought, and heatwaves [93], which will negatively impact malaria prevalence. While rainfall partially favors mosquitoes by providing breeding sites, excessive rainfall can wash away larvae, reducing the transmission risk. Prolonged drought can also decrease water resources. Conversely, higher rainfall and temperatures can expand mosquito habitats to new areas. Locations previously unsuitable for mosquitoes due to cold temperatures could become more conducive to their survival and reproduction, facilitating the spread of malaria to new regions, as indicated by our results [94]. However, the ssp245 scenario (the medium) shows similar projections with a more pronounced signal intensity. The only difference lies in the prediction of a future increase in malaria according to the ssp245 scenario, as found in [95].

4. Conclusions

In this study, we assessed the VECTRI model for reproducing malaria transmission using CMIP6 bias-corrected data. Our analysis focused on the entomological inoculation rate (EIR) and the number of malaria cases in Senegal to validate the CMIP6 global climate models used in the VECTRI model. This allowed us to identify the spatio-temporal variations in malaria transmission in Senegal using these data. Most of the models successfully replicated the annual cycle and transmission period of malaria in Senegal, which occurs between August, September, and October, with a peak in September. This peak was observed to be one month after the peak rainfall. While the models did not fully capture the inter-annual variations throughout the study period in Senegal, the ensemble mean of the models provided a reasonable representation and trend of confirmed malaria cases. Regarding spatial variation in Senegal, all the models reproduced the decline in malaria transmission from south to north. Our previous work allowed us to utilize the VECTRI model to replicate the historical characteristics of malaria in West Africa and quantify projected changes using two scenarios: ssp245 and ssp585. The results revealed that, during the historical period from 1950 to 2014, regions with low latitudes (southern West Africa), characterized by heavy rainfall, were the most affected by malaria transmission. Two transmission peaks were observed in June and October, with a high transmission period extending from May to November. In contrast, high-latitude regions (northern West Africa) experienced a transmission period between August, September, and October, with a peak in September. The variability over the years during the historical period demonstrated that periods of high rainfall combined with moderate temperatures corresponded to high transmission periods. Regarding the projections based on the ssp585 scenario, the results indicated that the malaria prevalence in West Africa would gradually decrease in the far future. However, the period of high transmission is expected to expand. Additionally, malaria prevalence has shifted from endemic areas to regions that have become more suitable for transmission due to climate change. Similar results were observed with the ssp245 scenario, but it predicted an increase in malaria prevalence in the far future. Given the discrepancies among the different models, it is recommended to not rely solely on the results of a single model when assessing future climate change. Instead, it is better to work with an average of the results from multiple climate models, known as a multi-model ensemble. However, it is important to approach these results with caution due to uncertainties associated with both the disease model and the GCM projections for the coming years. In addition, other vectors, such as An. funestus and An. arabiensis, which are present in West Africa, were not taken into account in the simulation. This fact may underestimate malaria transmission in areas where these vectors are dominant. It is worth noting that climate is not the sole determinant of malaria transmission, as other factors such as immunity, socio-economic development, population growth, and the effectiveness of control measures also influence the risk of malaria. Taking these factors into account could change malaria forecasts in the area. The impact of global warming and rainfall variations may exacerbate the spread of this deadly disease. Therefore, an integrated approach to managing malaria and adapting to climate change is essential to mitigating its impact in the region. These findings hold great importance for decision makers involved in developing public health initiatives in West Africa and beyond. They provide valuable insights for the development of vector control and mitigation strategies. Moving forward, we plan to expand our research by incorporating factors such as population mobility and interventions to further examine the projected prevalence of malaria in West Africa and across the continent.

Supplementary Materials

The following supporting information can be downloaded at https://www.mdpi.com/article/10.3390/microbiolres14040145/s1, Figure S1: Hovmöller diagram intra-annual of the EIR (in ib/p/m i.e., infectious bites per person per month) of malaria in West Africa for the period 1950–2014: Simulations of the VECTRI model forced by rainfall and temperature of the Bias-corrected CMIP6 data: (a) BCC-CSM2-MR, (b) CanESM5, (c) CNRM-CM6-1, and (d) CNRM-ESM2-1, (e) INM-CM4-8, (f) MIROC-ES2L, (g) MRI-ESM2-0, (h) ENSMEAN-MOD for ssp245, Figure S2: Hovmöller diagram intra and inter-annual of the EIR (in ib/p/m i.e., infectious bites per person per month) of malaria in West Africa for the period 1950–2014: Simulations of the VECTRI model forced by rainfall and temperature of the Bias-corrected CMIP6 data: (a) BCC-CSM2-MR, (b) CanESM5, (c) CNRM-CM6-1, and (d) CNRM-ESM2-1, (e) INM-CM4-8, (f) MIROC-ES2L, (g) MRI-ESM2-0, (h) ENSMEAN-MOD for ssp245, Figure S3: Spatial distribution of the EIR (in ib/p/m i.e., infectious bites per person per month) of malaria in West Africa for the period 1950–2014: Simulations of the VECTRI model forced by rainfall and temperature of the Bias-corrected CMIP6 data: (a) BCC-CSM2-MR, (b) CanESM5, (c) CNRM-CM6-1, and (d) CNRM-ESM2-1, (e) INM-CM4-8, (f) MIROC-ES2L, (g) MRI-ESM2-0, (h) ENSMEAN-MOD for ssp245.

Author Contributions

P.F., assisted by I.D. and A.D., carried out the experimental activities, analyzed the data, and wrote the initial manuscript. A.D., I.D., S.D., D.S., B.S. and S.J. oversaw the study, leading discussions on climate data availability and access. All authors have read and agreed to the published version of the manuscript.

Funding

This study has been partly supported by IRD through JEAI-CLISAS (Young Team associated with IRD-Climate and Health in Senegal). The funders played no role in determining the study design, the data collection or analysis methods employed, the decision to publish, or preparing the paper.

Institutional Review Board Statement

Not applicable.

Informed Consent Statement

Not applicable.

Data Availability Statement

The bias-corrected CMIP6 data used in this work were obtained from the Climate Data Store (CDS) of the European Centre for Medium-Range Weather Forecasts (ECMWF), i.e., this link: https://cds.climate.copernicus.eu/cdsapp#!/dataset/reanalysis-era5-single-levels?tab=form (accessed on 28 January 2020). Data are downloaded using a CDS API (python script). The observed malaria cases are available in the PNLP.

Acknowledgments

We thank the International Center for Theoretical Physics (ICTP), where the VECTRI model was developed. Further, the authors of this study thank PNLP, who provided us with the observational data that were difficult to obtain.

Conflicts of Interest

The authors declare no conflict of interest.

References

  1. Noguer, A. Les facteurs influençant la distribution géographique du paludisme dans le monde. Globe Rev. Genev. Géogr. 1979, 119, 15–25. [Google Scholar] [CrossRef]
  2. Mouchet, J.; Faye, O.; Julvez, J.; Manguin, S. Drought and Malaria Retreat in the Sahel, West Africa. Lancet 1996, 348, 1735–1736. [Google Scholar] [CrossRef] [PubMed]
  3. Bayoh, M.N.; Lindsay, S.W. Effect of Temperature on the Development of the Aquatic Stages of Anopheles gambiae Sensu Stricto (Diptera: Culicidae). Bull. Entomol. Res. 2003, 93, 375–381. [Google Scholar] [CrossRef] [PubMed]
  4. Mason, S.J.; Thomson, M.C.; Connor, S.J.; Phindela, T. Use of rainfall and sea surface temperature monitoring for malaria early warning in Botswana. Am. J. Trop. Med. Hyg. 2005, 73, 214–221. [Google Scholar] [CrossRef]
  5. De Silva, P.M.; Marshall, J.M. Factors Contributing to Urban Malaria Transmission in Sub-Saharan Africa: A Systematic Review. J. Trop. Med. 2012, 2012, 819563. [Google Scholar] [CrossRef] [PubMed]
  6. Dasgupta, S. Burden of Climate Change on Malaria Mortality. Int. J. Hyg. Environ. Health 2018, 221, 782–791. [Google Scholar] [CrossRef]
  7. World Malaria Report 2022. Available online: https://www.who.int/teams/global-malaria-programme/reports/world-malaria-report-2022 (accessed on 2 August 2023).
  8. Diouf, I.; Adeola, A.M.; Abiodun, G.J.; Lennard, C.; Shirinde, J.M.; Yaka, P.; Ndione, J.-A.; Gbobaniyi, E.O. Impact of Future Climate Change on Malaria in West Africa. Theor. Appl. Clim. 2022, 147, 853–865. [Google Scholar] [CrossRef]
  9. Kleinschmidt, I.; Omumbo, J.; Briët, O.; Van De Giesen, N.; Sogoba, N.; Mensah, N.K.; Windmeijer, P.; Moussa, M.; Teuscher, T. An Empirical Malaria Distribution Map for West Africa. Trop. Med. Int. Health 2001, 6, 779–786. [Google Scholar] [CrossRef]
  10. Caminade, C.; Kovats, S.; Rocklov, J.; Tompkins, A.M.; Morse, A.P.; Colón-González, F.J.; Stenlund, H.; Martens, P.; Lloyd, S.J. Impact of Climate Change on Global Malaria Distribution. Proc. Natl. Acad. Sci. USA 2014, 111, 3286–3291. [Google Scholar] [CrossRef]
  11. Tompkins, A.M.; Ermert, V. A Regional-Scale, High Resolution Dynamical Malaria Model That Accounts for Population Density, Climate and Surface Hydrology. Malar. J. 2013, 12, 65. [Google Scholar] [CrossRef]
  12. Tompkins, A.M.; Colón-González, F.J.; Di Giuseppe, F.; Namanya, D.B. Dynamical Malaria Forecasts Are Skillful at Regional and Local Scales in Uganda up to 4 Months Ahead. GeoHealth 2019, 3, 58–66. [Google Scholar] [CrossRef] [PubMed]
  13. Fall, P.; Diouf, I.; Deme, A.; Sene, D. Assessment of Climate-Driven Variations in Malaria Transmission in Senegal Using the VECTRI Model. Atmosphere 2022, 13, 418. [Google Scholar] [CrossRef]
  14. Fall, P.; Diouf, I.; Deme, A.; Diouf, S.; Sene, D.; Sultan, B.; Famien, A.M.; Janicot, S. Bias-Corrected CMIP5 Projections for Climate Change and Assessments of Impact on Malaria in Senegal under the VECTRI Model. Trop. Med. Infect. Dis. 2023, 8, 310. [Google Scholar] [CrossRef] [PubMed]
  15. Chemison, A.; Ramstein, G.; Tompkins, A.M.; Defrance, D.; Camus, G.; Charra, M.; Caminade, C. Impact of an Accelerated Melting of Greenland on Malaria Distribution over Africa. Nat. Commun. 2021, 12, 3971. [Google Scholar] [CrossRef] [PubMed]
  16. Tompkins, A.M.; Thomson, M.C. Uncertainty in Malaria Simulations in the Highlands of Kenya: Relative Contributions of Model Parameter Setting, Driving Climate and Initial Condition Errors. PLoS ONE 2018, 13, e0200638. [Google Scholar] [CrossRef] [PubMed]
  17. Asare, E.; Amekudzi, L. Assessing Climate Driven Malaria Variability in Ghana Using a Regional Scale Dynamical Model. Climate 2017, 5, 20. [Google Scholar] [CrossRef]
  18. Fosah, S.; Mbouna, A.D.; Efon, E.; Achu, D.F.; Andre, L.; Dikande, A.M. Influences of Rainfall and Temperature on Malaria Endemicity in Cameroon: Emphasis on Bonaberi District. GEP 2022, 10, 46–66. [Google Scholar] [CrossRef]
  19. Sultan, B.; Janicot, S.; Diedhiou, A. The West African Monsoon Dynamics. Part I: Documentation of Intraseasonal Variability. J. Clim. 2003, 16, 3389–3406. [Google Scholar] [CrossRef]
  20. Sultan, B.; Janicot, S. The West African Monsoon Dynamics. Part II: The “Preonset” and “Onset” of the Summer Monsoon. J. Clim. 2003, 16, 3407–3427. [Google Scholar] [CrossRef]
  21. Navarro-Racines, C.; Tarapues, J.; Thornton, P.; Jarvis, A.; Ramirez-Villegas, J. High-Resolution and Bias-Corrected CMIP5 Projections for Climate Change Impact Assessments. Sci. Data 2020, 7, 7. [Google Scholar] [CrossRef]
  22. Xu, Z.; Han, Y.; Tam, C.-Y.; Yang, Z.-L.; Fu, C. Bias-Corrected CMIP6 Global Dataset for Dynamical Downscaling of the Historical and Future Climate (1979–2100). Sci. Data 2021, 8, 293. [Google Scholar] [CrossRef] [PubMed]
  23. Xu, Z.; Yang, Z.-L. An Improved Dynamical Downscaling Method with GCM Bias Corrections and Its Validation with 30 Years of Climate Simulations. J. Clim. 2012, 25, 6271–6286. [Google Scholar] [CrossRef]
  24. Marchi, M.; Castellanos-Acuña, D.; Hamann, A.; Wang, T.; Ray, D.; Menzel, A. ClimateEU, Scale-Free Climate Normals, Historical Time Series, and Future Projections for Europe. Sci. Data 2020, 7, 428. [Google Scholar] [CrossRef] [PubMed]
  25. Giorgi, F.; Mearns, L.O. Introduction to Special Section: Regional Climate Modeling Revisited. J. Geophys. Res. Atmos. 1999, 104, 6335–6352. [Google Scholar] [CrossRef]
  26. Sarr, A. Multi-Scale Characteristics of Precipitation and Temperature over West Africa Using SMHI-RCA Driven by GCMs under RCP8.5. Am. J. Clim. Change 2017, 6, 455–486. [Google Scholar] [CrossRef]
  27. Gutowski, W.J.; Ullrich, P.A.; Hall, A.; Leung, L.R.; O’Brien, T.A.; Patricola, C.M.; Arritt, R.W.; Bukovsky, M.S.; Calvin, K.V.; Feng, Z.; et al. The Ongoing Need for High-Resolution Regional Climate Models: Process Understanding and Stakeholder Information. Bull. Am. Meteorol. Soc. 2020, 101, E664–E683. [Google Scholar] [CrossRef]
  28. Michelangeli, P.-A.; Vrac, M.; Loukos, H. Probabilistic Downscaling Approaches: Application to Wind Cumulative Distribution Functions. Geophys. Res. Lett. 2009, 36. [Google Scholar] [CrossRef]
  29. Vrac, M.; Drobinski, P.; Merlo, A.; Herrmann, M.; Lavaysse, C.; Li, L.; Somot, S. Dynamical and Statistical Downscaling of the French Mediterranean Climate: Uncertainty Assessment. Nat. Hazards Earth Syst. Sci. 2012, 12, 2769–2784. [Google Scholar] [CrossRef]
  30. Vrac, M.; Friederichs, P. Multivariate—Intervariable, Spatial, and Temporal—Bias Correction. J. Clim. 2015, 28, 218–237. [Google Scholar] [CrossRef]
  31. Vautard, R.; Noël, T.; Li, L.; Vrac, M.; Martin, E.; Dandin, P.; Cattiaux, J.; Joussaume, S. Climate Variability and Trends in Downscaled High-Resolution Simulations and Projections over Metropolitan France. Clim. Dyn. 2013, 41, 1419. [Google Scholar] [CrossRef]
  32. Lavaysse, C.; Vrac, M.; Drobinski, P.; Lengaigne, M.; Vischel, T. Statistical Downscaling of the French Mediterranean Climate: Assessment for Present and Projection in an Anthropogenic Scenario. Nat. Hazards Earth Syst. Sci. 2012, 12, 651–670. [Google Scholar] [CrossRef]
  33. Famien, A.M.; Janicot, S.; Ochou, A.D.; Vrac, M.; Defrance, D.; Sultan, B.; Noël, T. A Bias-Corrected CMIP5 Dataset for Africa Using the CDF-t Method—A Contribution to Agricultural Impact Studies. Earth Syst. Dynam. 2018, 9, 313–338. [Google Scholar] [CrossRef]
  34. Bruyère, C.L.; Done, J.M.; Holland, G.J.; Fredrick, S. Bias Corrections of Global Models for Regional Climate Simulations of High-Impact Weather. Clim. Dyn. 2014, 43, 1847–1856. [Google Scholar] [CrossRef]
  35. Dai, A.; Rasmussen, R.M.; Ikeda, K.; Liu, C. A New Approach to Construct Representative Future Forcing Data for Dynamic Downscaling. Clim. Dyn. 2020, 55, 315–323. [Google Scholar] [CrossRef]
  36. Pachauri, R.K.; Reisinger, A. Bilan 2007 des Changements Climatiques: Rapport de Synthèse. Groupe D’experts Intergouvernemental sur L’evolution du Climat: Geneva, Switzerland, 2007; ISBN 978-92-9169-222-4. [Google Scholar]
  37. O’Neill, B.C.; Tebaldi, C.; van Vuuren, D.P.; Eyring, V.; Friedlingstein, P.; Hurtt, G.; Knutti, R.; Kriegler, E.; Lamarque, J.-F.; Lowe, J.; et al. The Scenario Model Intercomparison Project (ScenarioMIP) for CMIP6. Geosci. Model. Dev. 2016, 9, 3461–3482. [Google Scholar] [CrossRef]
  38. O’Neill, B.C.; Kriegler, E.; Ebi, K.L.; Kemp-Benedict, E.; Riahi, K.; Rothman, D.S.; van Ruijven, B.J.; van Vuuren, D.P.; Birkmann, J.; Kok, K.; et al. The Roads Ahead: Narratives for Shared Socioeconomic Pathways Describing World Futures in the 21st Century. Glob. Environ. Change 2017, 42, 169–180. [Google Scholar] [CrossRef]
  39. Taylor, K.E.; Stouffer, R.J.; Meehl, G.A. An Overview of CMIP5 and the Experiment Design. Bull. Am. Meteorol. Soc. 2012, 93, 485–498. [Google Scholar] [CrossRef]
  40. Wu, T.; Lu, Y.; Fang, Y.; Xin, X.; Li, L.; Li, W.; Jie, W.; Zhang, J.; Liu, Y.; Zhang, L.; et al. The Beijing Climate Center Climate System Model (BCC-CSM): The Main Progress from CMIP5 to CMIP6. Geosci. Model. Dev. 2019, 12, 1573–1600. [Google Scholar] [CrossRef]
  41. Swart, N.C.; Cole, J.N.S.; Kharin, V.V.; Lazare, M.; Scinocca, J.F.; Gillett, N.P.; Anstey, J.; Arora, V.; Christian, J.R.; Hanna, S.; et al. The Canadian Earth System Model Version 5 (CanESM5.0.3). Geosci. Model. Dev. 2019, 12, 4823–4873. [Google Scholar] [CrossRef]
  42. Voldoire, A.; Saint-Martin, D.; Sénési, S.; Decharme, B.; Alias, A.; Chevallier, M.; Colin, J.; Guérémy, J.-F.; Michou, M.; Moine, M.-P.; et al. Evaluation of CMIP6 DECK Experiments with CNRM-CM6-1. J. Adv. Model. Earth Syst. 2019, 11, 2177–2213. [Google Scholar] [CrossRef]
  43. Séférian, R.; Delire, C.; Decharme, B.; Voldoire, A.; Salas y Melia, D.; Chevallier, M.; Saint-Martin, D.; Aumont, O.; Calvet, J.-C.; Carrer, D.; et al. Development and Evaluation of CNRM Earth System Model—CNRM-ESM1. Geosci. Model. Dev. 2016, 9, 1423–1453. [Google Scholar] [CrossRef]
  44. Volodin, E.M.; Mortikov, E.V.; Kostrykin, S.V.; Galin, V.Y.; Lykossov, V.N.; Gritsun, A.S.; Diansky, N.A.; Gusev, A.V.; Iakovlev, N.G.; Shestakova, A.A.; et al. Simulation of the Modern Climate Using the INM-CM48 Climate Model. Russ. J. Numer. Anal. Math. Model. 2018, 33, 367–374. [Google Scholar] [CrossRef]
  45. Hajima, T.; Watanabe, M.; Yamamoto, A.; Tatebe, H.; Noguchi, M.A.; Abe, M.; Ohgaito, R.; Ito, A.; Yamazaki, D.; Okajima, H.; et al. Development of the MIROC-ES2L Earth System Model and the Evaluation of Biogeochemical Processes and Feedbacks. Geosci. Model. Dev. 2020, 13, 2197–2244. [Google Scholar] [CrossRef]
  46. Yukimoto, S.; Kawai, H.; Koshiro, T.; Oshima, N.; Yoshida, K.; Urakawa, S.; Tsujino, H.; Deushi, M.; Tanaka, T.; Hosaka, M.; et al. The Meteorological Research Institute Earth System Model Version 2.0, MRI-ESM2.0: Description and Basic Evaluation of the Physical Component. J. Meteorol. Soc. Jpn. Ser. II 2019, 97, 2019–2051. [Google Scholar] [CrossRef]
  47. Detinova, T.S. Age-Grouping Methods in Diptera of Medical Importance with Special Reference to Some Vectors of Malaria. Monogr. Ser. World Health Organ. 1962, 47, 13–191. [Google Scholar] [CrossRef] [PubMed]
  48. Armstrong, J.A.; Bransby-Williams, W.R. The Maintenance of a Colony of Anopheles Gambiae, with Observations on the Effects of Changes in Temperature. Bull. World Health Organ. 1961, 24, 427–435. [Google Scholar] [PubMed]
  49. Kirby, M.J.; Lindsay, S.W. Effect of Temperature and Inter-Specific Competition on the Development and Survival of Anopheles Gambiae Sensu Stricto and An. arabiensis Larvae. Acta Trop. 2009, 109, 118–123. [Google Scholar] [CrossRef]
  50. Martens, W.J.M.; Niessen, L.W.; Rotmans, J.; McMichael, A.J. Potential Impact of Global Climate Change on Malaria Risk. Environ. Health Perspect. 1995, 103, 458–464. [Google Scholar] [CrossRef]
  51. Martens, W.; Jetten, T.; Rotmans, J.; Niessen, L. Climate Change and Vector-Borne Diseases: A Global Modelling Perspective. Glob. Environ. Change 1995, 5, 195–209. [Google Scholar] [CrossRef]
  52. Martin-Rosales, W.; Leduc, C. Dynamiques de Vidange d’une Mare Temporaire Au Sahel: L’exemple de Banizoumbou (Sud-Ouest Du Niger). C. R. Geosci. 2003, 335, 461–468. [Google Scholar] [CrossRef]
  53. Jepson, W.F.; Moutia, A.; Courtois, C. The Malaria Problem in Mauritius: The Bionomics of Mauritian Anophelines. Bull. Entomol. Res. 1947, 38, 177–208. [Google Scholar] [CrossRef] [PubMed]
  54. Bomblies, A.; Duchemin, J.-B.; Eltahir, E.A. A Mechanistic Approach for Accurate Simulation of Village Scale Malaria Transmission. Malar. J. 2009, 8, 223. [Google Scholar] [CrossRef] [PubMed]
  55. Ermert, V.; Fink, A.H.; Jones, A.E.; Morse, A.P. Development of a New Version of the Liverpool Malaria Model. I. Refining the Parameter Settings and Mathematical Formulation of Basic Processes Based on a Literature Review. Malar. J. 2011, 10, 35. [Google Scholar] [CrossRef] [PubMed]
  56. Paaijmans, K.P.; Heusinkveld, B.G.; Jacobs, A.F.G. A Simplified Model to Predict Diurnal Water Temperature Dynamics in a Shallow Tropical Water Pool. Int. J. Biometeorol. 2008, 52, 797–803. [Google Scholar] [CrossRef] [PubMed]
  57. Meinshausen, M.; Nicholls, Z.R.J.; Lewis, J.; Gidden, M.J.; Vogel, E.; Freund, M.; Beyerle, U.; Gessner, C.; Nauels, A.; Bauer, N.; et al. The Shared Socio-Economic Pathway (SSP) Greenhouse Gas Concentrations and Their Extensions to 2500. Geosci. Model Dev. 2020, 13, 3571–3605. [Google Scholar] [CrossRef]
  58. Appawu, M.; Owusu-Agyei, S.; Dadzie, S.; Asoala, V.; Anto, F.; Koram, K.; Rogers, W.; Nkrumah, F.; Hoffman, S.L.; Fryauff, D.J. Malaria Transmission Dynamics at a Site in Northern Ghana Proposed for Testing Malaria Vaccines. Trop. Med. Int. Health 2004, 9, 164–170. [Google Scholar] [CrossRef] [PubMed]
  59. Shililu, J.; Ghebremeskel, T.; Mengistu, S.; Fekadu, H.; Zerom, M.; Mbogo, C.; Githure, J.; Novak, R.; Brantly, E.; Beier, J.C. High Seasonal Variation in Entomologic Inoculation Rates in Eritrea, a Semi-Arid Region of Unstable Malaria in Africa. Am. J. Trop. Med. Hyg. 2003, 69, 607–613. [Google Scholar] [CrossRef] [PubMed]
  60. Fontenille, D.; Lochouarn, L.; Diatta, M.; Sokhna, C.; Dia, I.; Diagne, N.; Lemasson, J.-J.; Ba, K.; Tall, A.; Rogier, C.; et al. Four Years’ Entomological Study of the Transmission of Seasonal Malaria in Senegal and the Bionomics of Anopheles gambiae and A. arabiensis. Trans. R. Soc. Trop. Med. Hyg. 1997, 91, 647–652. [Google Scholar] [CrossRef]
  61. Sokhina, C.S.; Trape, J.-F.; Robert, V. Gametocytaemia in Senegalese Children with Uncomplicated Falciparum Malaria Treated with Chloroquine, Amodiaquine or Sulfadoxine + Pyrimethamine. Parasite 2001, 8, 243–250. [Google Scholar] [CrossRef]
  62. Nouaceur, Z. La reprise des pluies et la recrudescence des inondations en Afrique de l’Ouest sahélienne. Physio-Géo Géogr. Phys. Environ. 2020, 15, 89–109. [Google Scholar] [CrossRef]
  63. La Mousson Afrique Ouest. Available online: https://www.cnrs.fr/cw/dossiers/dosclim1/rechfran/4theme/cycledeleau/moussonAfOuest.html (accessed on 13 August 2023).
  64. Salack, S.; Giannini, A.; Diakhaté, M.; Gaye Amadou, T.; Muller, B. Oceanic Influence on the Sub-Seasonal to Interannual Timing and Frequency of Extreme Dry Spells over the West African Sahel. Clim. Dyn. 2014, 42, 189–201. [Google Scholar] [CrossRef]
  65. Balme, M.; Lebel, T.; Amani, A. Années Sèches et Années Humides Au Sahel: Quo Vadimus? Hydrol. Sci. J. 2006, 51, 254–271. [Google Scholar] [CrossRef]
  66. Ali, A.; Lebel, T. The Sahelian Standardized Rainfall Index Revisited. Int. J. Climatol. 2009, 29, 1705–1714. [Google Scholar] [CrossRef]
  67. Guichard, F.; Kergoat, L.; Hourdin, F.; Léauthaud, C.; Barbier, J.; Mougin, É.; Diarra, B. Chapter 1. Climate Warming Observed in the Sahel since 1950. In Rural Societies in the Face of Climatic and Environmental Changes in West Africa; Lalou, R., Oumarou, A., Sanni, M.A., Sultan, B., Arame Soumaré, M., Eds.; Synthèses; IRD Éditions: Marseille, France, 2020; pp. 23–41. ISBN 978-2-7099-2425-2. [Google Scholar]
  68. Isnard, H. Le mécanisme du climat de l’ouest africain. L’Inf. Géogr. 1952, 16, 98–100. [Google Scholar] [CrossRef]
  69. Deme, A.; Gaye, A.T.; Hourdin, F. Chapter 3. Climate Projections in West Africa: The Obvious and the Uncertain. In Rural Societies in the Face of Climatic and Environmental Changes in West Africa; Sultan, B., Lalou, R., Sanni, M.A., Oumarou, A., Arame Soumaré, M., Eds.; IRD Éditions: Marseille, France, 2017; pp. 61–86. ISBN 978-2-7099-2424-5. [Google Scholar]
  70. Lavaysse, C.; Flamant, C.; Janicot, S.; Parker, D.J.; Lafore, J.-P.; Sultan, B.; Pelon, J. Seasonal Evolution of the West African Heat Low: A Climatological Perspective. Clim. Dyn. 2009, 33, 313–330. [Google Scholar] [CrossRef]
  71. Gbobaniyi, E.; Sarr, A.; Sylla, M.B.; Diallo, I.; Lennard, C.; Dosio, A.; Dhiédiou, A.; Kamga, A.; Klutse, N.A.B.; Hewitson, B.; et al. Climatology, Annual Cycle and Interannual Variability of Precipitation and Temperature in CORDEX Simulations over West Africa. Int. J. Climatol. 2014, 34, 2241–2257. [Google Scholar] [CrossRef]
  72. Guichard, F.; Kergoat, L.; Hourdin, F.; Léauthaud, C.; Barbier, J.; Mougin, É.; Diarra, B. Chapitre 1. Le Réchauffement Climatique Observé Depuis 1950 au Sahel; IRD Éditions: Marseille, France, 2015; ISBN 978-2-7099-2147-3. [Google Scholar]
  73. Janicot, S.; Thorncroft, C.D.; Ali, A.; Asencio, N.; Berry, G.; Bock, O.; Bourles, B.; Caniaux, G.; Chauvin, F.; Deme, A.; et al. Large-Scale Overview of the Summer Monsoon over West Africa during the AMMA Field Experiment in 2006. Ann. Geophys. 2008, 26, 2569–2595. [Google Scholar] [CrossRef]
  74. Lavaysse, C.; Flamant, C.; Evan, A.; Janicot, S.; Gaetani, M. Recent Climatological Trend of the Saharan Heat Low and Its Impact on the West African Climate. Clim. Dyn. 2016, 47, 3479–3498. [Google Scholar] [CrossRef]
  75. Mouchet, J.; Manguin, S.; Sircoulon, J.; Laventure, S.; Faye, O.; Onapa, A.W.; Carnevale, P.; Julvez, J.; Fontenille, D. Evolution of Malaria in Africa for the Past 40 Years: Impact of Climatic and Human Factors. J. Am. Mosq. Control Assoc. 1998, 14, 121–130. [Google Scholar]
  76. Mafwele, B.J.; Lee, J.W. Relationships between Transmission of Malaria in Africa and Climate Factors. Sci. Rep. 2022, 12, 14392. [Google Scholar] [CrossRef]
  77. Diouf, I.; Rodriguez Fonseca, B.; Caminade, C.; Thiaw, W.M.; Deme, A.; Morse, A.P.; Ndione, J.-A.; Gaye, A.T.; Diaw, A.; Ndiaye, M.K.N. Climate Variability and Malaria over West Africa. Am. J. Trop. Med. Hyg. 2020, 102, 1037–1047. [Google Scholar] [CrossRef] [PubMed]
  78. Bousema, J.T.; Gouagna, L.C.; Drakeley, C.J.; Meutstege, A.M.; Okech, B.A.; Akim, I.N.J.; Beier, J.C.; Githure, J.I.; Sauerwein, R.W. Plasmodium falciparum Gametocyte Carriage in Asymptomatic Children in Western Kenya. Malar. J. 2004, 3, 18. [Google Scholar] [CrossRef] [PubMed]
  79. Afrane, Y.A.; Little, T.J.; Lawson, B.W.; Githeko, A.K.; Lo, E. Deforestation and Vectorial Capacity of Anopheles gambiae Giles Mosquitoes in Malaria Transmission, Kenya. Emerg. Infect. Dis. J. 2008, 14, 1533. [Google Scholar] [CrossRef] [PubMed]
  80. Craig, M.H.; Snow, R.W.; le Sueur, D. A Climate-Based Distribution Model of Malaria Transmission in Sub-Saharan Africa. Parasitol. Today 1999, 15, 105–111. [Google Scholar] [CrossRef] [PubMed]
  81. Carnevale, P.; Robert, V. Les Anophèles: Biologie, Transmission du Plasmodium et Lutte Antivectorielle; Carnevale, P., Robert, V., Eds.; IRD Éditions: Marseille, France, 2009; ISBN 978-2-7099-1662-2. [Google Scholar]
  82. Chaturvedi, S.; Dwivedi, S. Understanding the Effect of Climate Change in the Distribution and Intensity of Malaria Transmission over India Using a Dynamical Malaria Model. Int. J. Biometeorol. 2021, 65, 1161–1175. [Google Scholar] [CrossRef] [PubMed]
  83. Mbouna, A.D.; Tamoffo, A.T.; Asare, E.O.; Lenouo, A.; Tchawoua, C. Malaria Metrics Distribution under Global Warming: Assessment of the VECTRI Malaria Model over Cameroon. Int. J. Biometeorol. 2023, 67, 93–105. [Google Scholar] [CrossRef] [PubMed]
  84. Diouf, I.; Suárez-Moreno, R.; Rodríguez-Fonseca, B.; Caminade, C.; Wade, M.; Thiaw, W.M.; Deme, A.; Morse, A.P.; Ndione, J.-A.; Gaye, A.T.; et al. Oceanic Influence on Seasonal Malaria Incidence in West Africa. Weather Clim. Soc. 2022, 14, 287–302. [Google Scholar] [CrossRef]
  85. Bomblies, A.; Eltahir, E.A.B. Assessment of the Impact of Climate Shifts on Malaria Transmission in the Sahel. EcoHealth 2009, 6, 426–437. [Google Scholar] [CrossRef]
  86. Yamana, T.K.; Bomblies, A.; Eltahir, E.A.B. Climate Change Unlikely to Increase Malaria Burden in West Africa. Nat. Clim. Change 2016, 6, 1009–1013. [Google Scholar] [CrossRef]
  87. Caminade, C.; Jones, A.E. Malaria in a Warmer West Africa. Nat. Clim. Change 2016, 6, 984–985. [Google Scholar] [CrossRef]
  88. Hulme, M.; Mitchell, J.; Ingram, W.; Lowe, J.; Johns, T.; New, M.; Viner, D. Climate Change Scenarios for Global Impacts Studies. Glob. Environ. Change 1999, 9, S3–S19. [Google Scholar] [CrossRef]
  89. Hulme, M.; Doherty, R.; Ngara, T.; New, M.; Lister, D. African Climate Change: 1900–2100. Clim. Res. 2001, 17, 145–168. [Google Scholar] [CrossRef]
  90. Arab, A.; Jackson, M.C.; Kongoli, C. Modelling the Effects of Weather and Climate on Malaria Distributions in West Africa. Malar. J. 2014, 13, 126. [Google Scholar] [CrossRef]
  91. Shapiro, L.L.M.; Whitehead, S.A.; Thomas, M.B. Quantifying the Effects of Temperature on Mosquito and Parasite Traits That Determine the Transmission Potential of Human Malaria. PLoS Biol. 2017, 15, e2003489. [Google Scholar] [CrossRef]
  92. Abeku, T.A. Response to Malaria Epidemics in Africa. Emerg. Infect. Dis. 2007, 13, 681–686. [Google Scholar] [CrossRef]
  93. Rodríguez-Fonseca, B.; Mohino, E.; Mechoso, C.R.; Caminade, C.; Biasutti, M.; Gaetani, M.; Garcia-Serrano, J.; Vizy, E.K.; Cook, K.; Xue, Y.; et al. Variability and Predictability of West African Droughts: A Review on the Role of Sea Surface Temperature Anomalies. J. Clim. 2015, 28, 4034–4060. [Google Scholar] [CrossRef]
  94. Tanser, F.C.; Sharp, B.; le Sueur, D. Potential Effect of Climate Change on Malaria Transmission in Africa. Lancet 2003, 362, 1792–1798. [Google Scholar] [CrossRef]
  95. Martens, P.; Kovats, R.S.; Nijhof, S.; de Vries, P.; Livermore, M.T.J.; Bradley, D.J.; Cox, J.; McMichael, A.J. Climate Change and Future Populations at Risk of Malaria. Glob. Environ. Change 1999, 9, S89–S107. [Google Scholar] [CrossRef]
Figure 1. Location of the study area: West Africa (4° N–18° N and 20° W–15° E) delineated in red.
Microbiolres 14 00145 g001
Figure 2. Temporal variability of confirmed malaria cases and the EIR (entomological inoculation rate) in Senegal during the period of 2009–2014: (a) for the annual cycle and (b) for interannual variability.
Microbiolres 14 00145 g002
Figure 3. Intra-annual/interannual variations in the number of confirmed malaria cases and the EIR (in ib/p/m, i.e., infectious bites per person per month) in Senegal from 2009 to 2014. The simulations are based on the VECTRI model, driven by rainfall and temperature data. (a) Malaria-Obs, (b) BCC-CSM2-MR, (c) CanESM5, (d) CNRM-CM6-1, (e) CNRM-ESM2-1, (f) INM-CM4-8, (g) MIROC-ES2L, (h) MRI-ESM2-0, and (i) ENSMEAN-MOD.
Microbiolres 14 00145 g003
Figure 4. Spatial distribution of the EIR (ib/p/m, i.e., infectious bites per person per month) in Senegal from 2009 to 2014. The simulations were conducted using the VECTRI model, which was driven by rainfall and temperature data from the assessment period. The simulations include the following models: (a) Malaria-Obs, (b) BCC-CSM2-MR, (c) CanESM5, (d) CNRM-CM6-1, (e) CNRM-ESM2-1, (f) INM-CM4-8, (g) MIROC-ES2L, (h) MRI-ESM2-0, and (i) ENSMEAN-MOD.
Microbiolres 14 00145 g004
Figure 5. Annual cycle of rainfall from 1950 to 2014, using bias-corrected general circulation model (GCM) data: BCC-CSM2-MR, CanESM5, CNRM-CM6-1, CNRM-ESM2-1, INM-CM4-8, MIROC-ES2L, MRI-ESM2-0, and ENSMEAN-MOD.
Microbiolres 14 00145 g005
Figure 6. Hovmöller diagram of the rainfall for the period 1950–2014 using bias-corrected CMIP6 data: (a) BCC-CSM2-MR, (b) CanESM5, (c) CNRM-CM6-1, (d) CNRM-ESM2-1, (e) INM-CM4-8, (f) MIROC-ES2L, (g) MRI-ESM2-0, and (h) ENSMEAN-MOD.
Microbiolres 14 00145 g006
Figure 7. Intra-annual/interannual variability of rainfall for the period 1950–2014 utilizing bias-corrected CMIP6 data. The figure includes the following models: (a) BCC-CSM2-MR, (b) CanESM5, (c) CNRM-CM6-1, (d) CNRM-ESM2-1, (e) INM-CM4-8, (f) MIROC-ES2L, (g) MRI-ESM2-0, and (h) ENSMEAN-MOD.
Microbiolres 14 00145 g007
Figure 8. Spatial distribution of rainfall for the period 1950–2014 using bias-corrected CMIP6 data: (a) BCC-CSM2-MR, (b) CanESM5, (c) CNRM-CM6-1, (d) CNRM-ESM2-1, (e) INM-CM4-8, (f) MIROC-ES2L, (g) MRI-ESM2-0, and (h) ENSMEAN-MOD.
Microbiolres 14 00145 g008
Figure 9. Annual cycle of temperature for the period 1950–2014 using bias-Corrected GCM data: BCC-CSM2-MR, CanESM5, CNRM-CM6-1, CNRM-ESM2-1, INM-CM4-8, MIROC-ES2L, MRI-ESM2-0, and ENSMEAN-MOD.
Microbiolres 14 00145 g009
Figure 10. Hovmöller diagram of the temperature for the period 1950–2014 using bias-corrected CMIP6 data: (a) BCC-CSM2-MR, (b) CanESM5, (c) CNRM-CM6-1, (d) CNRM-ESM2-1, (e) INM-CM4-8, (f) MIROC-ES2L, (g) MRI-ESM2-0, and (h) ENSMEAN-MOD.
Microbiolres 14 00145 g010
Figure 11. Intra-annual/interannual variability of temperature for the period 1950–2014 using bias-corrected CMIP6 data: (a) BCC-CSM2-MR, (b) CanESM5, (c) CNRM-CM6-1, (d) CNRM-ESM2-1, (e) INM-CM4-8, (f) MIROC-ES2L, (g) MRI-ESM2-0, and (h) ENSMEAN-MOD.
Microbiolres 14 00145 g011
Figure 12. Spatial distribution of temperature for the period 1950–2014 using bias-corrected CMIP6 data: (a) BCC-CSM2-MR, (b) CanESM5, (c) CNRM-CM6-1, (d) CNRM-ESM2-1, (e) INM-CM4-8, (f) MIROC-ES2L, (g) MRI-ESM2-0, and (h) ENSMEAN-MOD.
Microbiolres 14 00145 g012
Figure 13. Annual cycle of the EIR (in ib/p/m, i.e., infectious bites per person per month) in Senegal from 1950 to 2014 (historical period). Simulations were conducted using the VECTRI model, with daily rainfall and daily temperature as inputs, from the bias-corrected CMIP6 data of the following models: BCC-CSM2-MR, CanESM5, CNRM-CM6-1, CNRM-ESM2-1, INM-CM4-8, MIROC-ES2L, MRI-ESM2-0, and ENSMEAN-MOD.
Microbiolres 14 00145 g013
Figure 14. Hovmöller diagram of the EIR (in ib/p/m, i.e., infectious bites per person per month) in West Africa from 1950 to 2014 (historical period): Simulations of the VECTRI model driven by rainfall and temperature from the bias-corrected CMIP6 data: (a) BCC-CSM2-MR, (b) CanESM5, (c) CNRM-CM6-1, (d) CNRM-ESM2-1, (e) INM-CM4-8, (f) MIROC-ES2L, (g) MRI-ESM2-0, and (h) ENSMEAN-MOD.
Microbiolres 14 00145 g014
Figure 15. Intra-annual/interannual variability of the EIR (in ib/p/m, i.e., infectious bites per person per month) of malaria in West Africa from 1950 to 2014 (historical period). Simulations were conducted using the VECTRI model, with daily rainfall and daily temperature as inputs from the bias-corrected CMIP6 data of the following models: (a) BCC-CSM2-MR, (b) CanESM5, (c) CNRM-CM6-1, (d) CNRM-ESM2-1, (e) INM-CM4-8, (f) MIROC-ES2L, (g) MRI-ESM2-0, and (h) ENSMEAN-MOD.
Microbiolres 14 00145 g015
Figure 16. Spatial distribution of the EIR (in ib/p/m, i.e., infectious bites per person per month) of malaria in West Africa from 1950 to 2014 (historical period). Simulations were conducted using the VECTRI model, with inputs of rainfall and temperature from the bias-corrected CMIP6 data of the following models: (a) BCC-CSM2-MR, (b) CanESM5, (c) CNRM-CM6-1, (d) CNRM-ESM2-1, (e) INM-CM4-8, (f) MIROC-ES2L, (g) MRI-ESM2-0, and (h) ENSMEAN-MOD.
Microbiolres 14 00145 g016
Figure 17. Hovmöller diagram of the EIR (in ib/p/m, i.e., infectious bites per person per month) in West Africa from 2015 to 2100. The simulations were conducted using the VECTRI model, which was driven by rainfall and temperature data from the bias-corrected CMIP6 dataset. The panels (a) to (h) represent the results for different climate models: (a) BCC-CSM2-MR, (b) CanESM5, (c) CNRM-CM6-1, (d) CNRM-ESM2-1, (e) INM-CM4-8, (f) MIROC-ES2L, (g) MRI-ESM2-0, and (h) ENSMEAN-MOD for the ssp585 scenario.
Microbiolres 14 00145 g017
Figure 18. Hovmöller diagram displaying the intra- and inter-annual variations in the EIR (in ib/p/m, i.e., infectious bites per person per month) of malaria in West Africa from 2015 to 2100. The simulations were conducted using the VECTRI model, which was driven by rainfall and temperature data from the bias-corrected CMIP6 dataset. Panels (ah) represent the results for different climate models: (a) BCC-CSM2-MR, (b) CanESM5, (c) CNRM-CM6-1, (d) CNRM-ESM2-1, (e) INM-CM4-8, (f) MIROC-ES2L, (g) MRI-ESM2-0, and (h) ENSMEAN-MOD for the ssp585 scenario.
Microbiolres 14 00145 g018
Figure 19. Spatial distribution of the EIR (in ib/p/m, i.e., infectious bites per person per month) of malaria in West Africa from 2015 to 2100. Simulations were conducted using the VECTRI model, with inputs of rainfall and temperature from the bias-corrected CMIP6 data of the following models: (a) BCC-CSM2-MR, (b) CanESM5, (c) CNRM-CM6-1, (d) CNRM-ESM2-1, (e) INM-CM4-8, (f) MIROC-ES2L, (g) MRI-ESM2-0, and (h) ENSMEAN-MOD for the ssp585 scenario.
Microbiolres 14 00145 g019
Table 1. Name and coordinates of West African countries.
CountryLatitudesLongitude
Benin 9.30° N2.31° E
Burkina Faso12.23° N1.56° W
Ivory Coast7.54° N5.54° W
Cape Verde15.12° N23.60° W
Gambia13.44° N15.31° W
Ghana 7.94° N1.02° W
Guinea9.94° N13.67° W
Guinea-Bissau11.80° N15.18° W
Liberia 6.42° N9.42° W
Mali17.57° N3.99° W
Mauritania20.93° N17.06° W
Niger17.60° N8.08° E
Nigeria9.08° N8.67° E
Senegal14.49° N14.45° W
Sierra Leon8.46° N11.77° W
Togo8.61° N0.82° E
Table 2. Name and coordinates of Senegal’s 14 regions.
RegionLatitudeLongitude
Dakar14.73° N17.50° W
Diourbel14.65° N16.23° W
Fatick14.21° N16.35° W
Kaffrine14.10° N15.55° W
Kaolack14.13° N16.07° W
Kedougou12.57° N12.22° W
Kolda12.88° N14.97° W
Louga15.62° N16.22° W
Matam15.63° N13.25° W
Sedhiou12.70° N15.55° W
Saint-Louis16.05° N16.45° W
Tambacounda13.77° N13.68° W
Thies14.80° N16.95° W
Ziguinchor12.55° N16.27° W
Table 3. List of the 7 global circulation models (GCMs) used in the study.
Seven CMIP6 Global Climate Models
Model NameModeling CenterApproximate Grid SpacingKey Reference
BCC-CSM2-MRBeijing Climate Center (China)1.125° × 1.125°[40]
CanESM5Canadian Centre for Climate Modelling and Analysis (Canada)2.81° × 2.81°[41]
CNRM-CM6-1Centre National de Recherches Météorologiques-Centre Européen de Recherches et de Formation Avancée en Calcul Scientifique (France)0.5° × 0.5°[42]
CNRM-ESM2-1Centre National de Recherches Météorologiques Earth system model (France)1° × 1°[43]
INM-CM4-8Institute of Numerical Mathematics, Russian Academy of Science, Moscow 119991 (Russia)2° × 1.5°[44]
MIROC-ES2LJapan Agency for Marine-Earth Science and Technology, Kanagawa 236-0001 (Japan)2.8° × 2.8°[45]
MRI-ESM2Meteorological Research Institute, Japan Meteorological Agency (Japan)1.125° × 1.125°[46]
Table 4. VECTRI default constants.
SymbolValueUnitsDescriptionReference
E + I 250 m m   day     1 Total evaporation and infiltration lossesbased on [52]
K L ,   Jepson 90.9K dayLarvae growth in degree days[53]
K gono   37.1K dayGonotrophic cycle in degree days[47]
K sporo 111 K daySporogonic cycle in degree days[47]
K w 1 m 1 Pond growth rate factor   set   by   tuning   or   local     knowledge   of   basin  
K m a r   1,0 0.45   Constant   of   Martens   I   vector   survival     scheme   [51]
K m a r   1,1 0.054 K 1   Constant   of   Martens   I   vector   survival     scheme   [51]
M L , m a x 300 m g m 2 Carrying capacity of water bodies[54]
P L ,   surv   0 0.825 Larvae base daily survival rate[55]
P v h 0.3   Probability   of   transmission   from     infective   vector   to   host   during   sin gle     bloodmeal   [55]
T wat   2 K Pond water offset from air temperature[56]
T L , m i n 16 K Minimum   T was   for larvae developmentbased on [3]
T L , m a x 38 K Maximum   T wat   for larvae developmentbased on [3]
T g o n o , m i n 7.7 K Minimum   T 2 m for egg development[47]
T sporo ,   m i n 16 K Minimum   T 2 m for sporogonic cycle[55]
τ z o 50 k m 2 Population density zoophilic factorset by tuning
w m a x 0.04   Maximum   temporary   pond   fraction   in     cell     set   by   tuning   or   local     knowledge   of   basin  
Table 5. VECTRI output parameters.
ParametersDefinitionUnity
populationpopulation densityN.m−2
rainrainfallmm day−1
temptemperature°C
water fracfraction of grid box covered by pond breeding sites%
vectormosquito densityN.m−2
larvaelarvae densityN.m−2
larvae biomasslarvae biomassMg.m−2
PRd% of population with detectable malaria (day 10+)
hbrhuman biting ratenumber of bites person−1 day−1
csprCircum sporozoite protein ratio (eir/hbr) fractionfraction
Eir entomological inoculation rate (number of infectious bites)number person−1 day−1
casesnumber of new casesfraction
immunityproportion of immune populationfraction
Disclaimer/Publisher’s Note: The statements, opinions and data contained in all publications are solely those of the individual author(s) and contributor(s) and not of MDPI and/or the editor(s). MDPI and/or the editor(s) disclaim responsibility for any injury to people or property resulting from any ideas, methods, instructions or products referred to in the content.

