Article

Serum Level of Ceruloplasmin, Angiotensin-Converting Enzyme and Transferrin as Markers of Severity in SARS-CoV-2 Infection in Patients with Type 2 Diabetes

by
Patricia-Andrada Reștea
1,
Ștefan Țigan
2,
Laura Grațiela Vicaș
3,*,
Luminița Fritea
4,*,
Eleonora Marian
3,
Tunde Jurca
3,
Annamaria Pallag
3,
Iulius Liviu Mureșan
5,
Corina Moisa
3,
Otilia Micle
4 and
Mariana Eugenia Mureșan
4
1
Doctoral School of Biomedical Science, Faculty of Medicine and Pharmacy, University of Oradea, 410087 Oradea, Romania
2
Department of Medical Informatics and Biostatistics “Iuliu Hațieganu”, University of Medicine and Pharmacy, 400012 Cluj-Napoca, Romania
3
Department of Pharmacy, Faculty of Medicine and Pharmacy, University of Oradea, 410087 Oradea, Romania
4
Department of Preclinical Discipline, Faculty of Medicine and Pharmacy, University of Oradea, 410087 Oradea, Romania
5
Independent Researcher, 410258 Oradea, Romania
*
Authors to whom correspondence should be addressed.
Microbiol. Res. 2023, 14(4), 1670-1686; https://doi.org/10.3390/microbiolres14040115
Submission received: 9 August 2023 / Revised: 19 September 2023 / Accepted: 13 October 2023 / Published: 16 October 2023

Abstract

:
The aim of this study was to analyze other possible new markers of severity, at hospital admission, that can be assessed in patients with type 2 diabetes and a SARS-CoV-2 (severe acute respiratory syndrome coronavirus 2) infection. Our study included 90 subjects: 45 patients with type 2 diabetes mellitus infected with the SARS-CoV-2 virus, and 45 healthy persons as controls. The serum level of ceruloplasmin at hospital admission was statistically significant and directly correlated with the severity of COVID-19 (coronavirus disease) (p = 0.037) and with the serum level of IL-6 (interleukin 6) (p = 0.0001). Ceruloplasmin was statistically significant and inversely correlated with the serum iron level (p = 0.0001). However, we observed that ACE (angiotensin-converting enzyme) decreased in severe forms of SARS-CoV-2 infections in patients with type 2 diabetes (p = 0.001). Moreover, the decrease in ACE levels was correlated with an increase in IL-6 levels in these patients (p = 0.001). IL-6 increases were statistically significant and inversely correlated with serum iron, transferrin, and ACE levels. There was a noticed decreasing tendency of the transferrin depending on the severity of the COVID-19 infection (p = 0.0001). In addition to the known severity factors in the context of infection with the new coronavirus, increased concentrations of ceruloplasmin and decreased concentrations of ACE and transferrin may represent new markers of COVID-19 severity in patients with type 2 diabetes. These parameters, if analyzed upon admission to the hospital, could better inform health professionals about the evolution towards more severe forms of SARS-CoV-2 infections.

1. Introduction

In a SARS-CoV-2 virus infection, there are certain parameters, presented in the specialized literature, which can be used as markers of severity in infected patients [1]. Since the beginning of the COVID-19 pandemic, advanced age has been established among the risk factors, as well as the association of certain comorbidities, including type 2 diabetes [2,3,4,5,6,7]. Other severity parameters in the infection with the new coronavirus included the following: increased levels of pro-inflammatory cytokines such as IL-6, high ferritin levels, increased D-dimers, increased CRP (C reactive protein), and decreased numbers of lymphocytes [8,9,10,11,12,13,14,15,16,17]. In COVID-19, IL-6 is an important member of the cytokine network and it is one of the primary inflammatory agents that causes an inflammatory storm. Biomarkers which are related to inflammation and infection such as CRP and procalcitonin are induced by IL-6; in this way, IL-6 can be used as a biomarker of disease severity and prognosis [12]. In addition to increased ferritin, regarding iron metabolism in COVID-19, decreased serum iron was associated with the severity of infection [18,19,20]. The link between decreased transferrin, high ferritin levels, and increased CRP was associated with a proinflammatory status and progression to severe forms of the disease [21,22,23]. The study of ceruloplasmin in SARS-CoV-2 virus infections is a topic of interest because there are studies that describe the fact that ceruloplasmin can act in healthy people both as antioxidant and as pro-oxidant [24,25,26]. Ceruloplasmin is a glycoprotein synthesized in the liver and has six copper atoms in its composition, with a particularly important role in iron metabolism, oxidizing ferrous iron to ferric iron, the ferric iron form being the only one that can be bound to transferrin [27,28]. It is known that ceruloplasmin can also act as an acute phase reactant, and ceruloplasmin levels are increased in inflammation, being an independent risk factor for complications associated with diabetes mellitus [29,30]. Most of the copper in the body, 90%, is bound to ceruloplasmin and 10% is bound to albumin [31]. Type 2 diabetes is a metabolic condition characterized by a chronic inflammatory state in which serum ceruloplasmin is elevated, but ceruloplasmin is not correlated with diabetes severity [32,33,34,35]. In type 2 diabetes, insulin resistance occurs due to endothelial dysfunction, which is associated with increased ROS (reactive oxygen species) production [36,37,38]. The imbalance between ROS and antioxidants is represented by oxidative stress, one of the most important factors in the pathogenesis of type 2 diabetes [39,40]. Oxidative stress affects pancreatic beta-cell function and induces apoptosis [41,42,43]. Iron excess is toxic and acts as pro-oxidant, and its accumulation causes inflammation of pancreatic beta cells and is a risk factor for diabetes development and evolution, and a risk of mortality [44,45,46]. Iron homeostasis is regulated by hepcidin and ferroportin, which modulates the flux of iron into the systemic circulation [47,48,49]. Iron deposits are mainly represented by ferritin, which can also plays a role as an acute phase reactant, and high ferritin levels are significantly associated with the severity and unfavorable prognosis in a COVID-19 infection [50,51]. Decreased transferrin levels were strongly associated with severe forms of a SARS-CoV-2 infection, with transferrin representing the transport of circulating iron [52].
The aim of this study was to identify other possible biomarkers of severity in SARS-CoV-2 virus infections at hospital admission in patients with type 2 diabetes as an associated comorbidity.

2. Material and Methods

2.1. Study Design

The study included 90 subjects who were divided into groups of 45 patients that were hospitalized at the clinical hospital “Gavril Curteanu” Oradea between 21 October 2021 and 31 December 2021, and were randomly selected, having as the main inclusion criteria a positive RT-PCR (reverse transcription polymerase chain reaction) rapid antigen test for viral infection and the diagnosis of type 2 diabetes. The control group of 45 healthy persons was randomly chosen, with a negative RT-PCR/rapid antigen test as the inclusion criterion and who were not known to have diabetes or other associated pathologies. The present study was conducted in accordance with the Declaration of Helsinki. Before taking part in this study, each participant gave written informed consent for inclusion. The study protocol was approved by the Ethics Committee of the Clinical Hospital “Gavril Curteanu” Oradea (No. 32652/16.11.2020) and by the Ethics Committee of the University of Oradea (No. 5/A, 21.09.2020).
The inclusion criteria in the group of patients were the diagnosis of type 2 diabetes and SARS-CoV-2 virus infection confirmed by positive RT-PCR/rapid antigen test. Exclusion criteria from the group of patients included absence of type 2 diabetes and absence of infection with the SARS-CoV-2 virus by negative RT-PCR/rapid antigen test. Inclusion criteria in the control group were healthy individuals, absence of any diseases or medication, including absence of type 2 diabetes and negative RT-PCR/rapid antigen test.

2.2. Data Collection

The data were collected in an EXCEL file including the following biomedical parameters at hospital admission: iron biomarkers (ceruloplasmin, serum iron, and transferrin), anthropometric parameters—age (years), angiotensin-converting enzyme (ACE), interleukin 6 (IL-6), and COVID-19 severity on computer tomography at hospital admission (mild, moderate, or severe forms of SARS-CoV-2 viral infection). In the group of patients with type 2 diabetes mellitus and a SARS-CoV-2 virus infection, we also evaluated the relationship between certain parameters of iron metabolism (including serum iron, transferrin, ceruloplasmin, hemoglobin, number of erythrocytes, and ferritin), coagulation parameters (INR—international normalized ratio, platelets number), inflammation parameters (CRP, fibrinogen, LDH—lactate dehydrogenase, and lymphocytes number) and HBA1C level at admission was increased more than 6.6% in all patients with diabetes. We analyzed the regression models that reflected the connection and influence of independent parameters such as coagulation and inflammation on serum iron levels at hospital admission. We also evaluated if the gender of the subjects influenced the level of the biomedical parameters considered in our study.

2.3. Methods

Ceruloplasmin determination was performed by using the nephelometric method (reagent N Antiserum to Human Ceruloplasmin, ref. 10446451, BN ProSpec analyzer, Siemens Healthineers, Erlangen, Germany). Spectrophotometric method was employed for serum iron measurement (Iron_2 reagent, ref. 10377510, Advia 1800 analyzer, Siemens Healthineers). Transferrin was determined by using the nephelometric method (reagent N Antiserum to Human Transferrin, ref. 10446309, BN ProSpec analyzer, Siemens Healthineers). The ACE biomarker was determined by the spectrophotometric method (angiotensin-converting enzyme (ACE) reagent, ref. 12796, analyzer A15, BioSystems SA, Barcelona, Spain). Interleukin 6 was quantified by the electrochemiluminescence method (ECLIA—electrochemiluminescence immunoassay) (IL-6 reagent, ref. 05109442190, Cobas E4111 analyzer, Roche Diagnostics GmbH, Mannheim, Germany). All these biomarkers were analyzed from blood samples collected at the time of hospital admission.

2.4. Statistical Analysis

In the statistical processing of the data, both descriptive statistics procedures were used to calculate averages, standard deviations (for quantitative data), frequencies (for qualitative data), correlation coefficients, graphic representations of the data, as well as statistical analysis procedures. To process the data statistically, we used nonparametric chi-square and descriptive methods and the figures. The threshold of statistical significance of the tests used in the statistical analyses was the one usually applied in medical research p = 0.05 (=5%). The significance threshold p = 0.01 was also used for the case when the result of the analysis was strongly significant (p < 0.01). To perform the statistical calculations, the EXCEL data file which contained the study data, was converted into an SPSS file, the statistical processing was performed with the statistical software SPSS version 20.

3. Results

In the comparative analysis between infected patients and healthy persons, we denoted group 1 as the group of patients with type 2 diabetes mellitus and a SARS-CoV-2 virus infection, and group 2 as the control group of healthy subjects. In group 1, there were 5 mild, 13 moderate, and 27 severe forms of SARS-CoV-2 viral infection on CT (computer tomography) at hospital admission.
We identified a significant statistical difference between the means of the quantitative parameters in the group of infected patients compared to the group of healthy subjects. The means of IL-6 and ceruloplasmin parameters in patients infected with the SARS-CoV-2 virus were statistically significantly higher than in the control group. Regarding the parameters, such as serum iron, ACE, and transferrin, the means for patients infected with the novel coronavirus were statistically significantly lower than in healthy subjects (Table 1).
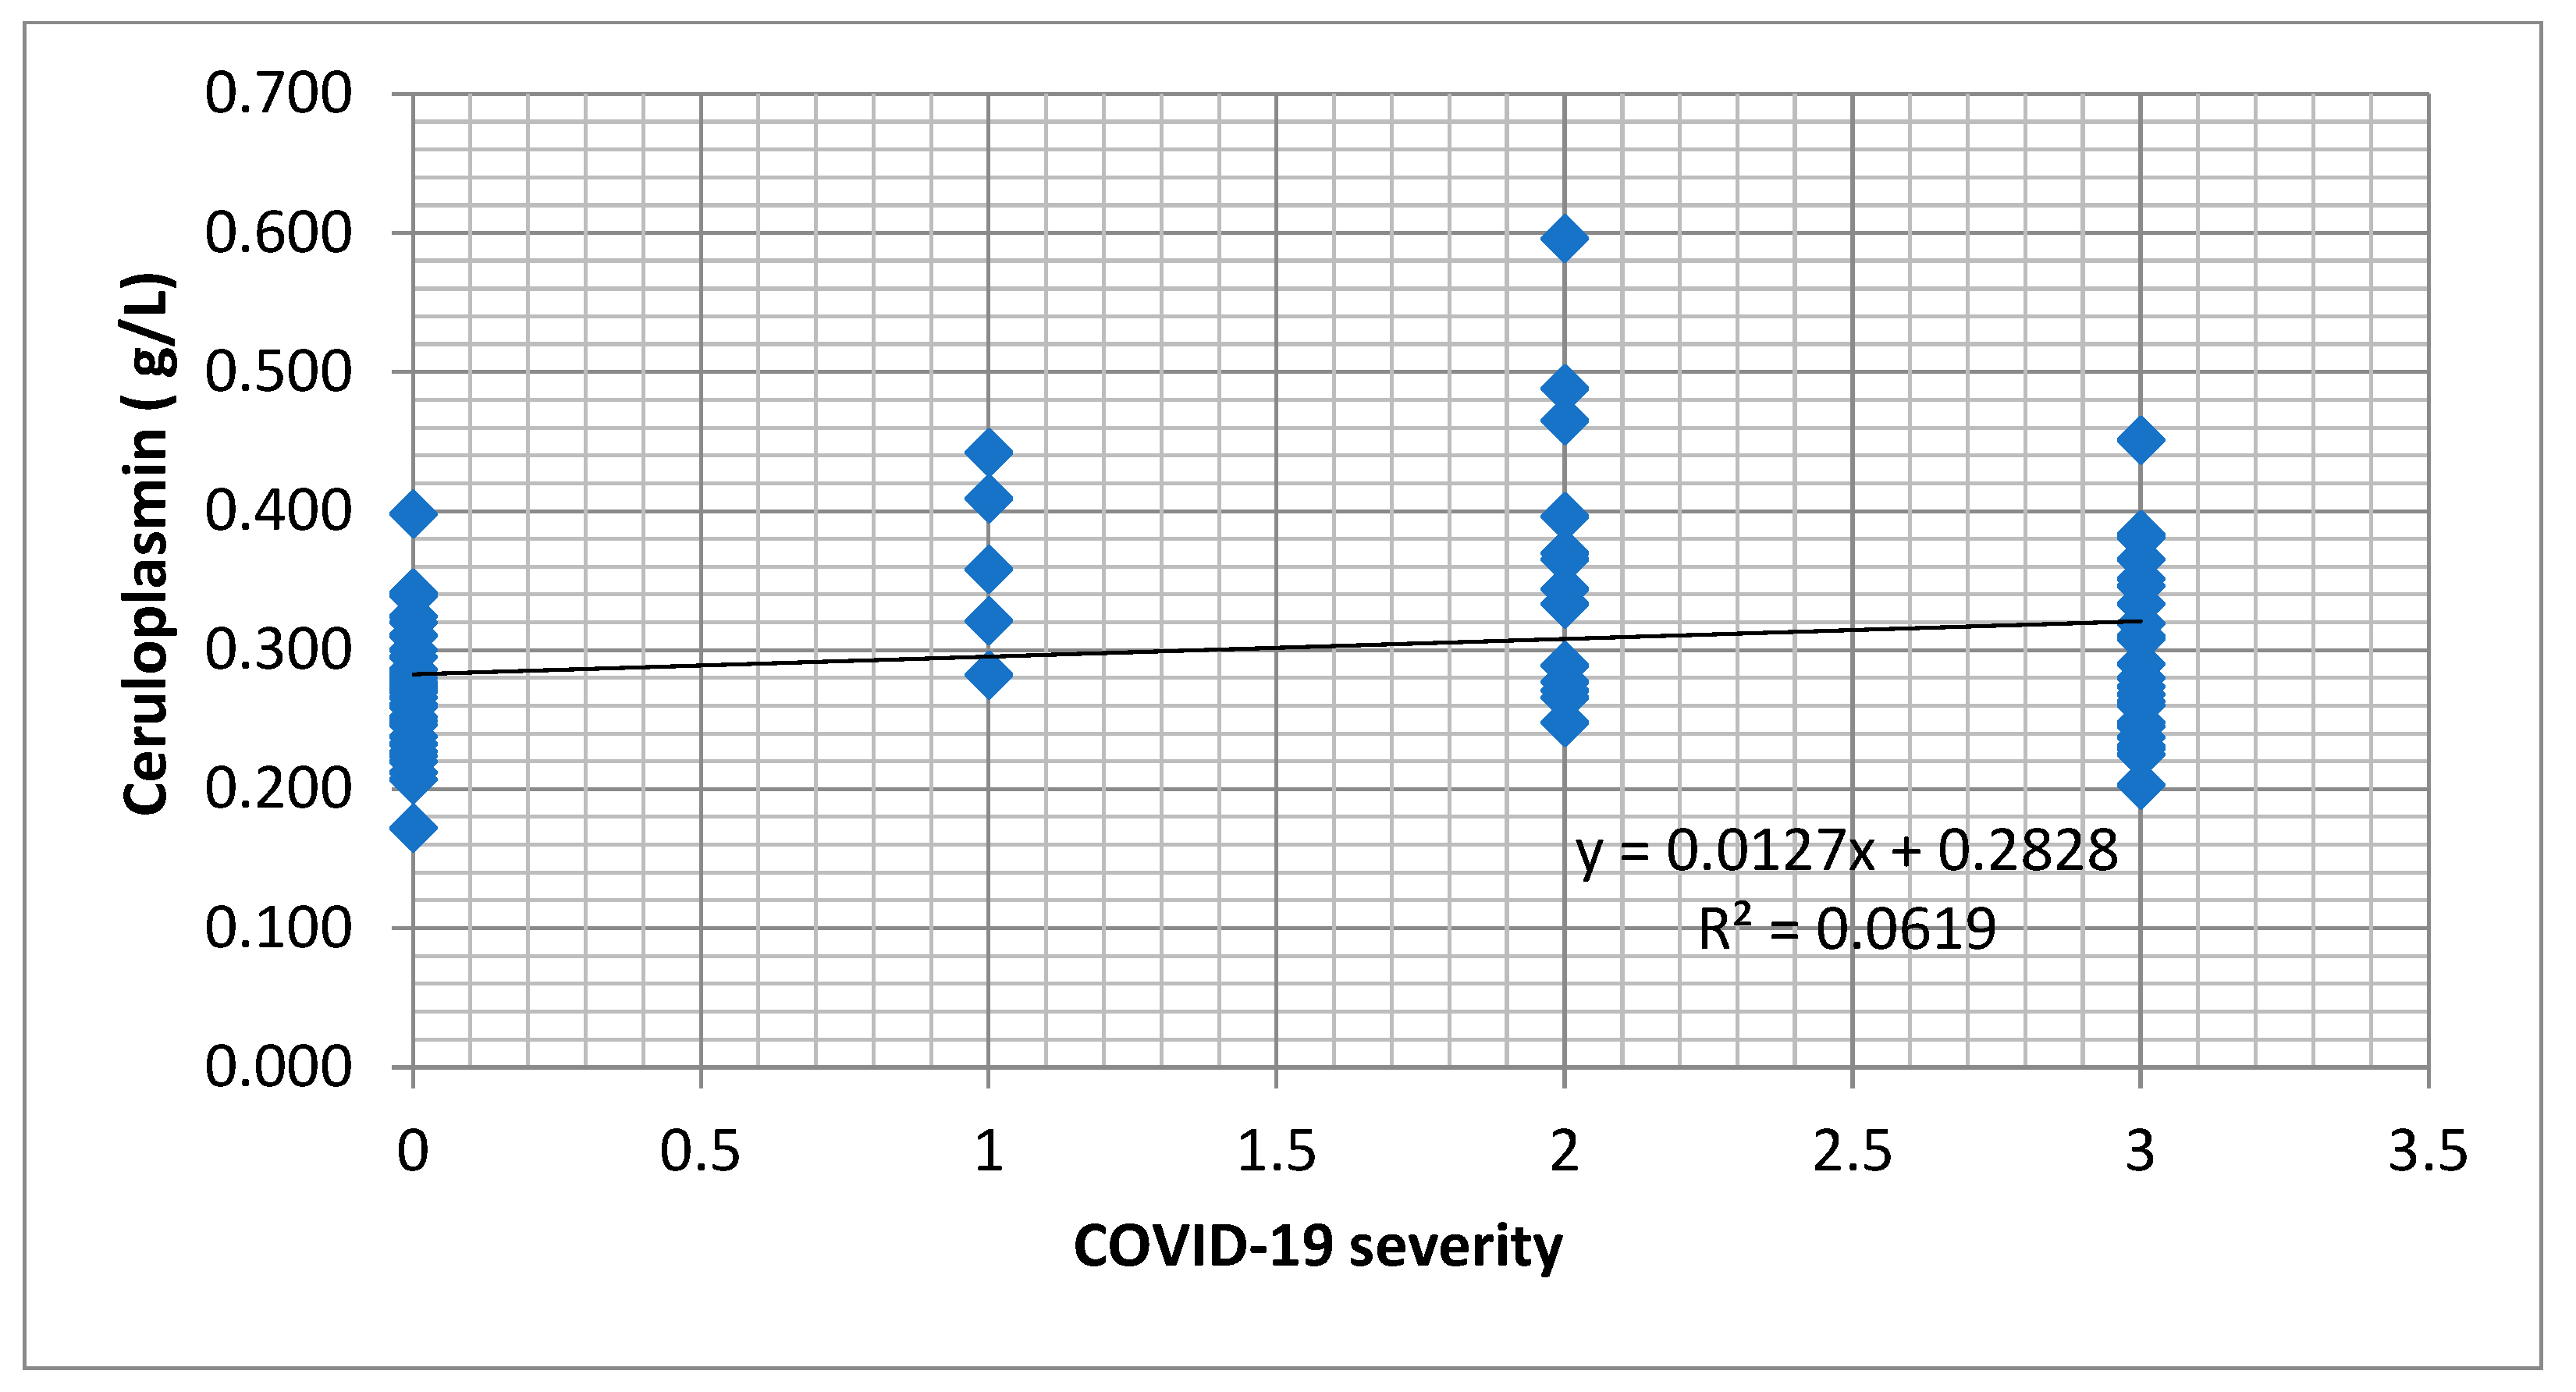
The serum ceruloplasmin was statistically significant and directly correlated with the severity of the SARS-CoV-2 infection, and also with IL-6, but inversely correlated with serum iron levels. However, ceruloplasmin did not statistically significantly correlate with transferrin, ACE, or age (Table 2). We identified an increasing tendency of the ceruloplasmin concentration depending on the level of infection with COVID-19 (Figure 1).
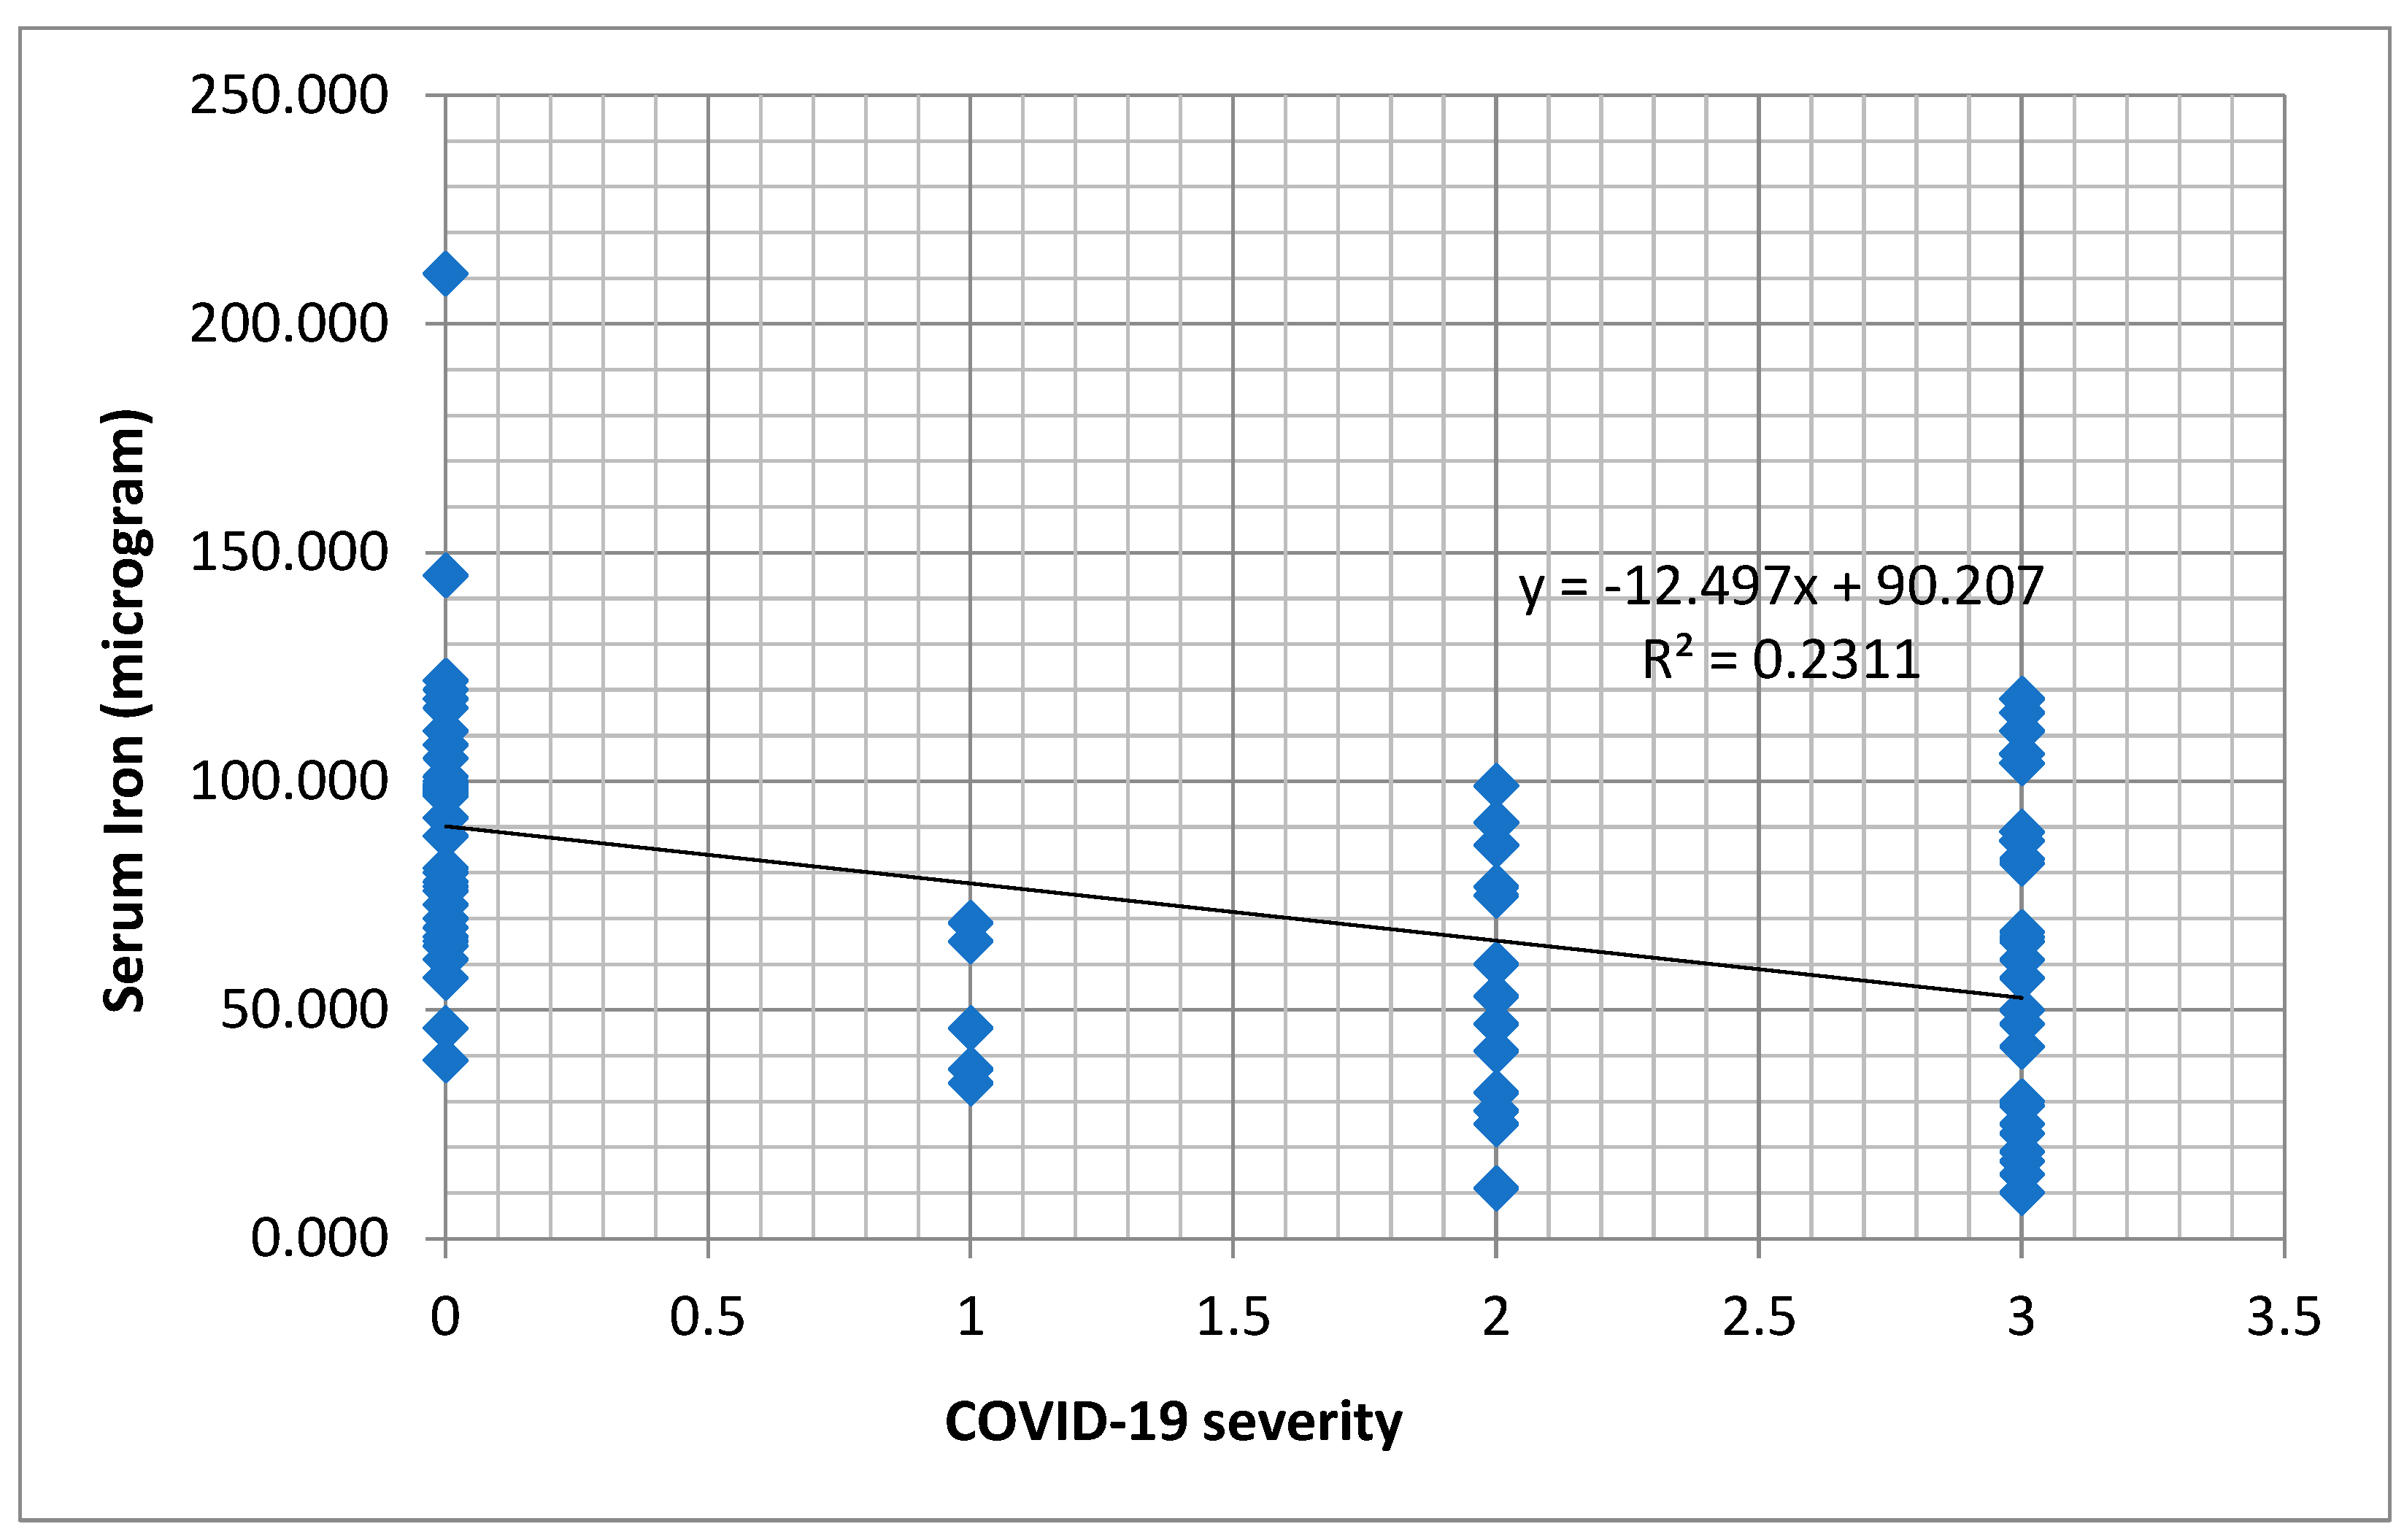
In the case of serum iron level, this parameter correlated strongly and significantly (p < 0.001) and inversely with the severity of COVID-19, ceruloplasmin, age, and IL-6 (Table 3). A decreasing tendency of serum iron values was observed in dependence with the severity of the COVID-19 infection (Figure 2).
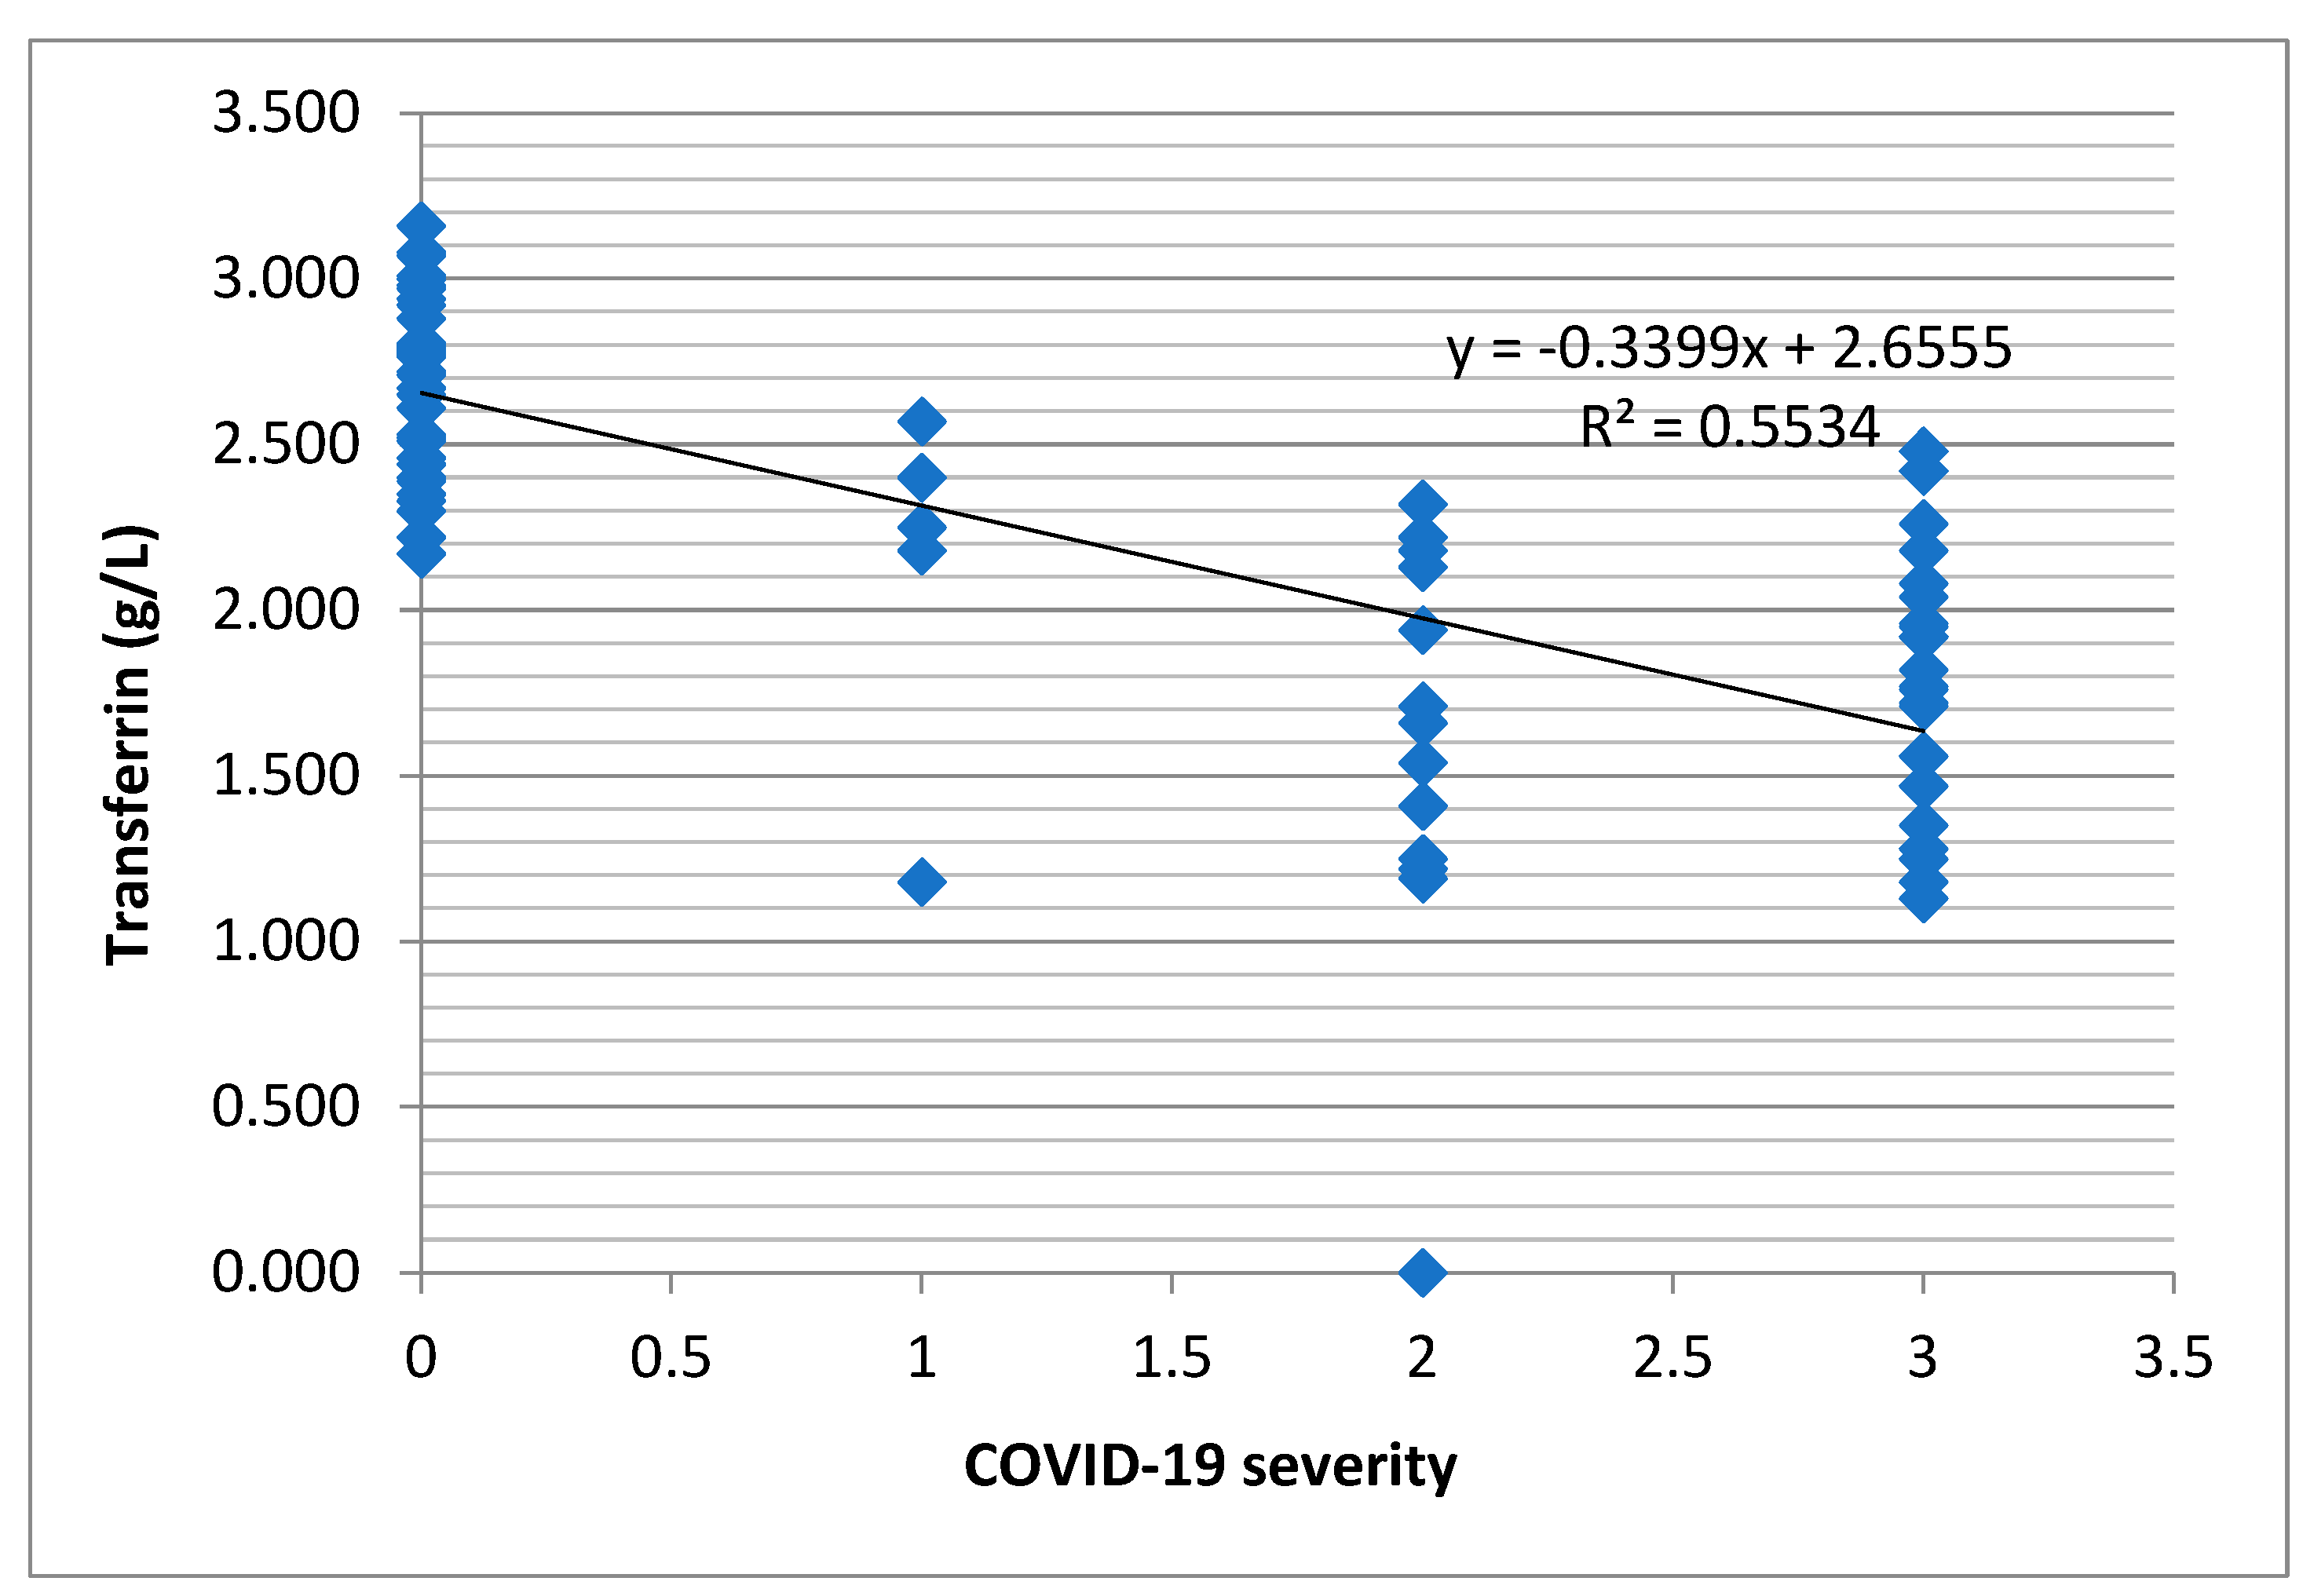
A strong and statistically significant but inverse correlation with the severity of COVID-19, IL-6, and age was observed in this study (p = 0.001). Transferrin did not correlate significantly with serum ceruloplasmin (Table 4). However, there was a decreasing tendency of the transferrin level depending on the severity of the COVID-19 infection (Figure 3).
Age was strongly significant and directly correlated with IL-6. However, age correlated strongly and significantly but inversely with ACE, transferrin, and serum iron (Table 5).
The ACE concentration was strongly correlated and statistically significant (p = 0.001), but inversely correlated with the severity of COVID-19, age, and IL-6 (Table 6).
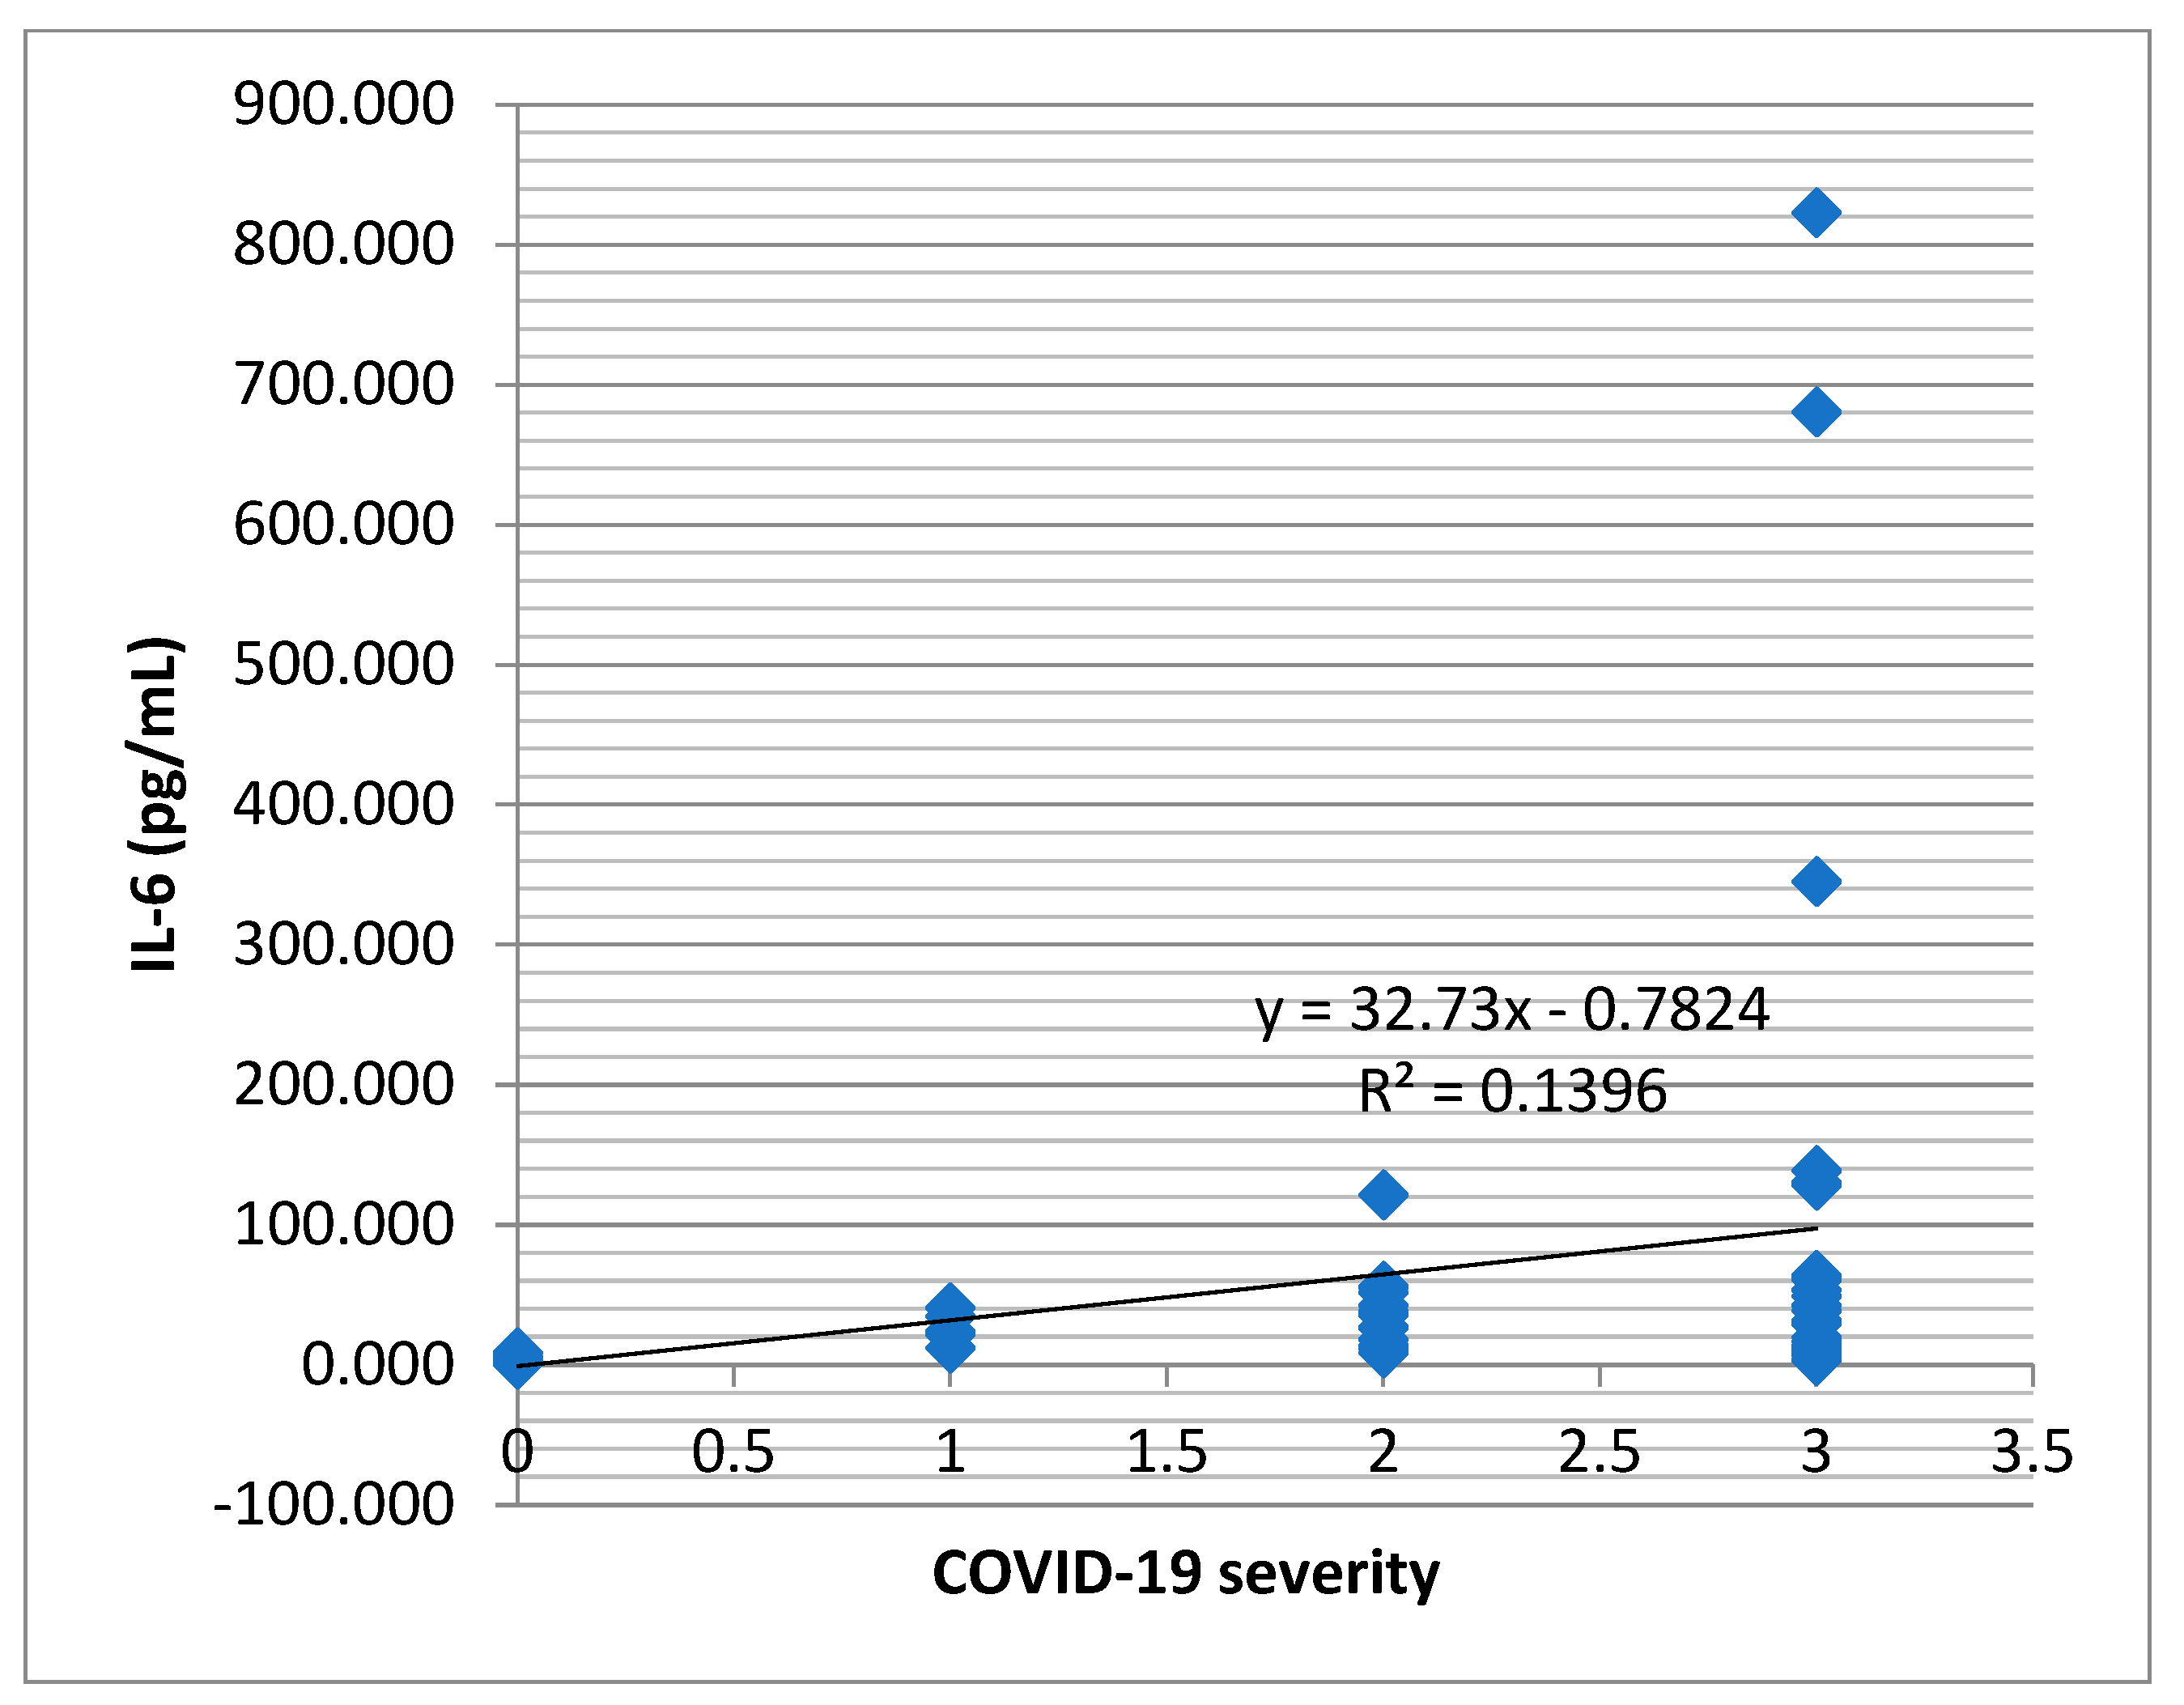
IL-6 correlated non-parametrically (Spearman) but was strongly statistically significant and directly correlated with the severity of the COVID-19 infection, age, and ceruloplasmin (p < 0.001). An inverse correlation was noticed between IL-6 and transferrin, and ACE and serum iron. (Table 7). An increasing tendency of the IL-6 concentration was observed to be dependent on the severity of the COVID-19 infection (Figure 4).
The severity of COVID-19 correlated statistically significantly with all quantitative parameters of the study. Good (|Ro| > 0.5), very good (|Ro| > 0.75), and strongly statistically significant correlations were established between the COVID-19 severity and IL-6, age, and transferrin levels. In addition, the severity of COVID-19 correlated directly (Ro > 0) with IL-6, age, and ceruloplasmin levels. Inverse correlation (Ro < 0) appeared between the COVID-19 severity and serum iron, ACE, and transferrin levels (Table 8).
Within the group of the diabetic patients with SARS-CoV-2 virus infections, we evaluated possible correlations between the serum level of CRP, LDH, D-dimers, number of lymphocytes, INR, ceruloplasmin, and the COVID-19 severity. Moreover, the severity of COVID-19 correlated strongly and significantly (p < 0.01) with D-dimers and lymphocyte numbers (Table 9).
For the patients with COVID-19, we observed that IL-6 correlated non-parametrically (Spearman) and significantly (p < 0.05) with the numbers of neutrophils, platelets, and serum iron levels. Neutrophils, platelets, and serum iron showed a significant decreasing tendency when IL-6 increases (Spearman correlation coefficient Ro < 0). IL-6 correlated strongly and significantly (p < 0.01) with CRP (Table 10).
Serum iron, ACE, ceruloplasmin, and transferrin did not differ statistically or significantly for the female gender compared to the male gender (p > 0.05) (Table 11). In addition, ferritin, hemoglobin, RBC (red blood cell), glycemia, CRP, LDH, and fibrinogen did not differ statistically or significantly for the female gender compared to the male gender (p > 0.05) (Table 12).
The multiple linear regression model between serum iron (as the dependent parameter) and ceruloplasmin, hemoglobin, RBC, platelets number, and fibrinogen (as the independent parameters) can be expressed by the following equation:
(serum iron) = −164.297 × (ceruloplasmin) + 15.281 × (hemoglobin) − 26.98 × RBC + 0.186 × (platelets number) − 0.186 × (fibrinogen)
The multiple correlation coefficient (R = 0.942, Rsquare = 0.871) in this model was strongly and statistically significant (p < 0.001), indicating that the serum iron variation was due in a proportion of 87.1% to predictor parameters such as ceruloplasmin, hemoglobin, RBC, and platelets number. Therefore, this regression model gave a good enough estimation of serum iron parameters (Table 13 and Table 14).

4. Discussions

During the pandemic, certain markers of poor prognoses and increased mortality were identified in patients infected with the SARS-CoV-2 virus [53,54,55,56]. Among the first common markers of severity recognized in COVID-19 infection were advancing age, presence of metabolic and cardiovascular comorbidities, increased ferritin, and high levels of pro-inflammatory cytokines, especially increased IL-6 [57,58]. In the studies of patients with newly diagnosed type 2 diabetes and SARS-CoV-2, high ferritin levels, increased CRP, and decreased lymphocyte count were more evident than in patients without comorbidity (without type 2 diabetes) [59,60,61]. In a recent article, it was stated that associations between significantly elevated levels of serum ferritin, D-dimers, and CRP in patients with COVID-19 requiring transfers to intensive care units have been reported in the literature [62,63].
In other studies, the link between high ferritin levels, decreased serum transferrin, and increased CRP levels in the pro-inflammatory state from the COVID-19 infection was presented [64,65]. In our study, the severity of COVID-19 was correlated strongly and significantly (p < 0.01) with D-dimers and lymphocytes number.
In this research, ferritin, hemoglobin, RBC (red blood cell), glycemia, CRP, LDH, and fibrinogen did not differ statistically or significantly for the female gender compared to the male gender. In addition, serum iron, ACE, ceruloplasmin, and transferrin did not differ statistically or significantly for the female gender compared to the male gender.
There are studies about decreased serum transferrin and decreased transferrin saturation, but also increased hepcidin levels were associated with severe forms of COVID-19 infections [66,67,68]. High levels of ferritin, as an acute phase reactant, have been reported in many studies as a negative prognostic marker [69]. There are theories proposed for transferrin levels as a possible central element of pathogenicity in SARS-CoV-2 infections [70].
The mechanism of action of serum iron in patients with COVID-19 is not fully elucidated; in the literature, it has been assumed that a decrease in serum iron may be associated with an increase in hepcidin level and with high ferritin levels [71]. Concerning iron metabolism, there are certain studies demonstrating the decrease in serum iron as a marker associated with the increased risk of mortality due to SARS-CoV-2 infections [72,73]. Decreased serum iron has been shown to be a predictor of severe forms of COVID-19 infections [74,75,76].
In the present study, we evaluated other new possible markers of COVID-19 severity at hospital admission and their associations by comparing serum levels of ceruloplasmin, IL-6, serum iron, transferrin, and ACE in 45 healthy control subjects versus 45 type-2 diabetic patients infected with the SARS-CoV-2 virus, all randomly chosen.
We identified that serum ceruloplasmin increased in severe forms of the infection, being a possible new marker of COVID-19 severity. We also found that there was a strong connection between increased serum ceruloplasmin and increased IL-6 levels. Thus, a possible explanation could be the fact that the increased level of ceruloplasmin could also signal a possible negative evolution, with cytokine storms in these patients, through the correlation with the high level of IL-6. Increased IL-6 level in patients with COVID-19 has been associated in other studies with the cytokine storm, with increased levels of pro-inflammatory cytokines such as IL-6, IL-7, IL-10, and IL-1B being present in patients with severe forms and with a negative impact on the endothelial function [77,78,79,80]. In our research, increased IL-6 was statistically significant and correlated with decreased serum iron, decreased serum ACE, and decreased transferrin. Julian Hackler et al. presented a possible connection between survival in COVID-19 infections, elevated serum copper levels, and a slight ceruloplasmin increase tendency [81].
Analysis of serum iron in our study revealed a statistically significant correlation between decreased serum iron and the severity of the SARS-CoV-2 infection. We also found that the decrease in serum iron was correlated with the increase in serum ceruloplasmin, IL-6 level, and age. IL-6 is involved in the production of hepcidin, which is a peptide hormone that ensures iron homeostasis [82]. Marco Ciotti et al. presented the association between hepcidin values and the transfer to intensive care in patients infected with the SARS-CoV-2 virus, but they did not identify significant differences in serum iron levels between survivors and deceased [68].
For the patients included in our study, we observed that the decrease in the serum level of ACE was significantly correlated with severe forms of infection and with the increase in IL-6, so the low level of ACE could represent a new possible marker of severity in patients with COVID-19. We have not identified in the literature reliable data related to the role of ACE in patients with COVID-19 or in patients with type-2 diabetes and a SARS-CoV-2 virus infection, although the role of ACE 2 (angiotensin-converting enzyme 2) in the infection with the new coronavirus has been intensively studied and presented [83,84,85]. ACE is produced by kidneys and lungs, present in vascular structures, a component of the renin-angiotensin-aldosterone system together with ACE2, and is important in cardiovascular and renal homeostasis. ACE and ACE2 are metallopeptidases, glycoproteins that metabolize circulating peptides, but ACE and ACE2 are functionally different. ACE mainly acts as a carboxypeptidase, converting angiotensin I into angiotensin II, by removing the terminal dipeptide C; also, through ACE, angiotensin 1-9 can be converted to angiotensin 1-7. ACE2 has an enzymatic role by regulating the renin-angiotensin-aldosterone system, but also the kinin-kallikrein system; ACE2 also has a non-enzymatic function representing the entry receptor of the SARS-CoV-2 virus into the human body. The serum level of ACE did not correlate statistically or significantly with the level of serum ceruloplasmin for the patients included in this study [86,87].
By analyzing new possible negative prognostic markers at hospital admission, and their association with the others severity markers in the infection with the new coronavirus, we identified a significant statistical correlation between ceruloplasmin (part of iron metabolism), severe forms of COVID-19, and the number of lymphocytes. Lymphopenia, as evidence of immune suppression and a marker of severity in COVID-19 infections, was identified in the patients from our study.
Other studies have shown the connection between the decrease in serum iron, hemoglobin, and hypoxia in patients with COVID-19, but also the connection between high ferritin levels and the stimulation of the expression of pro-inflammatory cytokines by macrophages including IL-6 [88].
One of the findings of our study was the tendency for decreased numbers of platelets (as coagulation parameters), neutrophils count, and an association with increased IL-6 cytokine levels. On the other hand, the level of IL-6 was directly influenced by the increase in CRP level at hospitalization.
Data from the literature regarding patients with diabetes and COVID-19 infections also mentioned that the predictors of mortality such as lymphopenia, ferritinemia, and increased CRP and D-dimers were more evident than in nondiabetic patients [89,90,91].
In other studies, troponin levels were an independent predictor of severity and mortality in patients with SARS-CoV-2 infections [92,93].
Another important finding from our study was that ceruloplasmin and transferrin (as parameters of iron metabolism) at admission and their connection with ACE could show the evolution in the direction of severe forms of COVID-19.
In this research, the regression model for serum iron and ceruloplasmin parameters was also analyzed and it was observed that serum ceruloplasmin, hemoglobin, erythrocytes, and platelets count strongly and significantly influenced serum iron in patients with the SARS-CoV-2 virus at hospital admission.
The limitations of this study include the following: quite low number of patients, single-center study, and parameters evaluated at hospital admission. Future studies on much larger groups and with other pro-inflammatory cytokine are needed.

5. Conclusions

Regarding the severe forms of SARS-CoV-2 virus infections, we identified a direct relationship between COVID-19 severity and the level of ceruloplasmin, and also a direct relationship between infection severity and IL-6 levels as a pro-inflammatory cytokine. Moreover, COVID-19 severity can be influenced by decreased iron deposits, decreased transferrin levels, and decreased ACE levels.
Thus, in patients with type-2 diabetes and a viral infection of the new coronavirus, other possible markers independent of COVID-19 severity such as serum ceruloplasmin, ACE levels, and transferrin levels can be determined at hospital admission. These possible new severity markers may serve to complement all other severity markers already established in COVID-19 infection in patients with type 2 diabetes.

Author Contributions

Conceptualization, P.-A.R.; data collection, P.-A.R., C.M. and I.L.M.; methodology, P.-A.R. and O.M.; software, Ș.Ț. and P.-A.R.; study design, P.-A.R. and A.P.; writing the manuscript, P.-A.R. and L.F.; resources, P.-A.R. and M.E.M.; validation, L.G.V. and T.J.; review and supervision, E.M. and M.E.M. All authors have read and agreed to the published version of the manuscript.

Funding

The research has been funded by the University of Oradea, within the Grants Competition “Scientific Research of Excellence Related to Priority Areas with Capitalization through Technology Transfer INO-TRANSFER-UO”, Project No. 324/2021.

Institutional Review Board Statement

The study was carried out in accordance with the Declaration of Helsinki, and the protocol was approved by the Ethics Committee of the University of Oradea, no. 5/A, 21 September 2020.

Informed Consent Statement

Informed consent was obtained from all subjects involved in the study.

Data Availability Statement

Not applicable.

Conflicts of Interest

The authors declare no conflict of interest.

References

  1. Romero Starke, K.; Petereit-Haack, G.; Schubert, M.; Kämpf, D.; Schliebner, A.; Hegewald, J.; Seidler, A. The Age-Related Risk of Severe Outcomes Due to COVID-19 Infection: A Rapid Review, Meta-Analysis, and Meta-Regression. Int. J. Environ. Res. Public Health 2020, 17, 5974. [Google Scholar] [CrossRef] [PubMed]
  2. Kaeuffer, C.; Le Hyaric, C.; Fabacher, T.; Mootien, J.; Dervieux, B.; Ruch, Y.; Hugerot, A.; Zhu, Y.J.; Pointurier, V.; Clere-Jehl, R.; et al. Clinical characteristics and risk factors associated with severe COVID-19: Prospective analysis of 1045 hospitalised cases in North-Eastern France, March 2020. Euro Surveill. 2020, 25, 2000895. [Google Scholar] [CrossRef] [PubMed]
  3. Albitar, O.; Ballouze, R.; Ooi, J.P.; Sheikh Ghadzi, S.M. Risk factors for mortality among COVID-19 patients. Diabetes Res. Clin. Pract. 2020, 166, 108293. [Google Scholar] [CrossRef] [PubMed]
  4. Guo, W.; Li, M.; Dong, Y.; Zhou, H.; Zhang, Z.; Tian, C.; Qin, R.; Wang, H.; Shen, Y.; Du, K.; et al. Diabetes is a risk factor for the progression and prognosis of COVID-19. Diabetes Metab. Res. Rev. 2020, 36, e3319. [Google Scholar] [CrossRef]
  5. Norouzi, M.; Norouzi, S.; Ruggiero, A.; Khan, M.S.; Myers, S.; Kavanagh, K.; Vemuri, R. Type-2 Diabetes as a Risk Factor for Severe COVID-19 Infection. Microorganisms 2021, 9, 1211. [Google Scholar] [CrossRef]
  6. Rubio-Rivas, M.; Corbella, X.; Formiga, F.; Menéndez Fernández, E.; Martín Escalante, M.D.; Baños Fernández, I.; Arnalich Fernández, F.; Del Corral-Beamonte, E.; Lalueza, A.; Parra Virto, A.; et al. Risk Categories in COVID-19 Based on Degrees of Inflammation: Data on More Than 17,000 Patients from the Spanish SEMI-COVID-19 Registry. J. Clin. Med. 2021, 10, 2214. [Google Scholar] [CrossRef]
  7. Farshbafnadi, M.; Kamali Zonouzi, S.; Sabahi, M.; Dolatshahi, M.; Aarabi, M.H. Aging & COVID-19 susceptibility, disease severity, and clinical outcomes: The role of entangled risk factors. Exp. Gerontol. 2021, 154, 111507. [Google Scholar] [CrossRef]
  8. Rueda-Camino, J.A.; Sendín-Martín, V.; Joya-Seijo, M.D.; Angelina-García, M.; Zamarro-García, C.; Gimena-Rodríguez, F.J.; Barba-Martín, R. Plasma D-dimer value corrected by inflammatory markers in patients with SARS-CoV-2 infection: Its prognostic value in the diagnosis of venous thromboembolism. Med. Clin. 2022, 158, 265–269. [Google Scholar] [CrossRef]
  9. Trimaille, A.; Thachil, J.; Marchandot, B.; Curtiaud, A.; Leonard-Lorant, I.; Carmona, A.; Matsushita, K.; Sato, C.; Sattler, L.; Grunebaum, L.; et al. D-Dimers Level as a Possible Marker of Extravascular Fibrinolysis in COVID-19 Patients. J. Clin. Med. 2021, 10, 39. [Google Scholar] [CrossRef]
  10. Thoreau, B.; Galland, J.; Delrue, M.; Neuwirth, M.; Stepanian, A.; Chauvin, A.; Dellal, A.; Nallet, O.; Roriz, M.; Devaux, M.; et al. D-Dimer Level and Neutrophils Count as Predictive and Prognostic Factors of Pulmonary Embolism in Severe Non-ICU COVID-19 Patients. Viruses 2021, 13, 758. [Google Scholar] [CrossRef]
  11. Yovchevska, I.P.; Trenovski, A.B.; Atanasova, M.H.; Georgiev, M.N.; Tafradjiiska-Hadjiolova, R.K.; Lazarov, S.D.; Yovchevski, P.H. Platelet Distribution Width and Increased D-Dimer at Admission Predicts Subsequent Development of ARDS in COVID-19 Patients. Pathophysiology 2022, 29, 233–242. [Google Scholar] [CrossRef] [PubMed]
  12. Wang, X.; Tang, G.; Liu, Y.; Zhang, L.; Chen, B.; Han, Y.; Fu, Z.; Wang, L.; Hu, G.; Ma, Q.; et al. The role of IL-6 in coronavirus, especially in COVID-19. Front. Pharmacol. 2022, 13, 1033674. [Google Scholar] [CrossRef] [PubMed]
  13. Ceci, F.M.; Fiore, M.; Gavaruzzi, F.; Angeloni, A.; Lucarelli, M.; Scagnolari, C.; Bonci, E.; Gabanella, F.; Di Certo, M.G.; Barbato, C.; et al. Early Routine Biomarkers of SARS-CoV-2 Morbidity and Mortality: Outcomes from an Emergency Section. Diagnostics 2022, 12, 176. [Google Scholar] [CrossRef]
  14. Ghizlane, E.A.; Manal, M.; Abderrahim, E.K.; Abdelilah, E.; Mohammed, M.; Rajae, A.; Amine, B.M.; Houssam, B.; Naima, A.; Brahim, H. Lymphopenia in COVID-19: A single center retrospective study of 589 cases. Ann. Med. Surg. 2021, 69, 102816. [Google Scholar] [CrossRef] [PubMed]
  15. Lee, J.; Park, S.-S.; Kim, T.Y.; Lee, D.-G.; Kim, D.-W. Lymphopenia as a Biological Predictor of Outcomes in COVID-19 Patients: A Nationwide Cohort Study. Cancers 2021, 13, 471. [Google Scholar] [CrossRef] [PubMed]
  16. Tavakolpour, S.; Rakhshandehroo, T.; Wei, E.X.; Rashidian, M. Lymphopenia during the COVID-19 infection: What it shows and what can be learned. Immunol. Lett. 2020, 225, 31–32. [Google Scholar] [CrossRef]
  17. Cheng, Y.; Yue, L.; Wang, Z.; Zhang, J.; Xiang, G. Hyperglycemia associated with lymphopenia and disease severity of COVID-19 in type 2 diabetes mellitus. J. Diabetes Complicat. 2021, 35, 107809. [Google Scholar] [CrossRef]
  18. Gómez-Pastora, J.; Weigand, M.; Kim, J.; Wu, X.; Strayer, J.; Palmer, A.F.; Zborowski, M.; Yazer, M.; Chalmers, J.J. Hyperferritinemia in critically ill COVID-19 patients—Is ferritin the product of inflammation or a pathogenic mediator? Clin. Chim. Acta 2020, 509, 249–251. [Google Scholar] [CrossRef]
  19. Bellmann-Weiler, R.; Lanser, L.; Barket, R.; Rangger, L.; Schapfl, A.; Schaber, M.; Fritsche, G.; Wöll, E.; Weiss, G. Prevalence and Predictive Value of Anemia and Dysregulated Iron Homeostasis in Patients with COVID-19 Infection. J. Clin. Med. 2020, 9, 2429. [Google Scholar] [CrossRef]
  20. Deng, F.; Zhang, L.; Lyu, L.; Lu, Z.; Gao, D.; Ma, X.; Guo, Y.; Wang, R.; Gong, S.; Jiang, W. Increased levels of ferritin on admission predicts intensive care unit mortality in patients with COVID-19. Med. Clin. 2021, 156, 324–331. [Google Scholar] [CrossRef]
  21. Zhao, K.; Huang, J.; Dai, D.; Feng, Y.; Liu, L.; Nie, S. Serum Iron Level as a Potential Predictor of Coronavirus Disease 2019 Severity and Mortality: A Retrospective Study. Open Forum Infect. Dis. 2020, 7, ofaa250. [Google Scholar] [CrossRef] [PubMed]
  22. Edeas, M.; Saleh, J.; Peyssonnaux, C. Iron: Innocent bystander or vicious culprit in COVID-19 pathogenesis? Int. J. Infect. Dis. 2020, 97, 303–305. [Google Scholar] [CrossRef]
  23. Girelli, D.; Marchi, G.; Busti, F.; Vianello, A. Iron metabolism in infections: Focus on COVID-19. Semin. Hematol. 2021, 58, 182–187. [Google Scholar] [CrossRef] [PubMed]
  24. Fox, P.L.; Mukhopadhyay, C.; Ehrenwald, E. Structure, oxidant activity, and cardiovascular mechanisms of human ceruloplasmin. Life Sci. 1995, 56, 1749–1758. [Google Scholar] [CrossRef] [PubMed]
  25. Atanasiu, R.L.; Stea, D.; Mateescu, M.A.; Vergely, C.; Dalloz, F.; Briot, F.; Maupoil, V.; Nadeau, R.; Rochette, L. Direct evidence of caeruloplasmin antioxidant properties. Mol. Cell Biochem. 1998, 189, 127–135. [Google Scholar] [CrossRef] [PubMed]
  26. Golizeh, M.; Lee, K.; Ilchenko, S.; Ösme, A.; Bena, J.; Sadygov, R.G.; Kashyap, S.R.; Kasumov, T. Increased serotransferrin and ceruloplasmin turnover in diet-controlled patients with type 2 diabetes. Free Radic. Biol. Med. 2017, 113, 461–469. [Google Scholar] [CrossRef]
  27. Eid, C.; Hémadi, M.; Ha-Duong, N.T.; El Hage Chahine, J.M. Iron uptake and transfer from ceruloplasmin to transferrin. Biochim. Biophys. Acta 2014, 1840, 1771–1781. [Google Scholar] [CrossRef]
  28. Kawabata, H. Transferrin and transferrin receptors update. Free Radic. Biol. Med. 2019, 133, 46–54. [Google Scholar] [CrossRef]
  29. Liu, Z.; Wang, M.; Zhang, C.; Zhou, S.; Ji, G. Molecular Functions of Ceruloplasmin in Metabolic Disease Pathology. Diabetes Metab. Syndr. Obes. 2022, 15, 695–711. [Google Scholar] [CrossRef]
  30. Gembillo, G.; Labbozzetta, V.; Giuffrida, A.E.; Peritore, L.; Calabrese, V.; Spinella, C.; Stancanelli, M.R.; Spallino, E.; Visconti, L.; Santoro, D. Potential Role of Copper in Diabetes and Diabetic Kidney Disease. Metabolites 2023, 13, 17. [Google Scholar] [CrossRef]
  31. Twomey, P.J.; Viljoen, A.; House, I.M.; Reynolds, T.M.; Wierzbicki, A.S. Relationship between Serum Copper, Ceruloplasmin, and Non–Ceruloplasmin-Bound Copper in Routine Clinical Practice. Clin. Chem. 2005, 51, 1558–1559. [Google Scholar] [CrossRef] [PubMed]
  32. Cunningham, J.; Leffell, M.; Mearkle, P.; Harmatz, P. Elevated plasma ceruloplasmin in insulin-dependent diabetes mellitus: Evidence for increased oxidative stress as a variable complication. Metabolism 1995, 44, 996–999. [Google Scholar] [CrossRef] [PubMed]
  33. Tsalamandris, S.; Antonopoulos, A.S.; Oikonomou, E.; Papamikroulis, G.A.; Vogiatzi, G.; Papaioannou, S.; Deftereos, S.; Tousoulis, D. The Role of Inflammation in Diabetes: Current Concepts and Future Perspectives. Eur. Cardiol. 2019, 14, 50–59. [Google Scholar] [CrossRef]
  34. Mozafari, N.; Azadi, S.; Mehdi-Alamdarlou, S.; Ashrafi, H.; Azadi, A. Inflammation: A bridge between diabetes and COVID-19, and possible management with sitagliptin. Med. Hypotheses 2020, 143, 110111. [Google Scholar] [CrossRef]
  35. Lee, M.J.; Jung, C.H.; Kang, Y.M.; Jang, J.E.; Leem, J.; Park, J.Y.; Lee, W.J. Serum Ceruloplasmin Level as a Predictor for the Progression of Diabetic Nephropathy in Korean Men with Type 2 Diabetes Mellitus. Diabetes Metab. J. 2015, 39, 230–239. [Google Scholar] [CrossRef] [PubMed]
  36. Asmat, U.; Abad, K.; Ismail, K. Diabetes mellitus and oxidative stress—A concise review. Saudi Pharm. J. 2016, 24, 547–553. [Google Scholar] [CrossRef] [PubMed]
  37. Wronka, M.; Krzemińska, J.; Młynarska, E.; Rysz, J.; Franczyk, B. The Influence of Lifestyle and Treatment on Oxidative Stress and Inflammation in Diabetes. Int. J. Mol. Sci. 2022, 23, 15743. [Google Scholar] [CrossRef]
  38. Blesia, V.; Patel, V.B.; Al-Obaidi, H.; Renshaw, D.; Zariwala, M.G. Excessive Iron Induces Oxidative Stress Promoting Cellular Perturbations and Insulin Secretory Dysfunction in MIN6 Beta Cells. Cells 2021, 10, 1141. [Google Scholar] [CrossRef]
  39. Bhatti, J.S.; Sehrawat, A.; Mishra, J.; Sidhu, I.S.; Navik, U.; Khullar, N.; Kumar, S.; Bhatti, G.K.; Reddy, P.H. Oxidative stress in the pathophysiology of type 2 diabetes and related complications: Current therapeutics strategies and future perspectives. Free Radic. Biol. Med. 2022, 184, 114–134. [Google Scholar] [CrossRef]
  40. Kotha, R.R.; Tareq, F.S.; Yildiz, E.; Luthria, D.L. Oxidative Stress and Antioxidants—A Critical Review on In Vitro Antioxidant Assays. Antioxidants 2022, 11, 2388. [Google Scholar] [CrossRef]
  41. Eguchi, N.; Vaziri, N.D.; Dafoe, D.C.; Ichii, H. The Role of Oxidative Stress in Pancreatic β Cell Dysfunction in Diabetes. Int. J. Mol. Sci. 2021, 22, 1509. [Google Scholar] [CrossRef] [PubMed]
  42. Dinić, S.; Arambašić Jovanović, J.; Uskoković, A.; Mihailović, M.; Grdović, N.; Tolić, A.; Rajić, J.; Đorđević, M.; Vidaković, M. Oxidative stress-mediated beta cell death and dysfunction as a target for diabetes management. Front. Endocrinol. 2022, 13, 1006376. [Google Scholar] [CrossRef]
  43. Kulkarni, A.; Muralidharan, C.; May, S.C.; Tersey, S.A.; Mirmira, R.G. Inside the β Cell: Molecular Stress Response Pathways in Diabetes Pathogenesis. Endocrinology 2023, 164, bqac184. [Google Scholar] [CrossRef] [PubMed]
  44. Marku, A.; Galli, A.; Marciani, P.; Dule, N.; Perego, C.; Castagna, M. Iron Metabolism in Pancreatic Beta-Cell Function and Dysfunction. Cells 2021, 10, 2841. [Google Scholar] [CrossRef] [PubMed]
  45. Silvestri, L.; Pettinato, M.; Furiosi, V.; Bavuso Volpe, L.; Nai, A.; Pagani, A. Managing the Dual Nature of Iron to Preserve Health. Int. J. Mol. Sci. 2023, 24, 3995. [Google Scholar] [CrossRef]
  46. Mancardi, D.; Mezzanotte, M.; Arrigo, E.; Barinotti, A.; Roetto, A. Iron Overload, Oxidative Stress, and Ferroptosis in the Failing Heart and Liver. Antioxidants 2021, 10, 1864. [Google Scholar] [CrossRef]
  47. Means, R.T. Hepcidin, Iron, and COVID-19: Is There an Erythroid Connection? J. Investig. Med. 2022, 70, 861–862. [Google Scholar] [CrossRef]
  48. Ehsani, S. COVID-19 and iron dysregulation: Distant sequence similarity between hepcidin and the novel coronavirus spike glycoprotein. Biol. Direct. 2020, 15, 19. [Google Scholar] [CrossRef]
  49. Zeinivand, M.; jamali-Raeufy, N.; Zavvari, F. The beneficial role of Hepcidin peptide inhibitor in improved the symptoms of COVID-19 in diabetics: Anti-inflammatory and potential therapeutic effects. J. Diabetes Metab. Disord. 2022, 21, 1797–1807. [Google Scholar] [CrossRef]
  50. Kim, J.D.; Lim, D.M.; Park, K.Y.; Park, S.E.; Rhee, E.J.; Park, C.Y.; Lee, W.Y.; Oh, K.W. Serum Transferrin Predicts New-Onset Type 2 Diabetes in Koreans: A 4-Year Retrospective Longitudinal Study. Endocrinol. Metab. 2020, 35, 610–617. [Google Scholar] [CrossRef]
  51. Claise, C.; Saleh, J.; Rezek, M.; Vaulont, S.; Peyssonnaux, C.; Edeas, M. Low transferrin levels predict heightened inflammation in patients with COVID-19: New insights. Int. J. Infect. Dis. 2022, 116, 74–79. [Google Scholar] [CrossRef] [PubMed]
  52. Czempik, P.F.; Wiórek, A. Comparison of Standard and New Iron Status Biomarkers: A Prospective Cohort Study in Sepsis Patients. Healthcare 2023, 11, 995. [Google Scholar] [CrossRef] [PubMed]
  53. Alsagaby, S.A.; Aljouie, A.; Alshammari, T.H.; Mir, S.A.; Alhumaydhi, F.A.; Al Abdulmonem, W.; Alshaalan, H.; Alomaish, H.; Daghistani, R.; Alsehawi, A.; et al. Haematological and radiological-based prognostic markers of COVID-19. J. Infect. Public Health 2021, 14, 1650–1657. [Google Scholar] [CrossRef]
  54. Martos Pérez, F.; Luque Del Pino, J.; Jiménez García, N.; Mora Ruiz, E.; Asencio Méndez, C.; García Jiménez, J.M.; Navarro Romero, F.; Núñez Rodríguez, M.V. Comorbidity and prognostic factors on admission in a COVID-19 cohort of a general hospital. Rev. Clin. Esp. 2021, 221, 529–535. [Google Scholar] [CrossRef] [PubMed]
  55. Agarwal, S.; Schechter, C.; Southern, W.; Crandall, J.P.; Tomer, Y. Preadmission Diabetes-Specific Risk Factors for Mortality in Hospitalized Patients with Diabetes and Coronavirus Disease 2019. Diabetes Care 2020, 43, 2339–2344. [Google Scholar] [CrossRef] [PubMed]
  56. Karasneh, R.A.; Khassawneh, B.Y.; Al-Azzam, S.; Al-Mistarehi, A.H.; Lattyak, W.J.; Aldiab, M.; Kabbaha, S.; Hasan, S.S.; Conway, B.R.; Aldeyab, M.A. Risk Factors Associated with Mortality in COVID-19 Hospitalized Patients: Data from the Middle East. Int. J. Clin. Pract. 2022, 2022, 9617319. [Google Scholar] [CrossRef]
  57. Costa, F.F.; Rosário, W.R.; Ribeiro Farias, A.C.; de Souza, R.G.; Duarte Gondim, R.S.; Barroso, W.A. Metabolic syndrome and COVID-19: An update on the associated comorbidities and proposed therapies. Diabetes Metab. Syndr. 2020, 14, 809–814. [Google Scholar] [CrossRef]
  58. Rastad, H.; Karim, H.; Ejtahed, H.S.; Tajbakhsh, R.; Noorisepehr, M.; Babaei, M.; Azimzadeh, M.; Soleimani, A.; Inanloo, S.H.; Shafiabadi Hassani, N.; et al. Risk and predictors of in-hospital mortality from COVID-19 in patients with diabetes and cardiovascular disease. Diabetol. Metab. Syndr. 2020, 12, 57. [Google Scholar] [CrossRef]
  59. Han, M.; Ma, K.; Wang, X.; Yan, W.; Wang, H.; You, J.; Wang, Q.; Chen, H.; Guo, W.; Chen, T.; et al. Immunological Characteristics in Type 2 Diabetes Mellitus Among COVID-19 Patients. Front. Endocrinol. 2021, 12, 596518. [Google Scholar] [CrossRef]
  60. Koh, H.; Moh, A.M.C.; Yeoh, E.; Lin, Y.; Low, S.K.M.; Ooi, S.T.; Tan, S.K.; Lin, J.H.X.; Hoong, C.W.S. Diabetes predicts severity of COVID-19 infection in a retrospective cohort: A mediatory role of the inflammatory biomarker C-reactive protein. J. Med. Virol. 2021, 93, 3023–3032. [Google Scholar] [CrossRef]
  61. Alshukry, A.; Bu Abbas, M.; Ali, Y.; Alahmad, B.; Al-Shammari, A.A.; Alhamar, G.; Abu-Farha, M.; AbuBaker, J.; Devarajan, S.; Dashti, A.A.; et al. Clinical characteristics and outcomes of COVID-19 patients with diabetes mellitus in Kuwait. Heliyon 2021, 7, e06706. [Google Scholar] [CrossRef]
  62. Pérez-García, N.; García-González, J.; Requena-Mullor, M.; Rodríguez-Maresca, M.Á.; Alarcón-Rodríguez, R. Comparison of Analytical Values D-Dimer, Glucose, Ferritin and C-Reactive Protein of Symptomatic and Asymptomatic COVID-19 Patients. Int. J. Environ. Res. Public Health 2022, 19, 5354. [Google Scholar] [CrossRef] [PubMed]
  63. Shakaroun, D.A.; Lazar, M.H.; Horowitz, J.C.; Jennings, J.H. Serum Ferritin as a Predictor of Outcomes in Hospitalized Patients with Covid-19 Pneumonia. J. Intensive Care Med. 2023, 38, 21–26. [Google Scholar] [CrossRef] [PubMed]
  64. Yu, L.; Yan, J.; Zhang, Q.; Lin, H.; Zhu, L.; Liu, Q.; Zhao, C. Association between Serum Ferritin and Blood Lipids: Influence of Diabetes and hs-CRP Levels. J. Diabetes Res. 2020, 2020, 4138696. [Google Scholar] [CrossRef]
  65. Banchini, F.; Cattaneo, G.M.; Capelli, P. Serum ferritin levels in inflammation: A retrospective comparative analysis between COVID-19 and emergency surgical non-COVID-19 patients. World J. Emerg. Surg. 2021, 16, 9. [Google Scholar] [CrossRef]
  66. McLaughlin, K.-M.; Bechtel, M.; Bojkova, D.; Münch, C.; Ciesek, S.; Wass, M.N.; Michaelis, M.; Cinatl, J., Jr. COVID-19-Related Coagulopathy—Is Transferrin a Missing Link? Diagnostics 2020, 10, 539. [Google Scholar] [CrossRef]
  67. Peng, D.; Gao, Y.; Zhang, L.; Liu, Z.; Wang, H.; Liu, Y. The Relationship Between Hepcidin-Mediated Iron Dysmetabolism and COVID-19 Severity: A Meta-Analysis. Front. Public Health 2022, 10, 881412. [Google Scholar] [CrossRef] [PubMed]
  68. Ciotti, M.; Nuccetelli, M.; Pieri, M.; Petrangeli, C.M.; Giovannelli, A.; Cosio, T.; Rosa, L.; Valenti, P.; Leonardis, F.; Legramante, J.M.; et al. Evaluation of Hepcidin Level in COVID-19 Patients Admitted to the Intensive Care Unit. Diagnostics 2022, 12, 2665. [Google Scholar] [CrossRef]
  69. Hulkoti, V.S.; Acharya, S.; Kumar, S.; Talwar, D.; Khanna, S.; Annadatha, A.; Madaan, S.; Verma, V.; Sagar, V.V.S.S. Association of serum ferritin with COVID-19 in a cross-sectional study of 200 intensive care unit patients in a rural hospital: Is ferritin the forgotten biomarker of mortality in severe COVID-19? J. Fam. Med. Prim. Care 2022, 11, 2045–2050. [Google Scholar] [CrossRef]
  70. Gaiatto, A.C.M.; Bibo, T.A.; de Godoy Moreira, N.; Raimundo, J.R.S.; da Costa Aguiar Alves, B.; Gascón, T.; Carvalho, S.S.; Pereira, E.C.; Fonseca, F.L.A.; da Veiga, G.L. COVID-19 compromises iron homeostasis: Transferrin as a target of investigation. J. Trace Elem. Med. Biol. 2023, 76, 127109. [Google Scholar] [CrossRef]
  71. Lanser, L.; Burkert, F.R.; Bellmann-Weiler, R.; Schroll, A.; Wildner, S.; Fritsche, G.; Weiss, G. Dynamics in Anemia Development and Dysregulation of Iron Homeostasis in Hospitalized Patients with COVID-19. Metabolites 2021, 11, 653. [Google Scholar] [CrossRef] [PubMed]
  72. Chang, Y.; Bai, M.; You, Q. Associations between Serum Interleukins (IL-1β, IL-2, IL-4, IL-6, IL-8, and IL-10) and Disease Severity of COVID-19: A Systematic Review and Meta-Analysis. Biomed Res. Int. 2022, 2022, 2755246. [Google Scholar] [CrossRef] [PubMed]
  73. McGonagle, D.; Sharif, K.; O’Regan, A.; Bridgewood, C. The Role of Cytokines including Interleukin-6 in COVID-19 induced Pneumonia and Macrophage Activation Syndrome-Like Disease. Autoimmun. Rev. 2020, 19, 102537. [Google Scholar] [CrossRef] [PubMed]
  74. Oh, S.M.; Skendelas, J.P.; Macdonald, E.; Bergamini, M.; Goel, S.; Choi, J.; Segal, K.R.; Vivek, K.; Nair, S.; Leff, J. On-admission anemia predicts mortality in COVID-19 patients: A single center, retrospective cohort study. Am. J. Emerg. Med. 2021, 48, 140–147. [Google Scholar] [CrossRef] [PubMed]
  75. Sonnweber, T.; Boehm, A.; Sahanic, S.; Pizzini, A.; Aichner, M.; Sonnweber, B.; Kurz, K.; Koppelstätter, S.; Haschka, D.; Petzer, V.; et al. Persisting alterations of iron homeostasis in COVID-19 are associated with non-resolving lung pathologies and poor patients’ performance: A prospective observational cohort study. Respir. Res. 2020, 21, 276. [Google Scholar] [CrossRef] [PubMed]
  76. Lv, Y.; Chen, L.; Liang, X.; Liu, X.; Gao, M.; Wang, Q.; Wei, Q.; Liu, L. Association between iron status and the risk of adverse outcomes in COVID-19. Clin. Nutr. 2021, 40, 3462–3469. [Google Scholar] [CrossRef]
  77. Mehta, P.; McAuley, D.F.; Brown, M.; Sanchez, E.; Tattersall, R.S.; Manson, J.J. HLH Across Speciality Collaboration, UK. COVID-19: Consider cytokine storm syndromes and immunosuppression. Lancet 2020, 395, 1033–1034. [Google Scholar] [CrossRef]
  78. Basheer, M.; Saad, E.; Assy, N. The Cytokine Storm in COVID-19: The Strongest Link to Morbidity and Mortality in the Current Epidemic. COVID 2022, 2, 540–552. [Google Scholar] [CrossRef]
  79. Jain, V.; Kumar, P.; Panda, P.K.; Suresh, M.; Kaushal, K.; Mirza, A.A.; Raina, R.; Saha, S.; Omar, B.J.; Subbiah, V. Utility of IL-6 in the Diagnosis, Treatment and Prognosis of COVID-19 Patients: A Longitudinal Study. Vaccines 2022, 10, 1786. [Google Scholar] [CrossRef]
  80. Chen, L.Y.C.; Biggs, C.M.; Jamal, S.; Stukas, S.; Wellington, C.L.; Sekhon, M.S. Soluble interleukin-6 receptor in the COVID-19 cytokine storm syndrome. Cell Rep. Med. 2021, 2, 100269. [Google Scholar] [CrossRef]
  81. Hackler, J.; Heller, R.A.; Sun, Q.; Schwarzer, M.; Diegmann, J.; Bachmann, M.; Moghaddam, A.; Schomburg, L. Relation of Serum Copper Status to Survival in COVID-19. Nutrients 2021, 13, 1898. [Google Scholar] [CrossRef]
  82. Nemeth, E.; Rivera, S.; Gabayan, V.; Keller, C.; Taudorf, S.; Pedersen, B.K.; Ganz, T. IL-6 mediates hypoferremia of inflammation by inducing the synthesis of the iron regulatory hormone hepcidin. J. Clin. Investig. 2004, 113, 1271–1276. [Google Scholar] [CrossRef] [PubMed]
  83. Rouaud, F.; Méan, I.; Citi, S. The ACE2 Receptor for Coronavirus Entry Is Localized at Apical Cell—Cell Junctions of Epithelial Cells. Cells 2022, 11, 627. [Google Scholar] [CrossRef]
  84. Henry, B.M.; Benoit, J.L.; Rose, J.; de Oliveira, M.H.S.; Lippi, G.; Benoit, S.W. Serum ACE activity and plasma ACE concentration in patients with SARS-CoV-2 infection. Scand. J. Clin. Lab. Invest. 2021, 81, 272–275. [Google Scholar] [CrossRef] [PubMed]
  85. Goren, T.; Yilmaz, A.; Uluturk, M.; Sabirli, R.; Kemanci, A.; Seyit, M.; Ozen, M.; Oskay, A.; Koseler, A.; Turkcuer, I. Investigation of Serum Angiotensin-Converting Enzyme (ACE) Concentration and ACE Gene Polymorphism in Patients With SARS-CoV-2 Pneumonia Admitted to the Emergency Department. Cureus 2022, 14, e31201. [Google Scholar] [CrossRef] [PubMed]
  86. Oz, M.; Lorke, D.E. Multifunctional angiotensin converting enzyme 2, the SARS-CoV-2 entry receptor, and critical appraisal of its role in acute lung injury. Biomed Pharmacother. 2021, 136, 111193. [Google Scholar] [CrossRef]
  87. Zemlin, A.E.; Wiese, O.J. Coronavirus disease 2019 (COVID-19) and the renin-angiotensin system: A closer look at angiotensin-converting enzyme 2 (ACE2). Ann. Clin. Biochem. 2020, 57, 339–350. [Google Scholar] [CrossRef]
  88. Maira, D.; Duca, L.; Busti, F.; Consonni, D.; Salvatici, M.; Vianello, A.; Milani, A.; Guzzardella, A.; Di Pierro, E.; Aliberti, S.; et al. The role of hypoxia and inflammation in the regulation of iron metabolism and erythropoiesis in COVID-19: The IRONCOVID study. Am. J. Hematol. 2022, 97, 1404–1412. [Google Scholar] [CrossRef]
  89. Wu, D.; Gao, S. Analysis of the lymphocyte count in type 2 diabetic patients with coronavirus disease (COVID-19): A retrospective study in a centralized treatment center. Diabetes Res. Clin. Pract. 2020, 166, 108340. [Google Scholar] [CrossRef]
  90. Zhang, Q.; Wei, Y.; Chen, M.; Wan, Q.; Chen, X. Clinical analysis of risk factors for severe COVID-19 patients with type 2 diabetes. J. Diabetes Complicat. 2020, 34, 107666. [Google Scholar] [CrossRef]
  91. Fritea, L.; Sipponen, M.; Antonescu, A.; Miere, F.; Chirla, R.; Vesa, C.; Cavalu, S.; Ganea, M.; Horvath, T.; Petchesi, C.; et al. Relationship between pre-existing conditions in covid-19 patients and inflammation. Pharmacophore 2022, 13, 41–48. [Google Scholar] [CrossRef]
  92. García de Guadiana-Romualdo, L.; Morell-García, D.; Rodríguez-Fraga, O.; Morales-Indiano, C.; María Lourdes Padilla Jiménez, A.; Gutiérrez Revilla, J.I.; Urrechaga, E.; Álamo, J.M.; Hernando Holgado, A.M.; Lorenzo-Lozano, M.D.C.; et al. Cardiac troponin and COVID-19 severity: Results from BIOCOVID study. Eur. J. Clin. Investig. 2021, 51, e13532. [Google Scholar] [CrossRef] [PubMed]
  93. Aziz, F.; Stöcher, H.; Bräuer, A.; Ciardi, C.; Clodi, M.; Fasching, P.; Karolyi, M.; Kautzky-Willer, A.; Klammer, C.; Malle, O.; et al. For The Covid-In Diabetes in Austria. Biomarkers Predictive for In-Hospital Mortality in Patients with Diabetes Mellitus and Prediabetes Hospitalized for COVID-19 in Austria: An Analysis of COVID-19 in Diabetes Registry. Viruses 2022, 14, 1285. [Google Scholar] [CrossRef] [PubMed]
Figure 1. Regression function associated with the scatter plot for ceruloplasmin and severity of COVID-19 (an increasing tendency of the ceruloplasmin concentration depending on the level of infection).
Microbiolres 14 00115 g001
Figure 2. Regression function associated with the scatter plot for serum iron and the severity of COVID-19 (a decreasing tendency of serum iron values in dependence with the severity of the infection).
Microbiolres 14 00115 g002
Figure 3. Regression function associated with the scatter plot for transferrin and severity of COVID-19 (the decreasing tendency of transferrin level depending on the severity of infection).
Microbiolres 14 00115 g003
Figure 4. Regression function associated with the scatter plot for IL-6 and severity of COVID-19 (the increasing tendency of the IL-6 level depending on the severity of the infection).
Microbiolres 14 00115 g004
Table 1. Comparison between patients with COVID-19 and healthy subjects for the following parameters (age, IL-6, serum iron, ACE, ceruloplasmin, and transferrin).
SAMPLENMeanStd. Deviationpt
Age (years)14569.60011.7270.0001T
24555.0003.126
IL-6 (pg/mL)14577.843158.3200.0001M-W
2452.0521.448
Serum iron (µg/dL)14556.15631.3210.0001T
24593.15528.035
ACE (U/L)14420.89117.3120.018T
24528.0999.616
Ceruloplasmin (g/L)1440.3250.0810.0001T
2450.2730.040
Transferrin (g/L)1441.7610.4860.0001T
2452.7070.254
1 = the group of patients with type 2 diabetes and SARS-CoV-2 virus infection; 2 = control group of healthy subjects; N = number of evaluated persons; p = the threshold for statistical significance of the tests used in statistical analyses is the one usually applied in medical research p = 0.05; and p < 0.001 is strongly significant.
Table 2. Spearman correlations (Ro) of ceruloplasmin.
Evaluated ParametersCeruloplasmin
RopN
COVID-19 severity0.222 *0.03789
Age (years)0.1620.13089
IL-6 (pg/mL)0.425 **0.000189
Serum iron (µg/dL)−0.530 **0.000189
ACE (U/L)−0.1050.32989
Transferrin (g/L)−0.0550.61089
Ro = Spearman-type correlations (used when at least one of the variables is not normally distributed) and minus means inverse correlation; * = correlation significance <0.05; ** = correlation significance <0.01; p = the threshold for statistical significance of the tests used in statistical analyses is the one usually applied in medical research p = 0.05 (=5%); N = number of evaluated persons; IL-6—interleukin 6; ACE—angiotensin-converting enzyme.
Table 3. Spearman correlations (Ro) of serum iron levels.
Evaluated ParametersSerum Iron
RopN
COVID-19 severity−0.476 **0.000190
Age (years)−0.358 **0.00190
IL-6 (pg/mL)−0.617 **0.000190
Ceruloplasmin (g/L)−0.530 **0.000189
Ro = Spearman-type correlations (used when at least one of the variables is not normally distributed) and minus means inverse correlation; ** = correlation significance <0.01; p = the threshold for statistical significance of the tests used in statistical analyses is the one usually applied in medical research p = 0.05 (=5%), and p < 0.001 = strongly significant; N = number of evaluated persons.
Table 4. Spearman correlations (Ro) of transferrin levels.
Evaluated ParametersTransferrin
RopN
COVID-19 severity−0.791 **0.000189
Age (years)−0.504 **0.000189
IL-6 (pg/mL)−0.668 **0.000189
Ceruloplasmin (g/L)−0.0550.61089
Ro = Spearman-type correlations (used when at least one of the variables is not normally distributed) and minus means inverse correlation; ** = correlation significance <0.01; p = the threshold for statistical significance of the tests used in statistical analyses is the one usually applied in medical research p = 0.05 (=5%), and p < 0.001 = strongly significant; N = number of evaluated persons; IL-6—interleukin 6.
Table 5. Spearman correlations (Ro) of age.
Evaluated ParametersAge
RopN
IL-6 (pg/mL)0.497 **0.000190
Serum iron (µg/dL)−0.358 **0.00190
ACE (U/L)−0.346 **0.00189
Ceruloplasmin (g/L)0.1620.13089
Transferrin (g/L)−0.504 **0.000189
Ro = Spearman-type correlations (used when at least one of the variables is not normally distributed) and minus means inverse correlation; ** = correlation significance <0.01; p = the threshold for statistical significance of the tests used in statistical analyses is the one usually applied in medical research p = 0.05 (=5%), and p < 0.001 = strongly significant; N = number of evaluated persons; IL-6—interleukin 6; ACE—angiotensin-converting enzyme.
Table 6. Spearman correlations (Ro) of ACE levels.
Evaluated ParametersAngiotensin-Converting Enzyme
RopN
COVID-19 severity−0.348 **0.00189
Age (years)−0.346 **0.00189
IL-6 (pg/mL)−0.349 **0.00189
Ceruloplasmin (g/L)−0.1050.32989
Ro = Spearman-type correlations (used when at least one of the variables is not normally distributed) and minus means inverse correlation; ** = correlation significance < 0.01; p = the threshold for statistical significance of the tests used in statistical analyses is the one usually applied in medical research p = 0.05 (=5%), and p < 0.001 = strongly significant; N = number of evaluated persons; IL-6—interleukin 6.
Table 7. Spearman correlations (Ro) of IL-6 levels.
Evaluated ParametersIL-6
RopN
COVID-19 severity0.819 **0.000190
Age (years)0.497 **0.000190
Serum iron (µg/dL)−0.617 **0.000190
ACE (U/L)−0.349 **0.00189
Ceruloplasmin (g/L)0.425 **0.000189
Transferrin (g/L)−0.668 **0.000189
Ro = Spearman-type correlations (used when at least one of the variables is not normally distributed) and minus means inverse correlation; ** = correlation significance <0.01; p = the threshold for statistical significance of the tests used in statistical analyses is the one usually applied in medical research p = 0.05 (=5%), and p < 0.001 = strongly significant; N = number of evaluated persons; ACE—angiotensin-converting enzyme.
Table 8. Spearman correlations (Ro) of the clinical form of SARS-CoV-2 disease and the quantitative parameters.
Evaluated ParametersCOVID-19 Severity
RopN
Age (years)0.605 **0.000190
IL-6 (pg/mL)0.819 **0.000190
Serum iron (µg/dL)−0.476 **0.000190
ACE (U/L)−0.348 **0.00189
Ceruloplasmin (g/L)0.222 *0.03789
Transferrin (g/L)−0.791 **0.000189
Ro = Spearman-type correlations (used when at least one of the variables is not normally distributed) and minus means inverse correlation; * = correlation significance <0.05; ** = correlation significance <0.01; p = The threshold for statistical significance of the tests used in statistical analyses is the one usually applied in medical research p = 0.05 (=5%), and p < 0.001 = strongly significant; N = number of evaluated persons; IL-6—interleukin 6; ACE—angiotensin-converting enzyme.
Table 9. Correlation between COVID-19 severity and ceruloplasmin, CRP, LDH, D-dimer, lymphocytes, and INR.
Evaluated ParametersCOVID-19 Severity
Spearman RopN
Ceruloplasmin (g/L)0.380 *0.01144
CRP (mg/L)0.375 *0.01343
LDH (U/L)0.370 *0.01543
D-dimer (ng/mL)0.393 **0.00943
Lymphocytes number (×1000/µL)−0.471 **0.00143
INR0.313 *0.04342
Ro = Spearman-type correlations (used when at least one of the variables is not normally distributed) and minus means inverse correlation; * = correlation significance <0.05; ** = correlation significance <0.01; p = The threshold for statistical significance of the tests used in statistical analyses is the one usually applied in medical research p = 0.05 (=5%), and p < 0.001 = strongly significant; N = number of evaluated persons; CRP—C-reactive protein; LDH—lactate dehydrogenase; INR—international normalized ratio.
Table 10. Correlation between IL-6 and CRP, neutrophils, and platelets numbers.
Evaluated ParametersIL-6
Spearman RopN
Serum iron (µg/dL)−0.512 **0.000145
CRP (mg/L)0.395 **0.00943
Neutrophils number (×1000/µL)−0.364 *0.01643
Platelets number (×1000/µL)−0.343 *0.02642
Ro = Spearman-type correlations (used when at least one of the variables is not normally distributed) and minus means inverse correlation; * = correlation significance <0.05; ** = correlation significance <0.01; p = the threshold for statistical significance of the tests used in statistical analyses is the one usually applied in medical research p = 0.05 (=5%), and p < 0.001 = strongly significant; N = number of evaluated persons; IL-6—interleukin 6; CRP—C-reactive protein.
Table 11. Serum iron, IL-6, ACE, ceruloplasmin, and transferrin variations according to the patients’ gender.
ParametersGenderNMeanStd. DeviationTest t, p
Serum iron (µg/dL)W2956.31033.4950.965
M1655.87527.985
IL-6 (pg/mL)W2994.028187.1890.245
M1648.50881.807
ACE (U/L)W2919.46217.0390.453
M1523.65318.097
Ceruloplasmin (g/L)W290.3210.0700.670
M150.3320.100
Transferrin (g/L)W291.7890.5360.603
M151.707330.383321
N = number of evaluated persons; W = women; M = men; IL-6—interleukin 6; ACE—angiotensin-converting enzyme; p = the threshold for statistical significance of the tests used in statistical analyses is the one usually applied in medical research p = 0.05 (=5%), and p < 0.001 = strongly significant; t =T (Student) test.
Table 12. Other parameter variations according to the patients’ gender.
Other ParametersGenderNMeanStd. DeviationTest t, p
Ferritin (ng/mL)W26538.081379.8580.079
M16836.506696.056
Hemoglobin (g/dL)W2712.7331.6840.126
M1613.6061.914
RBC(×1003/µL)W274.4440.5680.572
M164.5510.642
Glycemia (mg/dL)W26224.19287.7610.678
M16211.875100.572
CRP (mg/L)W27101.61376.5810.837
M1696.80667.662
LDH (U/L)W27382.259146.7930.569
M16416.625247.522
Fibrinogen (mg/dL)W27470.300119.6070.435
M16504.463163.552
d-Dimer (ng/mL)W271135.1112241.6390.546
M161959.8753820.193
Lymphocytes number
(×1000/µL)
W270.9330.6040.440
M161.1691.111
N = number of evaluated persons; W = women; M = men; IL-6—interleukin 6; CRP—C-reactive protein; LDH—lactate dehydrogenase; RBC = Red blood cell, p = the threshold for statistical significance of the tests used in statistical analyses is the one usually applied in medical research p = 0.05 (=5%), and p < 0.001 = strongly significant; t = T (Student) test.
Table 13. The multiple linear regression model between serum iron (as the dependent parameter) and ceruloplasmin, hemoglobin, RBC, platelets number, and fibrinogen (as the independent parameters).
ModelUnstandardized CoefficientsStandardized Coefficientsp95.0% Confidence Interval for B
BBetaLower BoundUpper Bound
1Ceruloplasmin (g/L)−164.297−0.8500.001−252.774−75.819
Hemoglobin (g/dL)15.2813.0660.0016.91123.652
RBC (×1003/µL)−26.980−1.8640.031−51.324−2.636
Fibrinogen (mg/dL)−0.016−0.1270.545−0.0700.038
Platelets number (×1000/µL)0.1860.6800.00010.0970.275
p = the threshold for statistical significance of the tests used in statistical analyses is the one usually applied in medical research p = 0.05 (=5%), and p < 0.001 = strongly significant. RBC—red blood cell.
Table 14. The coefficient of multiple correlation in the linear regression model.
ModelRR Square bAdjusted R SquareChange Statistics
R Square ChangeSig. F Change
10.942 a0.8870.8710.8870.000
R2 = the proportion of the variation of the dependent variable (serum iron) due to the variation of the predictor variables ceruloplasmin, hemoglobin, platelets number, and RBC.
Disclaimer/Publisher’s Note: The statements, opinions and data contained in all publications are solely those of the individual author(s) and contributor(s) and not of MDPI and/or the editor(s). MDPI and/or the editor(s) disclaim responsibility for any injury to people or property resulting from any ideas, methods, instructions or products referred to in the content.

