Article

Microcystin Concentrations and Detection of the mcyA Gene in Water Collected from Agricultural, Urban, and Recreational Areas in a Karst Aquifer in the Yucatan Peninsula of Mexico

by
Gerardo Ávila-Torres
1,2,
Gabriela Rosiles-González
2,
Victor Hugo Carrillo-Jovel
2,
Gilberto Acosta-González
2,
Eduardo Cejudo-Espinosa
2,
Daniela Ortega-Camacho
2,
Cecilia Hernández-Zepeda
2,* and
Oscar Alberto Moreno Valenzuela
1,*
1
Unidad de Bioquímica y Biología Molecular de Plantas, Centro de Investigación Científica de Yucatán, A.C., Calle 43 No. 130, Colonia Chuburná de Hidalgo, Mérida 97205, Yucatán, Mexico
2
Unidad de Ciencias del Agua, Centro de Investigación Científica de Yucatán, A.C., Calle 8 No. 39 SM 64 Mz 29, Cancún 77500, Quintana Roo, Mexico
*
Authors to whom correspondence should be addressed.
Microbiol. Res. 2023, 14(3), 1168-1184; https://doi.org/10.3390/microbiolres14030078
Submission received: 22 July 2023 / Revised: 13 August 2023 / Accepted: 16 August 2023 / Published: 18 August 2023

Abstract

:
The eutrophication of freshwater ecosystems allows the proliferation of cyanobacteria that can produce secondary metabolites such as microcystins. The main aim of this study was to explore the occurrence and concentration of microcystin and the mcyA gene in water bodies located in agricultural, urban, and recreational areas in the karst aquifer of the Yucatan peninsula of Mexico (YPM) and to analyze the water quality variables and chlorophyll-a (Chl-a) associated with their presence. Water samples were collected from 14 sites, and microcystin concentrations were quantified using antibody-based ELISA test. Total DNA was isolated from filters and used for PCR amplification of a fragment of the mcyA gene. Amplicons were cloned and sequenced to identify toxin-producing cyanobacteria present in water. Results showed that water bodies had different trophic status based on Carlson’s trophic state index. Dissolved inorganic nitrogen (DIN: NH4+ + NO3 + NO2) and P-PO43− concentrations were within a range of 0.077–18.305 mg DIN/L and 0.025–2.5 mg P-PO43−/L, respectively, per sampled site. All sampled sites presented microcystin concentrations within a range of ≥0.14 µg/L to ≥5.0 µg/L, from which 21.4% (3/14) exceeded the limit established in water quality standards for water consumption (1 µg/L). The mcyA gene fragment was detected in 28.5% (4/14) of the sites. A total of 23 sequences were obtained from which 87% (20/23) shared >95% nucleotide identity (nt) with the genus Microcystis and 13% (3/23) shared >87% nt identity with uncultured cyanobacteria. No correlation with the presence of the mcyA gene and microcystins was found; however, a positive correlation was detected between microcystin concentrations with pH and Chl-a.

1. Introduction

The impact of land-use changes and the associated implications that result in the detriment of water quality need to be explored at a deeper level, especially in vulnerable areas such as karst aquifers, where little information depicting this process is available. It is well known that land-use changes, together with global climate variations, have drastically increased pollution in aquatic environments [1], leading to a decrease in water quality and the consequent trophic changes of aquatic ecosystems [2,3,4]. Moreover, the deterioration of water quality in aquatic bodies that serve as urban or agricultural receiving waters constitute a great concern, since different organic and inorganic pollutants can reach these environments, mainly because of the direct disposal of household and industrial treated and non-treated wastewater and the input of different contaminants by runoff events [5,6].
The rapid input of nutrients into aquatic ecosystems can result in the out-of-control growth of certain toxin-producing cyanobacteria or harmful algal blooms (CyanHAB), which is a serious environmental problem that can harm the health of people and animals. From all the toxin-producing cyanobacteria, the genus Microcystis has been identified as the most frequently associated with CyanHAB occurring throughout the world [7,8,9,10]. Moreover, the frequency and the intensity of CyanHAB occurring in continental aquatic ecosystems have been increasing since the last decade [6,10,11,12], and in tropical areas, the rising temperatures can increase the frequency of Microcystis blooms [8,12]. The toxic events associated particularly with M. aeruginosa often occur through the ingestion or inhalation of water containing microcystins [13,14].
Since the first reported case of a lethal intoxication of livestock that occurred in Australia [15], there have been multiple reports of intoxication of domestic and wildlife species [16,17]. Humans and livestock that drink microcystin-contaminated water can suffer severe health problems, such as toxicity in liver, kidney, heart, lungs, and reproductive organs [18]. Fatal cases caused by cyanotoxins also have been reported in patients in a hemodialysis unit [19]. In Mexico, official water quality standards [20] establish a limit of 1 µg/L for microcystin concentration in drinking water [21]. However, it is important to highlight that in this country microcystins have been reported in superficial water [22,23,24] and in groundwater [25] at concentrations above this limit with an imminent potential risk to human and animal health. Nonetheless, a continuous monitoring of the presence of microcystins is not common, and more efforts should be conducted to prevent microcystin-associated health risks, especially in the Yucatan peninsula of Mexico (YPM), where groundwater from the karst aquifer is the only source of freshwater, and many households in rural areas lack access to clean, safe water [26].
The identification of toxin-producing cyanobacteria can be conducted using traditional methods, such as microscope observation and morphological characters, and molecular methods based on sequence analyses of ribosomal and phycocyanin gene fragments; however, these methods are not entirely useful to discriminate toxigenic and non-toxigenic cyanobacterial strains [27,28,29,30,31]. To overcome this, the Mcy gene sequence analysis has been proposed as a complementary taxonomically informative method since it codes for enzymes (polypeptide synthetase and polyketide synthase) that are involved in microcystin biosynthesis [32]. The operon mcyA-C arrangement was proven to be conserved among toxic cyanobacterial strains belonging to different genera; therefore, a PCR assay that amplifies a fragment of the condensation domain of the mcyA gene fragment [29] has been successfully used for the detection and differentiation of toxic cyanobacteria in aquatic environments [33]. The latter PCR assay has allowed the identification of various cyanobacteria toxin-producing strains and genus, including Microcystis, Dolichospermum (formerly Anabaena), and Nostoc [29], all of which are commonly present in the Yucatan peninsula aquifer [34,35,36], suggesting that this assay can be used in environmental samples in this aquifer. The identification of toxin-producing cyanobacteria in water should be complemented with methods to determine microcystin concentrations, since it has been demonstrated that the presence of toxin genes is not always correlated with the presence of microcystins [2]; therefore, more studies should be conducted in different aquatic environments to determine if microcystin-producing genes can be used as good indicators of the presence of these toxins.
In water bodies in the YPM, both microcystins and toxin-producing cyanobacteria belonging to the genera Dolichospermum (formerly Anabaena), Microcystis, Nostoc, and Oscillatoria [34,35,36] are present; however, to our knowledge, the use of molecular methods to detect the occurrence of the Mcy gene sequence in groundwater from the karst aquifer of the YPM has not been reported. Therefore, the main aim of this study was to explore the occurrence and concentrations of microcystins and the mcyA gene in water bodies in agricultural, urban, and recreational areas in the karst aquifer of the YPM and analyze the water quality, determined by physicochemical and hydrochemical variables and chlorophyll-a (Chl-a) associated with their presence. This study provides a baseline for the understanding of the association of water quality with the presence of microcystin-producing cyanobacteria in different degrees of affectation in bodies of water in urban, agricultural, and recreational areas in one of the largest karst aquifers in the world.

2. Materials and Methods

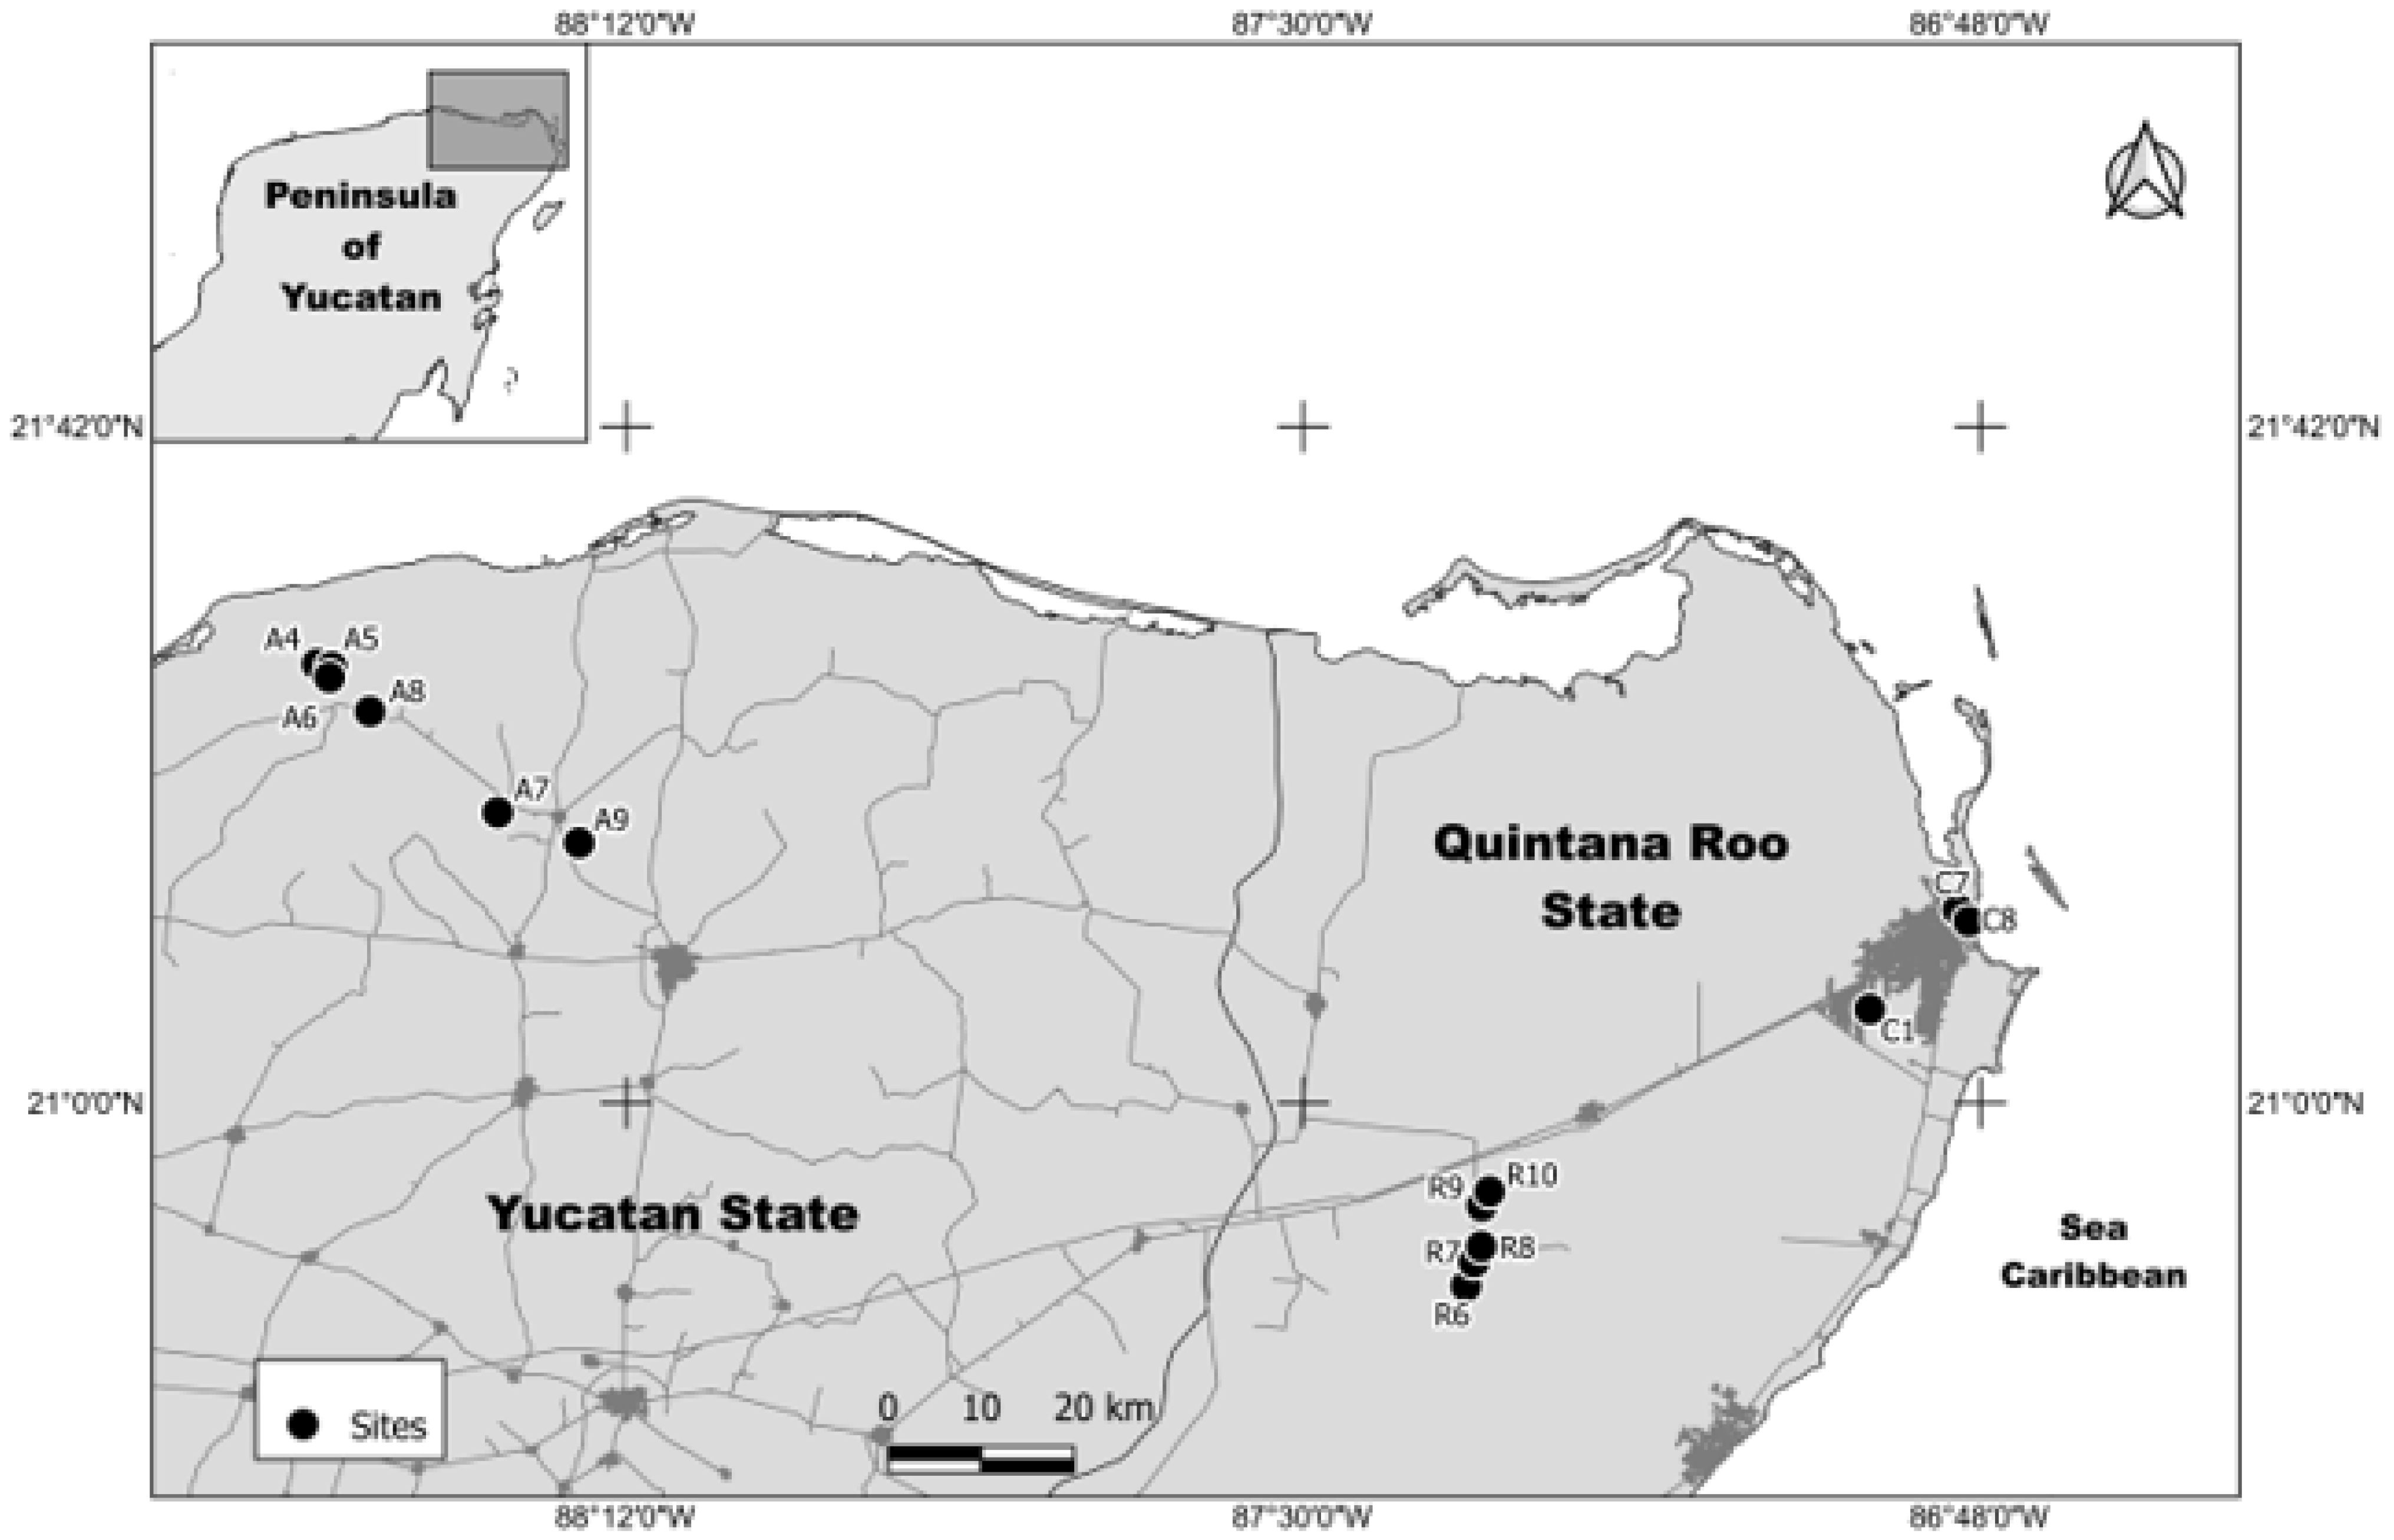
2.1. Water Collection

Water samples were collected from 14 selected study sites that were distributed in the states of Quintana Roo and Yucatan in the YPM (Figure 1). Three samples were collected in the urban area of the city of Cancun, Quintana Roo, and in the proximity of households (sites C1, quarry lake, C7, pond, and C8, coastal lagoon); six samples were collected in the agricultural area of the municipalities of Panaba and Dzilam in Yucatan (sites A4 to A9, open sinkholes); and five samples were collected in the recreational area locally known as “ruta salvaje,” in the municipality of Lazaro Cardenas, Quintana Roo (sites R6 to R10, open sinkholes).

2.2. Physicochemical Parameters

The basic physicochemical water parameters of temperature (°C), pH, electrical conductivity (EC; μS/cm), and total dissolved solids (TDS; mg/L) and dissolved oxygen (DO; mg/L) were measured in situ, using a portable Hach HQd multi-parameter probe previously calibrated.

2.3. Water Quality Variables

Water samples (50 mL) were manually collected from the surface using high-density polyethylene (HDPE) recipients, previously rinsed with phosphate-free detergent. Nutrients. Water samples were filtered in situ with a 0.22 μm nitrocellulose membrane (Whatman, 7184-002, Tisch Scientific, Cleves, OH, USA). Filtrates were collected in 50 mL Falcon tubes, transported at 4 °C to the laboratory. Spectrophotometric methods were conducted using a UV–Vis spectrophotometer (Eppendorf Bio Spectrometer®, Hamburg, Germany). Nitrite (N-NO2) was quantified following Strickland and Parsons Handbook [37]; ammonium (N-NH4+) was determined with the salicylate–hypochlorite method [38], and phosphates with the EPA 365.3 procedure method, 1978. Ions. The anions nitrates, sulphates, chloride (NO2, NO3, SO42−, and Cl), and cations sodium, magnesium, potassium, and calcium (Na+, Mg2+, K+, and Ca2+) were quantified by ion chromatography using an Ion Chromatograph 822 IC (Metrohm, Coyoacán, Mexico), with a detection limit of 0.1 mg/L. Total alkalinity was measured by acid titration [21] (Method 310.1 Alkalinity Titrimetric). Chl-a concentration was calculated based on the method of Lorenzen [39]. The Carlson’s Trophic Index was calculated based on the method reported by Fernandez et al. [40]. The Piper diagram was obtained using the Qualigraf-Novo software package, (http://www3.funceme.br/qualigraf/mi/midia/show/3, accessed on 21 March 2021).

2.4. Microcystin Quantification

Water samples (30 mL) were manually collected from the surface and were immediately subjected to a freeze and thaw procedure three times. For the enzyme-linked immunosorbent assay (ELISA), the Microcystins Tube Kit, (Enrofins, Abraxis, Warminster, PA, USA) was used to quantify microcystins/nodularin, following the manufacturer’s instructions. The detection limit based on Microcystin-LR (90% B/B0) was 0.09 μg/L.

2.5. Phytoplankton Collection and DNA Isolation

Water samples (100 L) were concentrated using the Wisconsin micro-plankton sampler (53 µm), to obtain a final volume of 1 L. Concentrates were transported to the laboratory at 4 °C and filtered with a nitrocellulose filter of 0.45 μm (Whatman®, Springfield Mill, PA, USA). Filtrated samples were stored at −20 °C. Total DNA was isolated from the nitrocellulose filter using the DNA Easy Plant Mini Kit (QIAGEN, Hilden, Germany), following the manufacturer´s instructions. Nucleic acids were eluted in 50 μL of molecular quality water and stored at −20 °C.

2.6. PCR Amplification and Cloning of the mcyA Gene

Primers mcyA-CdF1 5′ AAA-ATT-AAA-AGC-CGT-ATC-AAA 3′ and mcyA-CdR1 5′ AAA-AGT-GTT-TTA-TTA-GCG-GCT-CAT 3′ that amplify a fragment of ~300 base pairs (bp) of the condensation domain region NRPS mcyA gene were used [29]. PCR amplifications were performed using the Applied Biosystems™ Veriti™ Thermal Cycler, 96-Well (Thermo Fisher Scientific, Karlsruhe, Germany). The reaction mix consisted of a final volume of 25 μL containing 5 μL 1× buffer solution Gotaq® Green Master Mix (PROMEGA, Madison, WI, USA), 1 μL dNTPs 200 μM, 0.5 μL of each forward and reverse primers (Macrogen, Seoul, Republic of Korea), 20 μM, 0.2 μL of Gotaq® DNA polymerase (PROMEGA, Madison, WI, USA) (1×). Aliquots of 1 μL of DNA diluted 1:10 were used as template. PCR cycling conditions were as follows: 95 °C for 3 min, followed by 40 cycles of 95 °C for 30 s, 53 °C for 30 s, and 60 s at 72° C, with a final extension of 10 min at 72 °C. The negative controls were prepared using nuclease-free water as template. Amplified products were visualized in 1% agarose gels stained with ethidium bromide (0.2 μg/mL) under UV light. PCR products of the expected size were ligated into pGEM-T Easy cloning vector (PROMEGA, Madison, WI, USA) following the manufacturer´s instructions. Ligated products were used to transform Escherichia coli T-10 cells by heat shock [41]. Twenty-eight recombinant plasmids bearing expected size fragments were selected for unidirectional sequencing using M13F primers, at Macrogen, Seoul, Republic of Korea. For the PCR inhibition control test, a laboratory sequenced plasmid carrying a fragment of the 23S rRNA gene. Amplification of the 23S rRNA gene was conducted as previously reported [42].

2.7. Sequence Analysis

Sequences were edited using the free software Finch-TV (https://digitalworldbiology.com/FinchTV, accessed on 16 January 2022) to remove the vector sequences. The sequences were subjected to BLASTn analysis to determine the percentage of similarity of each mcyA sequence against all mcyA sequences available in the NCBI database. A total of 23 sequences of the mcyA gene fragment were obtained in this study and reported in GenBank under the following sequential accession numbers: ON156727, ON156728, ON156729, ON156730, ON156731, ON156732, ON156733, ON156734, ON156735, ON156736, ON156737, ON156738, ON156739, ON156740, ON156741, ON156742, ON156743, ON156744, ON156745, ON156746, ON156747, ON156748, and ON156749.

2.8. Phylogenetic Analysis

The matrix was constructed with 23 sequences isolated from water samples from this study and 24 sequences available at GenBank that were selected based on the first hit after a BLASTn search. A consensus phylogenetic tree was reconstructed using the Mega 11 free software [43], using the neighbor-joining method [44]. The bootstrap consensus tree was inferred from 1000 replicates. Branches corresponding to partitions reproduced in less than 50% bootstrap replicates were collapsed in the consensus tree, and bootstrap above this percentage are shown above each node. The tree was rooted using the mcyA gene of Nostoc sp. (Accession number KC699835).

2.9. Statistical Analysis

To establish whether there are significant differences in the physicochemical parameters, nutrients, and microcystin concentrations between the different areas of use (agricultural, urban, and recreational), a PERMANOVA was performed [45] using the PRIMER V6 software [46]. This analysis was carried out using a factor (areas) and a Euclidean distance matrix with 9999 permutations. If there were differences, a pairwise test was carried out to see which land use areas were different (PERMANOVA post hoc pairwise test).
Redundancy analysis (RDA) was used to directly explain the variation in microcystin concentrations (response variables) and the variables of physicochemical and nutrient parameters (explanatory variables). Physicochemical and nutrient parameter values were transformed using the log function, with an additional arbitrary constant of 0.001 to remove zeros before transformation [47]. The RDA analysis procedure was performed in R.4.1.2 [48].
Generalized additive models (GAM) were used to describe the nonlinear relationships of microcystin concentration and nutrient and physicochemical parameters: Chl-a (mg/m3), T (°C), EC (µS/cm), DO (mg/L), pH, N-NH4 (mg/L), N-NO2 (mg/L), N-NO3 (mg/L), P-PO43 (mg/L), and SiO2 (mg/L). GAM procedures were used with the “mgcv” package in R.4.1.2 [48]. The degrees of freedom (edf) were used to determine the amount of smoothing for each parameter; the closer the edf is to 1, the greater the linearity of the curve. p < 0.05 indicated a significant effect of the variables on microcystins. Before nonlinear fitting based on the GAM model, the values of physicochemical and nutrient parameters were log-transformed with an additional arbitrary constant of 0.001 to remove zeros before transformation [47].

3. Results

3.1. Physicochemical Variables

Physicochemical variables together with Chl-a and microcystin concentrations obtained per site are presented in Table 1. For comparison, all variables were grouped by area (urban, agricultural, and recreational), and the average values (Table 1) were used to determine the concentration differences from highest to lowest within each area. For the pH average value, a difference was observed from recreational, urban, and agricultural areas; for EC, the difference was urban, agricultural, and recreational areas; for DO, the difference was recreational, agricultural, and urban areas (Table 1). From all the average parameters analyzed, the EC showed a significant difference between groups (urban, agricultural, and recreational areas), since the pairwise tests-P (Perm) analysis confirmed that recreational sites were different from agricultural sites (EC A ≠ R p = 0.0019) and that urban sites were different from recreational (EC C ≠ R p = 0.0181).
Chl-a concentrations were not detected in two sites, while in 12 sites concentrations were detected within a range of 0.27 to 112.56 μg/L (Table 1). Based on the use of the Carlson’s Trophic State Index, different trophic levels were found in the water bodies under study. Eutrophic levels were found at two urban sites (C7 and C8), two agricultural sites (A5, A8), and one recreational site (R6). Mesotrophic levels were determined to occur in two agricultural sites (A7, A9) and four recreational sites (R7, R8, R9, and R10). Oligotrophic levels were detected in one urban site (C1) and two agricultural sites (A4 and A6).

3.2. Microcystin Concentrations in Water
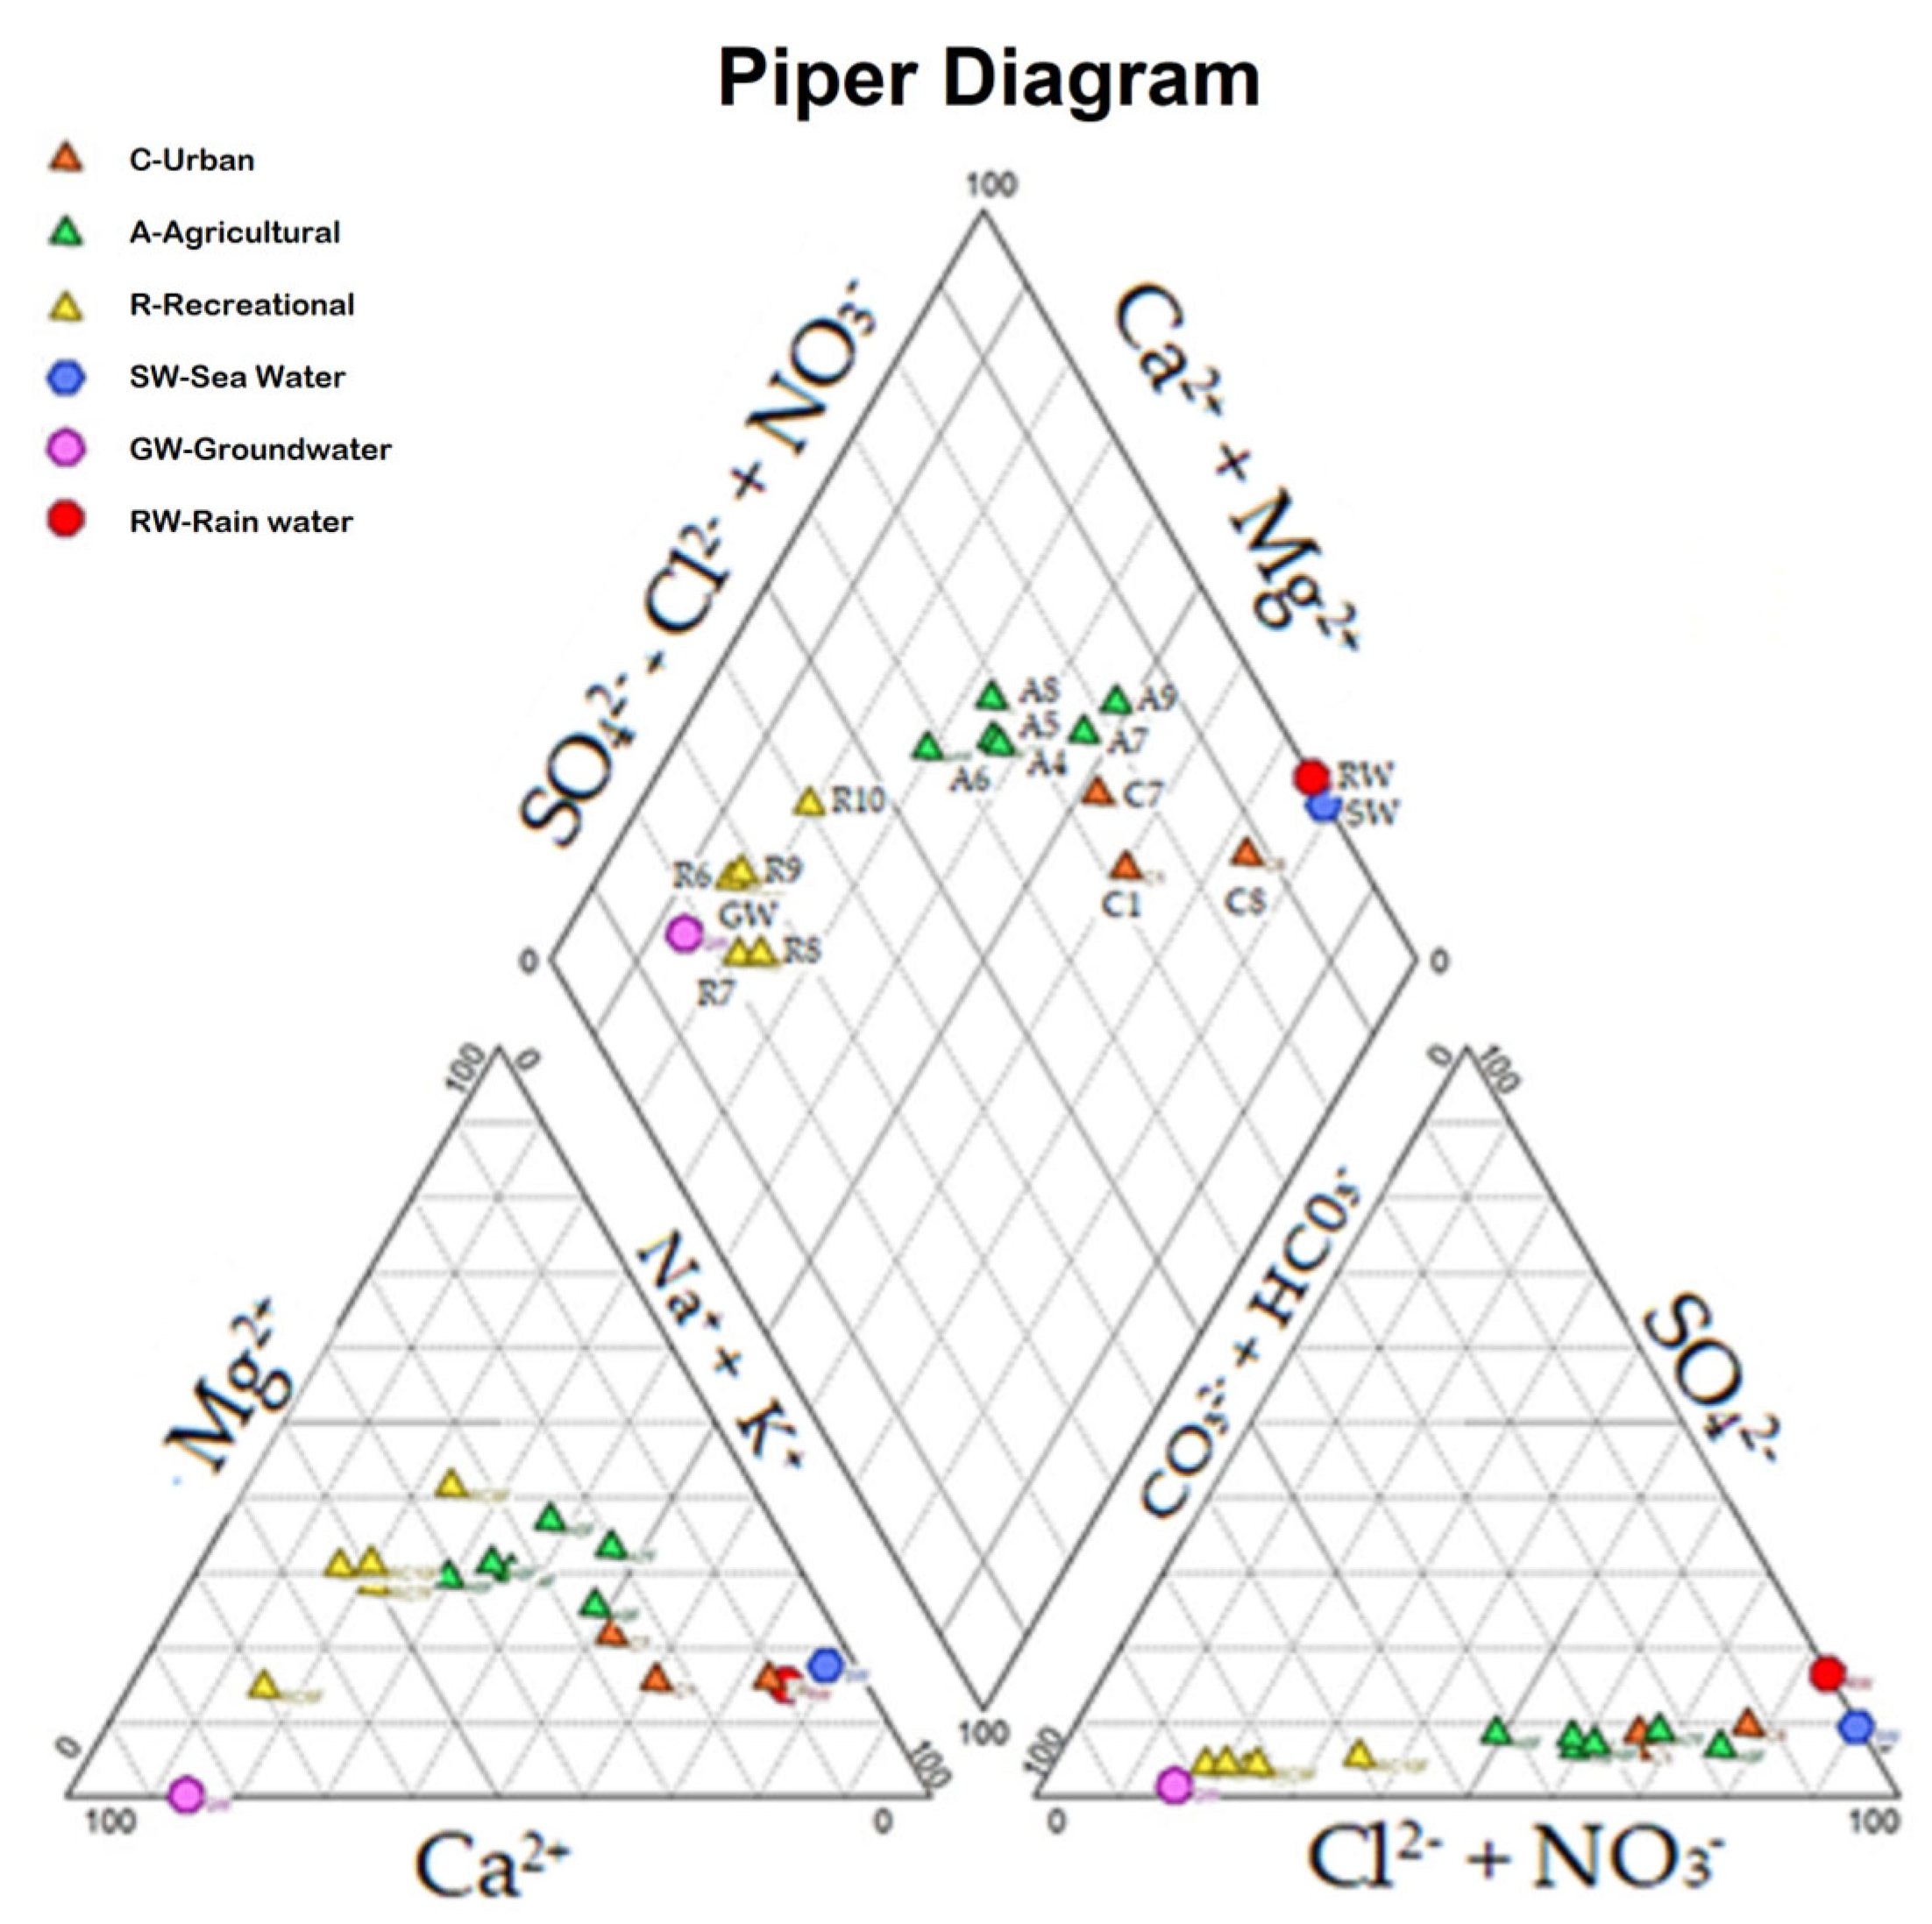
Microcystins were detected in all sites ranging from 0.14 to >5 µg/L, with average concentrations (from highest to lower) found in agricultural, urban, and recreational sites as follows: at agricultural sites the average of microcystin concentration was of 0.97 μg/L, whereas in urban sites the average concentration was of 0.46 μg/L, and in recreational sites the average concentration was of 0.36 μg/L (Table 1). However, statistical analyses showed no significant differences (p = 0.2582) between microcystin concentrations in urban, agricultural, or recreational sites. The concentration of microcystins in 21.4% (3/14) of the studied sites was >1.0 μg/ L (Table 1), which is the limit established by water quality standards for drinking water (PROY-NOM-127-SSA1-2017) [20]. These sites were C7 (urban area) and A5 and A7 (agricultural area) (Table 1). The highest microcystin concentration of >5 µg/L was detected in 14% (2/14) of the sites, being C7 (urban area) and A5 (agricultural area).
The redundancy analysis (RDA) showed no correlation between microcystin concentrations and the urban, agricultural, and recreational sites under study (p = 0.2582), as well as with nutrients (p = 0.844). Within all variables under study, a tendency associated with microcystins and Chl-a (F 6.3183, Pr (>F) 0.029) and pH (F 10.9775, Pr (>F) 0.024) were the only variables of significance (Table 2).

3.3. Hydrochemistry

Three water types were identified as follows: (1) calcium–magnesium–bicarbonate (Ca2+, Mg2+, HCO3) present in recreational sites (R6 to R10); (2) a mixture of calcium–magnesium–chloride (mixture Ca2+, Mg2+, Cl) present in four agricultural sites (A4, A5, A6, and A8); and (3) chlorinated sodium (Na+ Cl) present in two agricultural sites (A7 and A9) and three urban sites (C1, C7, and C8) (Figure 2). Significant differences were detected using the Mann–Whitney test (p ≤ 0.05) in regard to the ionic composition (anions Cl and SO42– and cations Mg2+, Na+, and K+) between agricultural (A5 to A9) and recreational sites (R6 to R10).

3.4. Nutrient Analysis

In 64.3% (9/14) of the sites, the concentration of N-NO2 was below the detection limit (LoD) (Table 3). The concentration range of N-NO3 was from 0.474 to 18.3 mg/L, where the lowest value was detected in site R10 (recreational area) and the highest in site A7 (agricultural site). In 21.4% (3/14), the concentration of N-NO3 was below the LoD (Table 3). For P-PO43−, the concentration range was of 0.38 to 2.5 mg/L, where the lowest value was detected in site R7 (recreational area) and the highest in A6 (agricultural area). In 57.1% (8/14) of the sites, the concentration of P-PO43− was below the LoD (Table 3). Dissolved inorganic nitrogen (DIN: NH4+ + NO3 + NO2) was within a range of 0.077–18.305 mg DIN/L per sampled site, where the lowest value was detected in site C1 and the highest in site A7, an agricultural site.
Nutrient concentrations obtained from urban, agricultural, and recreational sites were grouped to determine if significant differences were present between areas. The results showed N-NO3 (mg/L) was the parameter that showed statistically significant differences with the PERMANOVA analysis. Differences were found between urban–agricultural (p = 0.0125) and urban–recreational (p = 0.0197). No significant differences (p > 0.05) were observed for N-NH4+, N-NO2, and P-PO43− concentrations between sites.

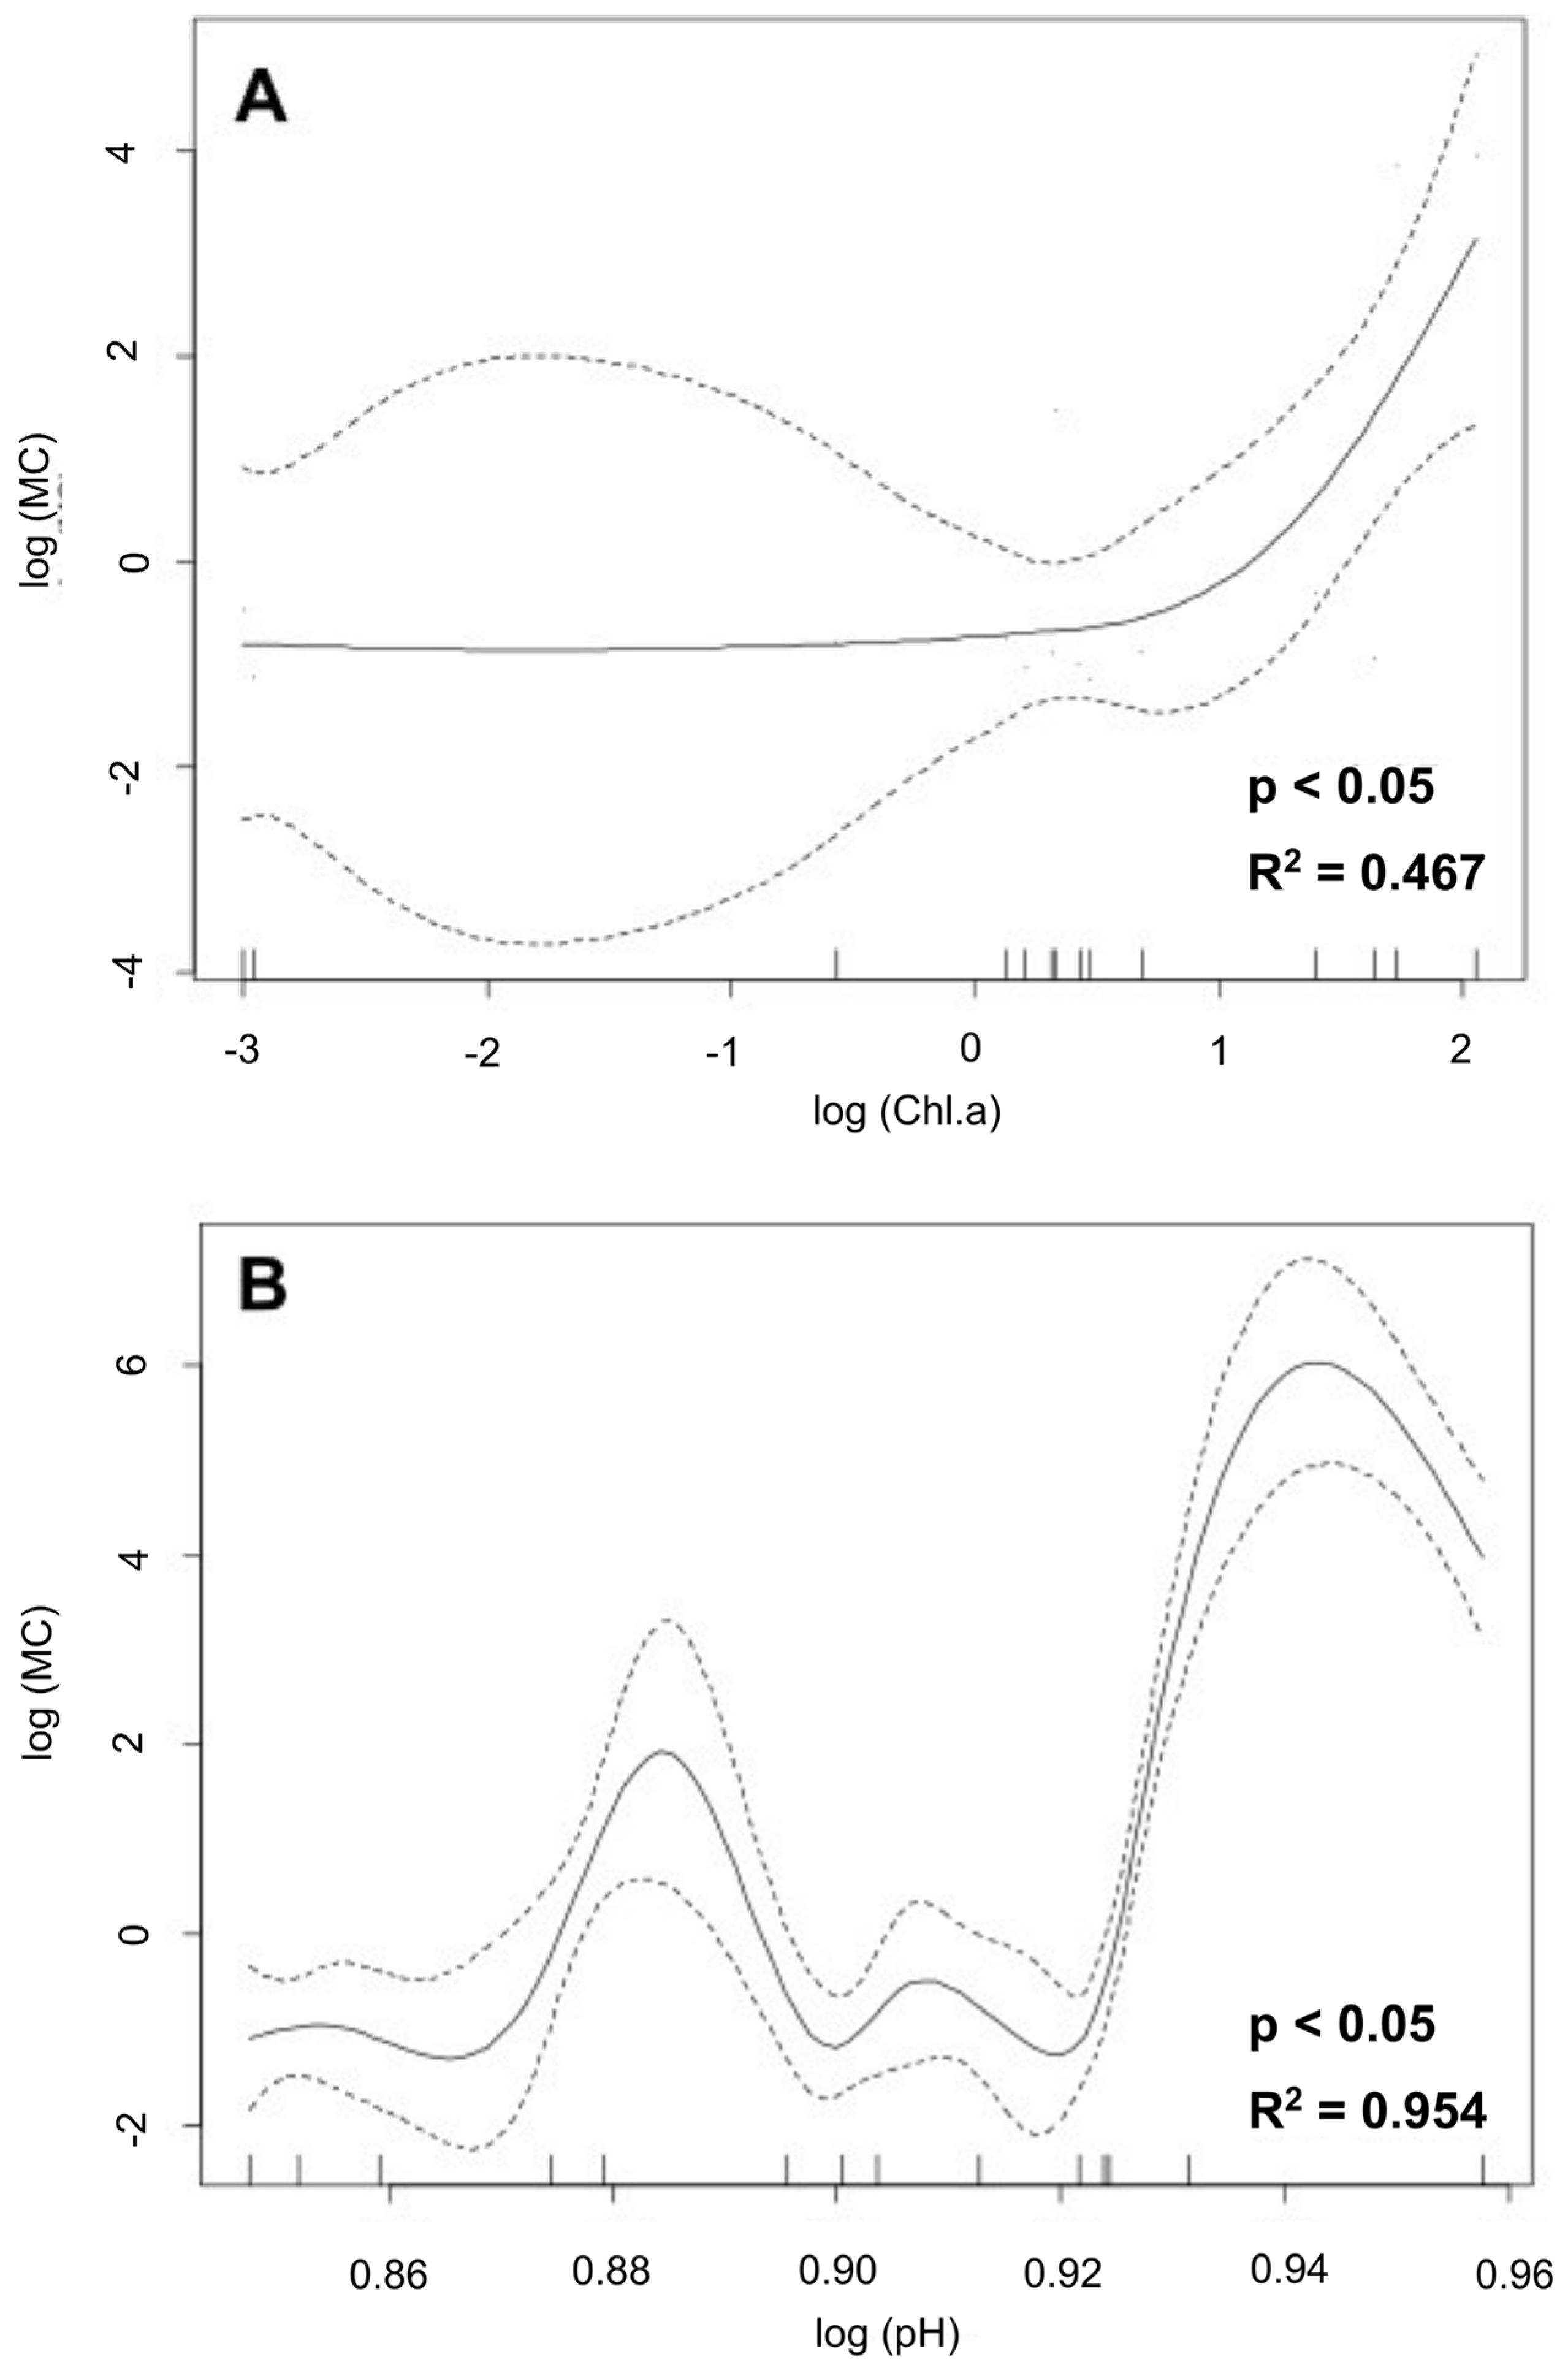
3.5. Generalized Additive Models (GAMs)

GAMs were used to describe the nonlinear relationships of microcystin concentrations with physicochemical and nutrient parameters. Chl-a and pH had a significant effect on microcystin concentrations (p < 0.05). The GAM analysis with the Chl-a variable explained 58.7% of the deviance in terms of microcystin concentrations (Figure 3A) (R2-adjusted = 0.467), and with the pH variable explained 98.5% of the deviance in microcystin concentrations (Figure 3B) (R2-adjusted = 0.954).

3.6. mcyA Gene Sequence Analysis

The successful amplification of the mcyA gene fragment was obtained from 28.5% (4/14) of the sites. A total of 23 sequences were isolated as follows: 30% (7/23) from site A5 (agricultural area), 22% (5/23) from site A7 (agricultural area), 22% (5/23) from site C7 (urban area), 26% (6/23) from site R9 (recreational area). The 23 isolated sequences shared 87 to 100% of nucleotide (nt) identity with previously reported sequences from HAB-forming species and mcyA partial gene sequences available at GenBank (Table 4). A more in-depth analysis showed that the sequences that shared the highest nt identity with the species M. aeruginosa, which represent 48% (11/23) of the total sequences isolated, 43% (10/23) of them shared the highest nt identity with sequences previously isolated from Brazil and 4% (1/23) of them shared the highest nt identity with a sequence previously reported from South Korea (Table 4). The 26% (6/23) of the sequences shared 95–99.7% of nt identity with Microcystis sp. previously reported from Finland and Germany. The rest of the isolated clones, which represent 26% (6/23) of the sequences, shared 87 to 100% of nt identity with previously reported sequences belonging to uncultured cyanobacteria (partial mcyA gene) reported from Canada and Florida (Table 4).

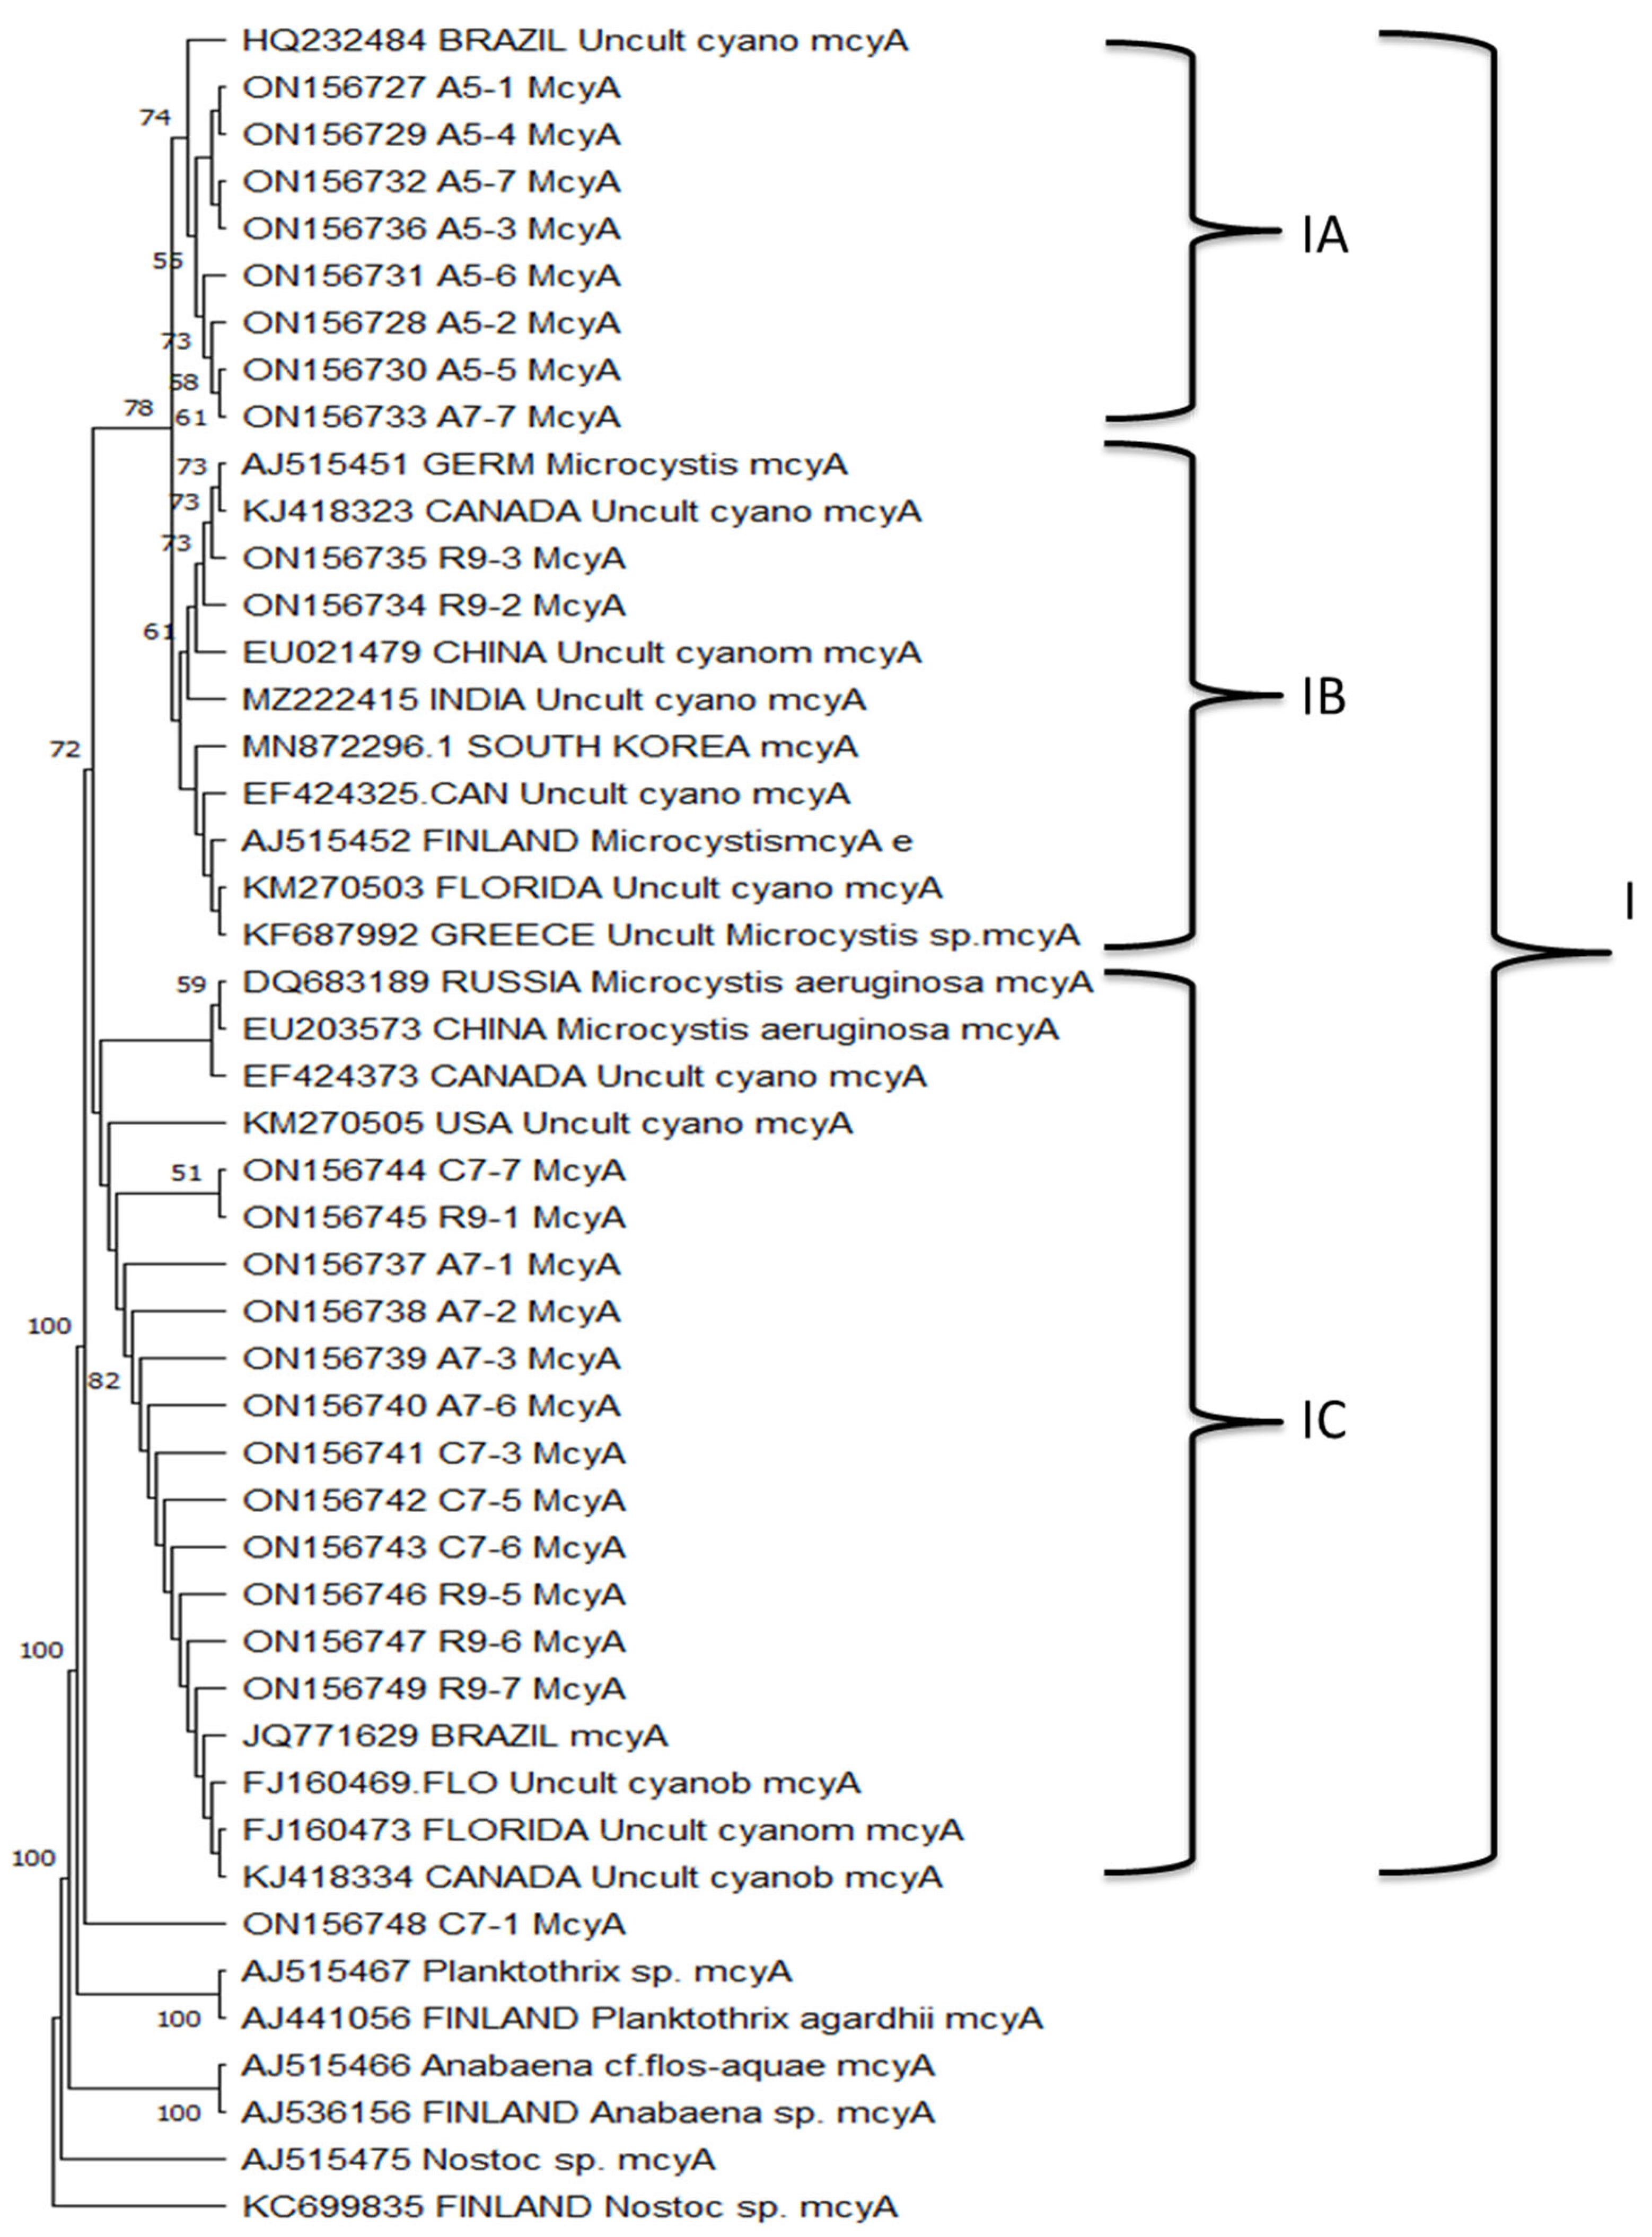
3.7. mcyA Phylogenetic Analysis

The phylogenetic analysis examined the probable relationship between the sequences of the mcyA fragment gene from water samples collected in the YPM relative to their corresponding sequences from GenBank. This analysis involved 47 nt sequences. Results showed that the 23 isolated mcyA sequences obtained in this study were grouped in one major clade, with three subclades (IA, IB, and IC). The subclade IA (bootstrap support of 74%) comprised eight sequences isolated from two agricultural sites (A5 and A7), together with an unidentified cyanobacterium previously reported in Brazil (Figure 4). The subclade IB (with a low bootstrap support of 61%) included two sequences isolated from one recreational site (R9) that grouped with uncultivated cyanobacteria and Microcystis mcyA gene sequences. The subclade IC (with no bootstrap support) comprised 12 sequences obtained from urban (C7), agricultural (A7), and recreational (R9) sites, together with other uncultured cyanobacteria mcyA gene sequences isolated from Canada, Florida, and the USA (Figure 4). The sequence ON156748 isolated from the urban site C7 was the only sequence isolated in this study that did not belong to Clade I, suggesting that it might be a diverse mcyA gene sequence (Figure 4).

4. Discussion

This study provides insights for the understanding of how water quality can be associated with the presence of toxin-producing cyanobacteria and microcystins in water bodies from a karst aquifer. The results obtained here highlight the potential risk to human and animal health in the studied area, since microcystins were detected at all sampled sites. The significant differences found in this study could be attributed to three causes: the first, the geological characteristics of the aquifer matrix presenting different types of water; the second, the geographical proximity to the coast with the consequent influence of saline intrusion into groundwater [49,50]; and the third, the entry of nutrients as the result of anthropogenic-related activities [51]. It is interesting to point out that in this study recreational sites showed the typical homogeneous chemical composition of groundwater that has been previously reported in the YPM [52], whereas urban sites and agricultural sites showed more variability in their chemical composition [53]. Particularly, agricultural sites showed early salinization processes occurring as a result of water type changes from a Ca-Cl water type to a Na-Cl composition [54]; in addition, their highest concentration of nitrate can be most likely attributed to the agricultural influence and runoff from agrochemicals used in the area [53,55].
Karst aquifers present in the YPM have alkaline pH due in part to the interaction of the water with the calcium carbonate contained in the karst [52]. In this study, higher pH values of 8.5 and 9.1 were correlated (R2 = 0.954; p < 0.05) with the highest concentrations of microcystin (≥5 µg/L), independently of the land use location of the water body in urban, agricultural, or recreational areas. It has been reported that light intensity and pH are the main factors that can influence cyanobacterial toxin production; in fact, in an in vitro culture of blue-green algae, microcystin production can increase dramatically between pH values of 7.0 and 9.2 [56]. In addition, in vitro competitive studies between green algae and cyanobacteria have suggested that in tropical climates with high temperatures (up to 35 °C) and alkaline conditions (pH 7–9), Microcystis can grow with advantageous effects over green algae [57]. Since pH is an important variable that can cause a response in Microcystis growth capacity [57], it can be expected that alkaline pH in the YPM aquifer can provide ideal conditions for the growth of toxin-producing cyanobacteria. Therefore, more in-depth studies should be conducted in the area considering not only all the different water body types that are present, but also the water quality changes among different climatic seasons and their relation to the presence of toxins and toxin-producing cyanobacteria.
The entries of nitrogen and phosphorus into the aquatic environment are key factors that promote the growth of cyanobacteria and the production of microcystins and harmful algal bloom formations [24,58,59]. Previous studies in the YPM demonstrate that nitrate concentrations in groundwater from agricultural areas can vary within climatic seasons reaching up to 8 mg/L [60]; moreover, Microcystis sp. is commonly reported to occur in urban and industrial areas [61] and is frequently reported in groundwater along the YPM [34,35,36]. In fact, in mono- or co-cultured systems M. aeruginosa show fast growth rates and high biomass accumulation at nitrate concentrations of 2.5 mg/L [62], which is below the highest values found in this study. Overall, the data reported here raise the potential risk of CyanHAB production by Microcystis species in the YPM.
In this study, ammonium was the main nutrient in water samples collected from urban sites, which could be attributed to the entry of domestic effluent and runoff from waste disposal sites in surrounding households [63] or recent mineralization of organic matter. However, the highest concentrations of N-NO3, N-NH4+, and P-PO43− were detected in water samples collected in the agricultural area, which can be associated with the extensive use of fertilizers [64]. Furthermore, in the karst system under study, a natural chemical process takes place due to the saturation of carbonates in the water, causing phosphorus to co-precipitate with calcium [65], and, in this study, the majority of the samples showed P-PO43− concentrations below the LoD, especially in urban sites. It has been reported that the maximum growth of M. aeruginosa is determined by dissolved inorganic nitrogen concentration and a minimum of P-PO43−, being the N and P ratio the main factor for growth rates [65], which in this study was found to be variable in urban, agricultural, and recreational areas.
The first report of microcystin concentrations occurring in groundwater in the YPM showed that the toxin was not present in all sampled sites, and the highest concentration detected was of <0.18 μg/L [25]; however, in this study conducted only a few years later, microcystin concentrations above 0.14 μg/L were detected in all of the sites, and the highest concentration was of >5 μg/L, which exceeds the limit established by water quality standards for drinking water in Mexico of 1 μg/L (PROY-NOM-127-SSA1-2017) [20]. The latter might indicate a potential health threat to humans and animals since microcystin concentrations in the karst aquifer of the YPM can be very variable; a more in-depth study considering the water body type, the season, and other environmental factors should be considered for a better understanding of such risks. It is well known that microcystin concentrations can be variable and can change within monthly periods; for example, in Lake Manatee in Florida microcystin concentrations were variable and reached up to 0.47 μg/L over the summer during algal blooms [66]. In Lake Okeechobee, an intense increase in CyanHAB was detected where Microcystis was identified as the dominant phytoplankton species in 2016, when a state of emergency was declared due to the toxicity of the water [67]. In Mexico, microcystins have been reported in concentrations between 4.9 and 78.0 μg/L in water that is used as a drinking source, as recreational areas, or for irrigation [68], in concentrations of >1 μg/L in drinking water sources [69], and in concentrations ranging from 0.2 and 2.4 μg/L in lake water [70]. Even though the number of samples in this study will not allow a generalization of the microcystins problem or the health risk in all water bodies of the YPM, it will be very important to continue exploring the presence of toxins in the water using combined methods that detect not only toxin-producing cyanobacteria but also microcystin concentrations that can represent a health risk.
In this study, the use of molecular methods to identify toxin-producing cyanobacteria based in the mcyA gene were successful to identify species belonging to Microcystis genus; however, there was no correlation with the presence of the mcyA gene and microcystins. In fact, it has been proposed that toxin-producing genes are more than often not proper markers or indicators for the presence of toxins [2]. Nonetheless, there is a need for more data to reach conclusions about aquatic environments; for example, one limitation of this study is that the mcyA was not detected by PCR in all samples, even in samples where microcystins were present. The latter can be attributed to a limited number of samples or the low concentration of microcystins (below 1 μg/L) detected in most of the samples, which might be in part a result of a low concentration of toxin-producing cyanobacteria in the samples under study. Therefore, further studies could include a more diverse set of primers that allow the detection of other microcystin-producing genera such as Synechococcales and Nostocales that are abundant in water bodies in the YPM [34,35,36]. Microcystis or other cyanobacterial species that have the mcyA gene can present recombination events that occur within the sequences of the N-methyltransferase (NMT) domain, giving rise to new variants of the Mcy cluster [71]. Therefore, results from this study highlight the necessity for the implementation of a different set of primers for the detection of the Mcy operon [72] to expand the identification of toxin-producing cyanobacteria in the area, and to determine if toxin gene abundances are correlated with microcystins in this karst aquifer. Overall, this study provides data of the potential human and animal health risk due to the presence of toxins in the water environment and provides the first attempt to explore the use of toxin-producing genes as indicators of toxins in a karst aquifer. Finally, more in-depth studies should be conducted that combine the detection of toxin-producing genes and the toxins, in order to develop useful tools or indicators for the presence of toxins in the water environment of one of the largest karst aquifers in the world.

5. Conclusions

Microcystins were present at all study sites, regardless of the land use area in which the water was collected, and the concentrations found above the limit of the Mexican standards for drinking water indicate a potential health threat to humans and animals. The alkaline conditions of the karst aquifer correlated with microcystin concentrations, the constant input of nutrients that promote the growth of toxin-producing cyanobacteria, and the widespread presence of microcystins in water bodies of the YPM could increase in the near future the production of CyanHAB. A wide variety of mcyA sequences were recognized from only four samples and one pair of primers.

Author Contributions

Conceptualization, G.Á.-T., C.H.-Z. and O.A.M.V.; methodology, E.C.-E., G.R.-G., V.H.C.-J. and D.O.-C.; software, G.Á.-T. and G.A.-G.; validation, C.H.-Z., E.C.-E. and O.A.M.V.; formal analysis, G.Á.-T., G.A.-G. and O.A.M.V.; investigation, G.Á.-T.; writing—original draft preparation, G.Á.-T., C.H.-Z. and O.A.M.V.; writing—review and editing, O.A.M.V. and C.H.-Z.; supervision, O.A.M.V. and C.H.-Z.; project administration, C.H.-Z. and O.A.M.V. All authors have read and agreed to the published version of the manuscript.

Funding

Gerardo Ávila Torres was supported by a PhD scholarship number 705622 from Consejo Nacional de Ciencia y Tecnología (Conacyt). This research received no specific grant from anyfunding agency, all reagents were provided by Centro de Investigación Científica de Yucatán, A.C.

Institutional Review Board Statement

Not applicable.

Informed Consent Statement

Not applicable.

Data Availability Statement

The authors declare that all data generated or analyzed during this study are included in this published article. The data of sequences of the gene mcyA were deposited and are available in the GenBank (https://www.ncbi.nlm.nih.gov/genbank/).

Acknowledgments

We appreciate the help of Carlos Eduardo Muñoz Cortés, Rodrigo Rosemberg Hernández, and Rosa María Leal Bautista for their support during field work, and Antonio Almazán Becerril for his critical review of the manuscript. We also give special thanks to Melissa Lenczewski for her donation of reagents for microcystin concentration measurements.

Conflicts of Interest

The authors declare no conflict of interest.

References

  1. Wurtsbaugh, W.A.; Paerl, H.W.; Dodds, W.K. Nutrients, eutrophication and harmful algal blooms along the freshwater to marine continuum. Wiley Interdisciplinary Reviews. Water 2019, 6, e1373. [Google Scholar] [CrossRef]
  2. Beversdorf, L.J.; Chaston, S.D.; Miller, T.R.; McMahon, K.D. Microcystin mcyA and mcyE gene abundances are not appropriate indicators of microcystin concentrations in lakes. PLoS ONE 2015, 10, e0125353. [Google Scholar] [CrossRef] [PubMed]
  3. Kimambo, O.N.; Gumbo, J.R.; Chikoore, H. The occurrence of cyanobacteria blooms in freshwater ecosystems and their link with hydro-meteorological and environmental variations in Tanzania. Heliyon 2019, 5, e01312. [Google Scholar] [CrossRef]
  4. Sinha, R.; Pearson, L.A.; Davis, T.W.; Burford, M.A.; Orr, P.T.; Neilan, B.A. Increased incidence of Cylindrospermopsis raciborskii in temperate zones—Is climate change responsible? Water Res. 2012, 46, 1408–1419. [Google Scholar] [CrossRef] [PubMed]
  5. Beretta-Blanco, A.; Carrasco-Letelier, L. Relevant factors in the eutrophication of the Uruguay River and the Río Negro. Sci. Total Environ. 2021, 761, 143–299. [Google Scholar] [CrossRef] [PubMed]
  6. Zou, W.; Zhu, G.; Cai, Y.; Xu, H.; Zhu, M.; Gong, Z.; Qin, B. Quantifying the dependence of cyanobacterial growth to nutrient for the eutrophication management of temperate-subtropical shallow lakes. Water Res. 2020, 177, 115806. [Google Scholar] [CrossRef]
  7. Giannuzzi, L.; Hernando, M. The Eco-Physiological Role of Microcystis aeruginosa in a Changing World. Microorganisms 2022, 10, 685. [Google Scholar] [CrossRef] [PubMed]
  8. Mowe, M.A.; Porojan, C.; Abbas, F.; Mitrovic, S.M.; Lim, R.P.; Furey, A.; Yeo, D.C. Rising temperatures may increase growth rates and microcystin production in tropical Microcystis species. Harmful Algae 2015, 50, 88–98. [Google Scholar] [CrossRef]
  9. Paerl, H.W.; Otten, T.G. Harmful cyanobacterial blooms: Causes, consequences, and controls. Microb. Ecol. 2013, 65, 995–1010. [Google Scholar] [CrossRef]
  10. Sangolkar, L.N.; Maske, S.S.; Muthal, P.L.; Kashyap, S.M.; Chakrabarti, T. Isolation and characterization of microcystin producing Microcystis from a Central Indian water bloom. Harmful Algae 2009, 8, 674–684. [Google Scholar] [CrossRef]
  11. Álvarez, X.; Valero, E.; Santos, R.M.; Varandas, S.G.P.; Fernandes, L.S.; Pacheco, F.A.L. Anthropogenic nutrients and eutrophication in multiple land use watersheds: Best management practices and policies for the protection of water resources. Land Use Policy 2017, 69, 1–11. [Google Scholar] [CrossRef]
  12. Paerl, H.W. Mitigating toxic planktonic cyanobacterial blooms in aquatic ecosystems facing increasing anthropogenic and climatic pressures. Toxins 2018, 10, 76. [Google Scholar] [CrossRef] [PubMed]
  13. Kubickova, B.; Babica, P.; Hilscherová, K.; Šindlerová, L. Effects of cyanobacterial toxins on the human gastrointestinal tract and the mucosal innate immune system. Environ. Sci. Eur. 2019, 31, 1–27. [Google Scholar] [CrossRef]
  14. Schaefer, A.M.; Yrastorza, L.; Stockley, N.; Harvey, K.; Harris, N.; Grady, R.; Sullivan, J.; McFarland, M.; Reif, J.S. Exposure to microcystin among coastal residents during a cyanobacteria bloom in Florida. Harmful Algae 2020, 92, 101769. [Google Scholar] [CrossRef] [PubMed]
  15. Francis, G. Poisonous Australian Lake. Nature 1878, 18, 11–12. [Google Scholar] [CrossRef]
  16. Codd, G.A.; Bell, S.G.; Brooks, W.P. Cyanobacterial toxins in water. Water Sci. Technol. 1989, 21, 1–13. [Google Scholar] [CrossRef]
  17. Stewart, I.; Seawright, A.A.; Shaw, G.R. Cyanobacterial poisoning in livestock, wild mammals and birds—An overview. State of the Science and Research Needs. Adv. Exp. Med. Biol. 2008, 619, 613–637. [Google Scholar] [CrossRef]
  18. McLellan, N.L.; Manderville, R.A. Toxic mechanisms of microcystins in mammals. Toxicol. Res. 2017, 6, 391–405. [Google Scholar] [CrossRef]
  19. Pouria, S.; de Andrade, A.; Barbosa, J.; Cavalcanti, R.L.; Barreto, V.T.S.; Ward, C.J.; Preiser, W.; Poon, G.K.; Neild, G.H.; Codd, G.A. Fatal microcystin intoxication in hemodialysis unit in Caruaru, Brazil. Lancet 1998, 352, 21–26. [Google Scholar] [CrossRef]
  20. SEGOB. Proyecto de Norma Oficial Mexicana PROY-NOM-127-SSA1-2017, Agua para Uso y Consumo Humano. Límites Permisibles de la Calidad del Agua; SEGOB: Mexico City, Mexico, 2017. [Google Scholar]
  21. SEGOB Agua Determinación de Acidez Total y Alcalinidad Total, Norma Oficial Mexicana NOM-AA-36-1980.DOF01/08/2001. Available online: https://www.dof.gob.mx/nota_detalle.php?codigo=761733&fecha=01/08/2001#gsc.tab=0 (accessed on 31 March 2023).
  22. Arzate-Cárdenas, M.A.; Olvera-Ramírez, R.; Martínez-Jerónimo, F. Microcystis toxigenic strains in urban lakes: A case of study in Mexico City. Ecotoxicology 2010, 19, 1157–1165. [Google Scholar] [CrossRef]
  23. Pineda-Mendoza, R.M.; Briones-Roblero, C.I.; Gonzalez-Escobedo, R.; Rivera-Orduña, F.N.; Martínez-Jerónimo, F.; Zúñiga, G. Seasonal changes in the bacterial community structure of three eutrophicated urban lakes in Mexico City, with emphasis on Microcystis spp. Toxicon 2020, 179, 8–20. [Google Scholar] [CrossRef]
  24. Montero, E.; Vázquez, G.; Caballero, M.; Favila, M.E.; Martínez-Jerónimo, F. Seasonal variation of Microcystis aeruginosa and factors related to blooms in a deep warm monomictic lake in Mexico. J. Limnol. 2021, 80, 1–20. [Google Scholar] [CrossRef]
  25. Cagle, S.E.; Roelke, D.L.; Hernández-Zepeda, C.; Rosiles-González, G.; Carrillo-Jovel, V.H.; Ortega-Camacho, D.; Cejudo, E. Cyanobacteria and nitrates in karstic systems of Yucatan (Mexico) and Texas (USA). Aquat. Sci. 2021, 83, 74. [Google Scholar] [CrossRef]
  26. Guardiola, J.; González-Gómez, F.; Lendechy-Grajales, Á. The Influence of Water Access in Subjective Well-Being: Some Evidence in Yucatan, Mexico. Soc. Indic. Res. 2013, 110, 207–218. [Google Scholar] [CrossRef]
  27. Baxa, D.V.; Kurobe, T.; Ger, K.A.; Lehman, P.W.; Teh, S.J. Estimating the abundance of toxic Microcystis in the San Francisco Estuary using quantitative real-time PCR. Harmful Algae 2010, 9, 342–349. [Google Scholar] [CrossRef]
  28. Feist, S.M.; Lance, R.F. Genetic detection of freshwater harmful algal blooms: A review focused on the use of environmental DNA (eDNA) in Microcystis aeruginosa and Prymnesium parvum. Harmful Algae 2021, 110, 102124. [Google Scholar] [CrossRef]
  29. Hisbergues, M.; Christiansen, G.; Rouhiainen, L.; Sivonen, K.; Börner, T. PCR-based identification of microcystin-producing genotypes of different cyanobacterial genera. Arch. Microbiol. 2003, 180, 402–410. [Google Scholar] [CrossRef]
  30. Li, D.; Gu, A.Z.; He, M. Quantification and genetic diversity of total and microcystin-producing Microcystis during blooming season in Tai and Yang-cheng lakes, China. J. Appl. Microbiol. 2014, 116, 1482–1494. [Google Scholar] [CrossRef]
  31. Sidelev, S.I. A Novel Multiplex PCR-based Technique for Detection of Toxigenic Cyanobacteria. Microbiology 2019, 88, 375–377. [Google Scholar] [CrossRef]
  32. Tillett, D.; Dittmann, E.; Erhard, M.; von Döhren, H.; Börner, T.; Neilan, B.A. Structural organization of microcystin biosynthesis in Microcystis aeruginosa PCC7806: An integrated peptide-polyketide synthetase system. Chem. Biol. 2000, 7, 753–764. [Google Scholar] [CrossRef]
  33. Li, L.; Jia, R.; Liu, Y.; Zhang, H. Detection of microcystin-producing cyanobacteria in a reservoir by whole cell quantitative PCR. Procedia Environ. Sci. 2011, 10, 2272–2279. [Google Scholar] [CrossRef]
  34. Schmitter-Soto, J.J.; Comín, F.A.; Escobar-Briones, E.; Herrera-Silveira, J.; Alcocer, J.; Suárez-Morales, E.; Steinich, B. Hydrogeochemical and biological characteristics of cenotes in the Yucatan Peninsula (SE Mexico). Hydrobiologia 2002, 467, 215–228. [Google Scholar] [CrossRef]
  35. Tavera, R.; Novelo, E.; López, S. Cyanoprokaryota (Cyanobacteria) in karst environments in Yucatan, Mexico. Bot. Sci. 2013, 91, 27–52. [Google Scholar] [CrossRef]
  36. Valadez, F.; Rosiles-González, G.; Almazán-Becerril, A.; Merino-Ibarra, M. Las cianobacterias planctonicas del lago tropical carstico Lagartos de la Peninsula de Yucatan, Mexico. Rev. Biol. Trop. 2013, 61, 971–979. [Google Scholar] [CrossRef]
  37. Strickland, J.D.; Parsons, T.R. A Practical Handbook of Seawater Analysis; Fisheries Research Board of Canada: Ottawa, ON, Canada, 1972. [Google Scholar] [CrossRef]
  38. Bower, C.E.; Holm-Hansen, T. A salicylate–hypochlorite method for determining ammonia in seawater. Can. J. Fish. Aquat. Sci. 1980, 37, 794–798. [Google Scholar] [CrossRef]
  39. Lorenzen, C.J. Determination of Chlorophyll and Pheo-Pigments: Spectrophotometric equations. Limnol. Oceanogr. 1967, 12, 343–346. [Google Scholar] [CrossRef]
  40. Fernandez-Figueroa, E.G.; Buley, R.P.; Barros, M.U.; Gladfelter, M.F.; McClimans, W.D.; Wilson, A.E. Carlson’s Trophic State Index is a poor predictor of cyanobacterial dominance in drinking water reservoirs. AWWA Water Sci. 2021, 3, e1219. [Google Scholar] [CrossRef]
  41. Sambrook, J.; Russell, D.W. Molecular Cloning—A Laboratory Manual, 3rd ed.; Cold Spring Harbor Laboratory Press: Long Island, NY, USA, 2001. [Google Scholar]
  42. Sherwood, A.R.; Presting, G.G. Universal primers amplify a 23S rDNA plastid marker in eukaryotic algae and cyanobacteria. J. Phycol. 2007, 43, 605–608. [Google Scholar] [CrossRef]
  43. Kumar, S.; Stecher, G.; Li, M.; Knyaz, C.; Tamura, K. MEGA X: Molecular Evolutionary Genetics Analysis across computing platforms. Mol. Biol. Evol. 2018, 35, 1547–1549. [Google Scholar] [CrossRef]
  44. Saitou, N.; Nei, M. The neighbor-joining method: A new method for reconstructing phylogenetic trees. Mol. Biol. Evol. 1987, 4, 406–425. [Google Scholar] [CrossRef]
  45. Anderson, M.J.; Walsh, D.C. PERMANOVA, ANOSIM, and the Mantel test in the face of heterogeneous dispersions: What null hypothesis are you testing? Ecol. Monogr. 2013, 83, 557–574. [Google Scholar] [CrossRef]
  46. Clarke, K.R.; Gorley, R.N. PRIMER v6: User Manual/Tutorial, 190; PRIMER-E: Plymouth, UK, 2006. [Google Scholar]
  47. Le Hen, G.; Balzani, P.; Haase, P.; Kouba, A.; Liu, C.; Nagelkerke, L.A.J.; Theissen, N.; Renault, D.; Soto, I.; Haubrock, P.J. Alien species and climate change drive shifts in a riverine fish community and trait compositions over 35 years. Sci. Total Environ. 2023, 867, 161486. [Google Scholar] [CrossRef] [PubMed]
  48. R Development Core Team. R: A Language and Environment for Statistical Computing; R Foundation for Statistical Computing: Vienna, Austria, 2019; Available online: https://www.R-project.org (accessed on 21 April 2023).
  49. Pacheco, J.; Marín, L.; Cabrera, A.; Steinich, B.; Escolero, O. Nitrate Temporal and Spatial Patterns in 12 Water-Supply Wells, Yucatan, Mexico. Environ. Geol. 2001, 40, 708–715. [Google Scholar] [CrossRef]
  50. Moujabber, M.; Samra, B.; Darwish, T.; Atallah, T. Comparison of Different Indicators for Groundwater Contamination by Seawater Intrusion on the Lebanese Coast. Water Resour. Manag. 2006, 20, 161–180. [Google Scholar] [CrossRef]
  51. Asare, A.; Appiah-Adjei, E.K.; Ali, B.; Owusu-Nimo, F. Assessment of Seawater Intrusion Using Ionic Ratios: The Case of Coastal Communities along the Central Region of Ghana. Environ. Earth Sci. 2021, 80, 1–14. [Google Scholar] [CrossRef]
  52. Perry, E.; Velázquez-Oliman, G.; Marín, L. The Hydrogeochemistry of the Karst Aquifer System of the Northern Yucatan Peninsula, Mexico. Int. Geol. Rev. 2002, 44, 191–221. [Google Scholar] [CrossRef]
  53. Ye, X.; Zhou, Y.; Lu, Y.; Du, X. Hydrochemical Evolution and Quality Assessment of Groundwater in the Sanjiang Plain, China. Water 2022, 14, 1265. [Google Scholar] [CrossRef]
  54. Sarker, M.; Rahman, M.; Van Camp, M.; Hossain, D.; Islam, M.; Ahmed, N.; Masud Karim, M.; Quaiyum Bhuiyan, M.A.; Walraevens, K. Groundwater Salinization and Freshening Processes in Coastal Aquifers from Southwest Bangladesh. Sci. Total Environ. 2021, 779, 146339. [Google Scholar] [CrossRef] [PubMed]
  55. Ahamad, A.; Madhav, S.; Singh, P.; Pandey, J.; Khan, A.H. Assessment of Groundwater Quality with Special Emphasis on Nitrate Contamination in Parts of Varanasi City, Uttar Pradesh, India. Appl. Water Sci. 2018, 8, 1–13. [Google Scholar] [CrossRef]
  56. Song, L.; Sano, T.; Li, R.; Watanabe, M.M.; Liu, Y.; Kaya, K. Microcystin production of Microcystis viridis (cyanobacteria) under different culture conditions. Phycol. Res. 1998, 46, 19–23. [Google Scholar] [CrossRef]
  57. Yang, J.; Tang, H.; Zhang, X.; Zhu, Z.; Huang, Y.; Yang, Z. High temperature and pH favor Microcystis aeruginosa to outcompete Scenedesmus obliquus. Environ. Sci. Pollut. Res. 2018, 25, 4794–4802. [Google Scholar] [CrossRef] [PubMed]
  58. Dai, R.; Wang, P.; Jia, P.; Zhang, Y.; Chu, X.; Wang, Y. A review on factors affecting microcystins production by algae in aquatic environments. World J. Microbiol. Biotechnol. 2016, 32, 51. [Google Scholar] [CrossRef] [PubMed]
  59. Li, J.; Zhang, J.; Huang, W.; Kong, F.; Li, Y.; Xi, M.; Zheng, Z. Comparative bioavailability of ammonium, nitrate, nitrite and urea to typically harmful cyanobacterium Microcystis aeruginosa. Mar. Pollut. Bull. 2016, 110, 93–98. [Google Scholar] [CrossRef]
  60. Smith, D.N.; Ortega-Camacho, D.; Acosta-González, G.; Leal-Bautista, R.M.; Fox III, W.E.; Cejudo, E. A multi-approach assessment of land use effects on groundwater quality in a karstic aquifer. Heliyon 2020, 6, e03970. [Google Scholar] [CrossRef]
  61. Herrera-Silveira, J.A.; Martín, B.M.; Díaz-Arce, V. Variaciones del fitoplancton en cuatro lagunas costeras del Estado de Yucatán, México. Rev. Biol. Trop. 2016, 47, 47–56. Available online: https://revistas.ucr.ac.cr/index.php/rbt/article/view/26140 (accessed on 31 January 2023).
  62. Tan, X.; Gu, H.; Ruan, Y.; Zhong, J.; Parajuli, K.; Hu, J. Effects of nitrogen on interspecific competition between two cell-size cyanobacteria: Microcystis aeruginosa and Synechococcus sp. Harmful Algae 2019, 89, 101661. [Google Scholar] [CrossRef] [PubMed]
  63. Böhlke, J.K.; Smith, R.L.; Miller, D.N. Ammonium transport and reaction in contaminated groundwater: Application of isotope tracers and isotope fractionation studies. Water Resour. Res. 2006, 42, 4349. [Google Scholar] [CrossRef]
  64. González-Herrera, R.; Martinez-Santibañez, E.; Pacheco-Avila, J.; Cabrera-Sansores, A. Leaching and dilution of fertilizers in the Yucatan karstic aquifer. Environ. Earth Sci. 2014, 72, 2879–2886. [Google Scholar] [CrossRef]
  65. Kim, H.; Jo, B.Y.; Kim, H.S. Effect of different concentrations and ratios of ammonium, nitrate, and phosphate on growth of the blue-green alga (cyanobacterium) Microcystis aeruginosa isolated from the Nakdong River, Korea. Algae 2017, 32, 275–284. [Google Scholar] [CrossRef]
  66. Melaram, R.; Lopez-Dueñas, B. Detection and Occurrence of Microcystins and Nodularins in Lake Manatee and Lake Washington-Two Floridian Drinking Water Systems. Front. Water 2022, 4, 899572. [Google Scholar] [CrossRef]
  67. Kramer, B.J.; Davis, T.W.; Meyer, K.A.; Rosen, B.H.; Goleski, J.A.; Dick, G.J.; Gobler, C.J. Nitrogen limitation, toxin synthesis potential, and toxicity of cyanobacterial populations in Lake Okeechobee and the St. Lucie River Estuary, Florida, during the 2016 state of emergency event. PLoS ONE 2018, 13, e0196278. [Google Scholar] [CrossRef]
  68. Vasconcelos, V.; Martins, A.; Vale, M.; Antunes, A.; Azevedo, J.; Welker, M.; Lopez, O.; Montejano, G. First report on the occurrence of microcystins in planktonic cyanobacteria from Central Mexico. Toxicon 2010, 56, 425–431. [Google Scholar] [CrossRef] [PubMed]
  69. Alillo-Sánchez, J.L.; Gaytán-Herrera, M.L.; Martínez-Almeida, V.M.; Ramírez-García, P. Microcystin-LR equivalents and their correlation with Anabaena spp. in the main reservoir of a hydraulic system of Central Mexico. Inland Waters 2014, 4, 327–336. [Google Scholar] [CrossRef]
  70. Zamora-Barrios, C.A.; Nandini, S.; Sarma, S.S.S. Effect of crude extracts from cyanobacterial blooms in Lake Texcoco (Mexico) on the population growth of Brachionus calyciflorus (Rotifera). Toxicon 2017, 139, 45–53. [Google Scholar] [CrossRef]
  71. Tooming-Klunderud, A.; Mikalsen, B.; Kristensen, T.; Jakobsen, K.S. The mosaic structure of the mcyABC operon in Microcystis. Microbiology 2008, 154, 1886–1899. [Google Scholar] [CrossRef] [PubMed]
  72. Lee, J.; Choi, J.; Fatka, M.; Swanner, E.; Ikuma, K.; Liang, X.; Howe, A. Improved detection of mcyA genes and their phylogenetic origins in harmful algal blooms. Water Res. 2020, 176, 115730. [Google Scholar] [CrossRef]
Figure 1. Map showing the location of the sampling sites in the Yucatan peninsula in Mexico (YPM).
Microbiolres 14 00078 g001
Figure 2. Piper’s diagram showing the values in meq/L of anions (bottom right triangle) and cations (bottom left triangle). The upper rhombus comprises the points of intersection of lines parallel to the vertical axes that join the points of anions (right triangle) and cations (left triangle) of each site. The orange triangles correspond to the urban sites C1, C7, and C8 (chlorinated). Green triangles correspond to the agricultural sites A4, A5, A6, A7, A8, and A9 (chlorinated). The yellow triangles correspond to the recreational sites R6, R7, R8, R9, and R10 (bicarbonate). The blue circles correspond to seawater, whereas the purple circles correspond to groundwater and the red circles to rainwater.
Microbiolres 14 00078 g002
Figure 3. Generalized additive models (GAMs) showing a graphical expression between Chl-a (A) or pH (B) and microcystin concentrations.
Microbiolres 14 00078 g003
Figure 4. Phylogenetic reconstruction based in the mcyA-sequence-inferred phylogenetic relationships of sequences isolated from water samples in this study. The analysis also includes the mcyA sequence from selected reference sequences available in the GenBank database. Only bootstrap values above 50% are shown. The Microcystis aeruginosa mcyB gene isolate was used as root. All GenBank accession numbers are included in the name of each sequence.
Microbiolres 14 00078 g004
Table 1. Physicochemical variables of pH, temperature (T), electrical conductivity (EC), and dissolved oxygen (DO) obtained from each site; and chlorophyll-a (Chl-a) and microcystin (MC) concentrations per site. Average values of each variable are presented in urban, agricultural, and recreational sites.
SitepHT
°C
EC
µS/cm
DO
mg/L
Chl-a
mg/m3
MC
µg/L
C18.1830.40710.006.900.270.51
C78.5427.601205.007.9053.46>5.00
C87.1027.405050.001.104.810.41
Average of each variable in urban sites7.9428.472321.675.3019.510.46
A47.2325.901231.001.80n.d.0.15
A59.0725.20824.005.00112.86>5.00
A67.4926.901010.001.50n.d.0.81
A77.5726.901372.009.102.142.77
A88.4028.801058.0015.7025.060.98
A97.0427.901700.001.102.940.14
Average of each variable in agricultural sites7.8026.931199.175.7023.830.97
R68.0126.30460.006.9043.440.34
R77.8626.40648.0013.002.670.28
R87.9527.20561.009.101.340.54
R98.3528.40531.009.002.060.39
R108.3927.40459.008.401.600.25
Average of each variable in recreational sites8.1127.14531.809.2810.220.36
n.d. = not detected.
Table 2. Redundancy analysis (RDA).
RDA1PC1
Eigenvalue2.43370.7521
Proportion Explained0.76390.2361
Cumulative Proportion0.76391
Total variance = 1.0000; RDA was not statistically significant at p > 0.05.
Table 3. Concentrations of ammonium N-NH4+ (LoD 0.007 mg/L), nitrite N-NO2 (LoD 0.005 mg/L), nitrate N-NO3 (LoD 0.05 mg/L), and orthophosphates P-PO43− (LoD 0.05 mg/L) detected in each selected study site. Average values are presented in urban, agricultural, and recreational sites.
SiteN-NH4+ mg/LS.D.N-NO2 mg/LS.D.N-NO3 mg/LS.D.P-PO43− mg/LS.D.
C10.0280.0010.0240.0010.025 *-0.025 *-
C70.140.0020.0025 *-0.025 *-0.025 *-
C80.7310.0010.0025 *-0.025 *-0.025 *-
Average of each variable in urban sites0.30 0.01-0.03-0.03-
S.E.0.18 0.01 0.00 0.00
A40.0035 *-1.5870.0404.120.2200.025 *-
A50.1030.0010.0025 *-0.9020.0960.025 *-
A61.0720.0170.0025 *-0.7760.0272.50.053
A70.0035 *-0.0190.00018.32.2901.040.010
A80.0035 *-0.0025 *-0.8240.0961.090.005
A90.350.0330.1850.026.410.1370.025 *-
Average of each variable in agricultural sites0.26 0.30 5.22 0.78
S.E.0.16 0.24 2.54 0.37
R60.110.0080.0025 *-0.6690.0410.025 *-
R70.0035 *-0.030.0001.780.0960.380.001
R80.0035 *-0.0025 *-0.3770.0130.620.016
R90.0035 *-0.0025 *-0.640.0271.310.022
R100.0035 *-0.0025 *-0.4740.0130.025 *-
Average of each variable in recreational sites0.02 0.01 0.79 0.47
S.E.0.02 0.005 0.23 0.21
* = Below limit of detection (LoD); S.D. = standard deviation; S.E. = standard error.
Table 4. Sequence analysis of the mcyA gene describing the sequence ID, and the results of the BLASTn search.
Sequence ID Accession NumGenBank DescriptionQuery CoveragePercentage of Nucleotide IdentityAccession Number and Location from Where the Sequence was Isolated
A7-1 ON156737 Microcystis aeruginosa NPLJ-4 peptide synthetase (mcyA) gene, partial cds97%97%JQ771629.1 BRAZIL
A7-2 ON15673897%99%
A7-3 ON156739
A7-6 ON156740
C7-3 ON156741
|C7-5 ON156742
C7-6 ON156743
R9-5 ON156746
R9-6 ON156747
C7-7 ON15674499%97%
A5-1 ON156727Microcystis aeruginosa NRERC-214 (mcyA) gene, partial cds95%95%MN872296.1 South Korea
A5-2 ON156728 Microcystis sp. 199 partial mcyA gene95%99%AJ515452.1 Finland
A7-7 ON156733
A5-5 ON15673098%
A5-4 ON15672998%98%
R9-2 ON156734Microcystis sp. HUB 5.2.4 partial mcyA gene95%99.70%AJ515451.1 Germany
R9-3 ON156735
A5-6 ON156731Uncultured cyanobacterium clone 01LO-IB7 (mcyA) gene, partial cds95%98.60%EF424325.1 Canada
R9-1 ON156745Uncultured cyanobacterium clone 1 (mcyA) gene, partial cds95%97.30%FJ160469 USA Florida
R9-7 ON15674989%100%
C7-1 ON156748Uncultured cyanobacterium clone 4 (mcyA) gene, partial cds95%87%FJ160473 USA Florida
A5-3 ON156736Uncultured cyanobacterium clone 6 protein (mcyA) gene, partial cds98%93.31KM270503.1 Canada
A5-7 ON15673295%94.8
Disclaimer/Publisher’s Note: The statements, opinions and data contained in all publications are solely those of the individual author(s) and contributor(s) and not of MDPI and/or the editor(s). MDPI and/or the editor(s) disclaim responsibility for any injury to people or property resulting from any ideas, methods, instructions or products referred to in the content.

