Article

Multi-Mycotoxin Contamination, Mold Incidence and Risk Assessment of Aflatoxin in Maize Kernels Originating from Nepal

by
Prateek Joshi
1,2,3,
Chananya Chauysrinule
4,
Warapa Mahakarnchanakul
2,* and
Thanapoom Maneeboon
4
1
Graduate School, Kasetsart University, Bangkok 10900, Thailand
2
Department of Food Science and Technology, Faculty of Agro-Industry, Kasetsart University, Bangkok 10900, Thailand
3
Ministry of Agriculture and Livestock Development, Singhadurbar, Kathmandu 44600, Nepal
4
Scientific Equipment and Research Division, Kasetsart University Research and Development Institute, Kasetsart University, Bangkok 10900, Thailand
*
Author to whom correspondence should be addressed.
Microbiol. Res. 2022, 13(2), 258-277; https://doi.org/10.3390/microbiolres13020021
Submission received: 17 April 2022 / Revised: 3 May 2022 / Accepted: 12 May 2022 / Published: 15 May 2022

Abstract

:
Occurrence of mycotoxins in staple foods is a major threat to attaining food safety in developing countries. The study investigated multi-mycotoxin contamination for the first time in Nepalese maize along with the incidence of molds in 45 samples of maize used as human food from 45 districts of Nepal. The samples were analyzed quantitatively for the presence of five different mycotoxins (total aflatoxins (AF), total fumonisins (FUM), ochratoxin (OT), zearalenone (ZEA) and (DON) deoxynivalenol) using the competitive direct ELISA technique. The most frequent occurrences were for DON (100%) and AF (78%) followed by FUM and ZEA (both 76%) and OT (62%). Interestingly, all the samples contained at least two mycotoxins while at least three or more mycotoxins were found in 87% of the samples. The most commonly reported binary, ternary and quaternary combinations were DON+AF, AF+FUM+DON and AF+FUM+ZEA+DON, respectively. The mean percentage kernel mold infection was 35.33% with Fusarium, Aspergillus, Rhizopus and Penicillium genera being the predominant molds. Six different species of Aspergillus and a single species of Fusarium were identified. The estimated daily intake, margin of exposure and risk of liver cancer from consuming maize were 30.46 ng/kg bw/day and 5.58 and 0.38 cancer cases/year/100,000 population, respectively. Since maize is the second-most consumed cereal in Nepal, the contamination levels of various mycotoxins and the incidence of molds identified in the study suggests that stricter control is needed to safeguard the health of the substantial population consuming maize as a staple diet.

1. Introduction

Mycotoxins are secondary metabolites formed by different types of molds that contaminate various staple foods and cause many kinds of harmful health effects in humans and animals. They can contaminate cereals, peanuts, cottonseed, forage grasses and other crops [1]. Generally, five kinds of mycotoxins occur frequently in food and feed: deoxynivalenol/nivalenol (DON/NIV), zearalenone (ZEA), ochratoxins (OT), fumonisins (FUM) and aflatoxins (AF) [2]. Consumption of mycotoxins in food can produce both acute and chronic toxicities having a variety of toxic effects including hemorrhagic, hepatotoxic, nephrotoxic, neurotoxic, estrogenic, teratogenic, immunosuppressive, mutagenic and carcinogenic [3].
The co-occurrence of various toxins produced by molds in the same food may alter the nature of toxicity to humans and animals due to possible antagonistic, additive or synergistic effects [4]. Although the synergism of mycotoxins could increase health risks, there has been little study on the combined effects of mycotoxins. Sometimes, it is possible that the threshold dose of toxicity may be exceeded when exposed to a mixture even though a single toxin exposure is less risky [5].
Maize is one of the main grain crops in Nepal after rice. Considering area and production, summer, spring and winter maize occupy about 73.9%, 14.2% and 11.9% of the area, respectively [6]. In Nepal overall, around 15% of total cereal consumption is contributed by maize, and for poor people, it is even higher (17–19%) [7]. According to Ranum et al. [8], per capita maize consumption in Nepal is 98 g/person/day. Likewise, Food and Agriculture Organization Corporate Statistical Database (FAOSTAT) [9] displays that 359 kcal/capita/day of energy for Nepalis is provided by maize, which is equivalent to 105 g/capita/day [10].
Traditional and non-technological post-harvest practices and open-air storage structures support the invasion of insects, mold progression and mycotoxin development [11]. In Nepal, several studies have revealed high incidence of aflatoxin contamination in maize having average prevalence about 50%. Likewise, almost 20 percent of the maize samples contained aflatoxin above the maximum permitted limit (MPL) of 20 µg/kg as set by the government of Nepal [10]. Similarly, various studies have revealed Fusarium species as the most common ear rotting fungi in Nepalese maize [12].
In Nepal, several studies have been carried out aiming at aflatoxins alone, but to date, very little effort has been made to investigate other mycotoxins. Furthermore, a broad exploration on the incidence of other types of mycotoxins is yet to be reported. Consequently, the current gathered data are predominantly of aflatoxin levels in limited commodities only. Very little or no information on multiple mycotoxin occurrence is available with regard to maize and maize-based diets. Therefore, the aim of this study was to investigate the frequency and contamination level of multi-mycotoxins (AF, OT, ZEA, FUM and DON) along with the incidence of molds and a risk assessment of aflatoxins in maize samples collected from various parts of the country.

2. Materials and Methods

2.1. Maize Samples

The samples of maize intended for human consumption were collected from local market, local retail shops or from the farmer cooperative shops in five provinces (Province-1, Bagmati, Gandaki, Lumbini and Karnali) of Nepal, with 9 from each contributing to the total of 45 samples. Samples (500 g) were randomly sampled and the locations in each province were chosen based on the high productivity of maize there. Maize samples were collected in December, which is winter season in Nepal. Since a majority of the maize (>70%) in Nepal is planted as summer maize, the maize samples that we collected can also be considered as summer maize planted pre-monsoon (April, May) and harvested in around August and stored for around 3 months. Sampling was carried out using a probe or by hand. Each sample was packaged into a plastic bag and stored at −20 °C in a freezer (Mirage, Bangkok, Thailand). Prior to mycotoxin analysis, 100 g of each sample was powdered (size less than 1 mm) using a blender machine (Waring, CT, USA).

2.2. Quantitation of Mycotoxins

Competitive direct ELISA in a microwell format based on VERATOX for aflatoxin, ochratoxin, zearalenone, fumonisin and deoxynivalenol test kits (Neogen Corporation, Lansing, MI, USA) was used for the quantitative analysis. Neogen’s sample preparation and extraction procedure for VERATOX were applied. Each sample (10 g) was first extracted in methanol solution (distilled water was used instead for DON) and vigorously shaken for a few minutes. Then, the samples were allowed to settle and were filtered before the filtrates were submitted to the ELISA test procedures recommended by NEOGEN (www.neogen.com, accessed on 22 August 2020). In general, the ELISA test procedure consisted of putting 100 µL of the control or sample in a red mixing well (duplicated), but for FUM, the filtrate was again diluted by adding in a prefilled dilution bottle and for ZEA analysis 1 mL of filtrate was diluted with 4 mL of distilled water before moving to the red mixing wells. After that, 100 µL of blue conjugate solution was added in all wells, which was mixed using a 12-channel pipettor before transferring 100 µL to the clear antibody-coated wells. The wells were allowed to stand for a few minutes before washing with deionized water. Then, 100 µL of green substrate solution was added and was allowed to stand for a few minutes before pouring in 100 µL of red stop solution. The optical density of each microwell was read using an Infinite F50 Model micro plate reader (TECAN, Männedorf Switzerland) with a 650 nm filter within 20 min, and the results were interpreted by constructing a standard curve made from four standard concentrations supplied by the manufacturer. Positive and negative samples were determined based on the limit of detection (LOD) and limit of quantitation (LOQ) of each kit. The LOD levels of the kits used for aflatoxin, deoxynivalenol, fumonisin, ochratoxin and zearalenone were 1.4 µg/kg, 0.1 mg/kg, 0.2 mg/kg, 1 µg/kg and 10 µg/kg, respectively. The LOQ levels for the same mycotoxins were 5 µg/kg, 0.5 mg/kg, 0.5 mg/kg, 2 µg/kg and 25 µg/kg, respectively.

2.3. Assessing Mold Incidence in Maize Kernels and Molecular Identification

From each sample, 25 randomly selected maize kernels were first washed with sterile water to remove attached dirt or dust before transferring to a sterile tube. Subsequently, the kernels were surface-sterilized by dipping in 2% sodium hypochlorite solution for 5 min and rinsed with sterile distilled water three times before placing on potato dextrose agar (PDA, Hi-Media Laboratories, India) medium at a density of 10 kernels per 9 cm Petri dish. The dishes were incubated at 30 °C for 5–7 days and checked for fungal outgrowth from each kernel [13]. The mold infection percentage of kernels was calculated by counting the kernels with visible fungal growth and dividing that total by the total number of kernels placed on the Petri dish, multiplied by 100. Morphological identification of the fungal genera responsible for the infection of the maize kernel was carried out according to Pitt and Hocking [14] and Samson et al. [15] after sub-culturing from the infected kernels onto PDA plates. A total of 150 isolates (green and black Aspergillus, Fusarium) were recovered from 45 samples.
Molecular identification followed the procedure of Zhou et al. [16]. The genomic DNA of representative fungal isolates was extracted from fresh fungal cultures grown on PDA. After that, polymerase chain reaction (PCR) was performed using universal primers for fungal DNA at the internal transcribed spacers (ITSs), ITS1 (5′TCCGTAGGTGAACCTGCGG3′) and ITS4 (5′TCCTCCGCTTATTGATATGC3′), which amplified a 500–600 kb DNA fragment [17]. The PCR products were sent for sequencing. The nucleotide sequencing results were compared to similar nucleotide sequences in the National Center for Biotechnology Information (NCBI) database using the Basic Local Alignment Search Tool (BLAST) to identify these fungal species (http://blast.ncbi.nlm.nih.gov/Blast.cgi, accessed on 2 March 2021).

2.4. Study of Mycotoxin Production Potential of Selected Fungal Isolates

The green and black Aspergillus isolates were cultured on yeast extract sugar (YES) media for 7 days at room temperature to check their potential for AF and OTA production, respectively [18]. Culture agar was extracted and quantified for AF and OTA levels using high performance thin layer chromatography coupled with densitometry [19]. Using the technique of Chuaysrinule et al. [20], five spots of yeast extract agar were cut using a cork borer and put inside an Eppendorf tube prior to the addition of 1 mL of methanol followed by extraction and sonication for 60 min. Subsequently, five levels of mixed aflatoxin (B1, B2, G1, G2) standards (5, 10, 15, 20, 30 ng/spot), OTA standards (3, 5, 7, 10, 20 ng/spot) and 10 µL of extracts (clear liquid) were spotted in thin layer chromatography silica 60 plates (Merck, Germany). The plates were developed in the mobile phase consisting of ratios of chloroform-to-acetone (9:1) for AF and toluene-to-ethyl acetate-to-formic acid (6:3:1) for OTA analysis with a migration distance of 7 cm. They were left to air dry for 5 min and observed under a densitometer TLC scanner (Camag, Muttenz, Switzerland) at wavelengths of 366 nm and 333 nm for AF and OTA, respectively. The calculated LOD and LOQ values for AF were 0.85 and 2.57 ng/spot, respectively, and for OTA, they were 1.26 and 3.82 ng/spot, respectively.
To check the potential of fumonisin production of black Aspergillus, cultures grown on YES media were extracted and sonicated as described above and quantified with HPLC using fluorescence detection. Derivatization mixture (DM) was prepared [21] and different levels of fumonisin B1 standards (0.01, 0.025, 0.05, 0.1, 0.25, 0.5 and 1 µg/mL) were prepared for the calibration curve. Each sample was first diluted 10-fold with acetonitrile-to-distilled water (1:1). Then, 50 µL of DM was added to 200 µL of each sample or standard and left for 3 min before pipetting 200 µL for injection into the HPLC system using a reverse-phase HPLC (Waters 2475 multi fluorescence detector; Waters, MA, USA) with a Symmetry (R) C18 column (5 μm, 3.9 × 150 mm; Waters, MA, USA). The fluorescent detector was operated at excitation and emission wavelengths of 335 nm and 440 nm, respectively. The mobile phase contained the following: (solvent A) deionized water, (solvent B) acetonitrile and (solvent C) 6% (v/v) acetic acid in deionized water. The flow rate was adjusted to 1 mL/min, the column was thermostatically controlled at 40 °C and the injection volume was kept at 10 µL. The initial mobile phase composition was a ratio of solvent A-to-solvent B-to-solvent C of 50:43:7. The composition of solvent C was kept constant at 7%. The gradient elution was changed from 50% to 39% A in 15 min, from 39 to 35% A in 17 min. The mobile phase composition was reverted to the initial condition (ratio of solvent A-to-solvent B-to-solvent C of 50:43:7) in 25 min and allowed to run for another 5 min before the injection of another sample. Total analysis time per sample was 30 min. The LOD and LOQ values for FB1 analysis using HPLC were 14 and 20.5 µg/kg, respectively.
To check the fumonisin production ability of the Fusarium species grown on maize, 40 Fusarium isolates were grown on PDA medium for 7 days at room temperature before cutting 3–4 pieces of fungal colonies using a cork borer and putting them in plastic bags containing 60 g of autoclaved maize grains adjusted to a moisture content of 40% using sterile water. Incubation was carried out at 25 °C for 28 days with a scheduled mixing every 3–5 days to induce toxin production [22]. Finally, the moldy maize grains were autoclaved at 121° C for 20 min, oven-dried overnight at 70 °C and ground into powder before being analyzed for fumonisin toxin using the ELISA method with a Veratox ELISA test kit (Neogen Corporation, USA) following the maker’s instructions.

2.5. Risk and Exposure Assessment of Aflatoxin

The estimated daily intake (EDI) of aflatoxins through maize consumption was computed using the following equation:
    EDI = Di × C W
where EDI is measured in ng/kg bw/day, Di is the daily consumption of maize (g/person/day), C is the average concentration of aflatoxins detected in maize samples (µg/kg) and W is the average body weight of the individual (kg). When aflatoxin was not detected in food, C was assumed to be LOD/2 [23]. According to Ranum et al. [8], average maize consumption per capita per day in Nepal is 98 g, and the average body weight of an individual is 58.13 kg, which is the average of the body weight of male (60.69 kg) and female (55.57 kg) Nepalis (NHRC) [24].
To estimate the potential health risk related to the consumption of maize, the margin of exposure (MOE) method using the benchmark dose (BMD) approach of the EFSA (European Food Safety Authority) was used [25]. The MOE calculates the risk as the ratio of the carcinogenic dose to population intake and was calculated using the following equation:
MOE = BMDL10 ÷ EDI
where BMDL10 is the benchmark dose lower confidence limit of 10% of 170 ng/kg bw/day, based on the European Food Safety Authority data [26]. An MOE value ≥ 10,000 indicates a low public health risk due to exposure to a genotoxic carcinogen [25].
Quantitative risk assessment of liver cancer was determined using the Joint FAO/WHO Expert Committee on Food Additives model [26]. This method takes advantage of the exposure and potency of carcinogens, providing quantitative data on human carcinogenic risk. In the equation, for hepatitis B surface antigen-positive individuals (PHBsAg+), the potency used was 0.3 and for hepatitis B surface antigen-negative individuals (PHBsAg), the potency used was 0.01 [25,26]. The prevalence of HBsAg+ was estimated as 0.9% in Nepal being 1.6% in males and 0.5% in females [27]. Hence, the potency of liver cancer can be estimated by the following equation:
Average potency (cancer cases/year/100,000 people) = (0.01 × HBsAg) + (0.3 × HBsAg+) × EDI

2.6. Statistical Analysis

One-way analysis of variance (ANOVA) was used for the statistical analysis of the data. The one-sample t-test was also performed to compare the aflatoxin mean level against the MPL set by the Government of Nepal. The normality of the data distribution was tested before comparing the differences. Associations between the frequency of mycotoxin positive samples and the province were tested based on Fisher’s exact test. The Statistical Package for the Social Sciences (IBM SPSS 25) was used for the above calculations. ArcGIS ArcMap 10.3.1 (ESRI, Redlands, CA, USA) and Python 3.0 were used to create Heat Maps of mycotoxin incidence and box plots, respectively.

3. Results and Discussion

3.1. Mycotoxin Contamination

Table 1 shows the percentage incidence and contamination level of five different mycotoxins. Since the Government of Nepal has not yet set the MPL for toxins (except AF), the results of this study were compared with the European regulation levels. In this study, all maize samples contained DON with values ranging from 110 to 520 µg/kg having a mean concentration of 222.4 µg/kg. DON can have various lethal effects in humans such as anorexia, decreased weight gain, altered immune function and decreased nutritional efficiency [28]. However, none of the samples exceeded the MPL of 1750 µg/kg in the European regulations. Very little research has been conducted regarding the occurrence of DON in Nepalese maize; however, according to a study carried out by Desjardins et al. [29], 16% of maize samples (n = 74) collected from the foothills of Nepal were contaminated with nivalenol and DON with values > 1000 µg/kg. The result of our study closely resembled other results [30,31]. However, contrary to our result, Mishra et al. [32] reported that, in India, there was a low incidence (30%) of DON in cereals, including maize samples (n = 100). Overall, the low levels of DON in our study indicated that DON occurrence in Nepalese maize cannot be considered as a threatening issue yet, but nonetheless, the high incidence of DON could be an increasing matter of concern.
Similarly, other Fusarium toxins (FUM and ZEA) were detected in 76% of the samples with values in the ranges of 200–4180 µg/kg for FUM and 11.12–69.52 µg/kg for ZEA, with mean concentrations of 816.76 µg/kg and 21.72 µg/kg, respectively, in positive samples. ZEA is often found associated with reproductive disorders in farm animals and sometimes in hyperestrogenic syndromes in humans [33]. To the best of our knowledge, this is the first report of the occurrence of ZEA in maize originating from Nepal. In our study, none of the samples exceeded the MPL (200 µg/kg) set by the EU. Similar to our findings, a study carried out in maize feed in various provinces of China showed 93% incidence of this toxin with an average concentration of 242 µg/kg and the maximum value being 1549 µg/kg [31]. However, not much research regarding zearalenone has been conducted in the neighboring country of India. To conclude, although ZEA concentrations in Nepalese maize are not high currently, this situation deserves monitoring because of its high frequency of occurrence.
Naturally, fumonisin B1, B2 and B3 occur in maize, with fumonisin B1 being the most toxic carcinogen of them all, and it is linked to esophageal cancer in humans [34]. Other researchers reported less incidence of fumonisin in Nepal. According to a study carried out by Desjardins et al. [29], 22% of the maize samples (n = 74) collected from the foothills of Nepal were contaminated with FUM with values > 1000 µg/kg. Similarly, in 2004, 40% of the maize samples contained fumonisin B1 levels above 1000 µg/kg, of which 11% of samples had a concentration of more than 10,000 µg/kg [12]. Although the mean concentration of fumonisin in the present study was lower than the MPL set by the EU, five positive samples for FUM exceeded the European MPL (2000 µg/kg). Jayarajavarma et al. [35] reported that 71% of maize samples from Tamil Nadu, India, were positive for fumonisin B1, with the levels easily exceeding the MPL set by the EU. This finding generally agreed with our results and with those from other researchers [31,36]. In our study, apart from a high incidence, a few samples also exceeded the MPL in the European regulations, which suggested that FUM occurrence can be considered as a worrying issue in maize. Therefore, regular monitoring and actions to diminish its level in maize is needed.
The present study shows AF was the second-most abundant contaminant in maize. Among the 45 tested maize samples for human consumption, 35 (78%) were contaminated with aflatoxins with values ranging in the range 1.52–91.24 µg/kg and a mean concentration of 23.04 µg/kg. Similar results have been reported elsewhere. In the Kathmandu valley, 42.5% of maize samples collected were contaminated with AFB1 with an average value of 50.17 µg/kg [37]. Similarly, according to Koirala et al. [38], one-third of the maize product samples collected from eastern Nepal were contaminated with aflatoxin, with 20% of these samples containing aflatoxin levels greater than 30 µg/kg. Likewise, Pokharel [10] revealed that one-fifth of the maize samples contained aflatoxin content greater than the MPL (20 µg/kg) as established by the Government of Nepal. The global status of AF contamination in maize also suggests that this toxin is prevalent globally with high contamination levels whether it be in Europe, Sub- Saharan Africa or Southeast Asia [39]. The International Agency of Research on Cancer (IARC) has categorized AFB1 as a Group 1 carcinogen which is responsible for hepatocellular carcinoma in humans exposed to aflatoxins [40]. In our study, 11 (24%) out of 45 samples contained aflatoxin at a level greater than the MPL (20 µg/kg) as established by the Government of Nepal and the FDA in the USA, while more than half (55.55%) of the maize samples exceeded the 4 µg/kg MPL of the EU. A one-sample t-test (degrees of freedom = 34) revealed that the average AF contamination level ± SD (23.04 ± 27.58) in the positive samples was not significantly higher (t = 0.651, p = 0.519) than the MPL of 20 µg/kg set by government of Nepal for maize. In fact, 76% (n = 45) of samples had aflatoxin levels below this permitted level. However, when we compared it with the MPL of 4 µg/kg set by the European regulations, the one-sample t-test revealed that the average AF concentration in the positive samples was significantly higher (t = 4.083, p < 0.001) than the standard. Only 44% (n = 45) of samples had AF levels below this European limit. In summary, some non-compliant samples in the present study regarding AF suggested that routine monitoring of AFs in maize needs to be encouraged in the future.
Ochratoxin was found in 62% of the maize samples, with the mean concentration in the positive samples being 1.51 µg/kg and values in the range of 1 to 3.22 µg/kg. To the best of our knowledge, there has been no published report of OT occurrence in maize from Nepal. OT is a secondary fungal metabolite of Aspergillus and Penicillium. It is genotoxic, immunosuppressive, teratogenic and mutagenic and is listed as a group 2B human carcinogen. Our study results on OT incidence generally agreed with those from other researches in India and China [31,36]. Despite more than half of the samples being positive for OT, none exceeded the MPL of 5 µg/kg set by the EU; furthermore, the mean concentration of OT reported in our study was lower than this MPL. Overall, the results regarding OT in our study suggested that OT occurrence in Nepalese maize is not a current threat. To show the contamination levels of different mycotoxins in various parts of the country, the data obtained were used to create heat maps of mycotoxin occurrence in Appendix A (Figure A1, Figure A2, Figure A3, Figure A4 and Figure A5). Furthermore, the contamination level of mycotoxins in maize is displayed in box-plots with scattering dots in Appendix C (Figure A7, Figure A8, Figure A9, Figure A10 and Figure A11).

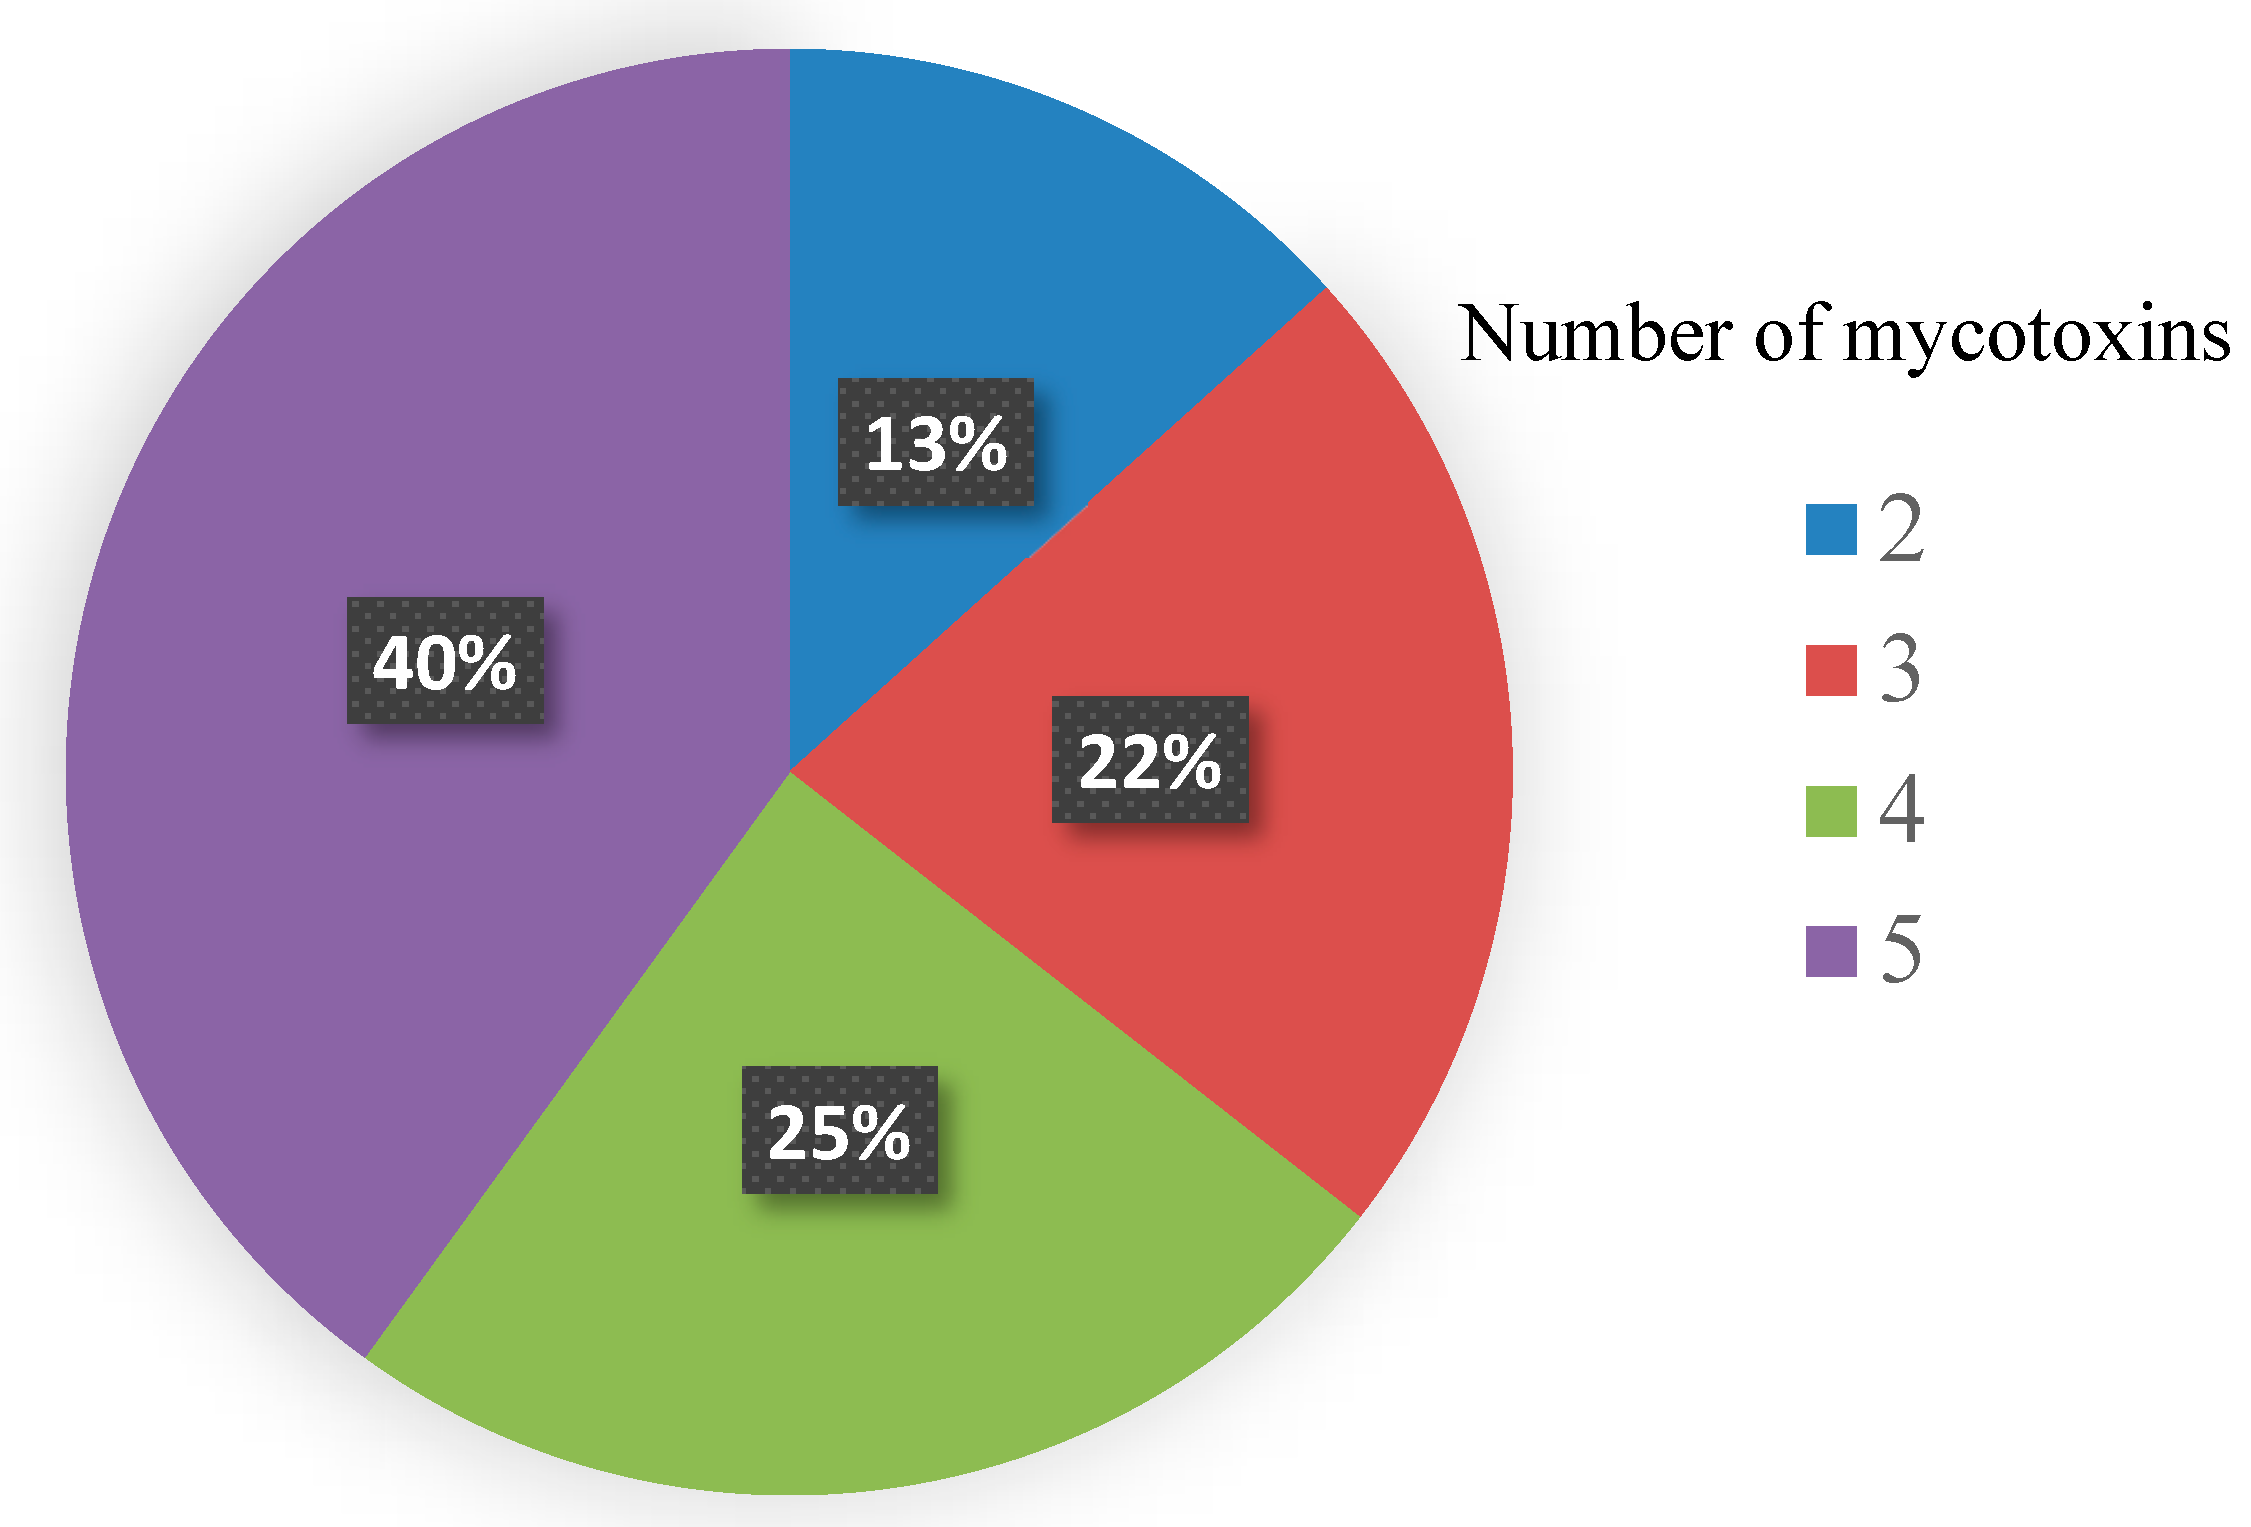
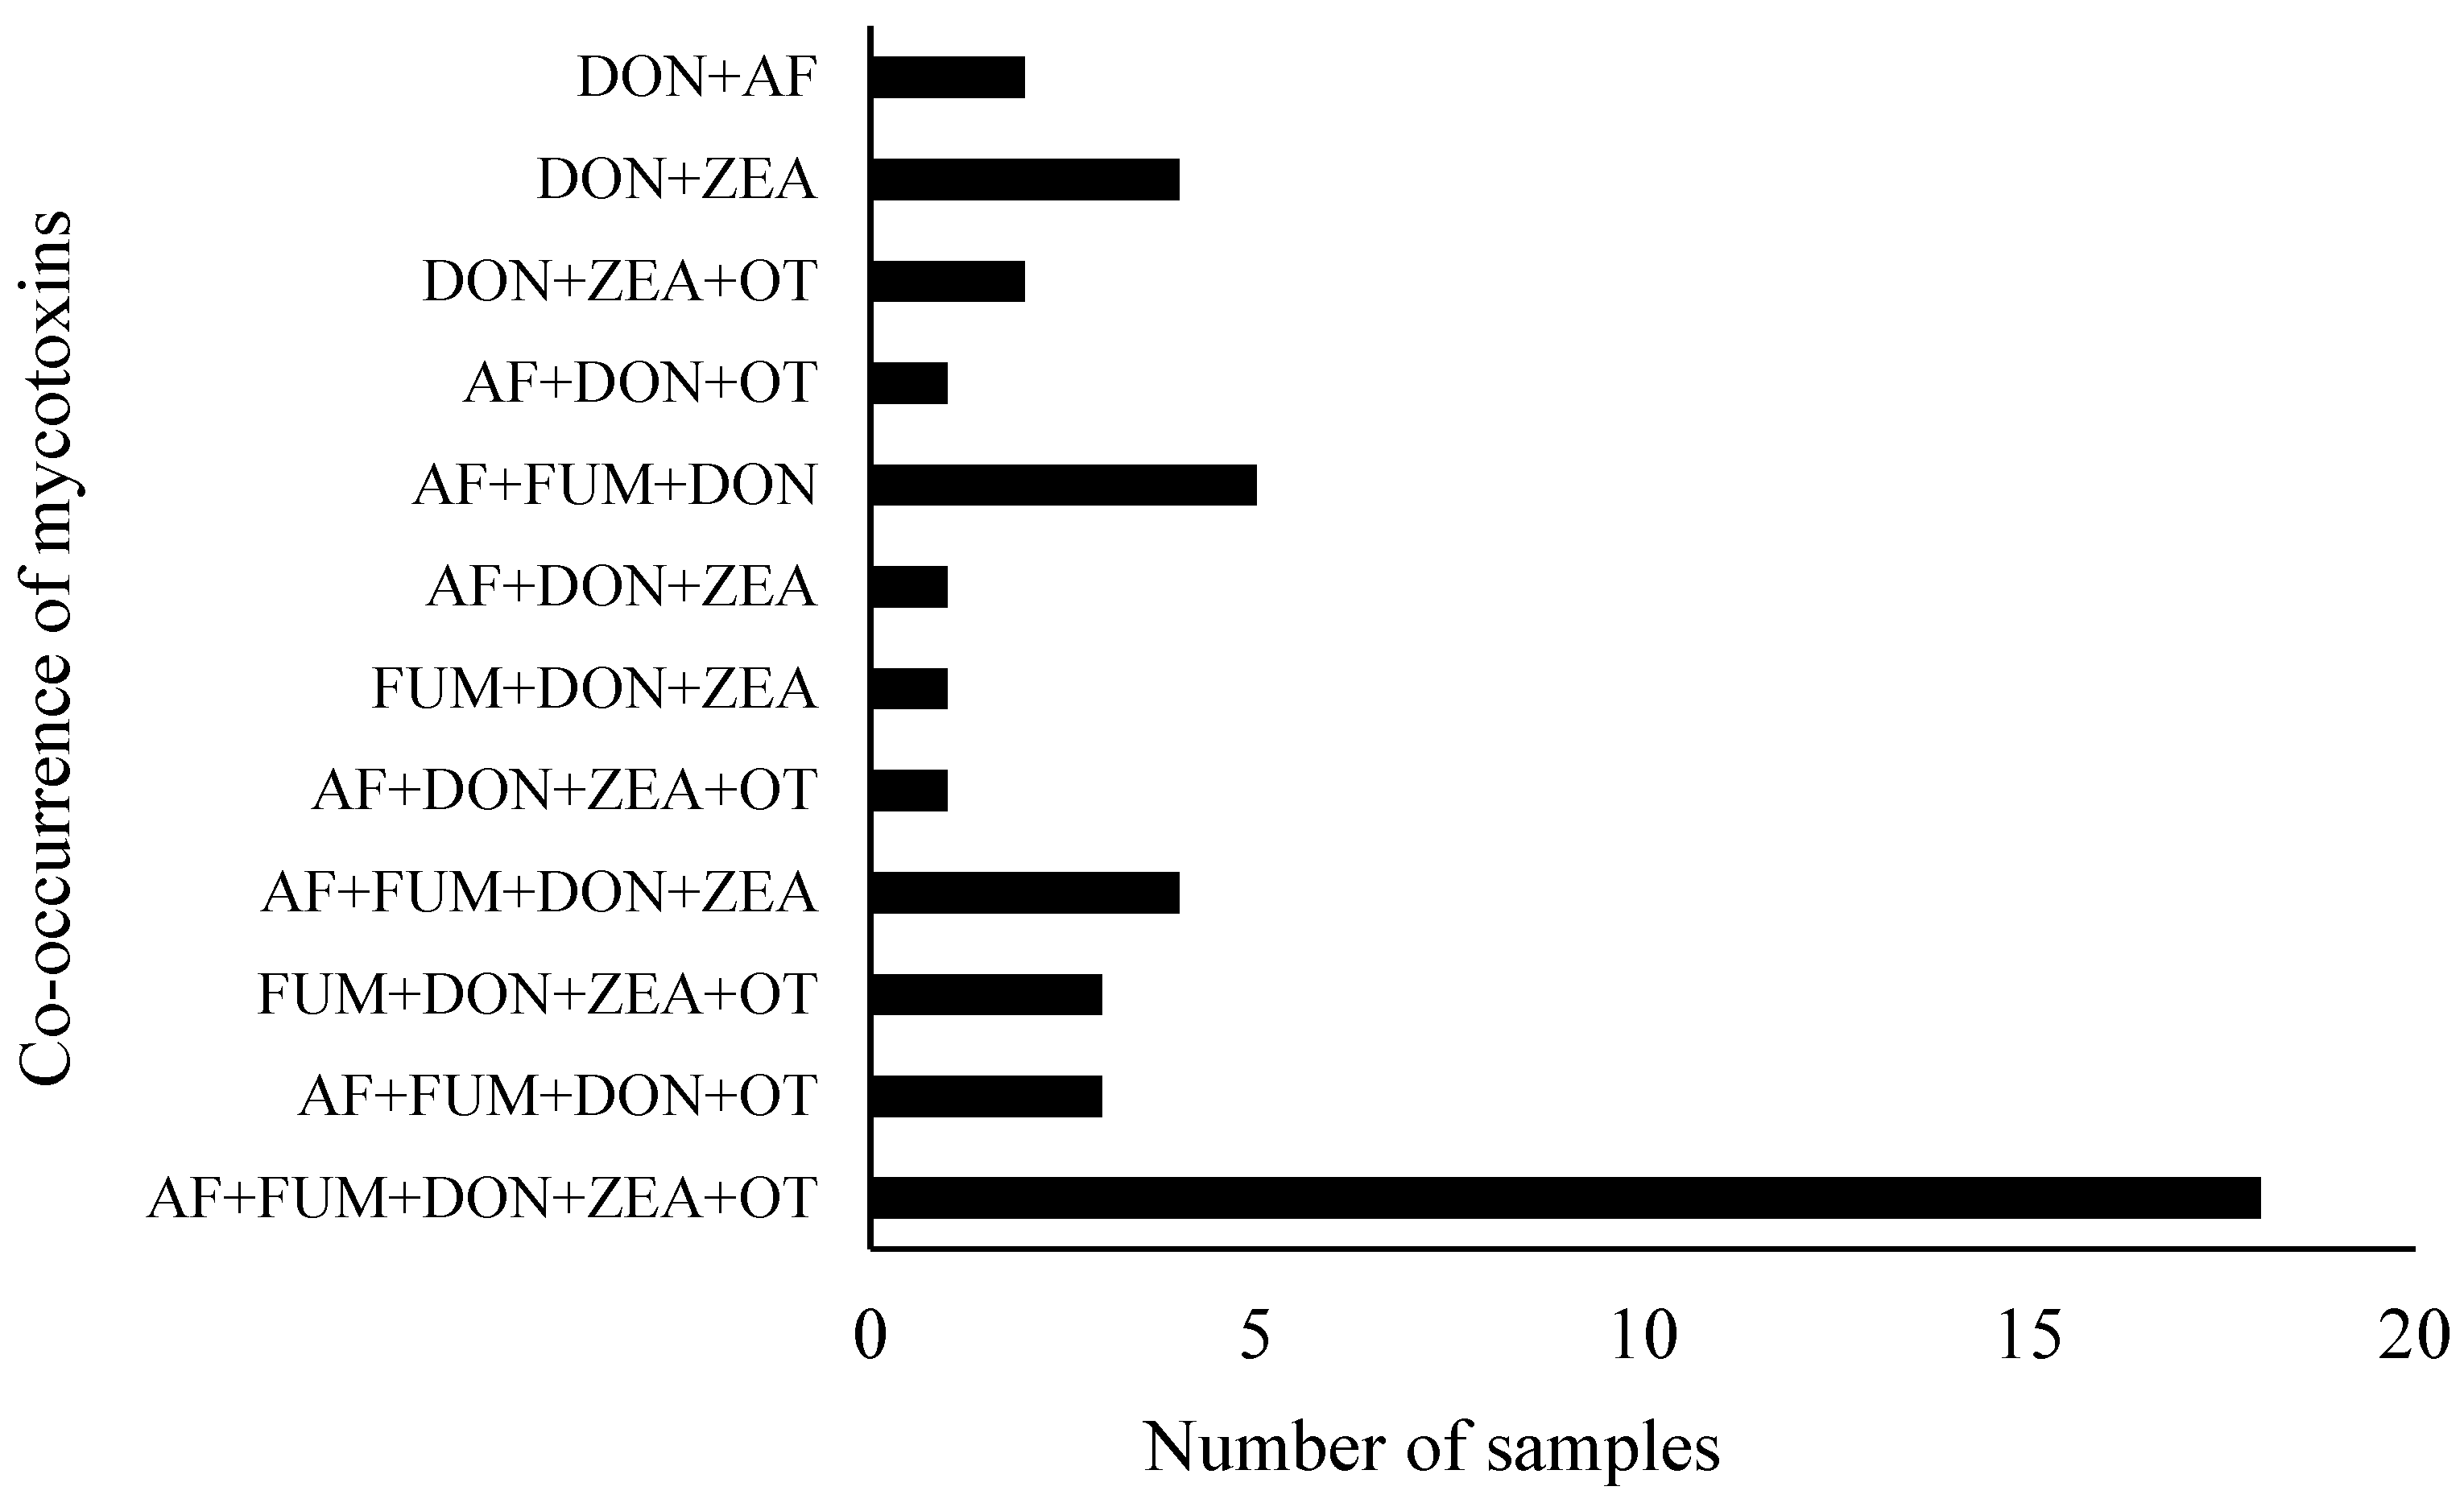
3.2. Co-Occurrence of Mycotoxins

Although this was the first study on the co-occurrence of mycotoxins (AF, OT, ZEA, FUM and DON) in Nepalese maize, various authors from other parts of the world have reported on the co-occurrence of mycotoxins. In our study, 13% of the maize samples were contaminated with two mycotoxins alone while those contaminated with three four and five mycotoxins were 22%, 25% and 40%, respectively, as shown in Figure 1.
The co-occurrence of various combinations of mycotoxins found in the analyzed maize samples are presented in Figure 2. Overall, 12 different combinations were observed. All the samples contained at least two mycotoxins while at least three or more mycotoxins were found in 87% of the samples. The most common binary combination was DON+AF, which occurred in 2 samples alone but these toxins also co-occurred in another 7 combinations of up to 5 mycotoxins in 33 samples. Another common combination was DON+ZEA, which occurred in 4 samples alone, but these toxins also co-occurred in another 7 combinations of up to 5 mycotoxins in 30 samples. The most common ternary combination was AF+FUM+DON, which occurred in 5 samples alone but also co-occurred in another 3 combinations of up to 5 mycotoxins in 25 samples. Likewise, the additional 4 ternary combinations of FUM+ZEA+DON, AF+ZEA+DON, ZEA+DON+OT and AF+DON+OT (either alone or in other combinations) were observed in 26, 24, 24 and 23 maize samples, respectively. In our study, 4 kinds of quaternary combinations (AF+FUM+ZEA+DON, FUM+ZEA+DON+OT, AF+FUM+DON+OT and AF+ZEA+DON+OT) were observed with the most common combination being AF+FUM+ZEA+DON, which occurred in 4 samples alone but also co-occurred in combination of 5 mycotoxins in 18 samples, resulting in its presence in 22 samples. Similarly, other quaternary combinations (FUM+ZEA+DON+OTA, AF+FUM+DON+OTA and AF+ZEA+DON+OTA) occurred in 21, 21 and 19 samples (either alone or in other combinations), respectively. The co-occurrence of all 5 mycotoxins was reported in 18 (40%) maize samples. The binary, ternary and quaternary combinations of mycotoxins reported in our study generally agreed with those from other researchers in the past studies [41,42].

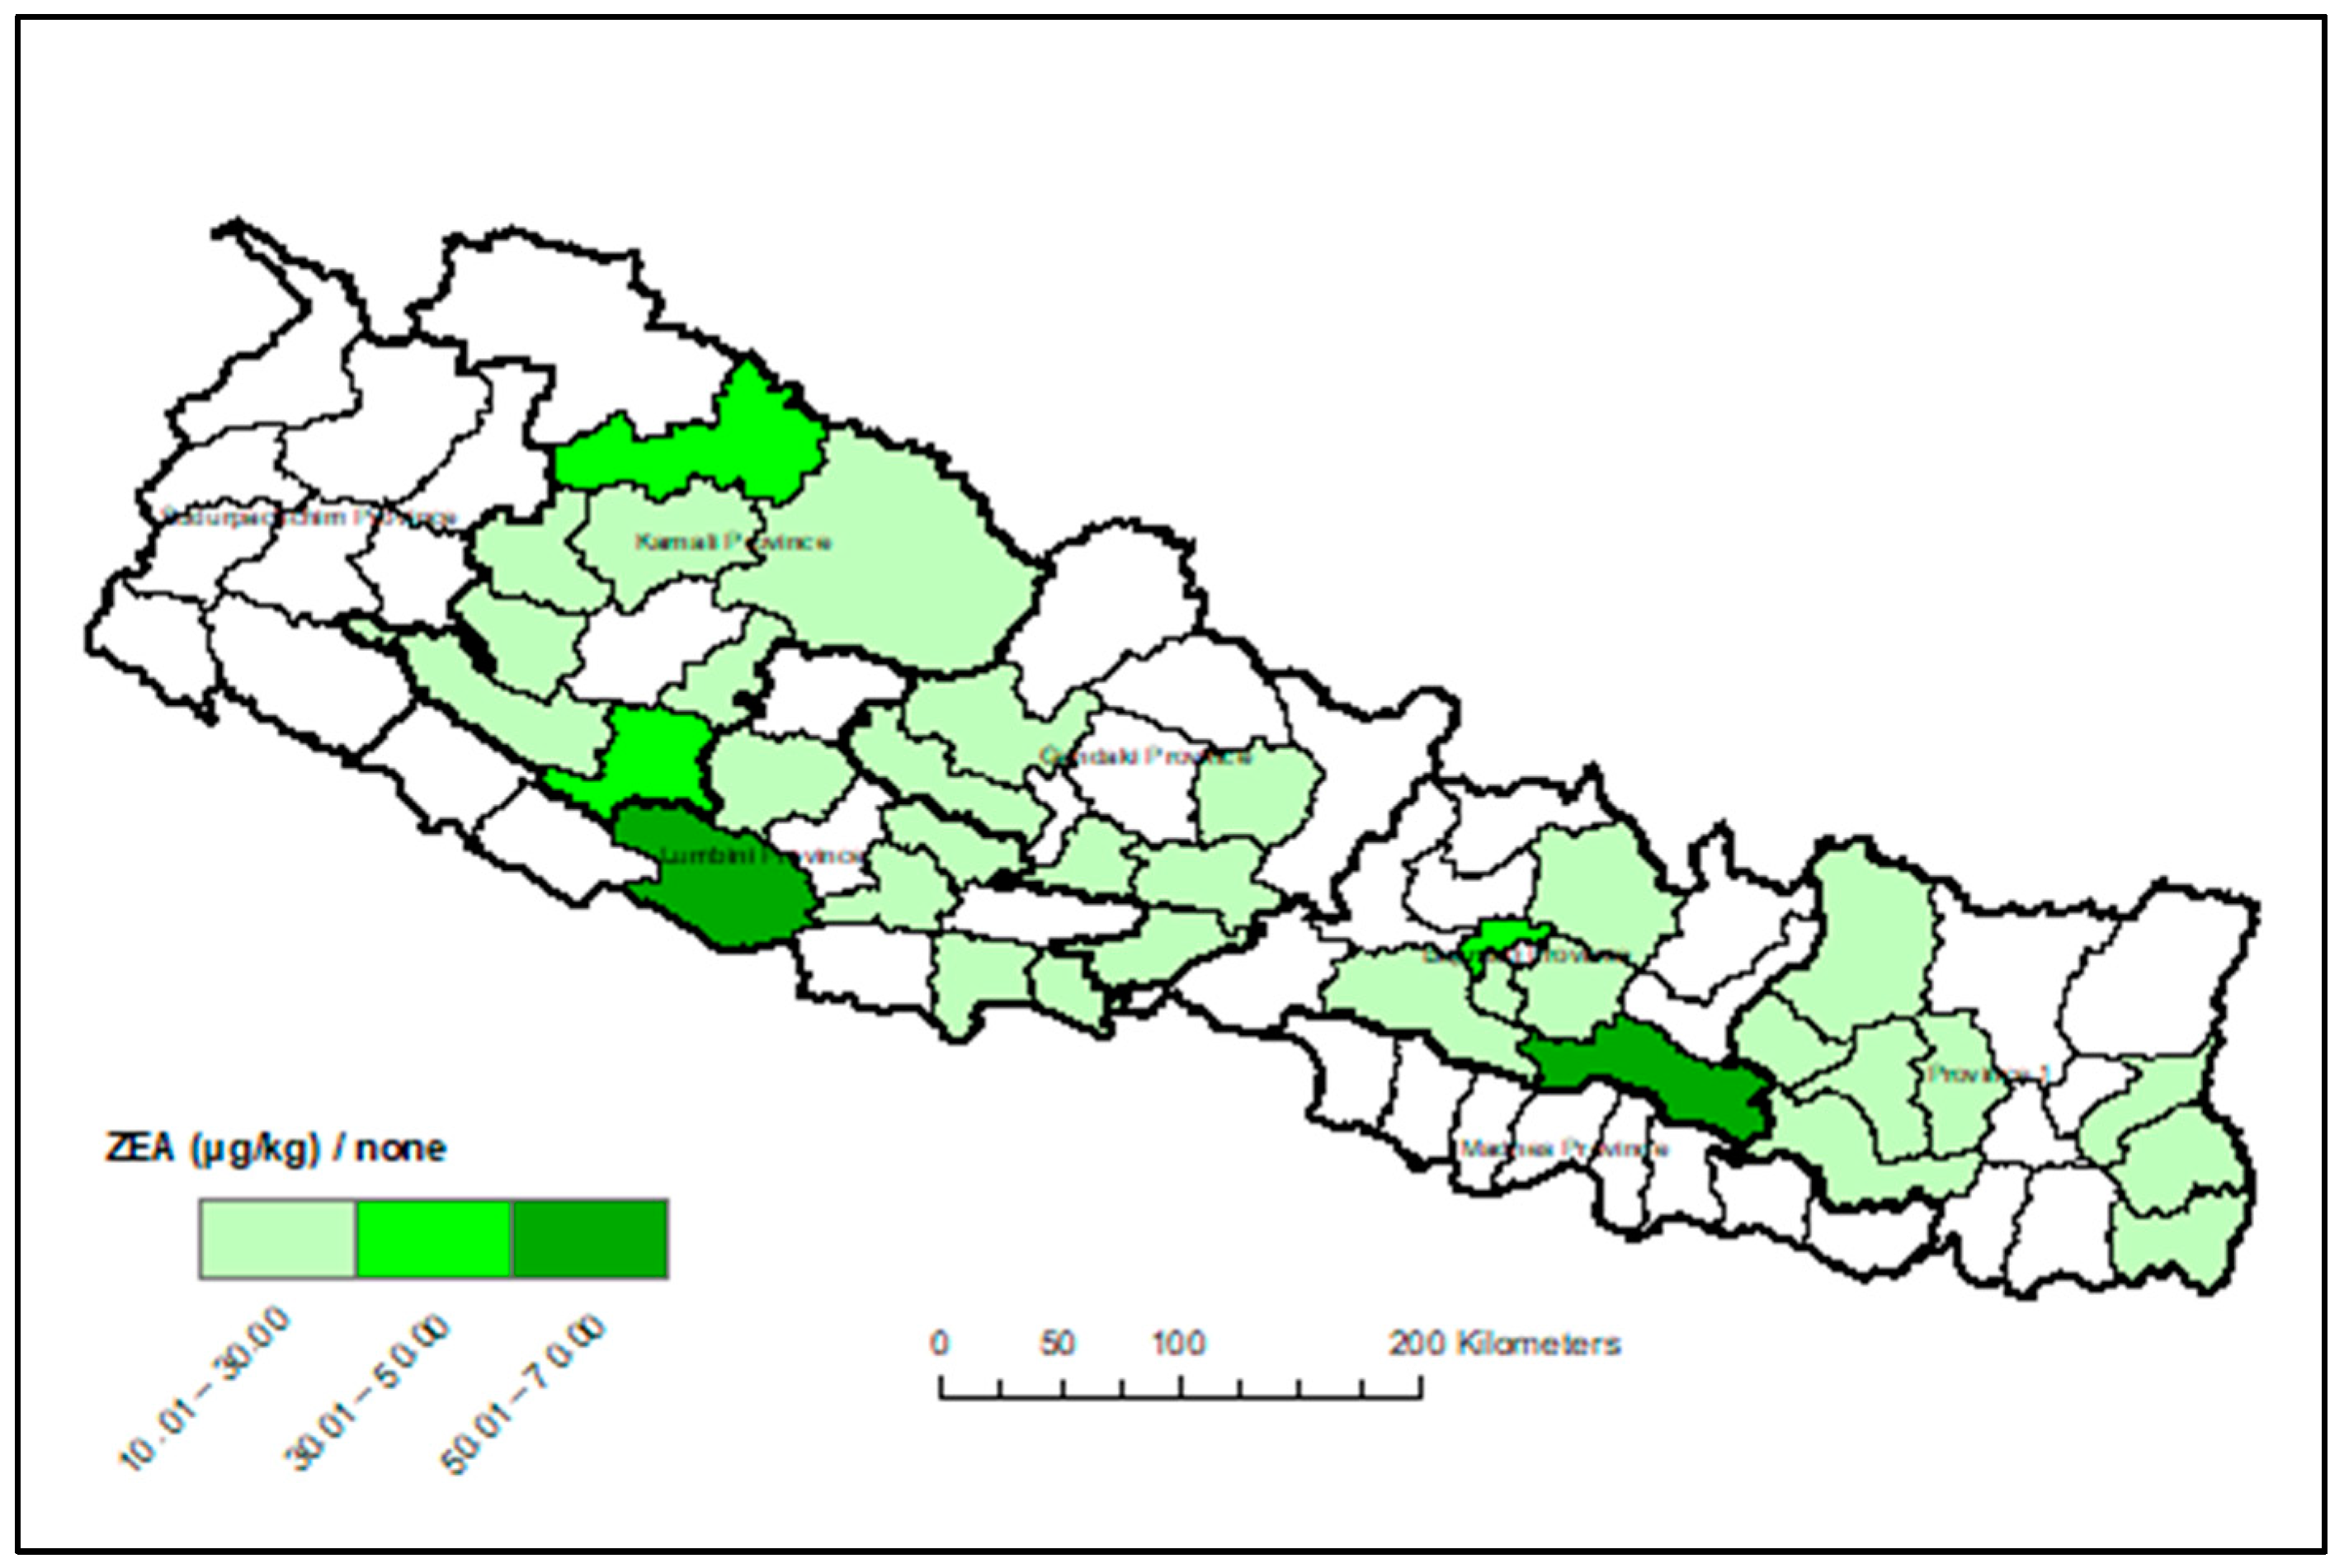
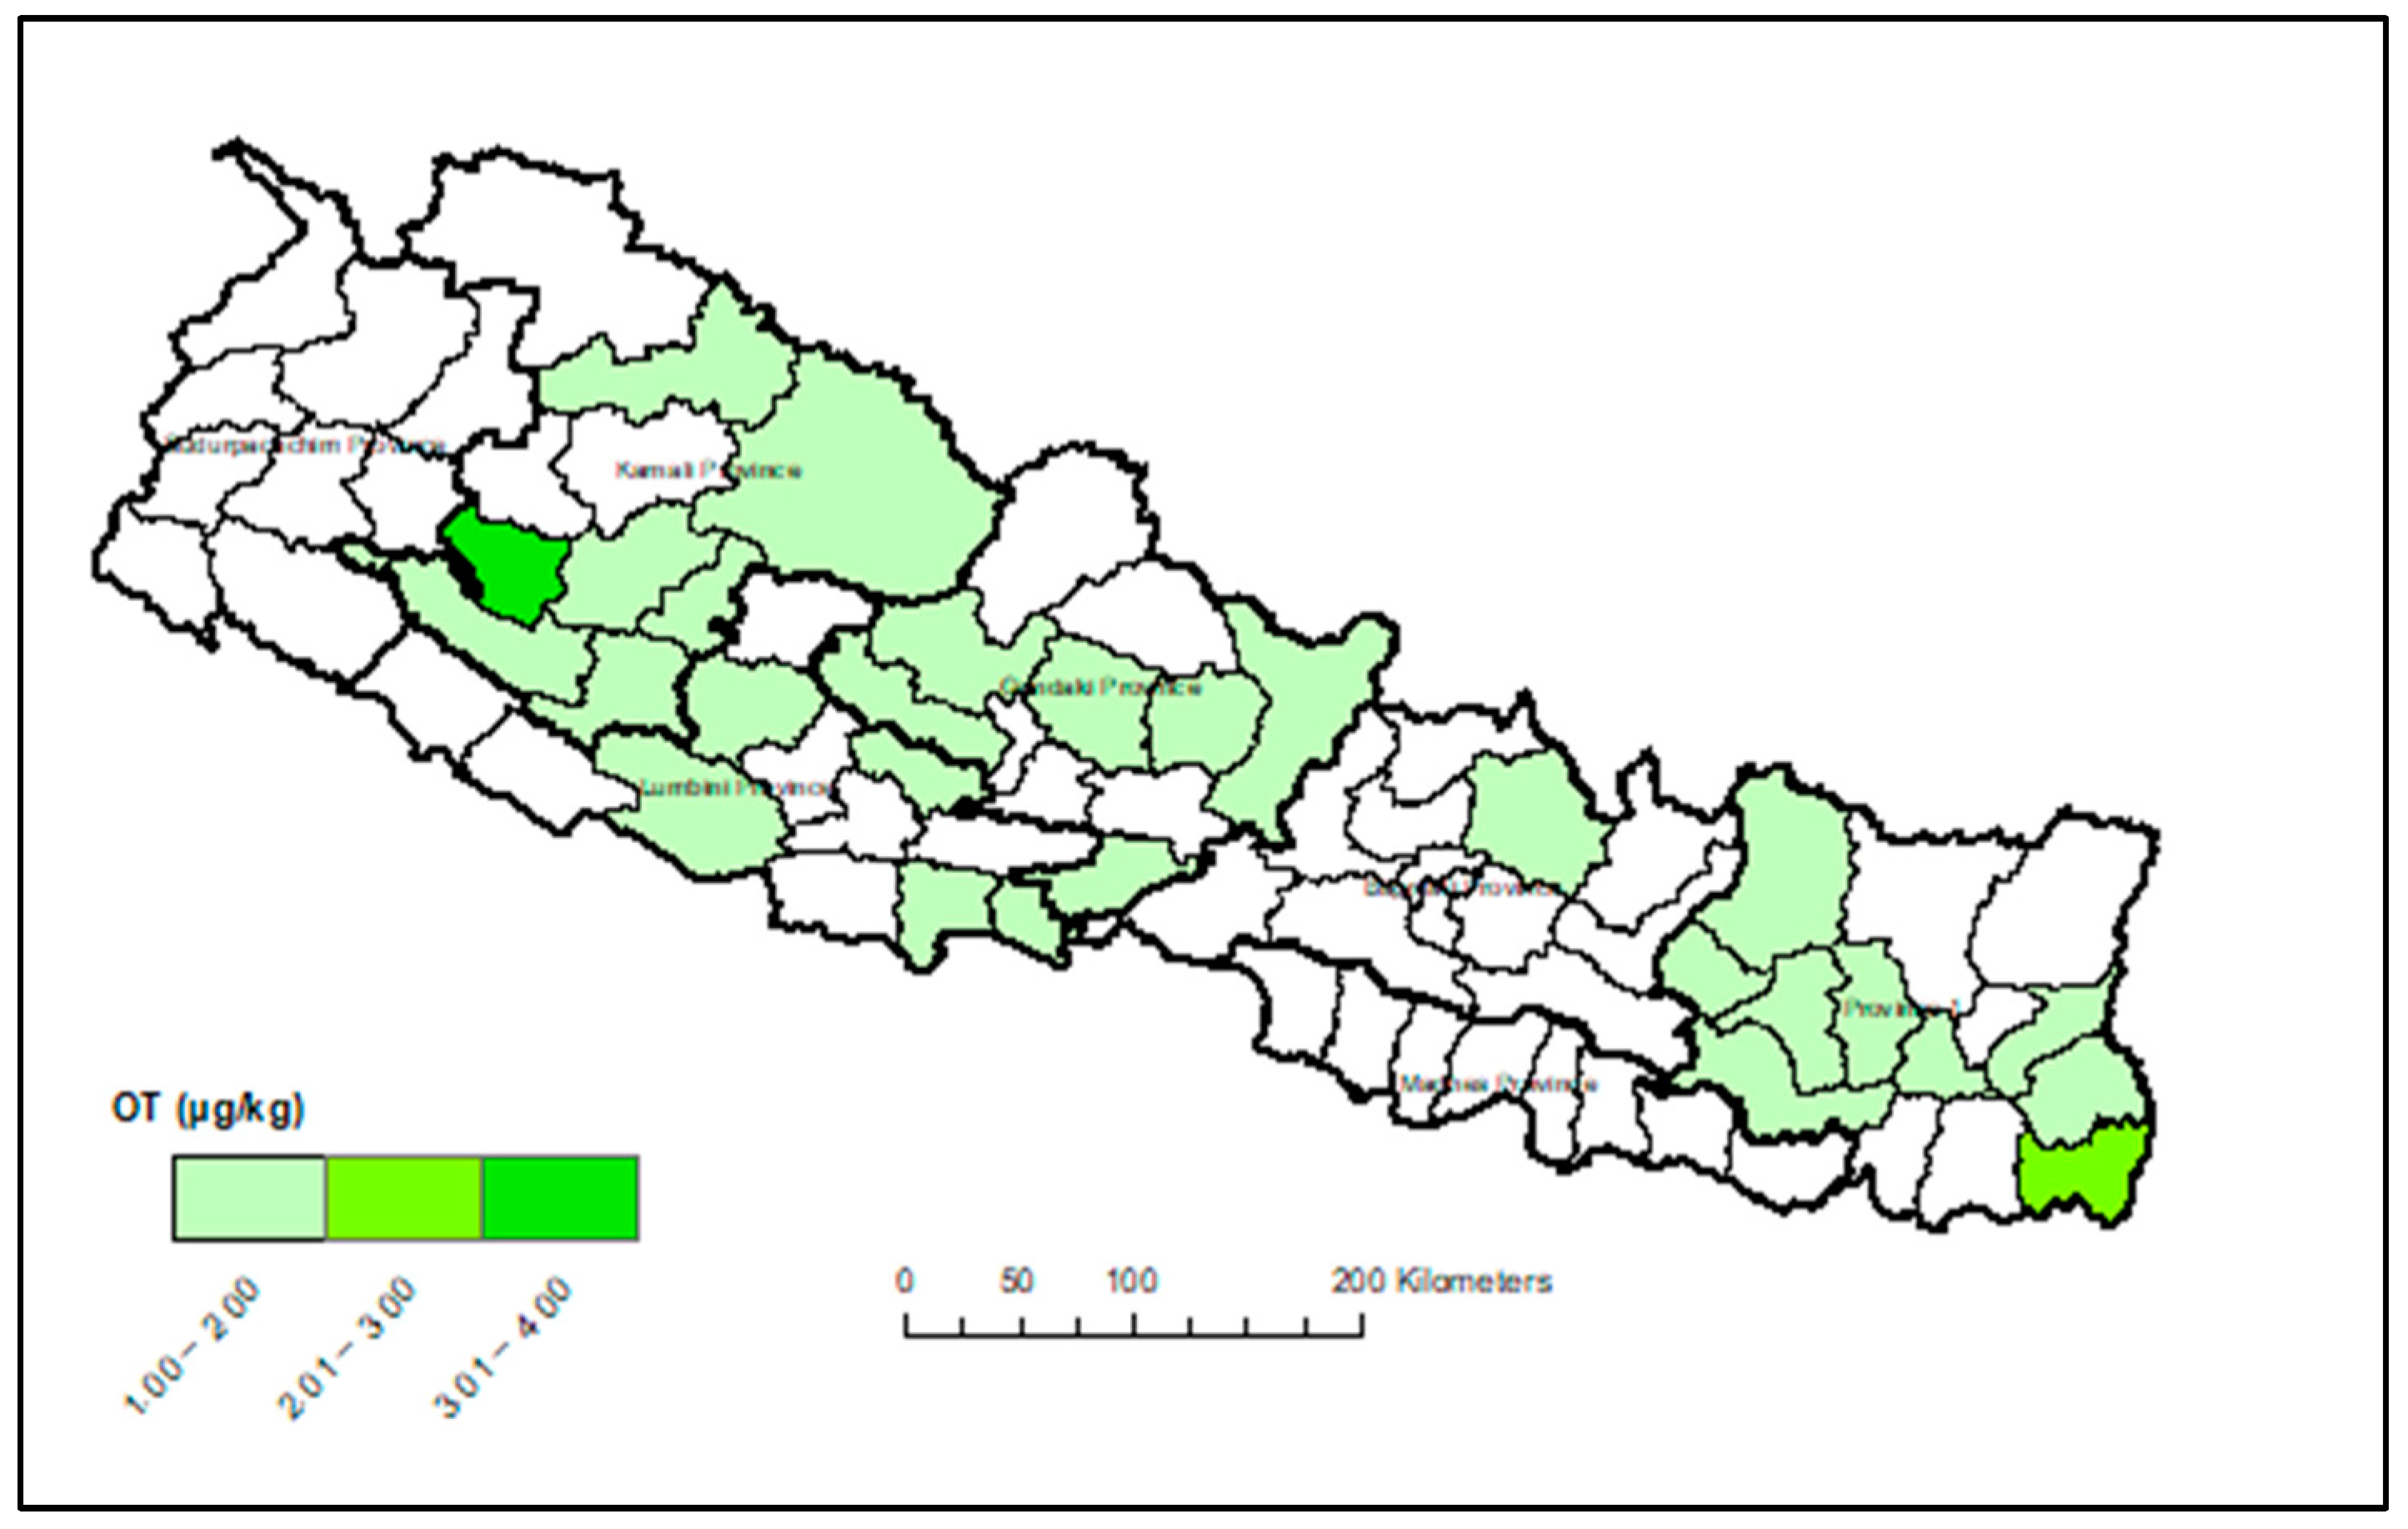
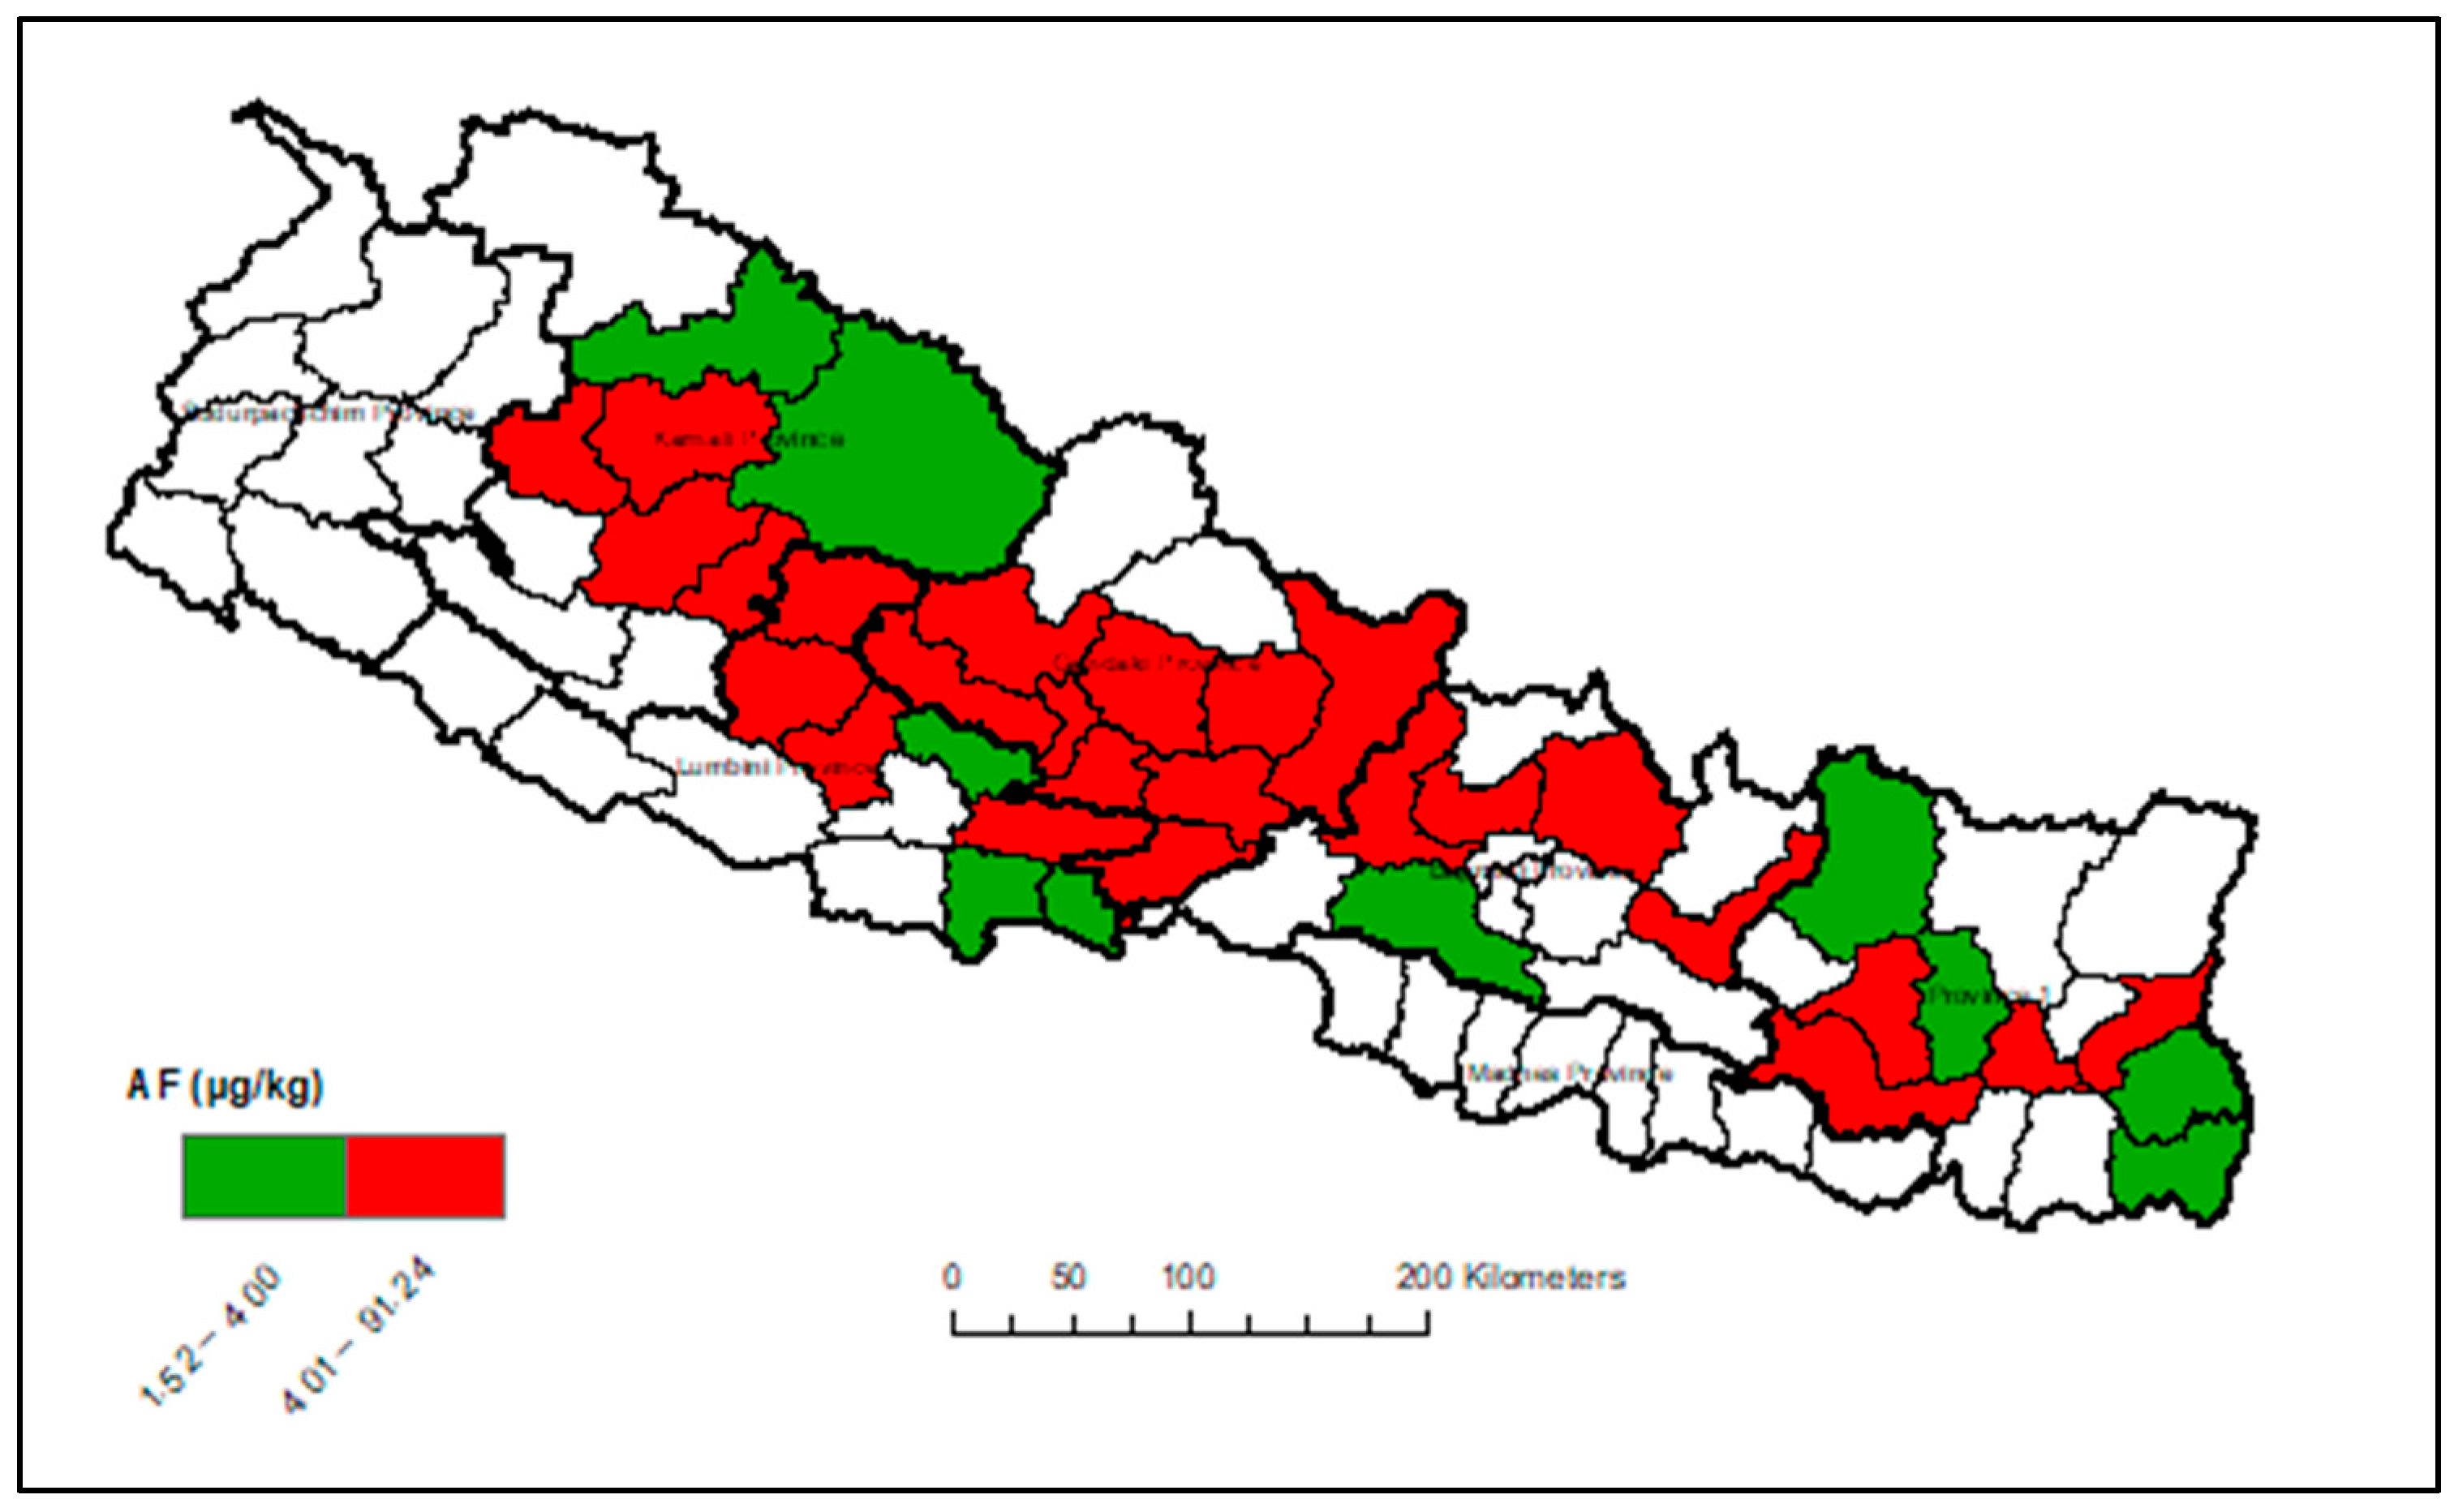
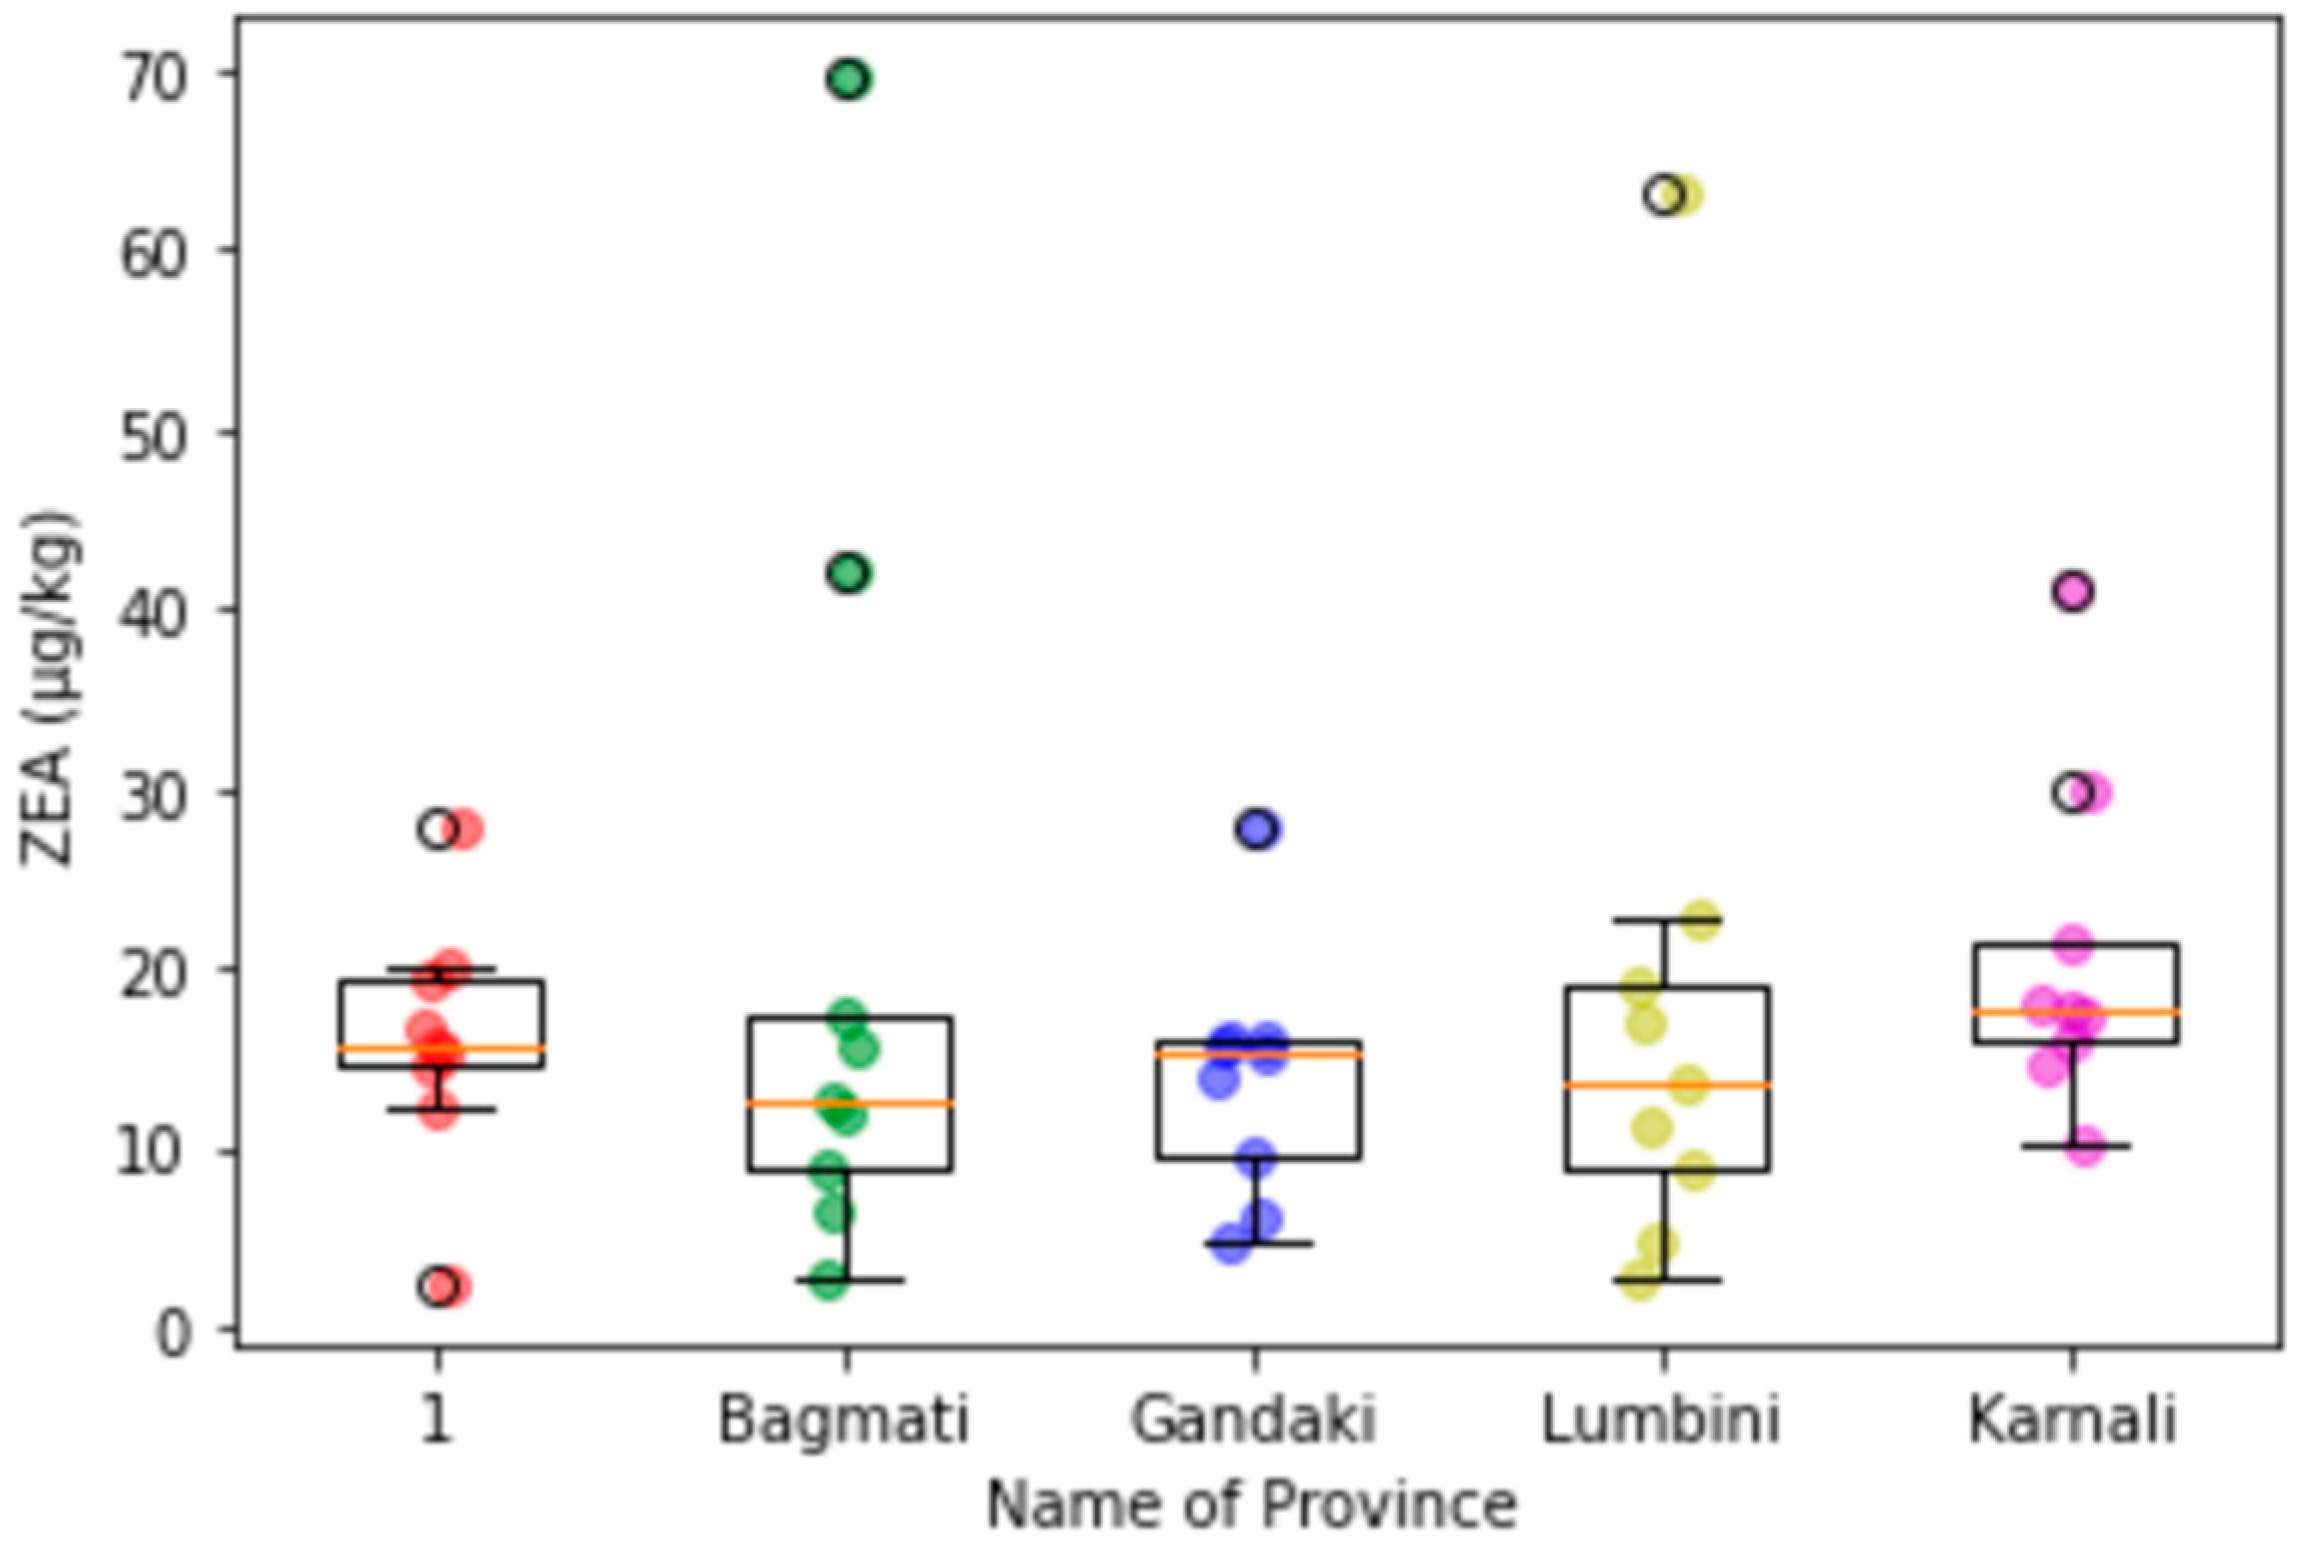
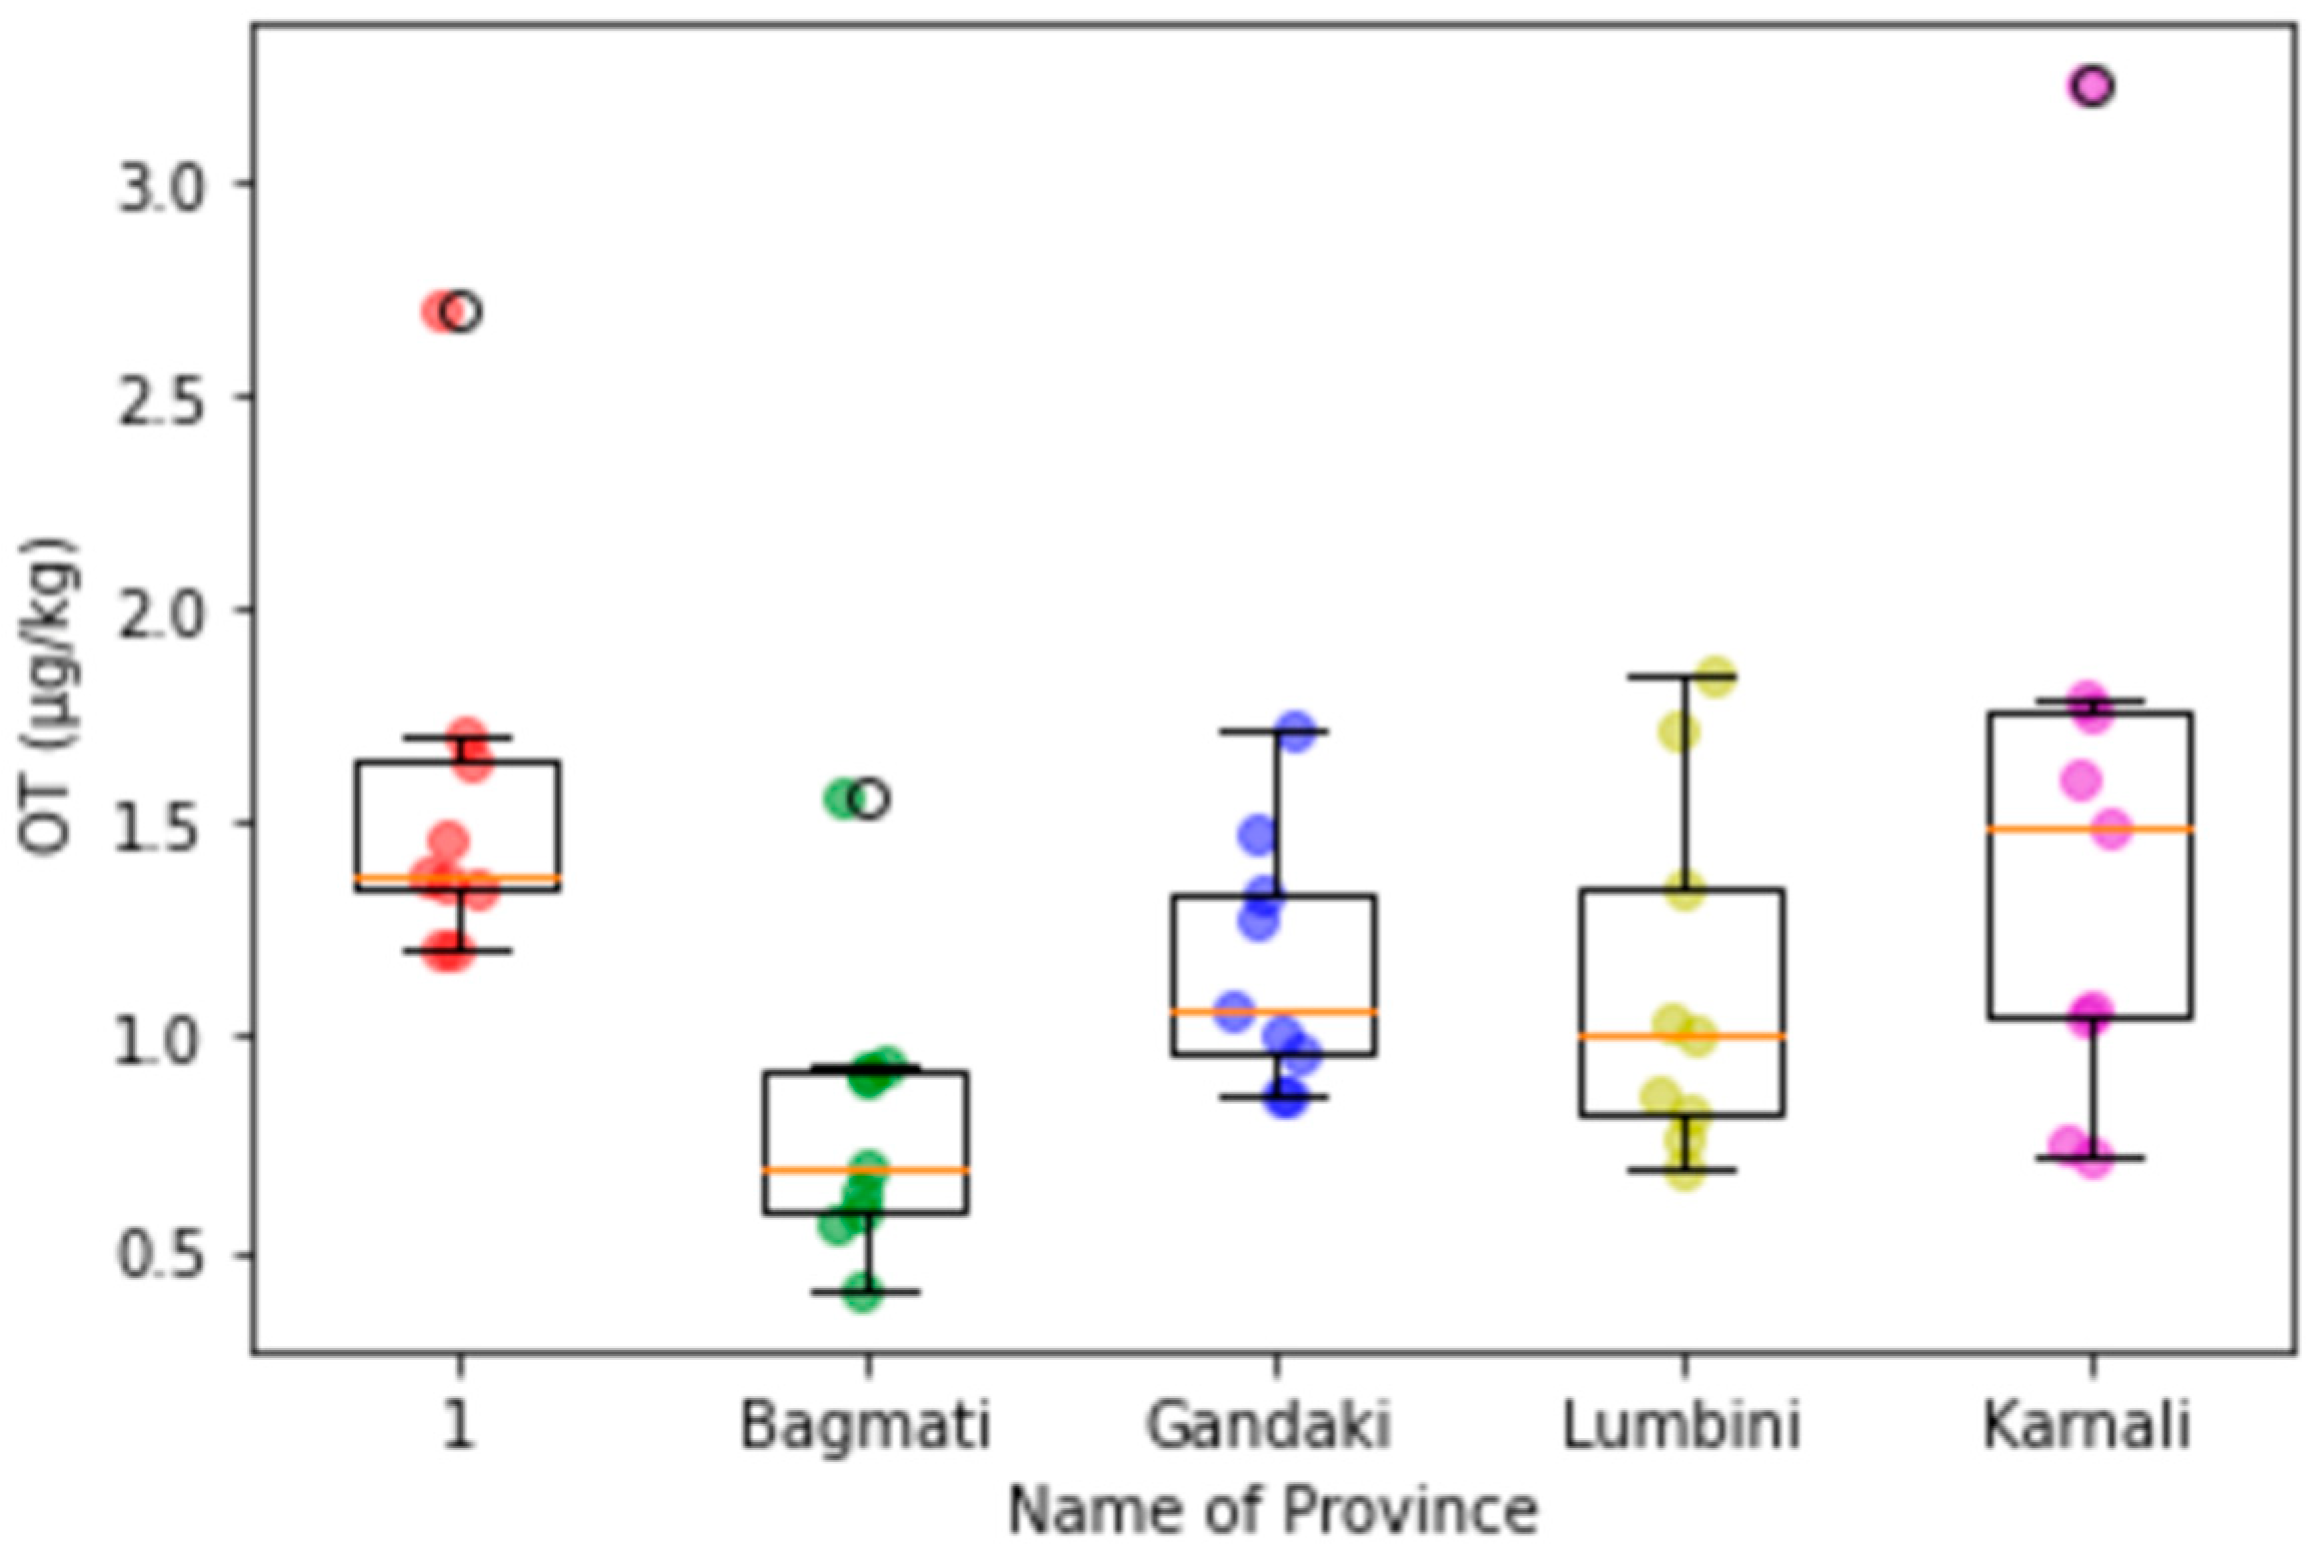
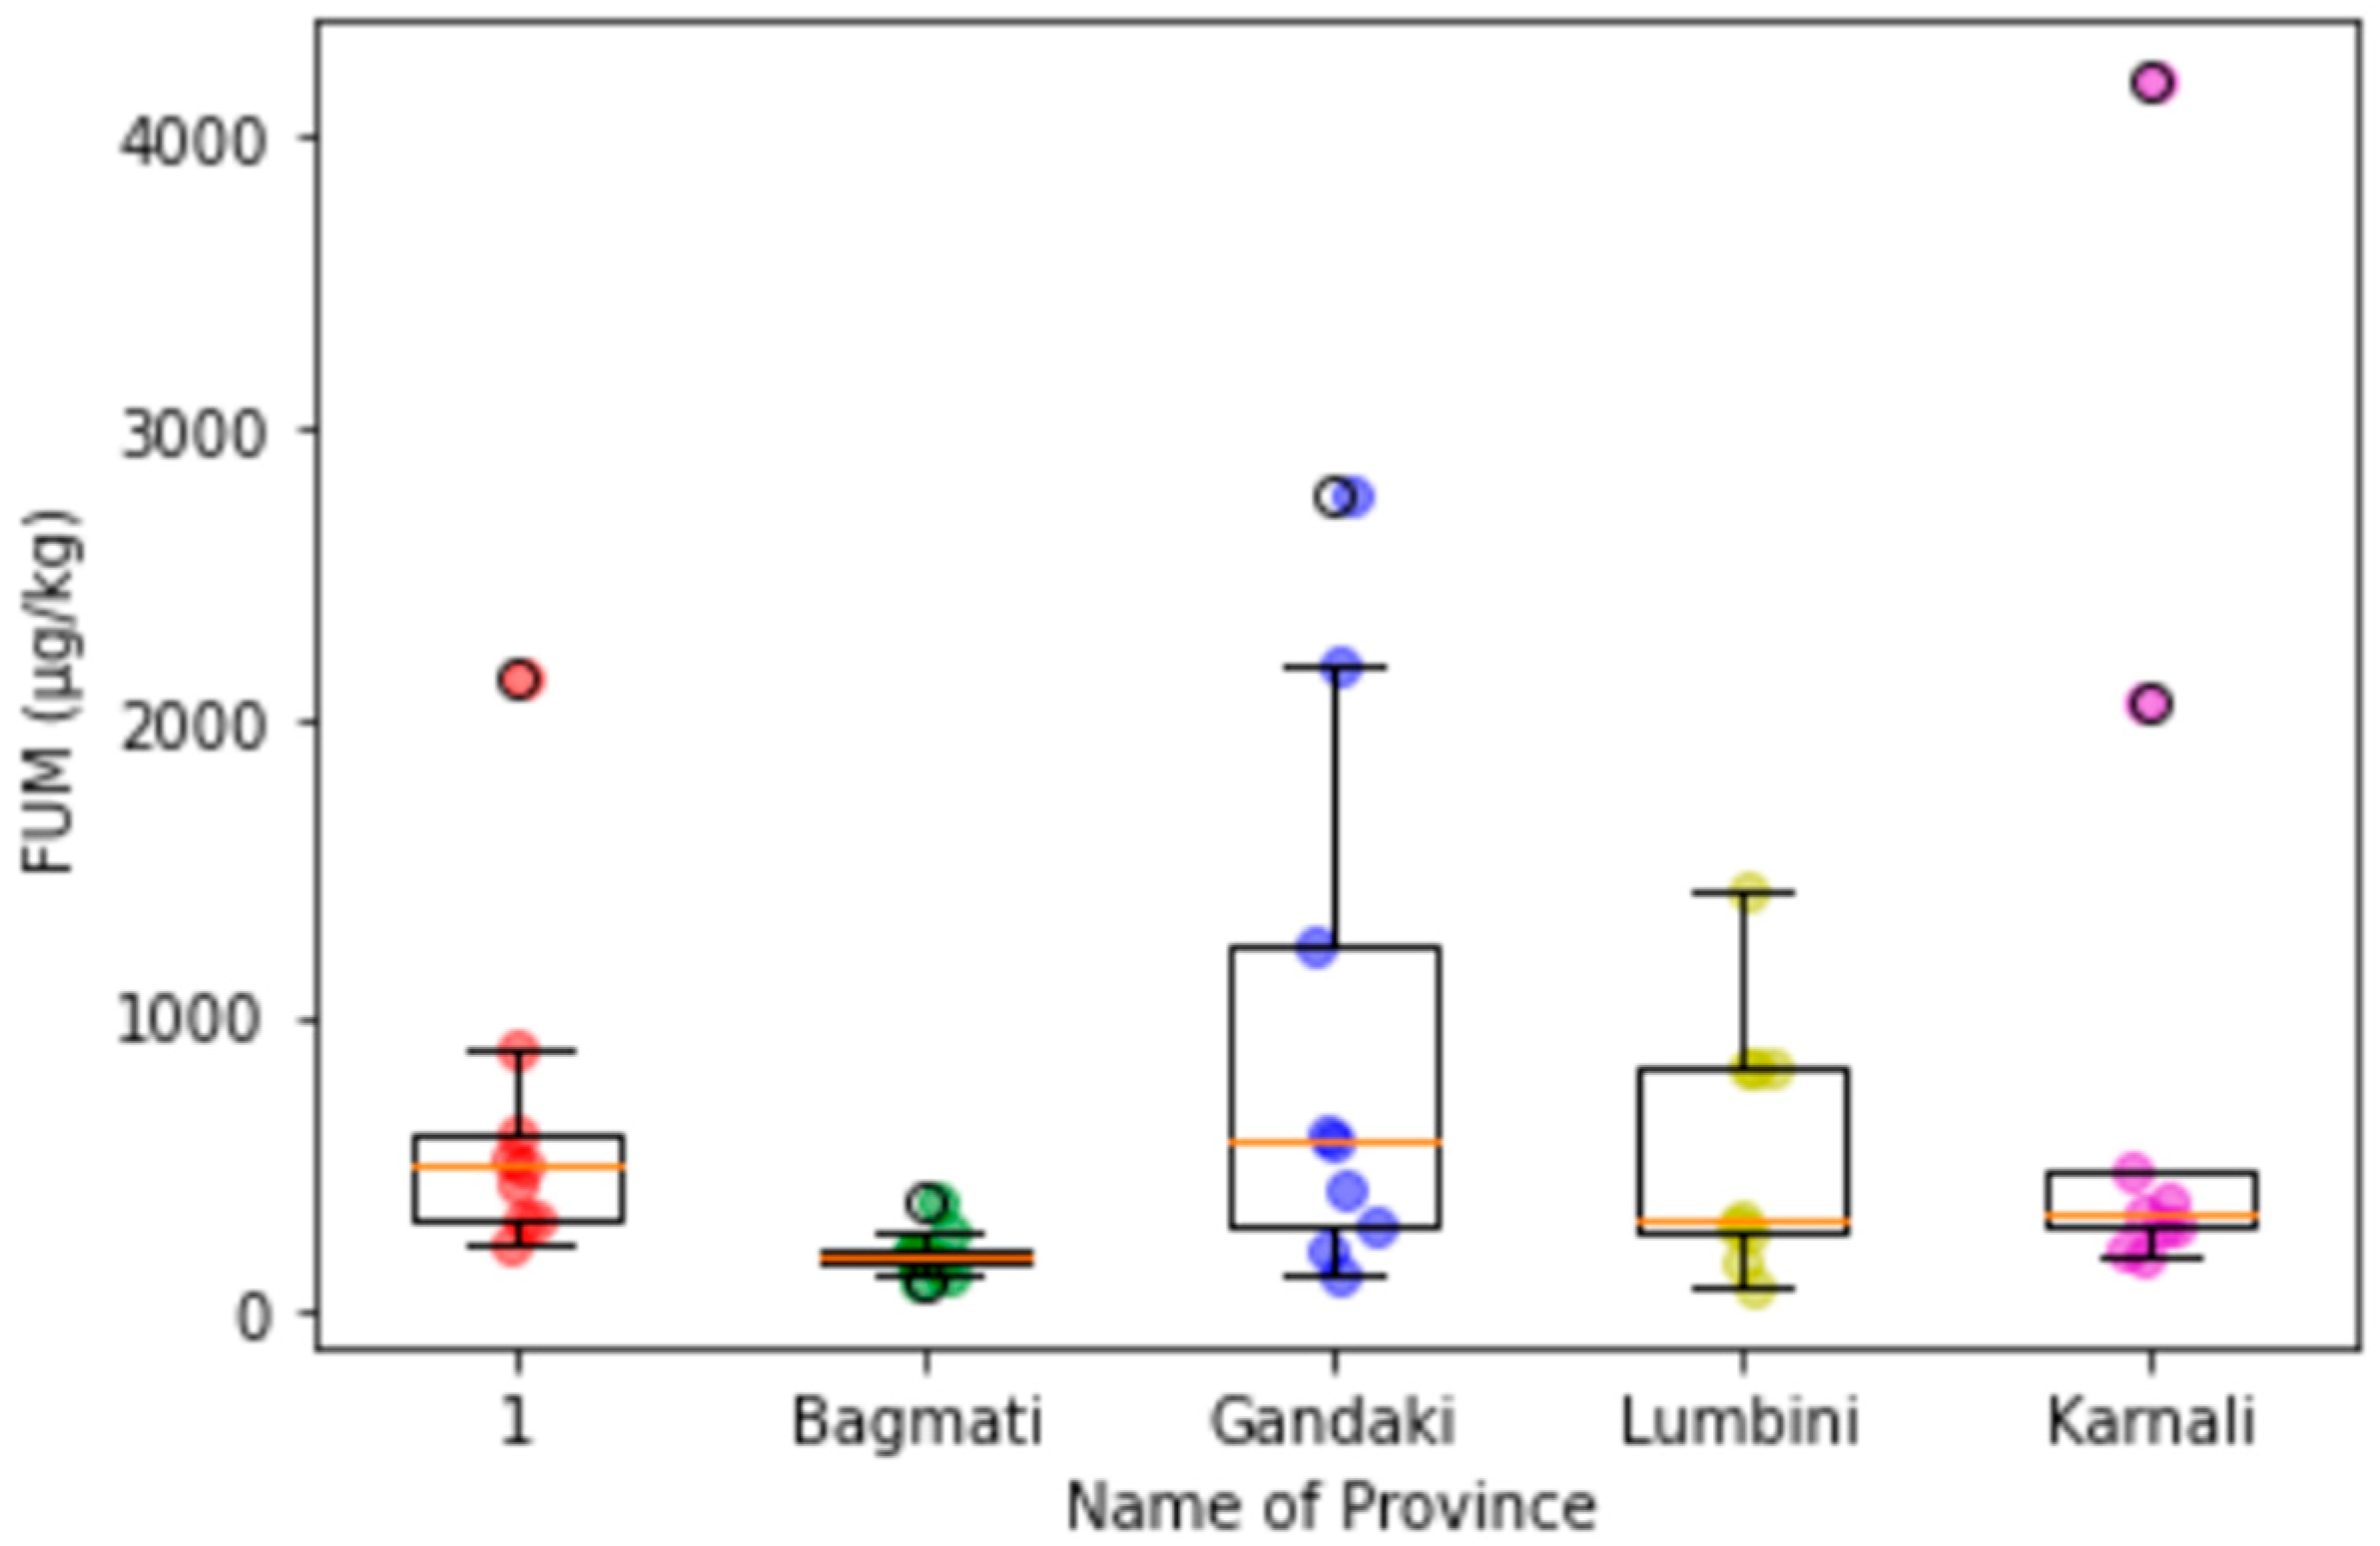
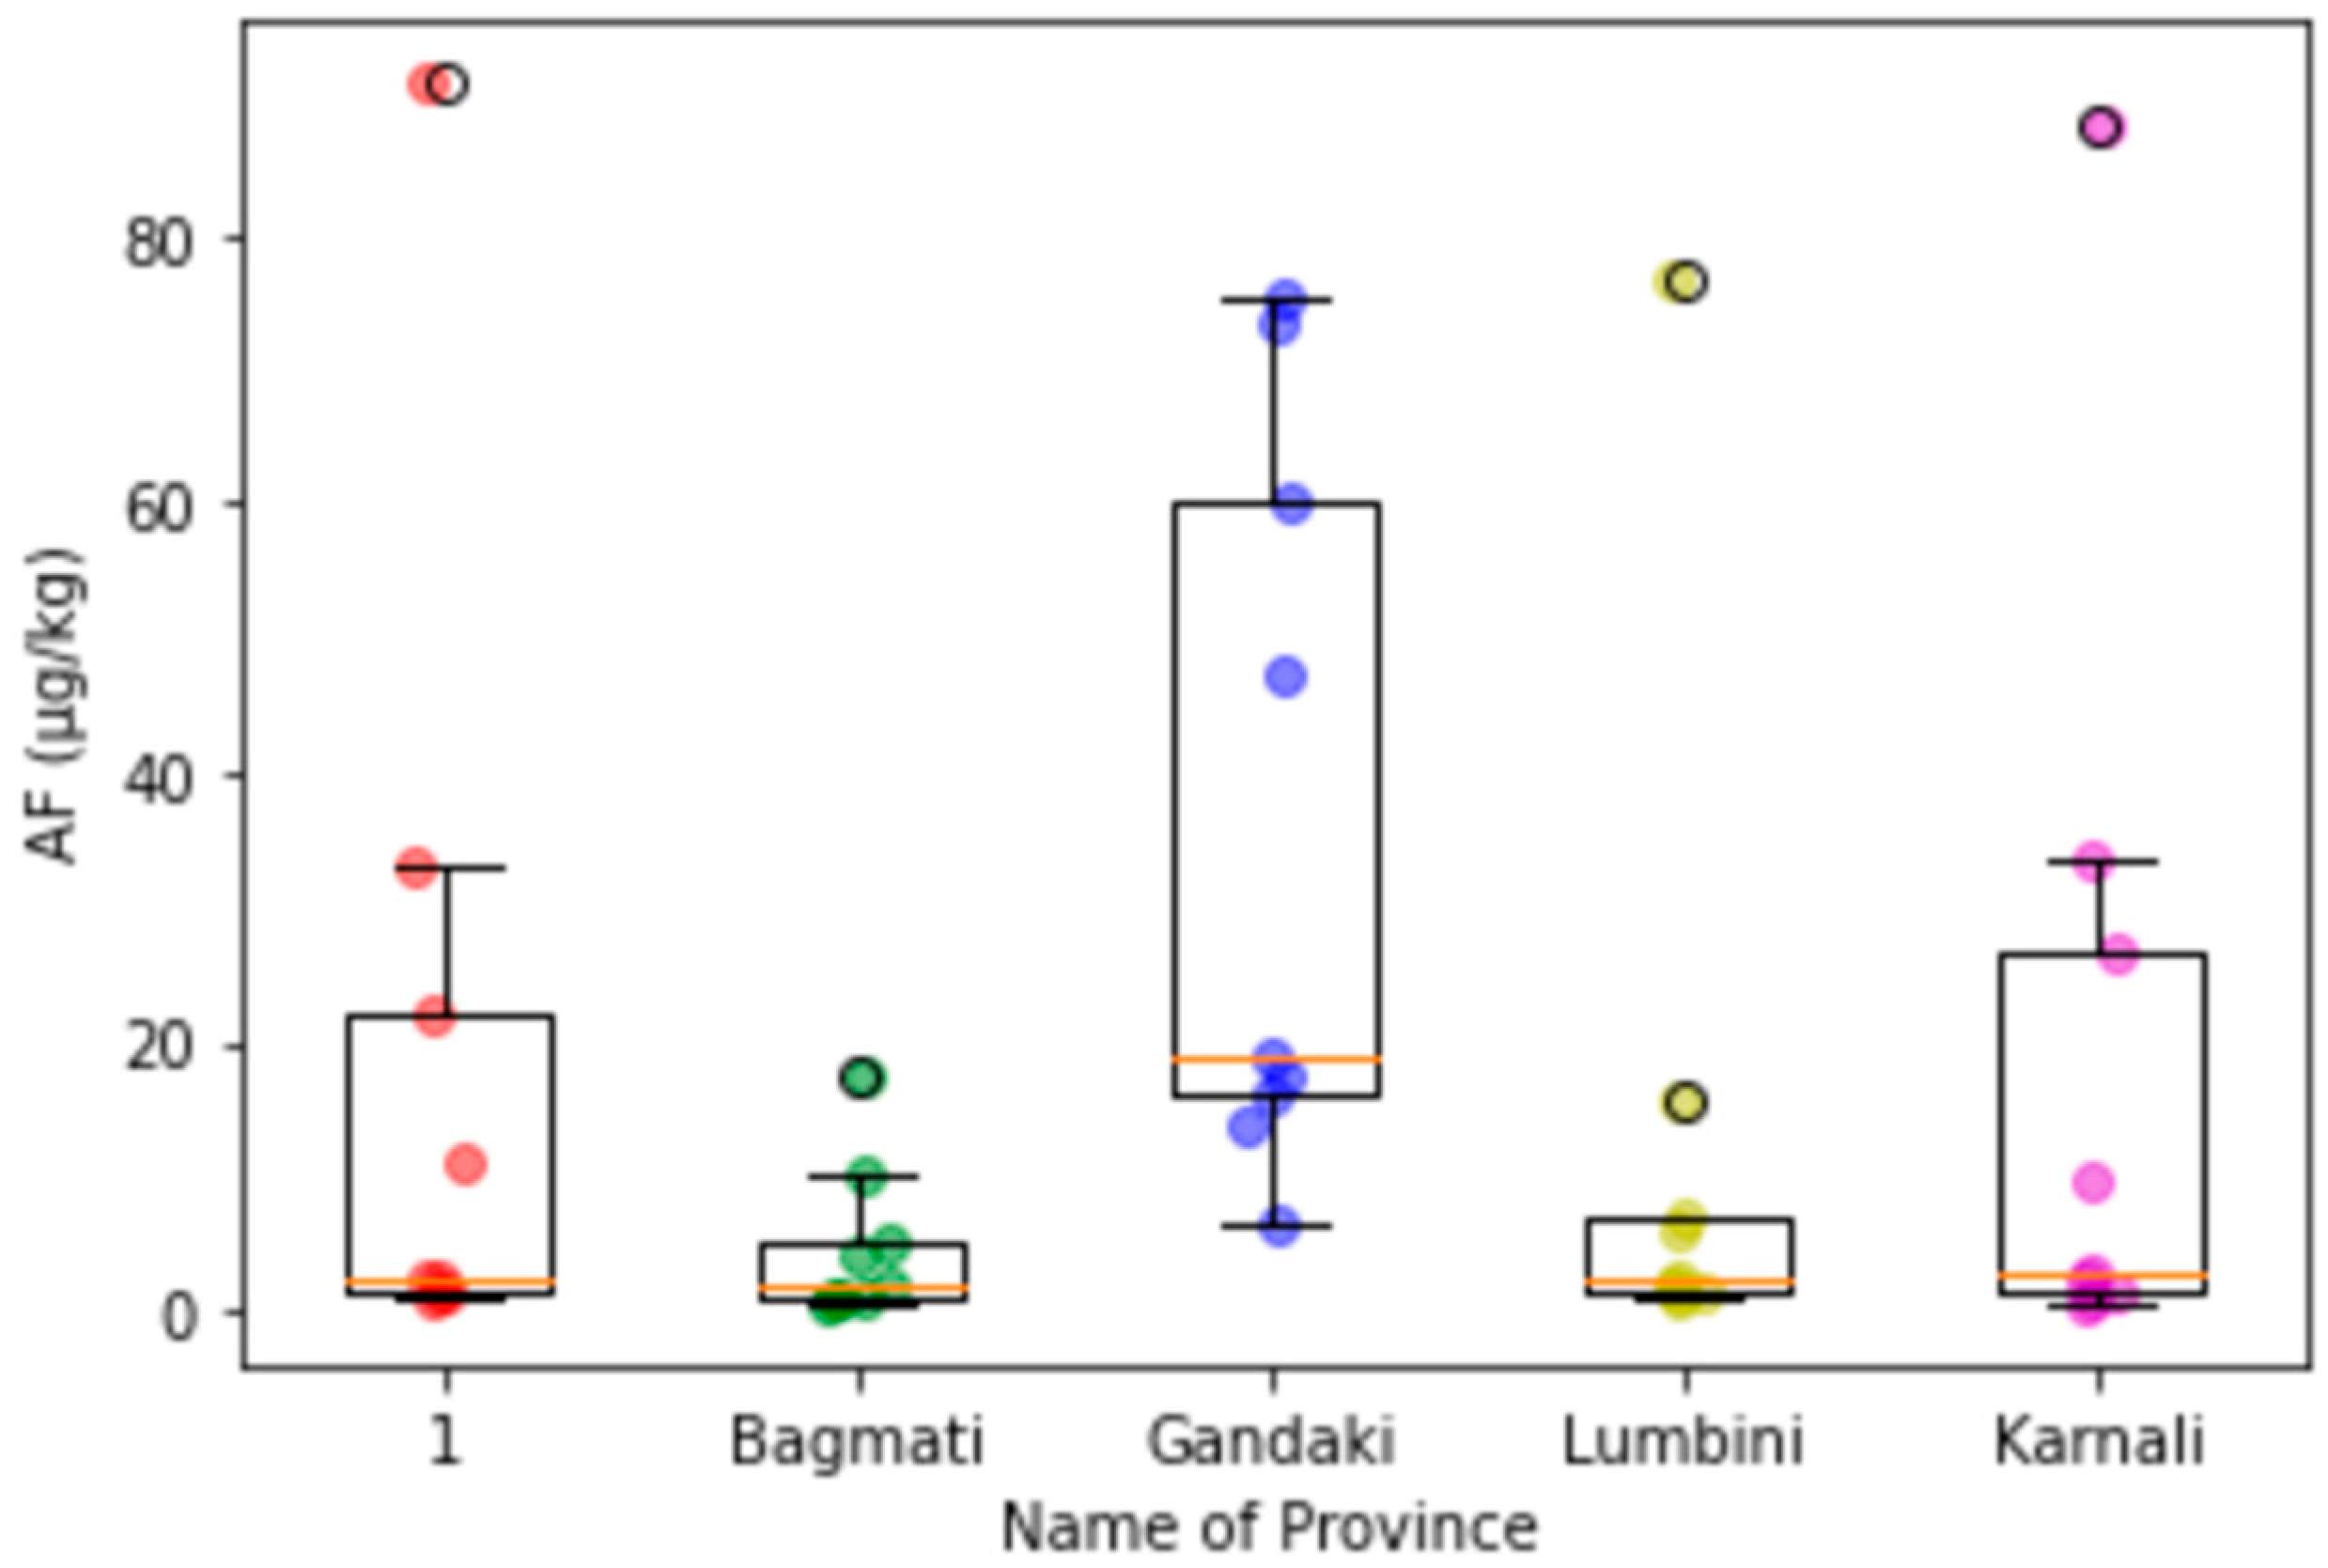
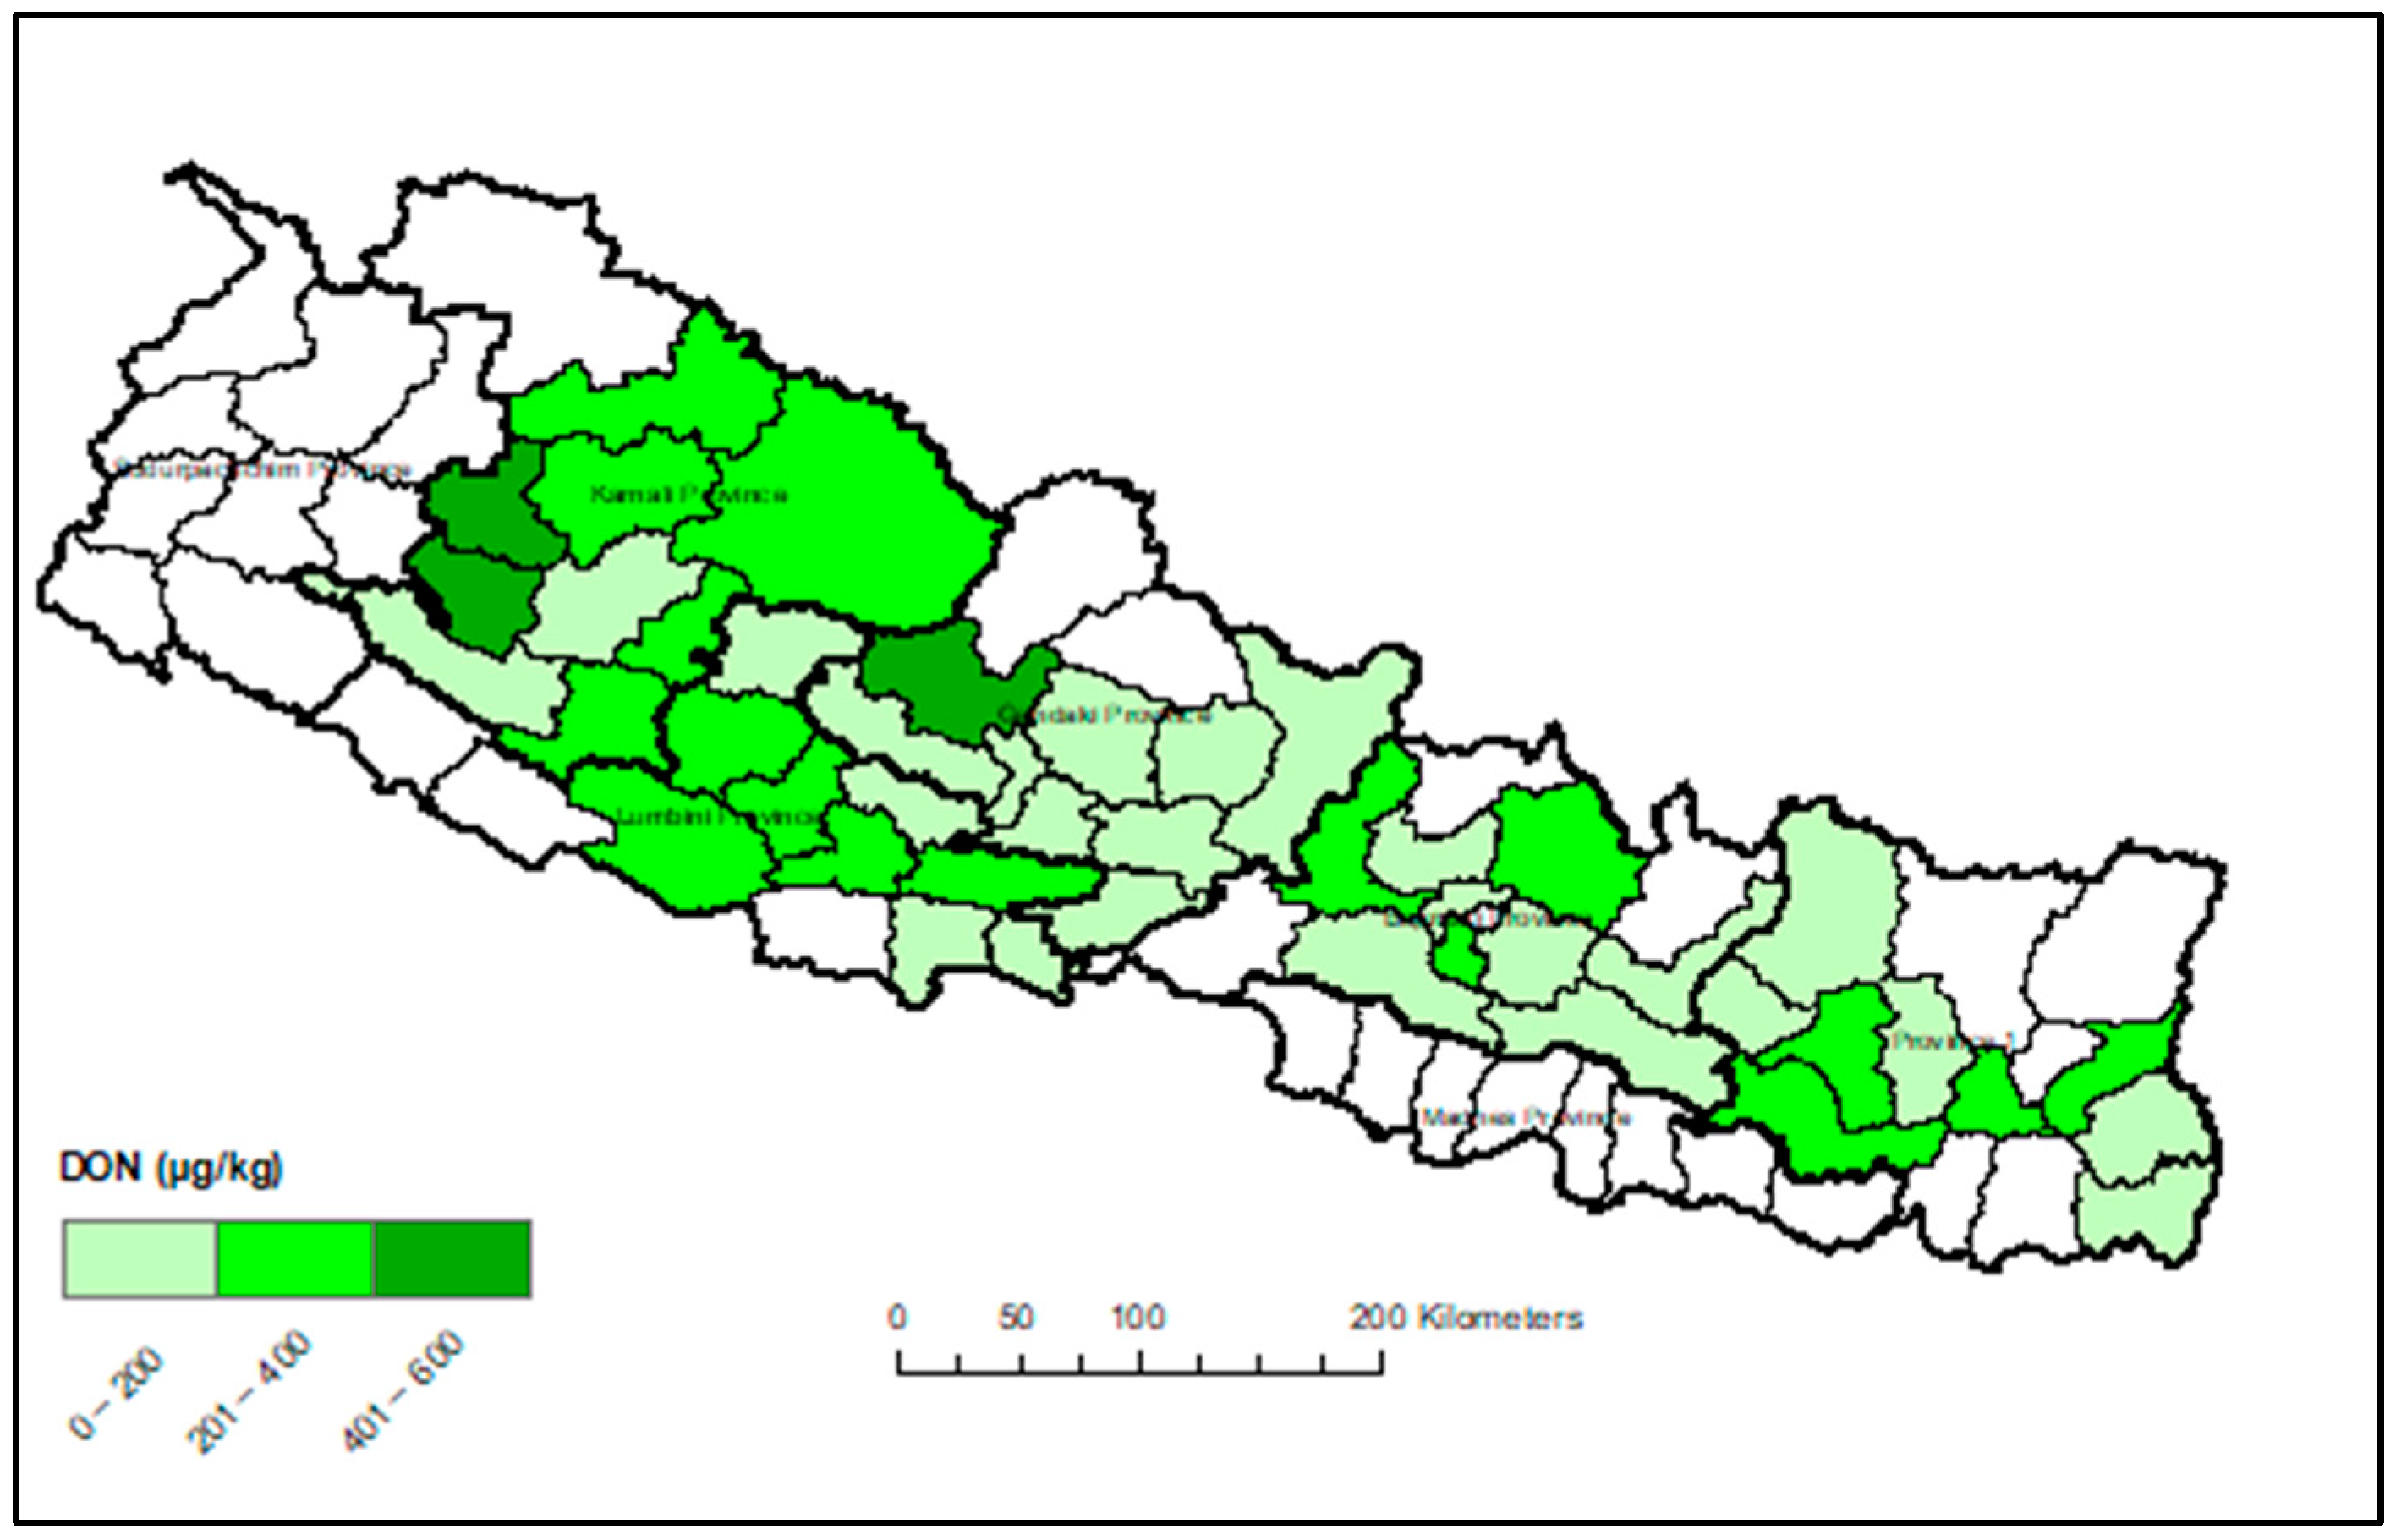
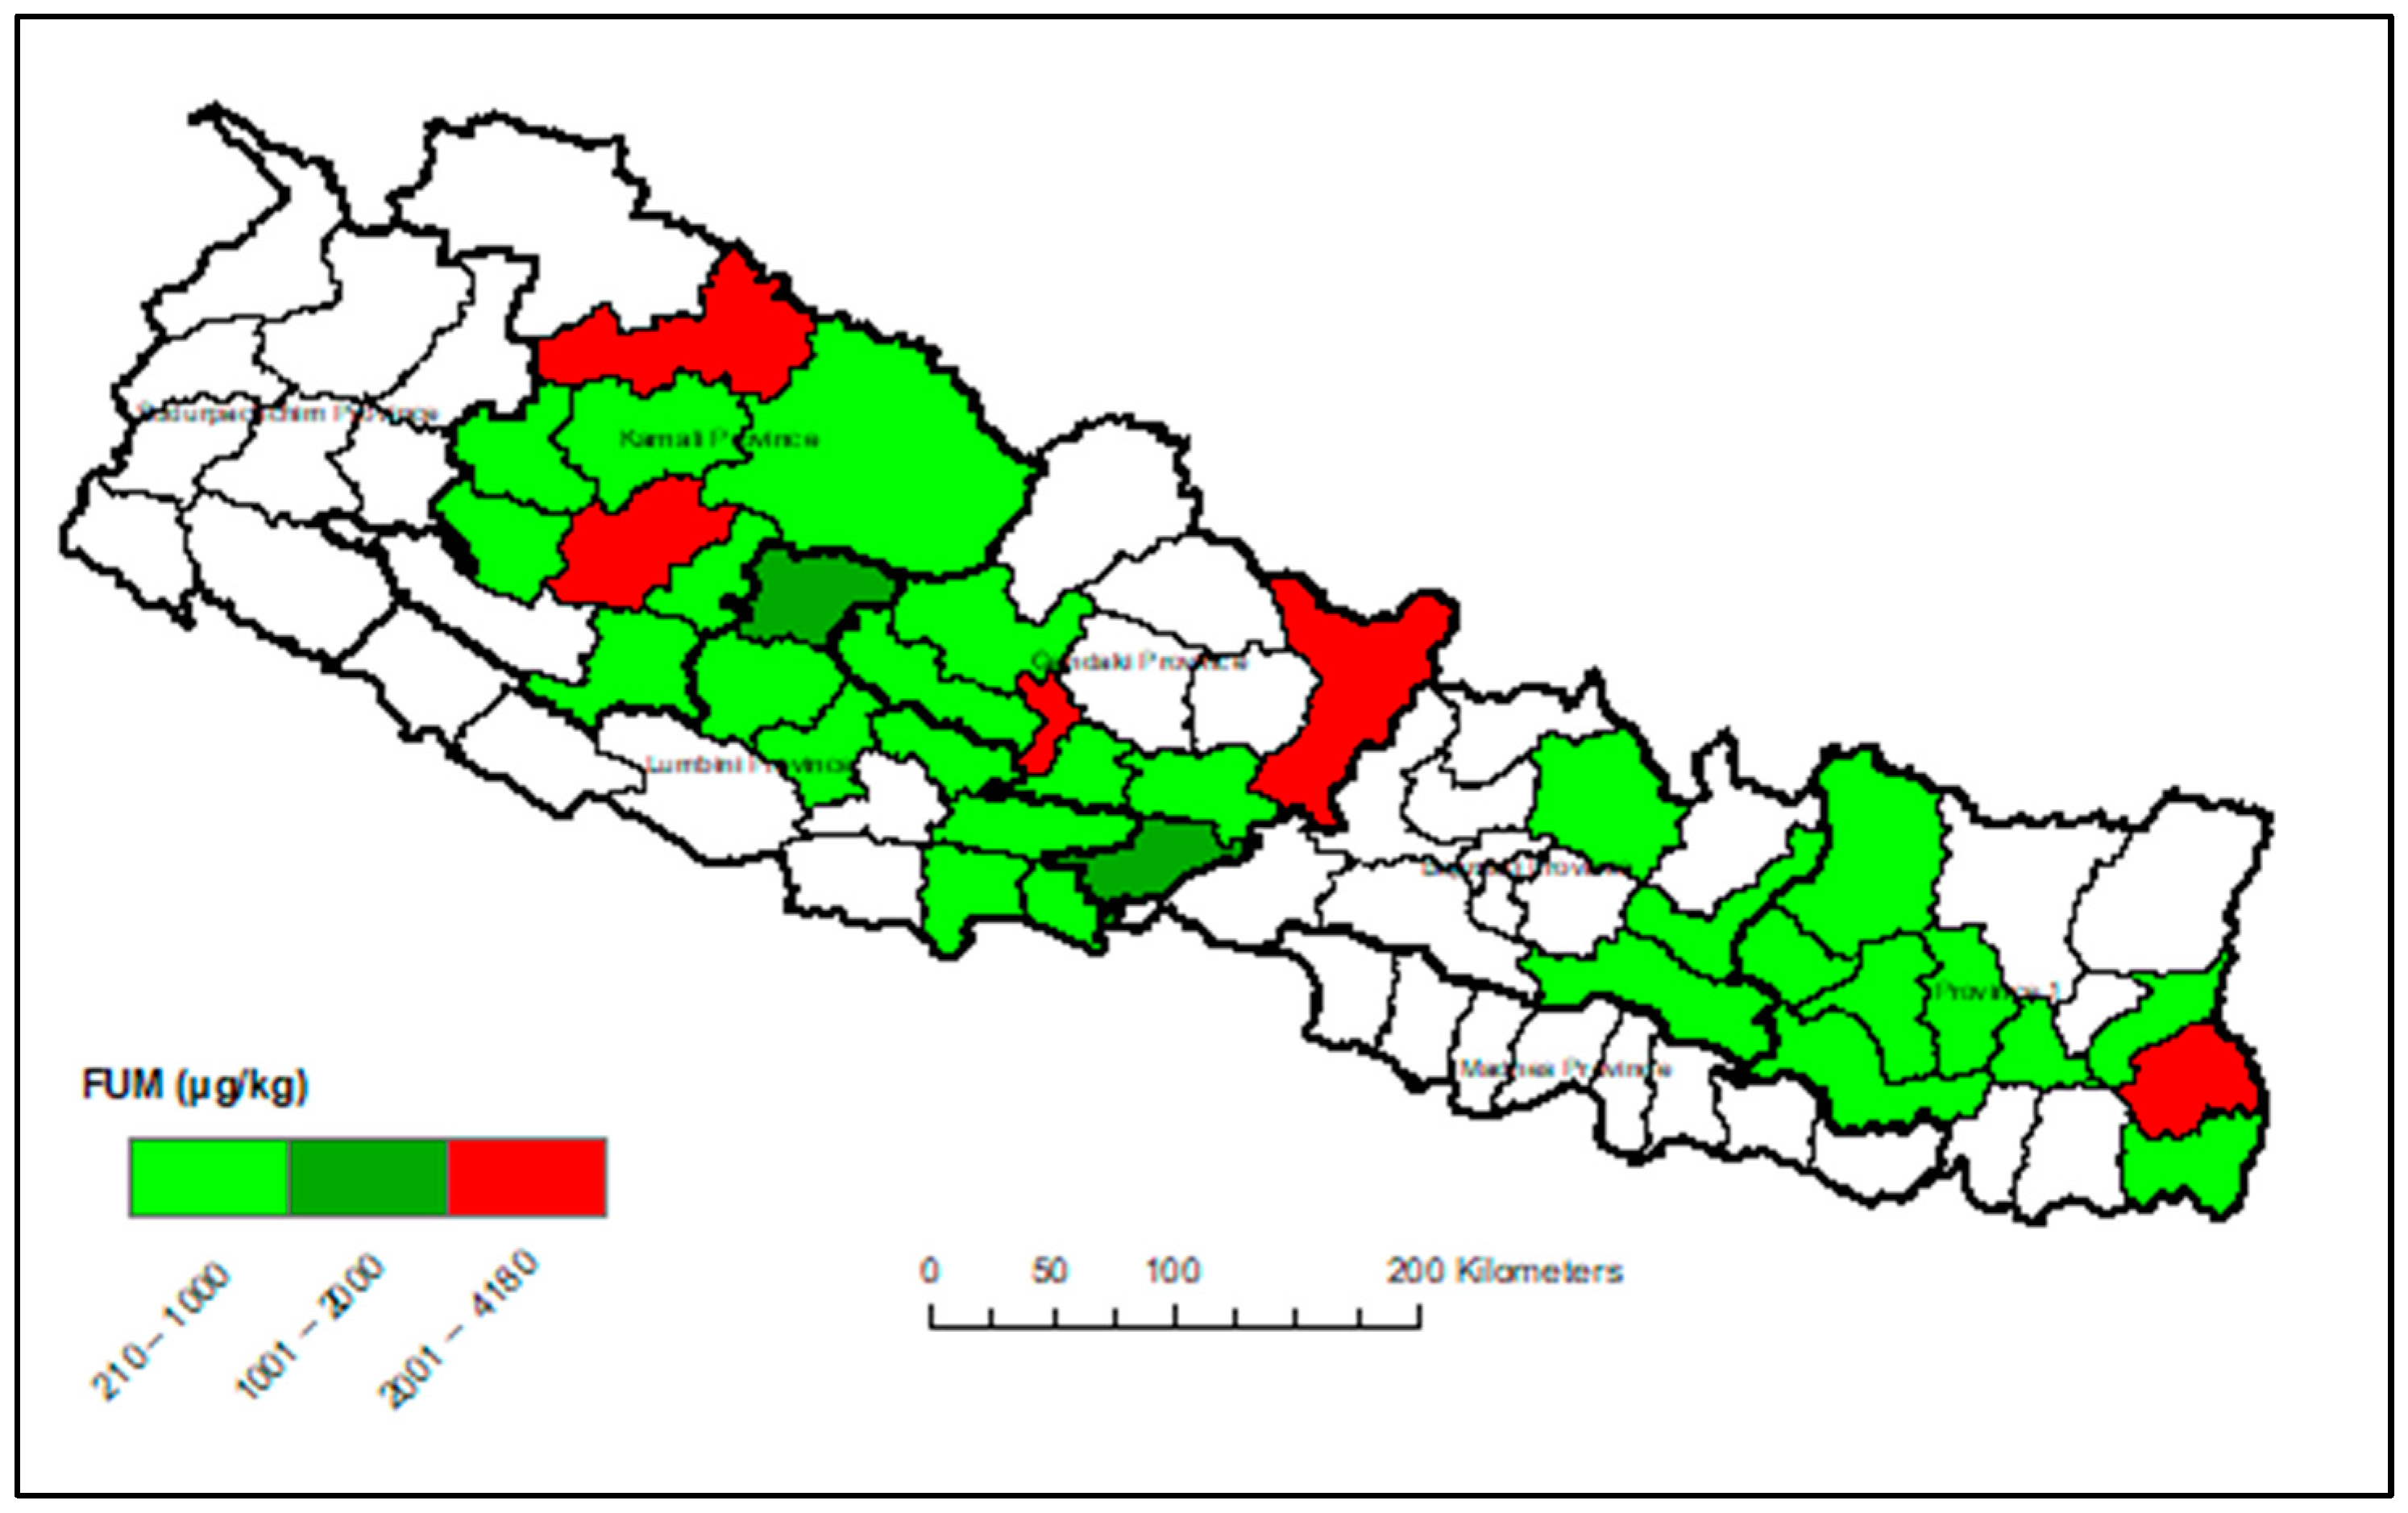
3.3. Provincial Distribution of Mycotoxins in Maize

All the samples (100%) from each province were contaminated with DON, with the highest average concentration (303.33 µg/kg) in Karnali and the lowest average concentration (194.44 µg/kg) in Province-1. However, all samples for AF (100%) were only positive in Gandaki followed by 89%, 78%, 67% and 56% in Province-1, Lumbini, Karnali and Bagmati, respectively, with the highest average concentration (36.56 µg/kg) in Gandaki and the lowest average concentration (7.77 µg/kg) in Bagmati. The higher mean concentration of AF in Gandaki might be attributed to the traditional drying and post-harvest practices in that area. Likewise, the climate of that region, characterized by high temperature and high humidity, might have favored the growth of Aspergillus spp. in the maize. The highest (1.71 µg/kg) and the lowest (1.31 µg/kg) average OT concentrations were reported in Karnali and Gandaki, respectively, with 100% of the samples positive for OT in Province-1 followed by 78%, 67%, 56% and only 11% in Karnali, Gandaki, Lumbini and Bagmati, respectively. Interestingly, 89% samples from both Province-1 and Karnali were positive for ZEA, while the other three provinces had the same percentage (67%) of ZEA-contaminated samples. The highest (28.15 µg/kg) and lowest (17.5 µg/kg) average ZEA concentrations were reported in Bagmati and Gandaki, respectively. All samples (100%) from Province-1 were contaminated with FUM followed by 89%, 78%,78% and 33% positive samples in Karnali, Lumbini, Gandaki and Bagmati, respectively, with the highest average concentration (1154.28 µg/kg) in Gandaki and the lowest (283.33 µg/kg) in Bagmati. One-way ANOVA revealed no significant differences across the studied provinces regarding any mycotoxin level. Out of the five mycotoxins analyzed, Fisher’s exact test of independence revealed that only the frequencies of OT and FUM positive samples were significantly (p < 0.05) affected by the district location. This heterogeneous distribution of mycotoxins in various provinces could be explained by the specific environmental conditions in each zone, such as the relative humidity and temperature in relation to the toxicogenic activity of the various strains of fungi in each geographical region.

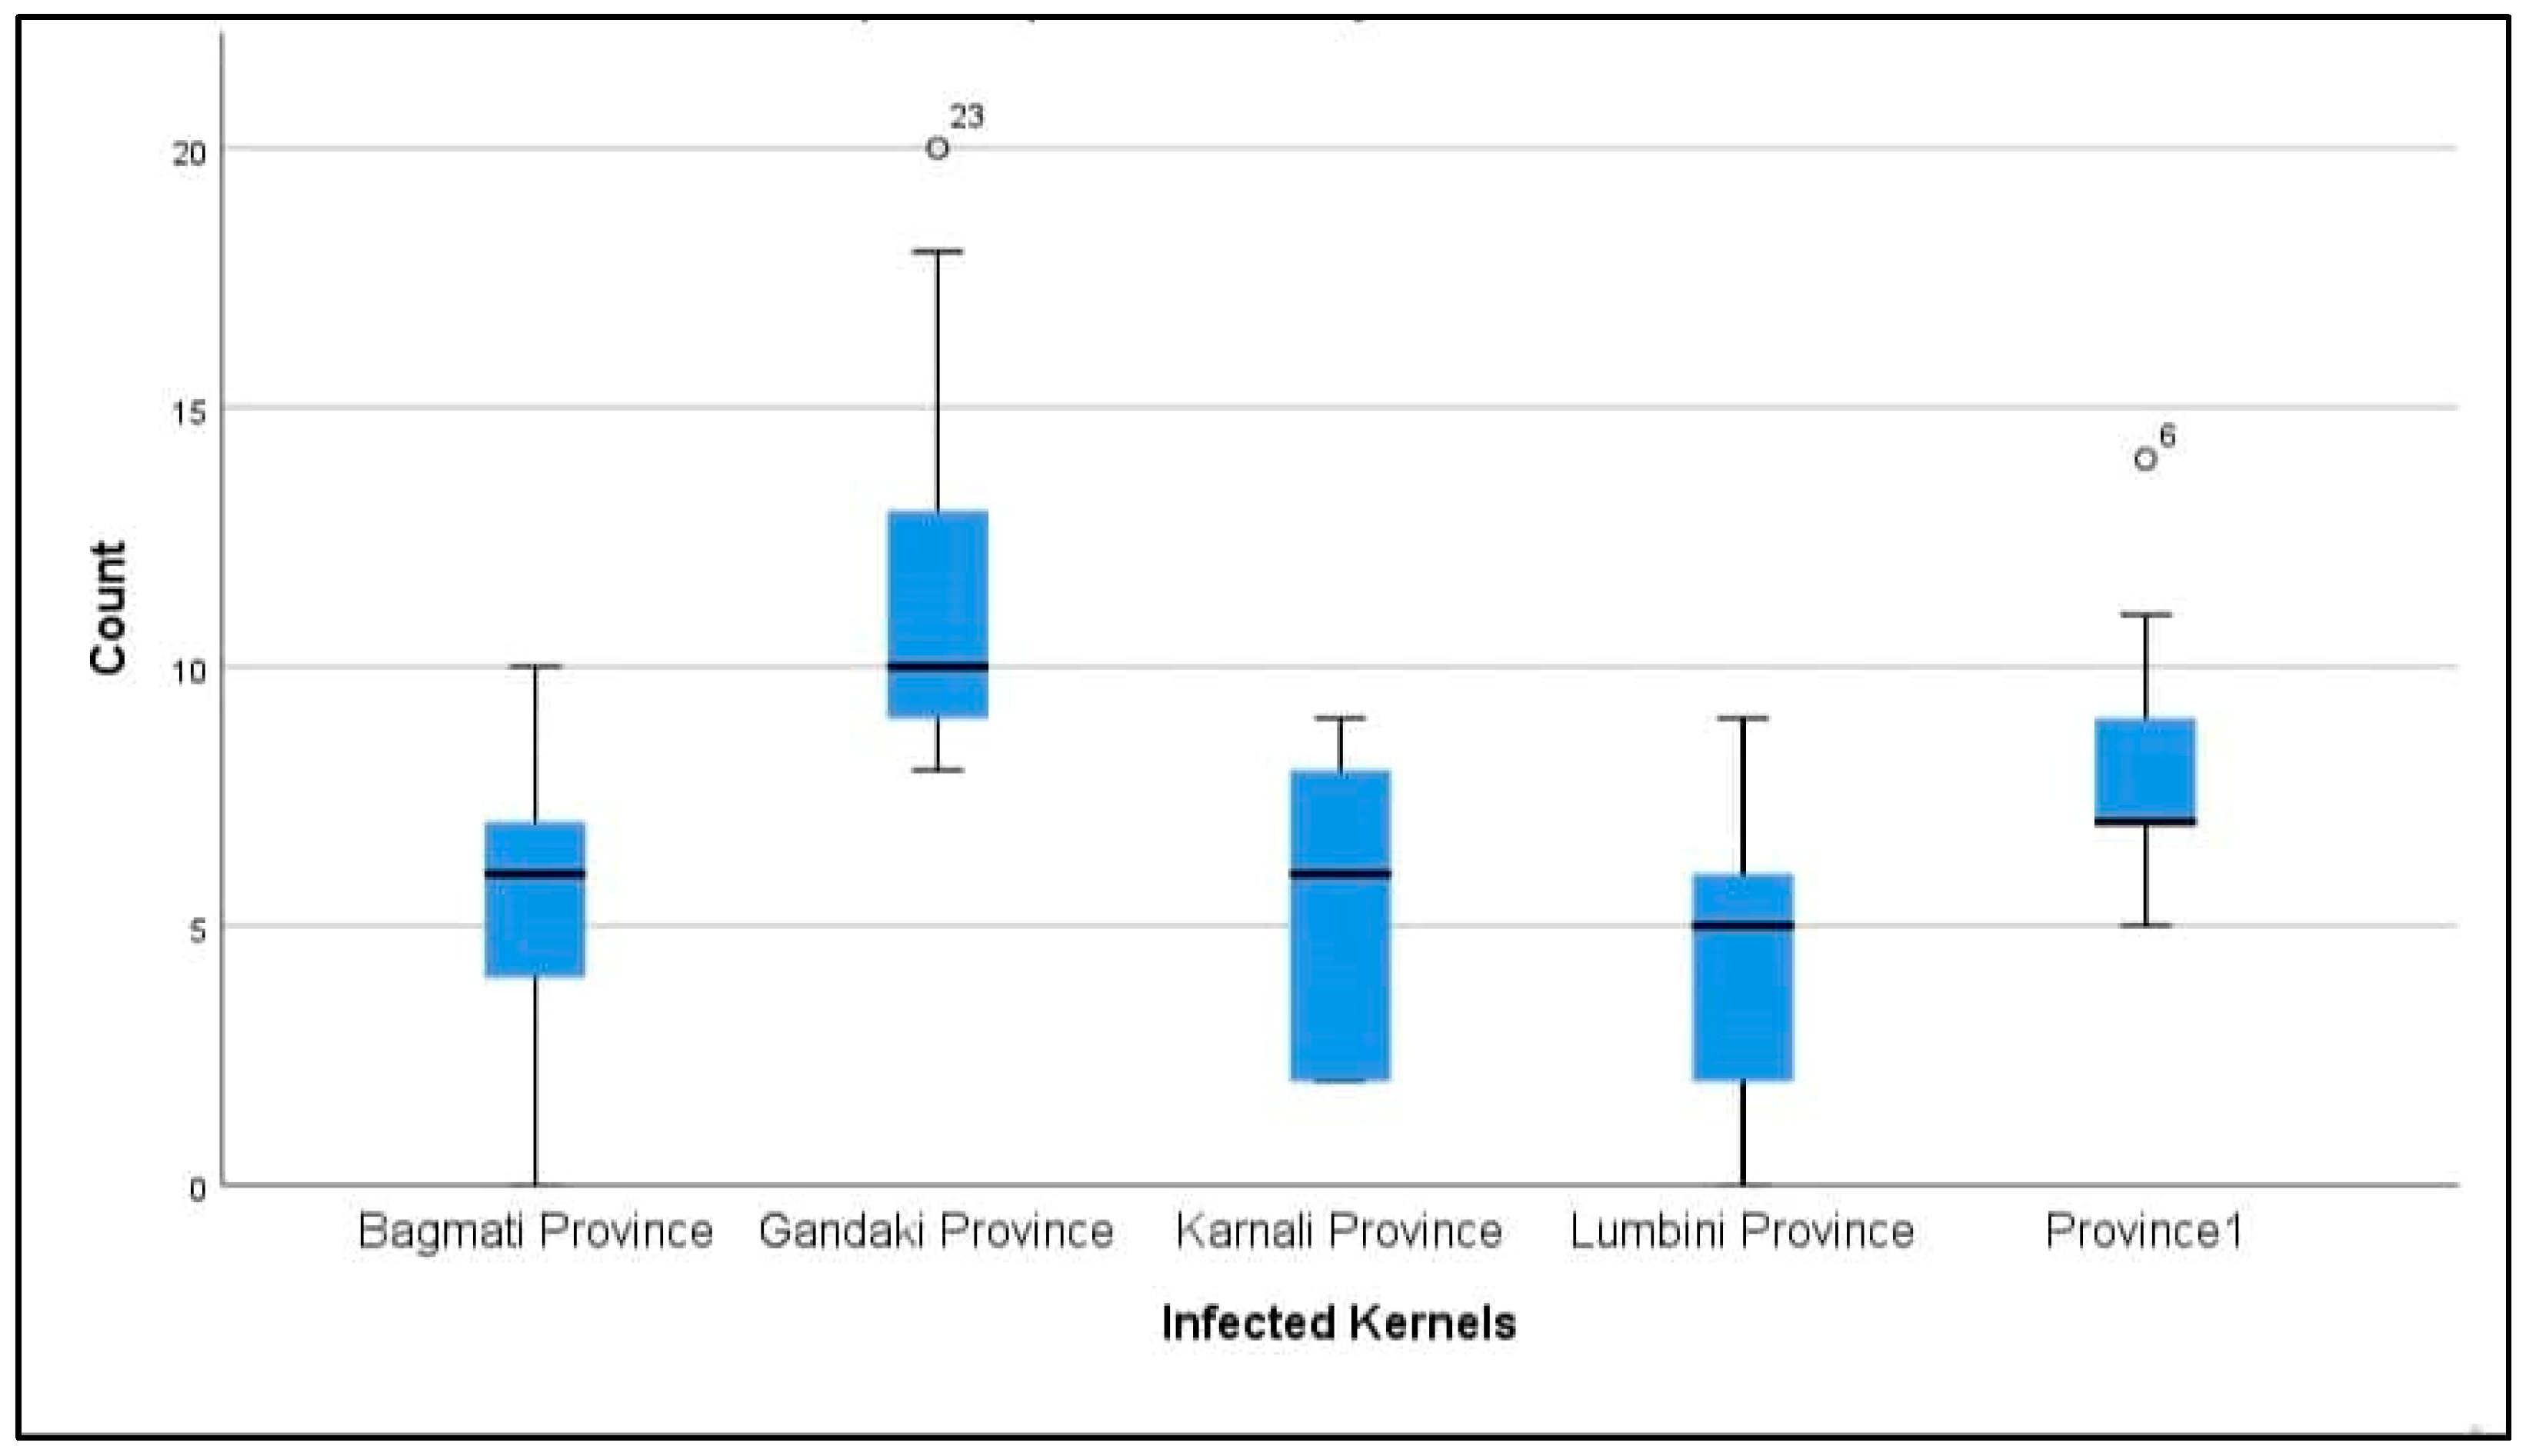
3.4. Kernel Mold Infection

The results showed that 318 out of 900 (35.33%) maize kernels were infected with fungi, and 582 (64.66%) kernels yielded no fungus. Based on morphological characteristics, the most common mold was Fusarium spp. in 10.9% of the kernels followed by green Aspergillus, Rhizopus spp., black Aspergillus and Penicillium spp. in 7.1%, 3.8%, 3.1% and 0.4%, respectively. The highest percentage of mold infection was reported in Gandaki (60%) followed by Province-1 (41.11), Bagmati (28.33%), Karnali (26.11%) and Lumbini (21.11%), respectively, as shown in Table 2. The obtained data regarding infected maize kernels in various provinces are also presented in a box-plot diagram in Appendix B (Figure A6).
As expected, the infection of Aspergillus spp. And Fusarium spp. was also highest in Gandaki. In terms of districts, samples from 42 out of 45 districts yielded fungus with 93.33% of samples (n = 45) detected with fungal contamination, and only 3 samples (6.66%) did not yield any fungus on the PDA medium. Out of the 45 districts, green Aspergillus infected maize samples in 23 districts. Fusarium was the most predominant fungal genus and infected maize samples in 32 out of the 45 districts, while maize samples from 19 districts were infected with black Aspergillus. In a similar study on Nepalese maize by Desjardins et al. [29], Fusarium species were predominant. Traditional and nonscientific methods of agricultural practices, poor storage conditions and unfavorable environmental conditions during pre and post- harvest processing of the maize grain or crop are the main factors for the infection and colonization of fungi [43].

3.5. Mycotoxin-Producing Potential of Mold Isolated from Maize

In our study, 5 (14.7%) out of 34 green Aspergillus isolates produced AFB1 within the range of 279.88 to 3653.49 ng/g. In a similar study by Saleemi et al. [44] using Pakistan maize, 14 out of 27 (52%) isolates of Aspergillus were aflatoxigenic, which was clearly more than in our study, where the AFB1 production potential was in the range of 12.7 to 1374 ng/g. Likewise, studies by Giorni et al. [45] and Wicklow et al. [46] reported that 70% and 53%, respectively, of Aspergillus species were aflatoxigenic. In the present study, out of the 27 black Aspergillus isolates, 3 (11.11%) produced OTA and 3 (11.11%) produced fumonisin B1 (FB1). Isolates produced OTA and FB1 in the YES media in the ranges of 631.17–1402.12 ng/g and 5604.14–20,198.88 µg/g, respectively.
All the Fusarium isolates (n = 40) grown on maize produced fumonisins with an average mean concentration of 12,067 µg/kg with the highest and lowest concentrations being 15,950 and 5750 µg/kg, respectively. These figures were well supported by Desjardins et al. [29], who analyzed the fumonisin production by strains of Gibberella fujikuroi MP-A isolated from Nepalese maize and reported that all 28 strains produced high levels of fumonisins in culture, with means ± SD of 4680 ± 2420 µg/g FB1, 2210 ± 2710 µg/g FB2 and 3470 ± 3250 µg/g FB3. However, this differed with Nelson et al. [47], who reported little or no fumonisin production by strains of G. fujikuroi isolated from maize from Kathmandu, Nepal.

3.6. Identification of Fungi Isolated from Maize

In our study, 150 isolates were recovered from 45 samples. Based on the morphology and toxin production potential, 24 representative fungal isolates were selected for molecular identification. The results of the identification of the fungal species isolated from Nepalese maize are presented in Table 3 below. Notably, from the molecular identification, Fusarium isolates were identified into a single species, namely, F. pseudocircinatum, which was present in all five provinces studied in Nepal, based on samples of nine isolates. However, unlike our results, another study of the mycoflora in Nepalese maize by Desjardins and Busman [12] reported that the predominant species were F. verticillioides and F. proliferatum.
Six different species of Aspergillus were identified in our study—A. oryzae, A. niger, A. flavus, A. fumigatus, A. tubingensis and A. filifer—of which A. niger was the most prevalent and was identified in three provinces followed by A. oryzae in two provinces based on the examination of 15 isolates. The other four species of Aspergillus were the least frequent species, and each occurred in a single province only. Similarly, Susca et al. [48] found A. niger, A. welwitschiae and A. tubingensis in maize grains from the USA. In addition, our identification results were well supported by other researchers [49,50].
Based on our results on molecular identification, the one AFB1-producing species was identified as A. flavus, while those responsible for producing OTA were A. niger and A. tubingensis. Similarly, A. niger and F. pseudocircinatum isolated from maize produced fumonisin in our study. Similar to our findings, AFB1 production by A. flavus isolated from maize grains has been reported in the past [51,52]. Our study results were also in agreement with the clearly established fact that A. niger has the potential to produce two groups of potentially carcinogenic mycotoxins: fumonisins and ochratoxins [53,54]. Although, the ability of A. tubingensis to produce OTA remains a controversial issue, Medina et al. [55] also reported A. tubingensis as an OTA producer, similar to our study. The controversy regarding OTA production potential of this species could possibly have arisen due to misidentification of the species, the use of different culture media or incubation times. Likewise, the fumonisin-producing Fusarium species was identified as F. pseudocircinatum, which has been reported frequently as a fumonisin producer [56,57].

3.7. Dietary Exposure and Risk Assessment of Aflatoxin in Maize

Considering that aflatoxin, particularly aflatoxin B1, is reported to be the most toxic carcinogen (classified as a Group 1 carcinogen by IARC) that induces liver cancer, and to a lesser extent rectal cancer, dietary exposure and risk assessment of this toxin was carried out. The EDI, MOE and the potency of liver cancer due to the consumption of maize are given in Table 4.
To the best of our knowledge, this is the first study in Nepalese maize on AF exposure using EDI values and the MOE approach. The estimated mean aflatoxin exposure and the 97.5th percentile of exposure in this study were 30.46 and 146.30 ng/kg bw/day, respectively. These findings were much higher than reported by Pokhrel [10] in Nepalese maize (0.012 and 0.057 µg/kg bw/day, respectively), more than reported in Serbia, Croatia and Greece, where the average exposure rates were in the ranges of 0.44 to 5.59 ng/kg bw/day [58]. Likewise, the EDI values in our study were higher than those reported in Indonesia and China [59,60]. Interestingly, our result was quite low compared to that of Kenya (292 ng/kg bw/day), which might have been due to the higher daily maize consumption in that country [61].
Furthermore, the MOE approach was used to characterize the risk of consuming maize contaminated with aflatoxins. The MOE value obtained from the mean dietary exposure of aflatoxins in our study was less than 10,000, which indicated a major risk to maize consumers in Nepal, as an MOE value lower than the safe limit (≤10,000) indicates a potential risk to public health [62].
The provisional maximum tolerable daily intake value of aflatoxins for children and adults without hepatitis is 1 ng/kg bw/day; thus, the exposure to aflatoxins in the Nepalese population due to consumption of maize is high enough to cause a public health concern. In our study, the risk of liver cancer in Nepal was estimated at 0.38 cancer cases/year/100,000 people for average maize consumption, while at the 97.5th percentile, the potency of liver cancer was almost five times higher.

4. Conclusions

The present Nepalese maize investigation revealed different levels and the co-occurrence of various mycotoxins. DON was the most frequent contaminant among the five analyzed mycotoxins while OT was the least. Except for a few samples that exceeded the MPL for AF as set by the Government of Nepal and for FUM as set by the EU, all samples complied with the MPL standards of the European regulations for OT, ZEA and DON. The contaminants of maize were mainly due to the presence of Aspergillus spp., Fusarium spp. and Penicillium spp. Although, the average mycotoxin levels (except for AF) revealed in this study were much less than the MPL standards of the EU, their co-exposure with AF could present an increased risk to human and animal health. Likewise, the present risk assessment indicates there is a risk of maize being a source of aflatoxin exposure in Nepal. Therefore, in a country such as Nepal where maize is consumed as a staple diet, a thorough control of mycotoxins throughout the food chain is obligatory to safeguard the health of the population. Furthermore, the co-occurrence of at least two mycotoxins in all the analyzed samples raises alarm about their frequencies in maize. Additionally, our study suggests an obligation to develop MPL standards for Nepal that apply to other mycotoxins such as OT, ZEA, FUM and DON and to establish effective monitoring programs for mycotoxin analysis in maize grains across the country.

Author Contributions

Conceptualization, P.J. and W.M.; formal analysis, P.J. and C.C.; writing—original draft preparation, P.J.; writing—review and editing, W.M. and T.M.; supervision, W.M. and T.M. All authors have read and agreed to the published version of the manuscript.

Funding

This research was funded by Kasetsart University Research and Development Institute (KURDI), Kasetsart University, Bangkok, Thailand.

Institutional Review Board Statement

Not applicable.

Informed Consent Statement

Not applicable.

Data Availability Statement

Not applicable.

Acknowledgments

The authors would like to acknowledge Graduate School, the Department of Food Science and Technology, Thailand International Co-operation Agency (TICA), Government of Nepal and Toxin Laboratory (KURDI) Kasetsart University for their outstanding support.

Conflicts of Interest

The authors declare no conflict of interest.

Appendix A. Heat Maps of Mycotoxin Occurrence in Nepalese Maize

Figure A1. Heat map of DON occurrence in Nepalese maize. The range of found concentration of DON is shown in light green, green and dark green colors, representing the concentrations ranging from low to high. DON was found in concentrations of 110 to 520 µg/kg.
Microbiolres 13 00021 g0a1
Figure A2. Heat map of ZEA occurrence in Nepalese maize. The range of found concentration of ZEA is shown in light green, green and dark green colors, representing the concentrations ranging from low to high. ZEA was found in concentrations of 11.12 to 69.52 µg/kg.
Microbiolres 13 00021 g0a2
Figure A3. Heat map of OT occurrence in Nepalese maize. The range of found concentration of OT is shown in light green, green and dark green colors, representing the concentrations ranging from low to high. OT was found in concentrations of 1 to 3.22 µg/kg.
Microbiolres 13 00021 g0a3
Figure A4. Heat map of FUM occurrence in Nepalese maize. The range of found concentration of FUM is shown in light green, dark green and red colors, representing the concentrations ranging from low to high, and red indicating the areas exceeding the EU maximum limit. FUM was found in concentrations of 200 to 4180 µg/kg.
Microbiolres 13 00021 g0a4
Figure A5. Heat map of AF occurrence in Nepalese maize. The range of found concentration of AF is shown in green and red colors, where red indicates the areas exceeding the EU maximum limit. AF was found in concentrations of 1.52 of 91.24 µg/kg.
Microbiolres 13 00021 g0a5

Appendix B. Box-Plot Diagram of Infected Maize Kernels

Figure A6. Infected maize kernels in five different provinces of Nepal.
Microbiolres 13 00021 g0a6

Appendix C. Box-Plot Diagrams with Scattering Dots for the Contamination Level of Mycotoxins in Maize in Different Provinces

Figure A7. Contamination level of DON.
Microbiolres 13 00021 g0a7
Figure A8. Contamination level of ZEA.
Microbiolres 13 00021 g0a8
Figure A9. Contamination level of OT.
Microbiolres 13 00021 g0a9
Figure A10. Contamination level of FUM.
Microbiolres 13 00021 g0a10
Figure A11. Contamination level of AF.
Microbiolres 13 00021 g0a11

References

  1. Wielogorska, E.; Mooney, M.; Eskola, M.; Ezekiel, C.N.; Stranska, M.; Krska, R.; Elliott, C. Occurrence and human-health impacts of mycotoxins in Somalia. J. Agric. Food Chem. 2019, 67, 2052–2060. [Google Scholar] [CrossRef] [PubMed]
  2. Tola, M.; Kebede, B. Occurrence, importance and control of mycotoxins: A review. Cog. Food Agric. 2016, 2, 1191103. [Google Scholar] [CrossRef]
  3. Ostry, V.; Malir, F.; Toman, J.; Grosse, Y. Mycotoxins as human carcinogens—The IARC Monographs classification. Mycotoxin Res. 2017, 33, 65–73. [Google Scholar] [CrossRef] [PubMed]
  4. Alassane-Kpembi, I.; Schatzmayr, G.; Taranu, I.; Marin, D.; Puel, O.; Oswald, I.P. Mycotoxins co-contamination: Methodological aspects and biological relevance of combined toxicity studies. Crit. Rev. Food Sci. Nutr. 2017, 57, 3489–3507. [Google Scholar] [CrossRef] [PubMed]
  5. Silva, E.; Rajapakse, N.; Kortenkamp, A. Something from “nothing”—Eight weak estrogenic chemicals combined at concentrations below NOECs produce significant mixture effects. Environ. Sci. Technol. 2002, 36, 1751–1756. [Google Scholar] [CrossRef] [PubMed]
  6. Gurung, D.B.; KC, D.; Ortiz Ferrara, G.; Gadal, N.; Pokhrel, S.; Bhandari, D.R.; Koirala, K.B.; Bhandari, B.R.; Tripathi, M. Maize value chains in Nepal. In Proceedings of the 11th Asian Maize Conference, Beijing, China, 7–11 November 2011. [Google Scholar]
  7. CBS. Nepal Living Standard Survey 2010/11, Statistical Report; Central Bureau of Statistics, Government of Nepal Kathmandu: Kathmandu, Nepal, 2011.
  8. Ranum, P.; Peña-Rosas, J.P.; Garcia-Casal, M.N. Global maize production, utilization, and consumption. Ann. N. Y. Acad. Sci. 2014, 1312, 105–112. [Google Scholar] [CrossRef] [PubMed]
  9. FAOSTAT. Agriculture Organization of the United Nations. FAO. 2011. Available online: https://www.fao.org/faostat/en/#home (accessed on 11 February 2020).
  10. Pokhrel, P. Postharvest Handling and Prevalence of Aflatoxin Contamination in Nepalese Maize Produce. J. Food Sci. Technol. Nep. 2016, 9, 11–19. [Google Scholar] [CrossRef] [Green Version]
  11. Chulze, S.N. Strategies to reduce mycotoxin levels in maize during storage: A review. Food Addit. Contam. 2010, 27, 651–657. [Google Scholar] [CrossRef]
  12. Desjardins, A.E.; Busman, M. Mycotoxins in developing countries: A case study of maize in Nepal. Mycotoxin Res. 2006, 22, 92–95. [Google Scholar] [CrossRef]
  13. Qin, P.W.; Xu, J.; Jiang, Y.; Hu, L.; Van Der Lee, T.; Waalwijk, C.; Zhang, W.M.; Xu, X.D. Survey for toxigenic Fusarium species on maize kernels in China. World Mycotoxin J. 2020, 13, 213–224. [Google Scholar] [CrossRef]
  14. Pitt, J.I.; Hocking, A.D. Fungi and Food Spoilage; Springer: New York, NY, USA, 2009; Volume 519, p. 388. [Google Scholar]
  15. Samson, R.A.; Houbraken, J.; Thrane, U.; Frisvad, J.C.; Andersen, B. Food and Indoor Fungi; CBS-KNAW Fungal Biodiversity Centre: Utrecht, The Netherlands, 2010. [Google Scholar]
  16. Zhou, J.; Bruns, M.A.; Tiedje, J.M. DNA recovery from soils of diverse composition. Appl. Environ. Microbiol. 1996, 62, 316–322. [Google Scholar] [CrossRef] [PubMed] [Green Version]
  17. White, T.J.; Bruns, T.; Lee, S.; Taylor, J.W. Amplification and direct sequencing of fungal ribosomal RNA genes for phylogenetics. PCR Protoc. A Guide Methods Appl. 1990, 18, 315–322. [Google Scholar]
  18. Samson, R.A.; Hoekstra, E.S.; Frisvad, J.C.; Filtenborg, O. Introduction to Food and Air Borne Fungi, 7th ed.; Fungal Biodiversity Centre CBS: Utrecht, The Netherlands, 2000; p. 389. [Google Scholar]
  19. Wee, J.; Day, D.M.; Linz, J.E. Effects of zinc chelators on aflatoxin production in Aspergillus parasiticus. Toxins 2016, 8, 171. [Google Scholar] [CrossRef] [PubMed] [Green Version]
  20. Chuaysrinule, C.; Maneeboon, T.; Roopkham, C.; Mahakarnchanakul, W. Occurrence of aflatoxin-and ochratoxin A-producing Aspergillus species in Thai dried chilli. J. Agric. Food Res. 2020, 2, 100054. [Google Scholar] [CrossRef]
  21. Rauová, D. Single laboratory-validated HPLC methods for determination of ochratoxin A, fumonisin B1 and B2, zearalenone and deoxynivalenol in cereals and cereal-based foods. J. Food. Nutr. Res. 2010, 49, 57–68. [Google Scholar]
  22. Etcheverry, M.; Torres, A.; Ramirez, M.L.; Chulze, S.; Magan, N. In vitro control of growth and fumonisin production by Fusarium verticillioides and F. proliferatum using antioxidants under different water availability and temperature regimes. J. Appl. Microbiol. 2002, 92, 624–632. [Google Scholar] [CrossRef] [Green Version]
  23. European Food Safety Authority; Food and Agriculture Organization; World Health Organization. Towards a harmonised Total Diet Study approach: A guidance document. EFSA J. 2011, 9, 2450. [Google Scholar]
  24. NHRC, Government of Nepal. Research Report on NCD Risk Factors Surveillance in Nepal; Research report; Nepal Health Research Council: Kathmandu, Nepal, 2003; pp. 1–50.
  25. Schrenk, D.; Bignami, M.; Bodin, L.; Chipman, J.K.; del Mazo, J.; Grasl-Kraupp, B.; Hogstrand, C.; Hoogenboom, L.; Leblanc, J.C.; Nebbia, C.S. Risk assessment of aflatoxins in food. EFSA J. 2020, 18, 6040. [Google Scholar]
  26. EFSA Scientific Committee. Statement on the applicability of the Margin of Exposure approach for the safety assessment of impurities which are both genotoxic and carcinogenic in substances added to food/feed. EFSA J. 2012, 10, 2578. [Google Scholar]
  27. Shrestha, S.M.; Shrestha, S. Chronic hepatitis B in Nepal: An Asian country with low prevalence of HBV infection. Trop. Gastroenterol. 2012, 33, 95–101. [Google Scholar] [CrossRef] [Green Version]
  28. Sobrova, P.; Adam, V.; Vasatkova, A.; Beklova, M.; Zeman, L.; Kizek, R. Deoxynivalenol and its toxicity. Interdiscip. Toxicol. 2010, 3, 94–99. [Google Scholar] [CrossRef] [PubMed]
  29. Desjardins, A.E.; Manandhar, G.; Plattner, R.D.; Maragos, C.M.; Shrestha, K.; McCormick, S.P. Occurrence of Fusarium species and mycotoxins in Nepalese maize and wheat and the effect of traditional processing methods on mycotoxin levels. J. Agric. Food Chem. 2000, 48, 1377–1383. [Google Scholar] [CrossRef] [PubMed]
  30. Yan, P.; Liu, Z.; Liu, S.; Yao, L.; Liu, Y.; Wu, Y.; Gong, Z. Natural occurrence of deoxynivalenol and its acetylated derivatives in Chinese maize and wheat collected in 2017. Toxins 2020, 12, 200. [Google Scholar] [CrossRef] [PubMed] [Green Version]
  31. Sun, X.D.; Su, P.; Shan, H. Mycotoxin contamination of maize in China. Comp. Rev. Food Sci. Food Saf. 2017, 16, 835–849. [Google Scholar] [CrossRef] [Green Version]
  32. Mishra, S.; Ansari, K.M.; Dwivedi, P.D.; Pandey, H.P.; Das, M. Occurrence of deoxynivalenol in cereals and exposure risk assessment in Indian population. Food Control 2013, 30, 549–555. [Google Scholar] [CrossRef]
  33. Zinedine, A.; Soriano, J.M.; Molto, J.C.; Manes, J. Review on the toxicity, occurrence, metabolism, detoxification, regulations and intake of zearalenone: An oestrogenic mycotoxin. Food. Chem. Toxicol. 2007, 45, 1–18. [Google Scholar] [CrossRef]
  34. Milićević, D.; Jurić, V.; Stefanović, S.; Baltić, T.; Janković, S. Evaluation and validation of two chromatographic methods (HPLC-Fluorescence and LC–MS/MS) for the Determination and confirmation of ochratoxin A in pig tissues. Arch. Environ. Contam. Toxicol. 2010, 58, 1074–1081. [Google Scholar] [CrossRef]
  35. Jayarajavarma, B.; Kamalakannan, A.; Paranidharan, V. Occurrence of fumonisin B1 in maize kernels, poultry and livestock feeds in Tamil Nadu, India. Int. J. Curr. Microbiol. Appl. Sci. 2019, 8, 1792–1797. [Google Scholar] [CrossRef]
  36. Mudili, V.; Siddaih, C.N.; Nagesh, M.; Garapati, P.; Naveen Kumar, K.; Murali, H.S.; Yli Mattila, T.; Batra, H.V. Mould incidence and mycotoxin contamination in freshly harvested maize kernels originated from India. J. Sci. Food. Agric. 2014, 94, 2674–2683. [Google Scholar] [CrossRef]
  37. Gautam, D.N.; Bhatta, R.; Bhandary, M.R. Assessment of aflatoxin B1 level in chilli, maize and groundnut samples from Kathmandu Valley. J. Food Sci. Technol. Nep. 2008, 4, 57–60. [Google Scholar]
  38. Koirala, P.; Kumar, S.; Yadav, B.K.; Premarajan, K.C. Occurrence of aflatoxin in some of the food and feed in Nepal. Indian J. Med. Sci. 2005, 59, 331–336. [Google Scholar] [CrossRef] [PubMed] [Green Version]
  39. Gruber-Dorninger, C.; Jenkins, T.; Schatzmayr, G. Global mycotoxin occurrence in feed: A ten-year survey. Toxins 2019, 11, 375. [Google Scholar] [CrossRef] [PubMed] [Green Version]
  40. Robens, J.F.; Richard, J.L. Aflatoxins in animal and human health. Rev. Environ. Contam. Toxicol. 1992, 9, 69–94. [Google Scholar]
  41. Franco, L.T.; Petta, T.; Rottinghaus, G.E.; Bordin, K.; Gomes, G.A.; Oliveira, C.A. Co-occurrence of mycotoxins in maize food and maize-based feed from small-scale farms in Brazil: A pilot study. Mycotoxin Res. 2019, 35, 65–73. [Google Scholar] [CrossRef]
  42. Kos, J.; Hajnal, E.J.; Malachová, A.; Steiner, D.; Stranska, M.; Krska, R.; Poschmaier, B.; Sulyok, M. Mycotoxins in maize harvested in Republic of Serbia in the period 2012–2015. Part 1: Regulated mycotoxins and its derivatives. Food Chem. 2020, 312, 126034. [Google Scholar] [CrossRef]
  43. Janardhana, G.R.; Raveesha, K.A.; Shetty, H.S. Mycotoxin contamination of maize grains grown in Karnataka (India). Food Chem. Toxicol. 1999, 37, 863–868. [Google Scholar] [CrossRef]
  44. Saleemi, M.K.; Khan, M.Z.; Khan, A.; Javed, I.; Ul Hasan, Z.; Hameed, M.R.; Hameed, S.; Mehmood, M.A. Occurrence of toxigenic fungi in maize and maize-gluten meal from Pakistan. Phytopathol. Mediterr. 2012, 219–224. [Google Scholar]
  45. Giorni, P.; Magan, N.; Pietri, A.; Bertuzzi, T.; Battilani, P. Studies on Aspergillus section Flavi isolated from maize in northern Italy. Int. J. Food Microbiol. 2007, 113, 330–338. [Google Scholar] [CrossRef]
  46. Wicklow, N.D.; McAlpin, C.E.; Platis, C.E. Characterization of the Aspergillus flavus population within an Illinois maize field. Mycol. Res. 1998, 102, 263–268. [Google Scholar] [CrossRef]
  47. Nelson, P.E.; Plattner, R.D.; Shackelford, D.D.; Desjardins, A. Production of fumonisins by Fusarium moniliforme strains from various substrates and geographic areas. Appl. Environ. Microbiol. 1991, 57, 2410–2412. [Google Scholar] [CrossRef] [Green Version]
  48. Susca, A.; Moretti, A.; Stea, G.; Villani, A.; Haidukowski, M.; Logrieco, A.; Munkvold, G. Comparison of species composition and fumonisin production in Aspergillus section Nigri populations in maize kernels from USA and Italy. Int. J. Food Microbiol. 2014, 188, 75–82. [Google Scholar] [CrossRef] [PubMed]
  49. Kankolongo, M.A.; Hell, K.; Nawa, I.N. Assessment for fungal, mycotoxin and insect spoilage in maize stored for human consumption in Zambia. J. Sci. Food. Agric. 2009, 89, 1366–1375. [Google Scholar] [CrossRef]
  50. Zulkifli, N.A.; Zakaria, L. Morphological and molecular diversity of Aspergillus from corn grain used as livestock feed. Hayati. J. Biosci. 2017, 24, 26–34. [Google Scholar] [CrossRef]
  51. Dobolyi, C.S.; Sebők, F.; Varga, J.; Kocsubé, S.; Szigeti, G.; Baranyi, N.; Szécsi, Á.; Tóth, B.; Varga, M.; Kriszt, B.; et al. Occurrence of aflatoxin producing Aspergillus flavus isolates in maize kernel in Hungary. Acta Aliment. 2013, 42, 451–459. [Google Scholar] [CrossRef]
  52. Thathana, M.G.; Murage, H.; Abia, A.L.K.; Pillay, M. Morphological characterization and determination of aflatoxin-production potentials of Aspergillus flavus isolated from maize and soil in Kenya. Agriculture 2017, 7, 80. [Google Scholar] [CrossRef] [Green Version]
  53. Frisvad, J.C.; Larsen, T.O.; Thrane, U.; Meijer, M.; Varga, J.; Samson, R.A.; Nielsen, K.F. Fumonisin and ochratoxin production in industrial Aspergillus niger strains. PLoS ONE 2011, 6, 23496. [Google Scholar] [CrossRef] [Green Version]
  54. Storari, M.; Bigler, L.; Gessler, C.; Broggini, G.A. Assessment of the ochratoxin A production ability of Aspergillus tubingensis. Food Addit. Contam. Part A 2012, 29, 1450–1454. [Google Scholar] [CrossRef]
  55. Medina, A.; Mateo, R.; López-Ocana, L.; Valle-Algarra, F.M.; Jiménez, M. Study of Spanish grape mycobiota and ochratoxin A production by isolates of Aspergillus tubingensis and other members of Aspergillus section Nigri. Appl. Environ. Microbiol. 2005, 71, 4696–4702. [Google Scholar] [CrossRef] [Green Version]
  56. Fotso, J.; Leslie, J.F.; Smith, J.S. Production of beauvericin, moniliformin, fusaproliferin, and fumonisins B1, B2, and B3 by fifteen ex-type strains of Fusarium species. Appl. Environ. Microbiol. 2002, 68, 5195–5197. [Google Scholar] [CrossRef] [Green Version]
  57. Desjardins, A.E. Fusarium Mycotoxins: Chemistry, Genetics, and Biology; APS Press: St. Paul, MN, USA, 2006; Volume 531. [Google Scholar]
  58. Udovicki, B.; Djekic, I.; Gajdos Kljusuric, J.; Papageorgiou, M.; Skendi, A.; Djugum, J.; Rajkovic, A. Exposure assessment and risk characterization of aflatoxins intake through consumption of maize products in the adult populations of Serbia, Croatia and Greece. Food Addit. Contam. 2019, 36, 940–951. [Google Scholar] [CrossRef]
  59. Nugraha, A.; Khotimah, K.; Rietjens, I.M. Risk assessment of aflatoxin B1 exposure from maize and peanut consumption in Indonesia using the margin of exposure and liver cancer risk estimation approaches. Food. Chem. Toxicol. 2018, 113, 134–144. [Google Scholar] [CrossRef] [PubMed]
  60. Zhang, W.; Liu, Y.; Liang, B.; Zhang, Y.; Zhong, X.; Luo, X.; Huang, J.; Wang, Y.; Cheng, W.; Chen, K. Probabilistic risk assessment of dietary exposure to aflatoxin B1 in Guangzhou, China. Sci. Rep. 2020, 10, 7973. [Google Scholar] [CrossRef] [PubMed]
  61. Kilonzo, R.M.; Imungi, J.K.; Muiru, W.M.; Lamuka, P.O.; Njage, P.M.K. Household dietary exposure to aflatoxins from maize and maize products in Kenya. Food Addit. Contam Part A 2014, 31, 2055–2062. [Google Scholar] [CrossRef] [PubMed] [Green Version]
  62. Cartus, A.; Schrenk, D. Current methods in risk assessment of genotoxic chemicals. Food. Chem. Toxicol. 2017, 106, 574–582. [Google Scholar] [CrossRef] [PubMed]
Figure 1. Frequency of maize samples containing two, three, four or five mycotoxins (n = 45).
Microbiolres 13 00021 g001
Figure 2. Types of co-occurrences of mycotoxins in positive samples of maize (n = 45) collected from various provinces of Nepal. AF, aflatoxin. DON, deoxynivalenol. ZEA, zearalenone. OT, ochratoxin. FUM, fumonisin.
Microbiolres 13 00021 g002
Table 1. Overall incidence and average contamination levels of mycotoxins in maize samples (n = 45).
MycotoxinNumber of
Positive Samples
%Concentration
(µg/kg) in
Positive Samples (Mean ± SD)
RangeMedianMPL
(µg/kg)
(GoN/EU)
Aflatoxin357823.04 ± 27.581.52–91.245.9120/4
Ochratoxin28621.5125 ± 0.491–3.221.06NE/5
Zearalenone347621.72 ± 13.4711.12–69.5215.5NE/200
Fumonisin3476816.76 ± 886.66200–4180310NE/2000
Deoxynivalenol45100222.44 ± 104.8110–520190NE/1750
MPL, maximum permitted levels adopted. GoN, Government of Nepal. EU, European Union. NE, Not established.
Table 2. Maize kernel mold infection across five different provinces of Nepal.
LocationNumber of Infected Kernels/Total Number of Investigated Kernels% Infected Kernels ± SD
Province-174/18041.11 ± 13.87
Bagmati51/18028.33 ± 16.01
Gandaki108/18060 ± 21.51
Lumbini38/18021.11 ± 17.28
Karnali47/18026.11 ± 14.09
Table 3. Fungal species identification summary and their mycotoxin-producing ability.
Isolate CodeOrigin Species Identified Using DNA SequencingToxin Production/QuantityNCBI Access Number
PJ 60GandakiAspergillus flavusAFB1/356.59 ng/g MH864264
PJ 84GandakiAspergillus flavusAFB1/3653.49 ng/g MH864264
PJ 58GandakiAspergillus oryzaeNDKJ175431
PJ 76Province-1Aspergillus oryzaeNDKJ175431
PJ 119BagmatiAspergillus filiferNDNR137499
PJ 66Province-1Aspergillus fumigatusNDMH865796
PJ 04LumbiniAspergillus nigerOTA/631.17 ng/g MH856565
PJ 05LumbiniAspergillus nigerOTA/1402.12 ng/g MH856565
PJ 31GandakiAspergillus tubingensisOTA/871.38 ng/g MH858714
PJ 81Province-1Aspergillus nigerFB1/20,199 µg/kgMH856565
PJ 82Province-1Aspergillus nigerFB1/16,928 µg/kgMH856565
PJ 122KarnaliAspergillus nigerFB1/5604 µg/kgMH856565
PJ 67Province-1Aspergillus nigerNDMH856565
PJ 77Province-1Aspergillus nigerNDMH856565
PJ 74Province-1Aspergillus nigerNDMH856565
PJ 39Province-1Fusarium pseudocircinatumFUM/10,180 µg/kgNR163683
PJ 42LumbiniFusarium pseudocircinatumFUM/10,270 µg/kgNR163683
PJ 41Province-1Fusarium pseudocircinatumFUM/11,300 µg/kgNR163683
PJ 111LumbiniFusarium pseudocircinatumFUM/11,120 µg/kgNR163683
PJ 52GandakiFusarium pseudocircinatumFUM/10,360 µg/kgNR163683
PJ 129KarnaliFusarium pseudocircinatumFUM/10,310 µg/kgNR163683
PJ 10BagmatiFusarium pseudocircinatumFUM/5750 µg/kgNR163683
PJ 07LumbiniFusarium pseudocircinatumFUM/15,670 µg/kgNR163683
PJ 19LumbiniFusarium pseudocircinatumFUM/10,300 µg/kgNR163683
ND, Not detected.
Table 4. Dietary exposure of aflatoxin and assessment of risk due to consumption of maize in Nepal.
ParameterUnitMean97.5th Percentile
AF concentrationµg/kg18.0786.78
EDI ng/kg bw/day30.46146.30
MOE -5.581.16
Average potency Cancer cases/year/100,000 population0.381.84
EDI, Estimated Daily Intake. MOE, Margin of Exposure.
Publisher’s Note: MDPI stays neutral with regard to jurisdictional claims in published maps and institutional affiliations.

