Abstract
The microbial life indigenous to mineral deposits are generally regarded as extremophiles as they are tolerant to extreme conditions. The microorganisms that thrive in such environments survive by modifying their metabolic pathway or mechanisms. The microbiome associated with ore deposits remain poorly studied. The present study is the first attempt to explore the taxonomic composition of the bacterial community associated with the muscovite ore deposit from Southern India by using high throughput Illumina sequencing employing the V3 and V4 region of the16S rDNA and bioinformatics channel. A total of 20 bacterial phyla with 55 classes, 96 orders, 192 families, 382 genera and 462 species were recovered in the study. The alpha diversity index suggests that muscovite ore deposits harbored highly variable bacterial communities. Among the bacterial communities, Proteobacteria (33%), Actinobacteria (29.9%), Firmicutes (25.4%), Bacteroidetes (5.5%) and Chloroflexi (2.7%) were the dominate phyla. A total of 156 abundant species and 306 rare species were observed and is an indication of the presence of novel species. This study helps to understand the survival strategy of oligotrophs, which are an important aspect of microbial ecology.
1. Introduction
Extreme environments are described as environments where one or more physical and chemical parameters are far from the values that are considered normal for human life [1]. Five decades ago, life was thought to be a surface phenomenon and even resilient prokaryotic species could not live deeper than tens of meters below the surface [1]. In the 1990s, it became clear that microbes exist even in very subterranean surface environments [2]. Today, we know that life on the deep surface is ubiquitous and makes up the bulk of life on earth [3]. The microorganisms that thrive in the subsurface have developed a number of mechanisms to deal with extreme conditions that prevail in ore/surface environments, such as limited nutrient availability and usable energy, high temperature and pressure, extreme pH, metal toxicity and radiation [4]. Many studies revealed that microbial communities not only adapt to these extreme conditions but also adapt these environments to their lifestyle [5,6,7,8]. According to Whitman et al. (1998) [9] 75% to 94% of the earth’s prokaryotes lives in the subsurface. Ores and mineral deposits are the earth’s subsurface habitats. Ores are mineral concentrations of economic interest and have unique microbiology based on the host’s geology. Muscovite ore is the most common mineral of the phyllosilicates. The basic characteristic feature is their layered structure and their formation can be in subsurface due to diagenesis and hydrothermal alterations [10]. Muscovite is a natural K-bearing mineral that mainly consists of potassium aluminum silicates (Al2 K2O6 Si). India possesses the world’s largest deposit of muscovite and it is distributed in the state of Jharkhand and Andhrapradesh, in an area covering 4000 km2 [11]. Muscovite is one of the most important minerals used in the electricity and electronics industries due to its insulating properties, resistance to high voltage, low power loss factor and high dielectric strength. It is also heavily used in the aviation industry due to its unique properties such as transparency, flexibility and toughness. Besides this, muscovite is also used in cosmetics and toothpaste [12]. Therefore, the bulk of sheet muscovite is exported.
In India, the Nellore mica belt is the largest muscovite-producing area where muscovite is extracted by open cast and underground mining. Underground mines are developed generally up to a 100 m depth of cover [13]. Principally, prokaryotic life in these minerals experiences a range of extreme conditions, such as high temperature, high pressure, low abundance of organic material and electron acceptor or donors. These extreme conditions pose novel challenges to the microorganisms and help in shaping the metabolic potentials in relation to biogeochemical transformations. In this study, we are interested in examining the prokaryotic microbial life in muscovite ore. This investigation may shed a range of insights on the ecology and evolution of microbial life in these acute environments. This information is critical to develop further understanding of biogeochemical transformations, new geochemical processes in their extraction and to develop a new approach to surface remediation. Further, if the diversity of microorganisms that occur in these extreme environments were tapped, they will have potential use in the food and pharmaceutical industry. It is extremely difficult to plot precise representations of microbial communities, in particular ecological niches, due to their unculturable nature and wide biodiversity. “Metagenomics” is a revolutionary concept of studying microbial biodiversity, their adoption to the ecological niches and their evolution [9,14]. This methodology comfortably overcomes the bottlenecks associated with traditional culturing methods [15,16]. Moreover, this enables the clear-cut examination of deep mining deposits of the microbiome [17,18]. To our best knowledge, this study is among the first to employ high-throughput Illumina-based sequencing to characterize the taxonomic diversity of muscovite mica bacterial communities. This study was designed to target unexplored muscovite minerals to analyze in-depth microbial community composition.
2. Materials and Methods
2.1. Description of the Sampling Site
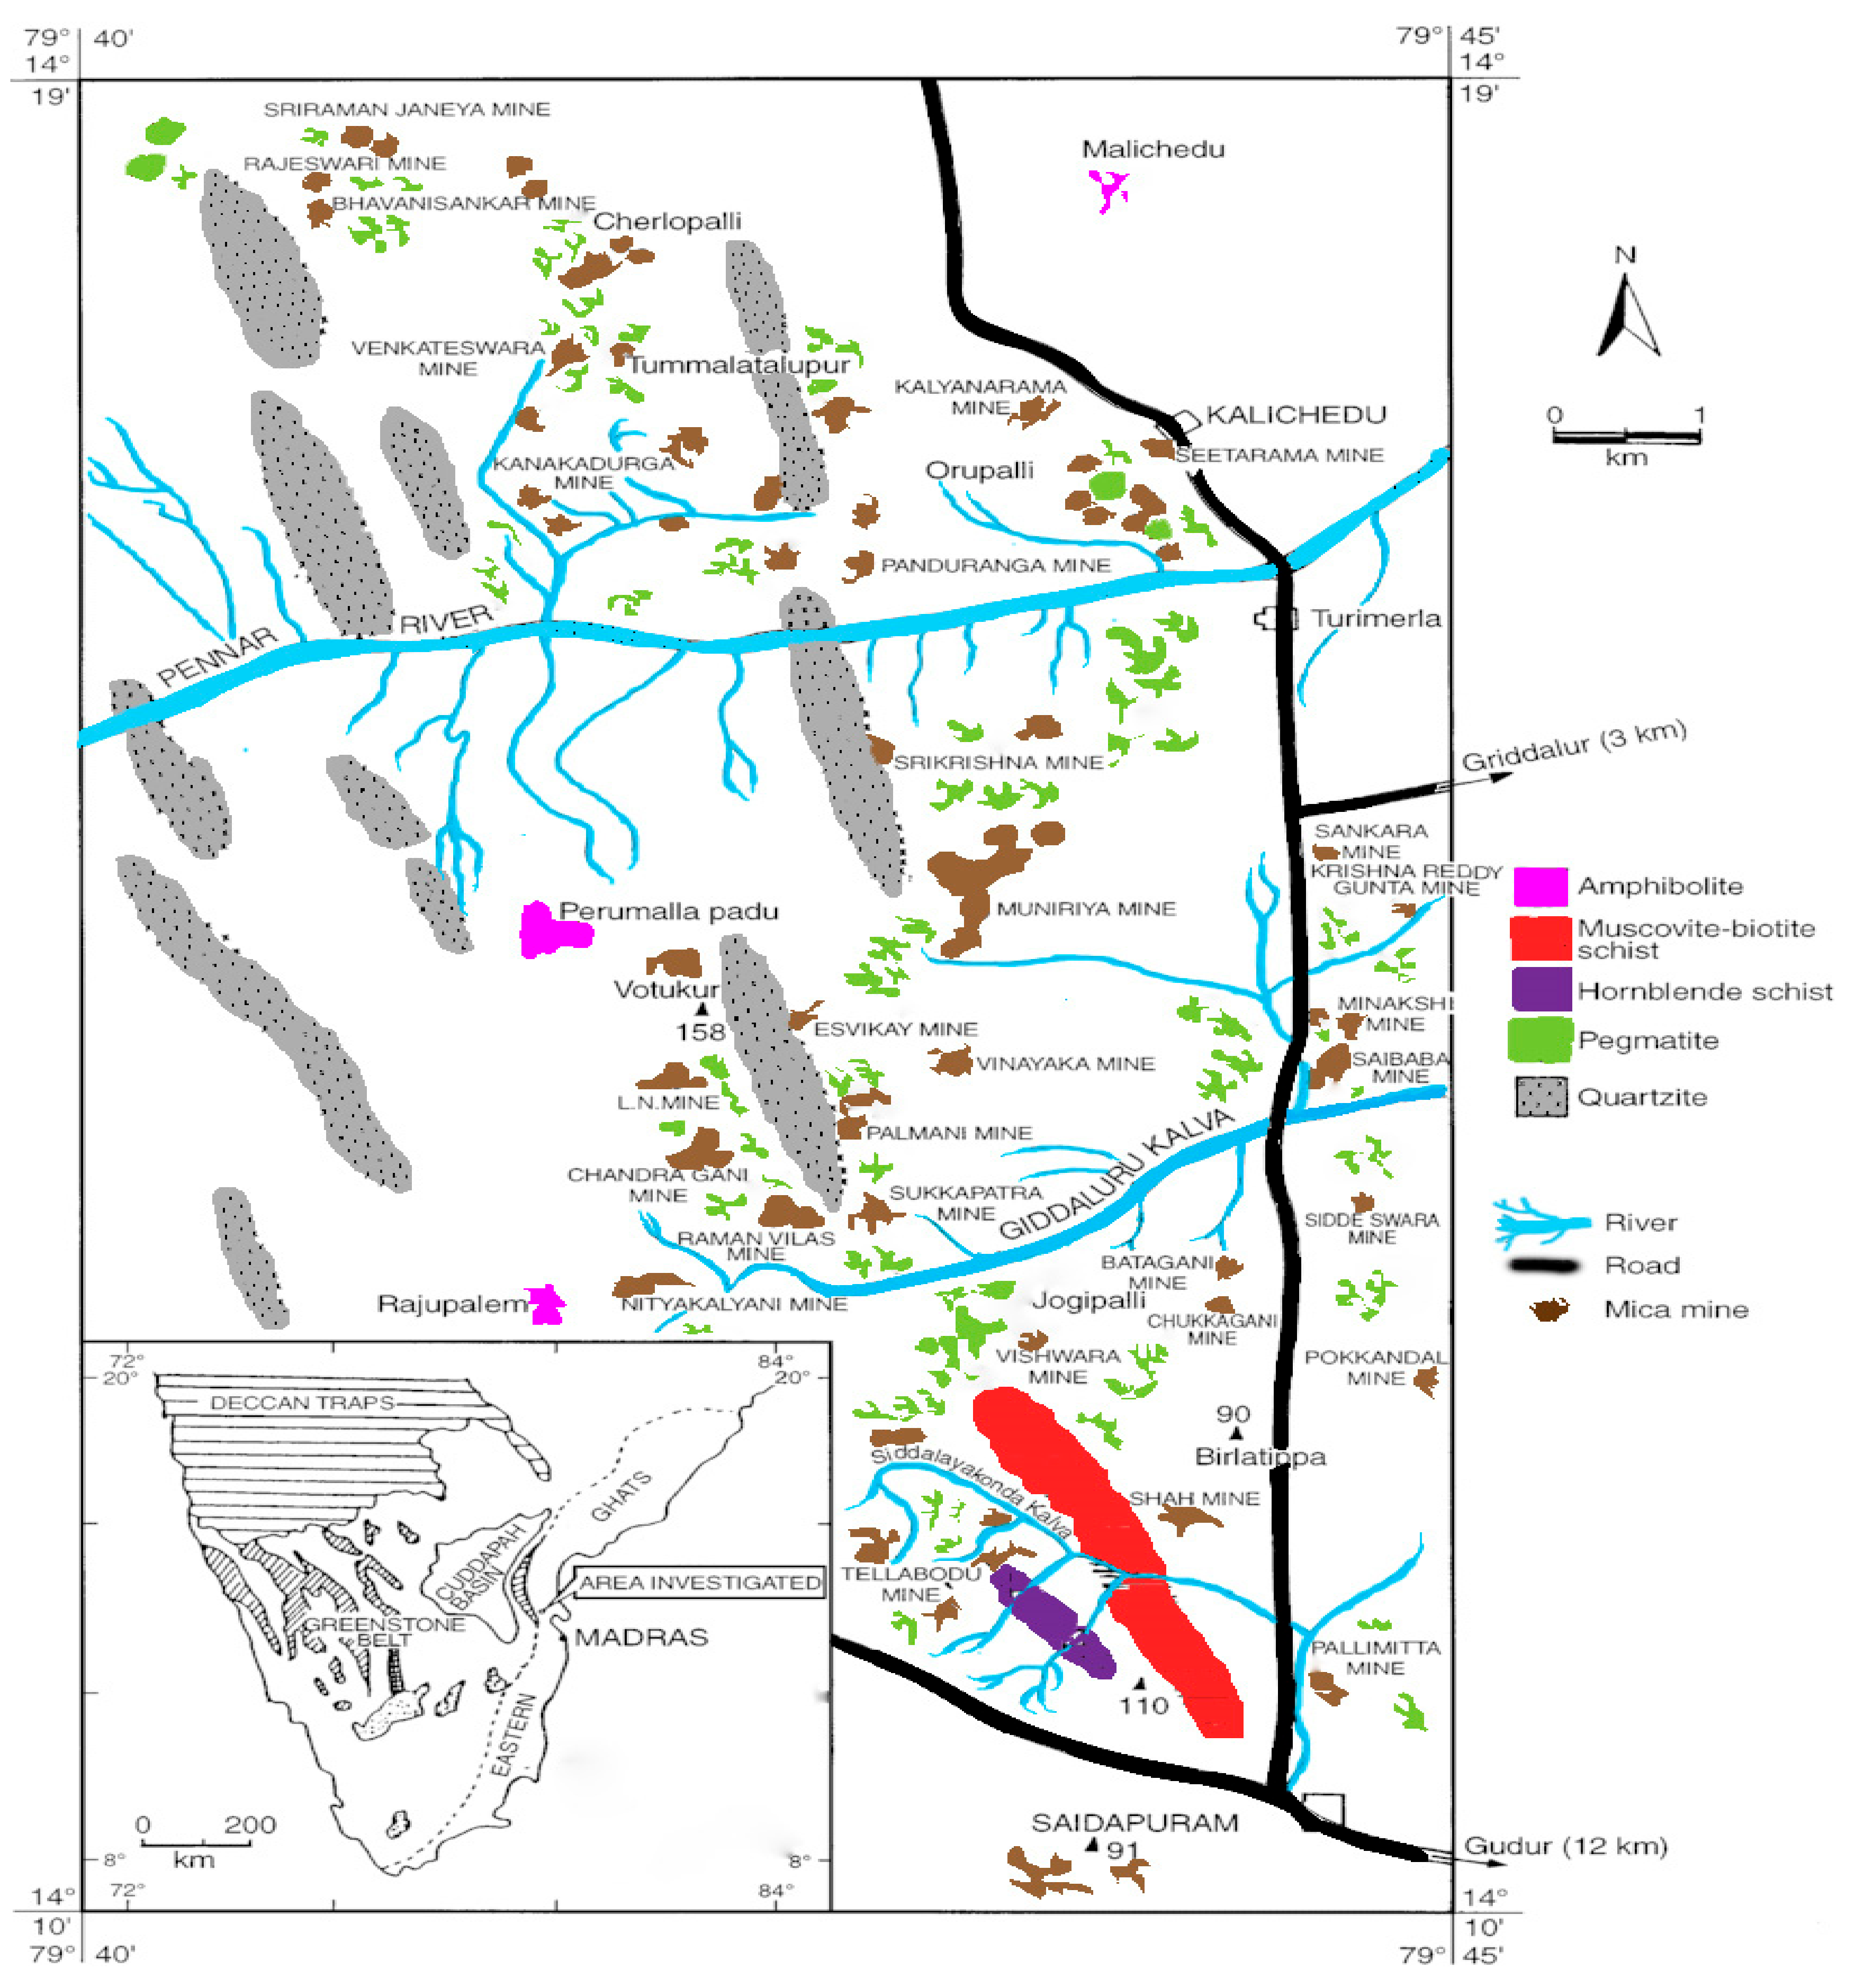
In India, the main muscovite depositsare located in the Nellore district of Andhrapradesh at a latitude of 14°10′ and 14°19′ E longitude of 79°35′ and 79°45′ W. The muscovite belt in the Nellore district extends for about 96 km from the south of Gudur to Udayagiri (Figure 1) and this is the oldest muscovite mining area where mining occurs in open cast and underground. Nearly sixty to seventy mines were operational in 1990. Now, only very few mines are operational.
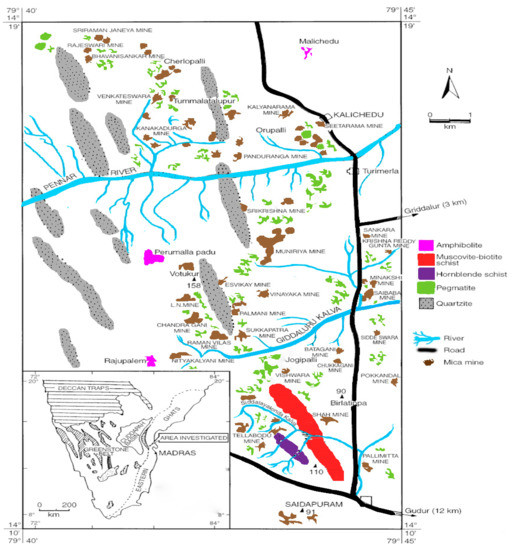
Figure 1.
Muscovite belt in Nellore district (Reprinted with permission from Indian Bureau of mines, India).
2.2. Collection and Processing of Muscovite
From different operating mines situated in Kalichedu, Gudur division, Nellore District, India, a total of 10 muscovite mineral samples were collected using randomized block design. From the out growths of underground mining roof at a depth of 350 m and at every 5.0 m horizontal interval using sterile cable tool drilling and immediately placed in freezer at drilling site. These collected muscovite samples were pooled, then milled and sieved through a mesh (1.0 mm particle size filter). This powdered material stored at 4 °C was used for microbial analysis.
2.3. Extraction of DNA from Muscovite Samples
The processed muscovite powder was used for metagenomic DNA extraction according to Pang et al. (2008) [19] with minor modifications. Ten grams of muscovite fine powder was suspended in 20 mL of extraction buffer consisting of 100 mM Tris HCl, 100 mM sodium EDTA and 1.5 M NaCl. A 1000 µL of lysozyme (10 mg/mL) was added and incubated for one hour. After 30 min of incubation 1 mL of 20%SDS and 30 µL of proteinase K (20 mg/mL) were added. The entire lysate was incubated for 2 h at 65 °C and centrifuged for 15 min at 4034× g and supernatant was collected. To the collected supernatant a half volume of 30%PEG and 1.6 M NaCl were added and incubated over night at room temperature. Then, this mixture was again centrifuged at 4034× g for 15 min and pellet was collected. Then, collected pellet was suspended in 20 mL of TE buffer and the DNA was extracted with phenol: Chloroform: Isoamyl alcohol (25:24:5) treatment. The extracted DNA was precipitated with 0.1 volume of 5 M NaCl and 2.5 mL volume of absolute ethanol. The DNA pellet was washed with 70% ethanol then vacuum dried and dissolved in 50 µL of TE buffer. The extracted DNA was checked for its yield and purity using Nano drop (Thermoscientific, Walthem, MA, USA). The extracted DNA was also visualized through agarose gel electrophoresis.
2.4. Amplification of V3–V4 Region Regions of 16S rDNA Region of Metagenome Using Polymerase Chain Reaction
The PCR reaction volume consists of 200 uM dNTPs, 5 U Taq DNA polymerase, 30 ng of template DNA and 13 uM of each index primer (Table 1). The initial denaturation was performed at 95 °C for 2 min followed by denaturation at 95 °C for 30 s, annealing temperature at 55 °C for 60 s and extension at 72 °C for 30 s for 25 cycles. The final extension step performed at 72 °C for 5 min. The PCR product was (~460 bp) extracted with Qiagen gel extraction kit (Qiagen, Hilden, Germany). The extracted amplicon product was used for metagenomic sequencing on the Illumina MI seq platform (Illumina, San Diego, CA, USA) employing NGS protocol.

Table 1.
Primers used for amplification of V3–V4 region of Libraries.
2.5. Library Preparation and Illumina MI seq Sequencing
The 16S metagenomic library was prepared using the protocol detailed by illumina library prep guide (15044B dated November 2013). Roughly, a 2 ng gel-purified amplicon was used for re-amplifying V3–V4 region of 16SrRNA region using NEXTERA XT index kit V2 (Cat# FC = 131–2002, Illumina, San Diego, CA, USA) according to manufacturer’s protocol. Before proceeding for index PCR, the amplification confirmed through 1.0% agarose gel (~530 bp amplicon). In the indexing PCR dual indexing barcodes and Illumina sequencing adapter were added to generate ~600 bp PCR product using limited cycles. High-prep PCR and Post-prep clean-up system (MagBio genomics, INC, Galithersburg, MA, USA) were used to clean library. Then a bio analyzer chip (Agilent Technologies, Santaclara, California, USA) was used to check the quality of the library. The Illumina paired-end V3–V4 reads (300 × 2) multiplex sequence was performed by using ~5ng PCR product from the prepared library using Illumina Miseq platform.
2.6. Processing and Bioinformatics Analysis of Sequence Reads
Using Fast QC, the paired-end reads were quality tested. The raw reads with the sequence of primers and high-quality bases were picked. Using Fast Q Join, reads were stitched further. For advance study, these stitched reads were taken into account using the QIIME pipeline (www.QIIME.org, accessed on 30 July 2021). To obtain representative sequences, the stretched sequences were aligned. Under the 97% identity threshold with Phred Score > 2020, the unique sequences set were classified into OTUs. The green genes database (http.greengenes.ibl.gov) was used to confirm the OUT identity. The alpha diversity was evaluated by calculating Shannon–Weiner index [20], Simpson index [21] and Chao 1 index [22]. The abundance of various taxonomy within a community was calculated on the basis of rarefaction curves. Paired-end Illumina sequence data from this study was subjected to NCBI sequence read archive (SRA under accession number SRR347895).
2.7. Statistical Analysis
The diversity matrices, such as rare faction analysis and alpha diversity index analysis were carried out. The rarefaction curves, heat maps, relative abundance were generated using QIIME [20,23,24,25,26,27].
3. Results and Discussion
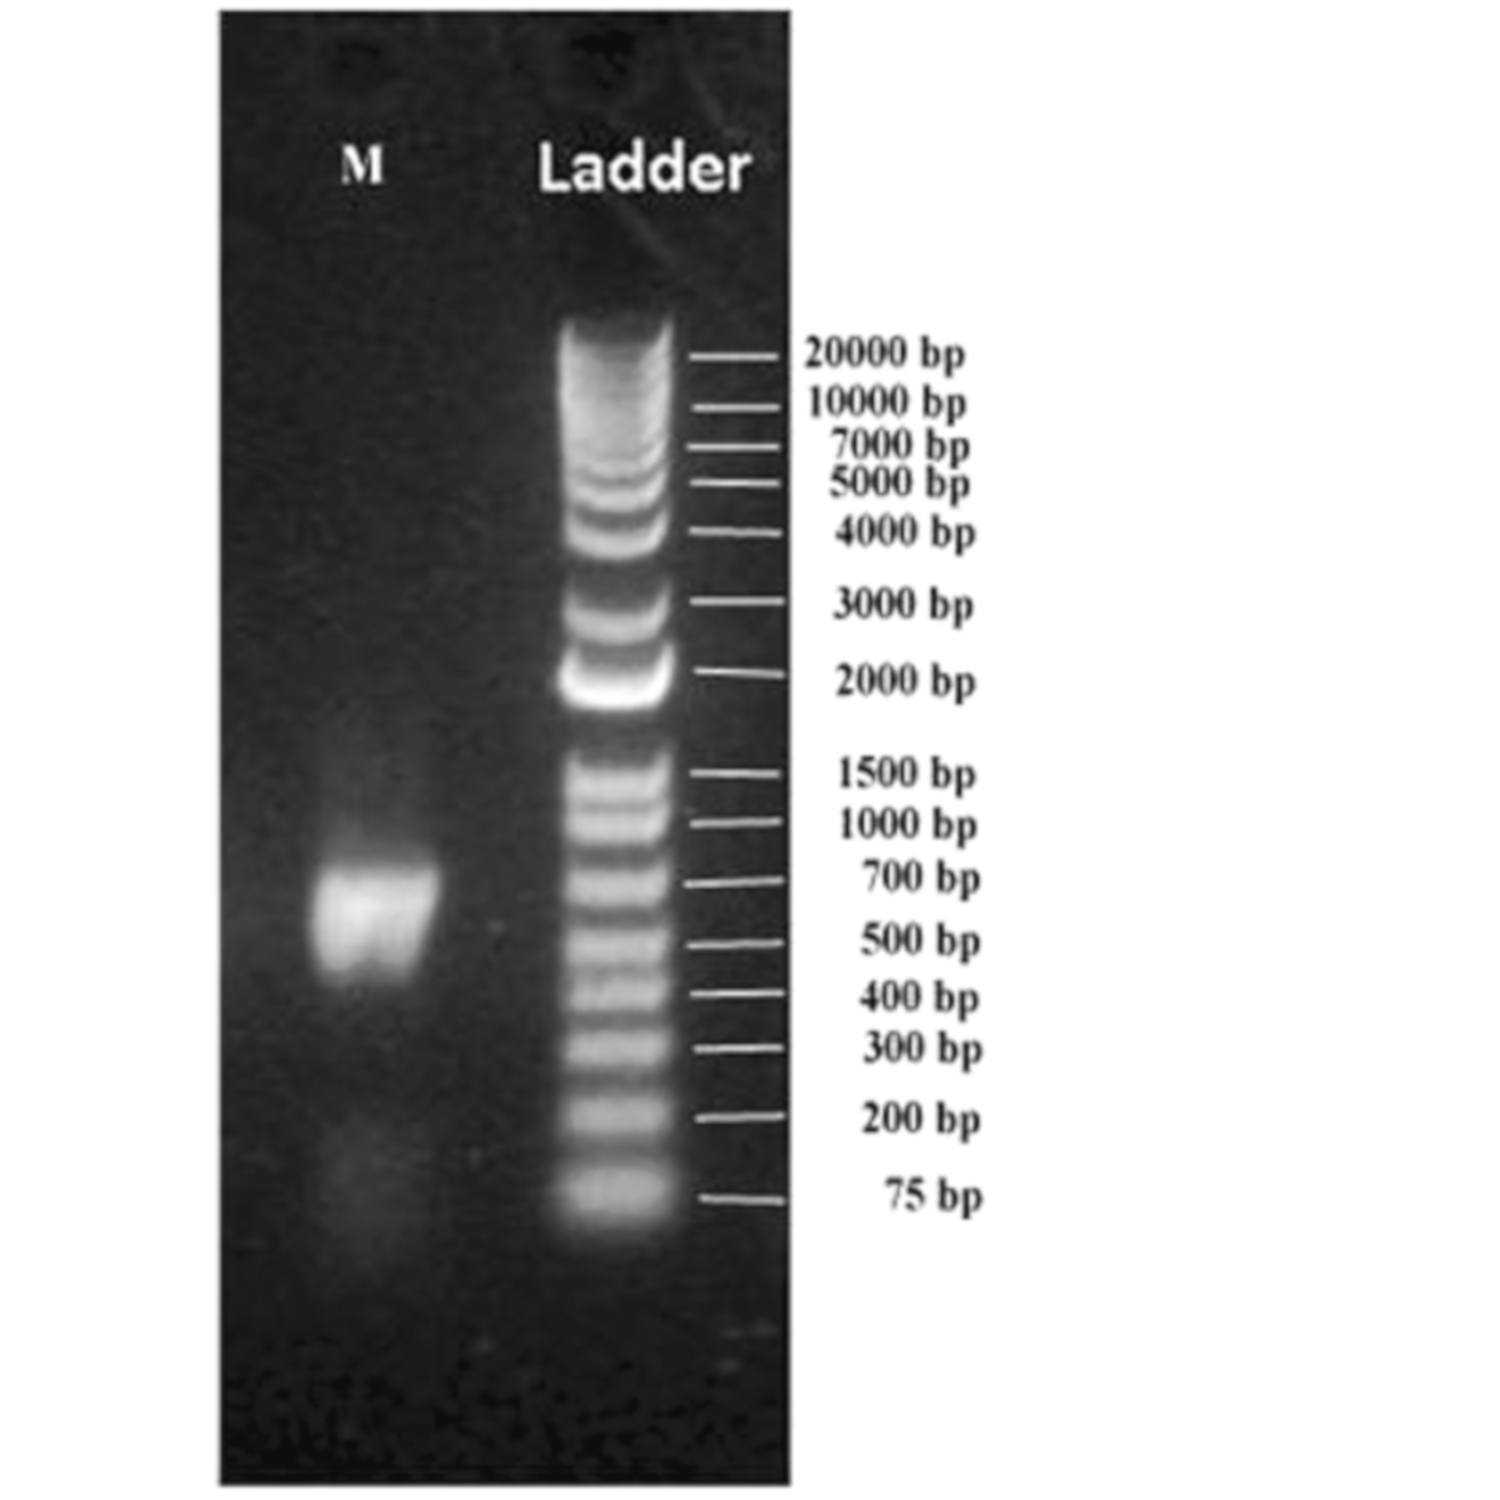
In the current investigation, the microbial diversity in muscovite deposits of Andhrapradesh in the Indian subcontinent was explored by utilizing a metagenomics barcoding approach. The processed muscovite samples were subjected to metagenome barcoding analysis using next-generation sequencing technology of amplified rDNA libraries. Approximately ~39 ng metagenomic DNA was obtained from a ten-gram sample with an A260/A240 0.6 purity ratio. The PCR-amplified metagenome yielded 460 bp fragment, which is a hyper variable V3–V4 region of the 16S rDNA. A 2 ng gel-purified amplicon was re amplified in the V3–V4 region of 16S rDNA region using NEXTERA XT index kitV2 (Illumina, San Diego, CA, USA) and yielded approximately ~530 bp amplicon (Figure 2). In the indexing PCR dual indexing barcodes and Illumina sequencing adapters were added to generate ~600 bp PCR product using limited cycles.
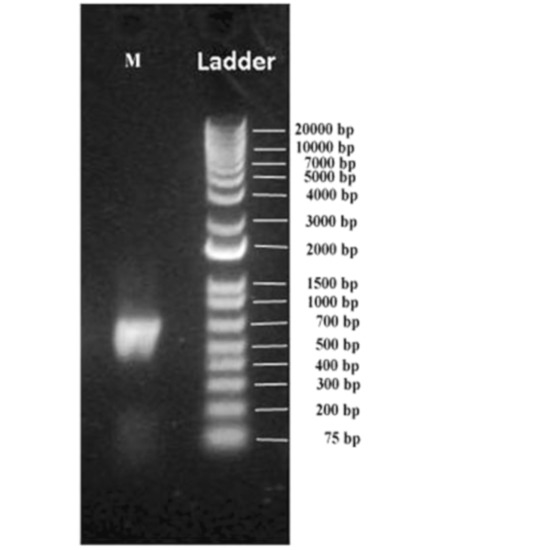
Figure 2.
Indexing PCR amplicon on the 1% agarose gel.
The Illumina Miseq sequencing of the muscovite metagenome sample generated 197,924 paired-end reads. Pre-processing of the reads for the elimination of primer-containing sequences and possible adapter sequences yielded 193,837 reads. Around 86,412 reads were utilized in the identification of the microbiome and finally, 1641 OTU were picked (Table 2).

Table 2.
Read count statistics for muscovite sample of V3–V4 region.
In recent times, NGS technology has been an important technology for analyzing the microbial diversity in various ecosystems [17]. Our current study identified several distinct OTUs based on the NGS sequencing of the V3–V4 region of the 16S rRNA gene. It was observed that the members of proteobacteria were reported as the major bacterial population in the biosphere due to their effective colonization ability [14,16]. Proteobacteria were also reported as the predominant phyla in manganese and quartz ores.
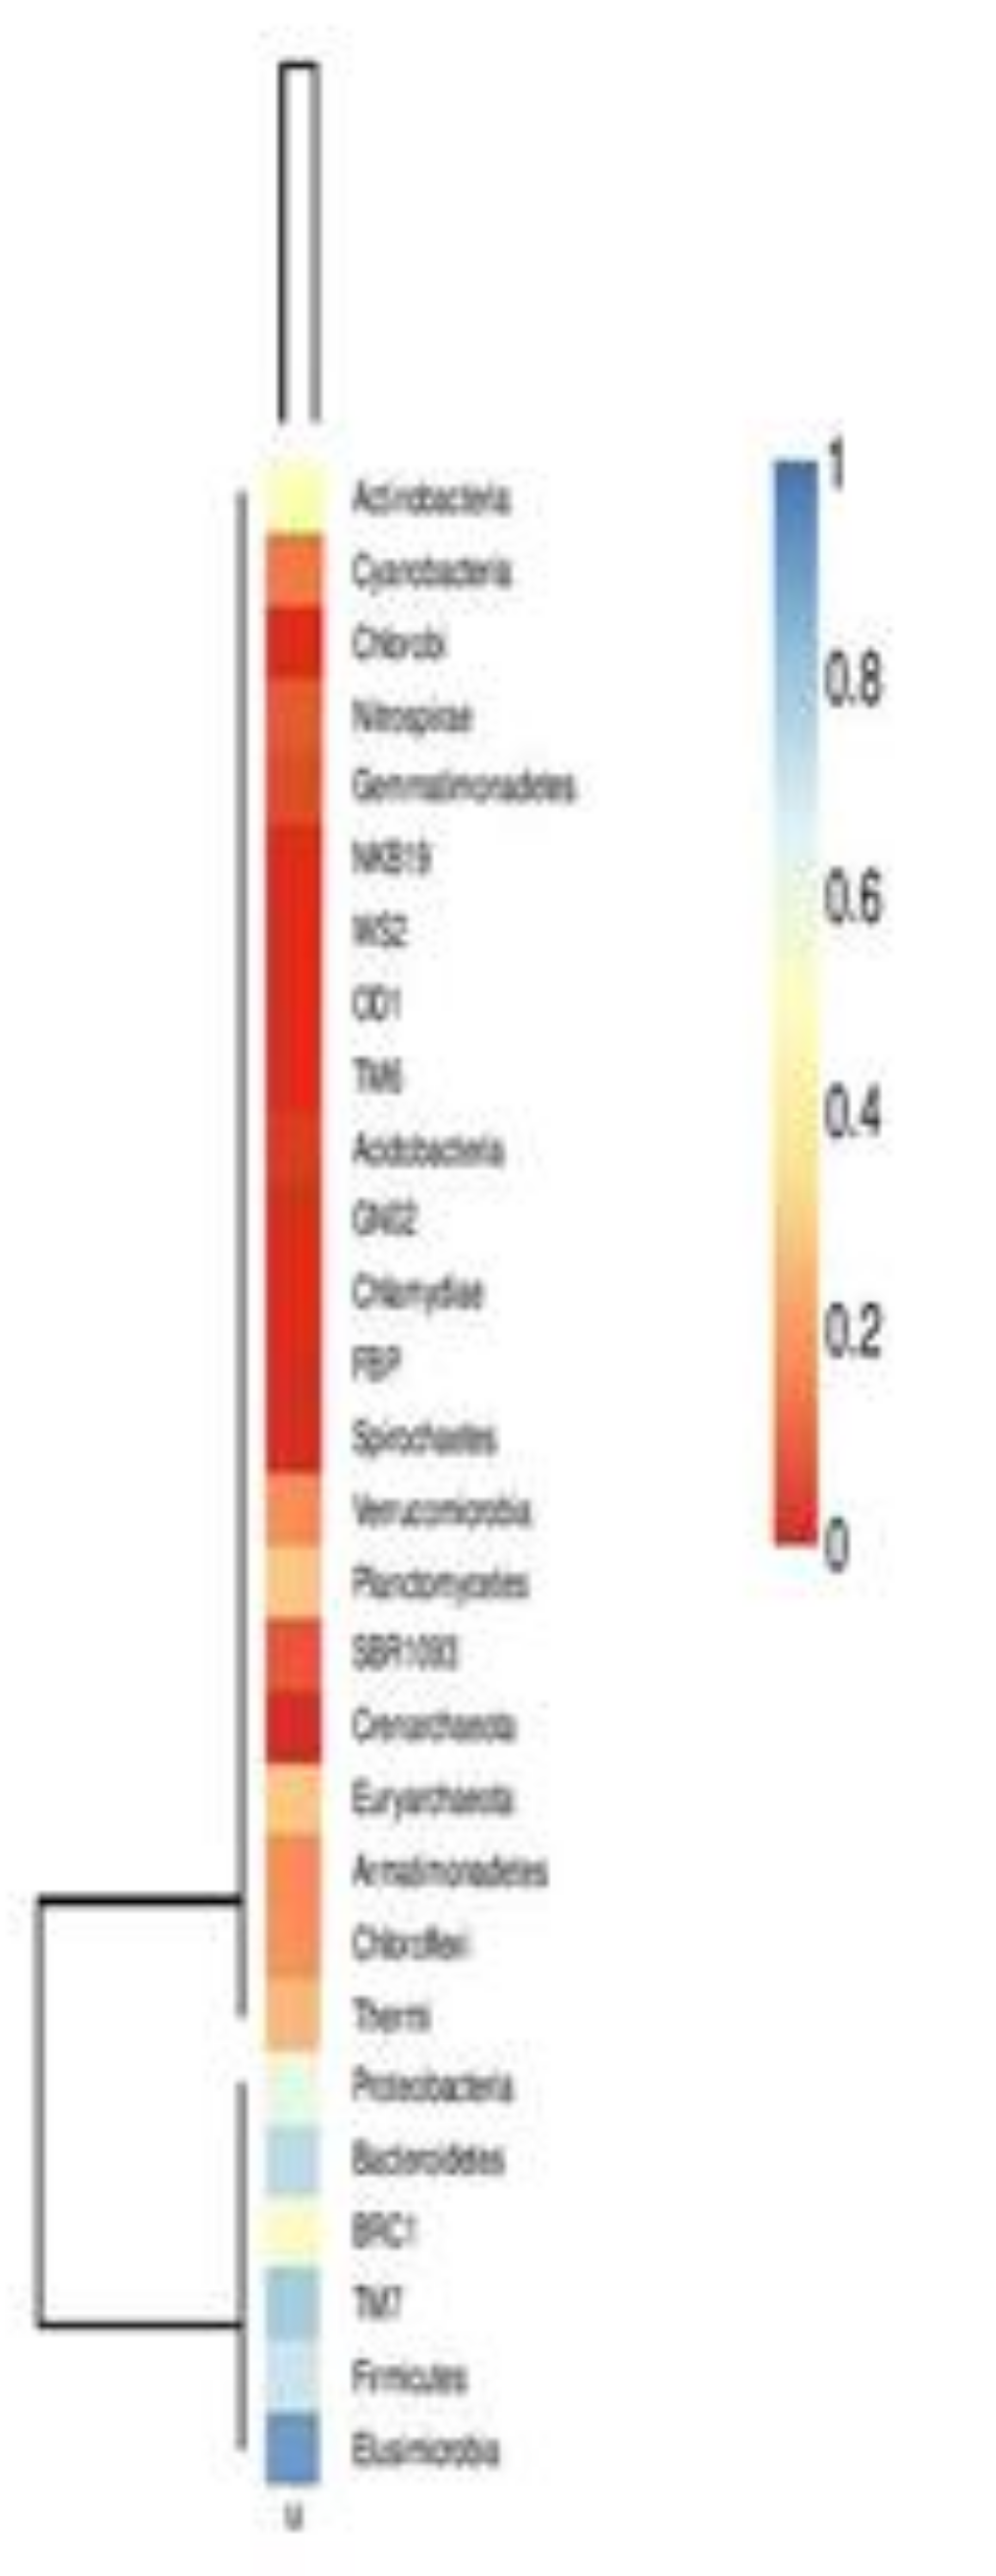
A heat map of OTUs, created utilizing the QIIME pipeline, clearly delineated the phylum level microbial abundance and differences in taxonomic composition (Figure 3)
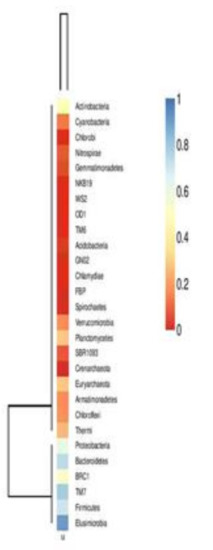
Figure 3.
Heat map showing taxonomic composition and abundant microbial phyla.
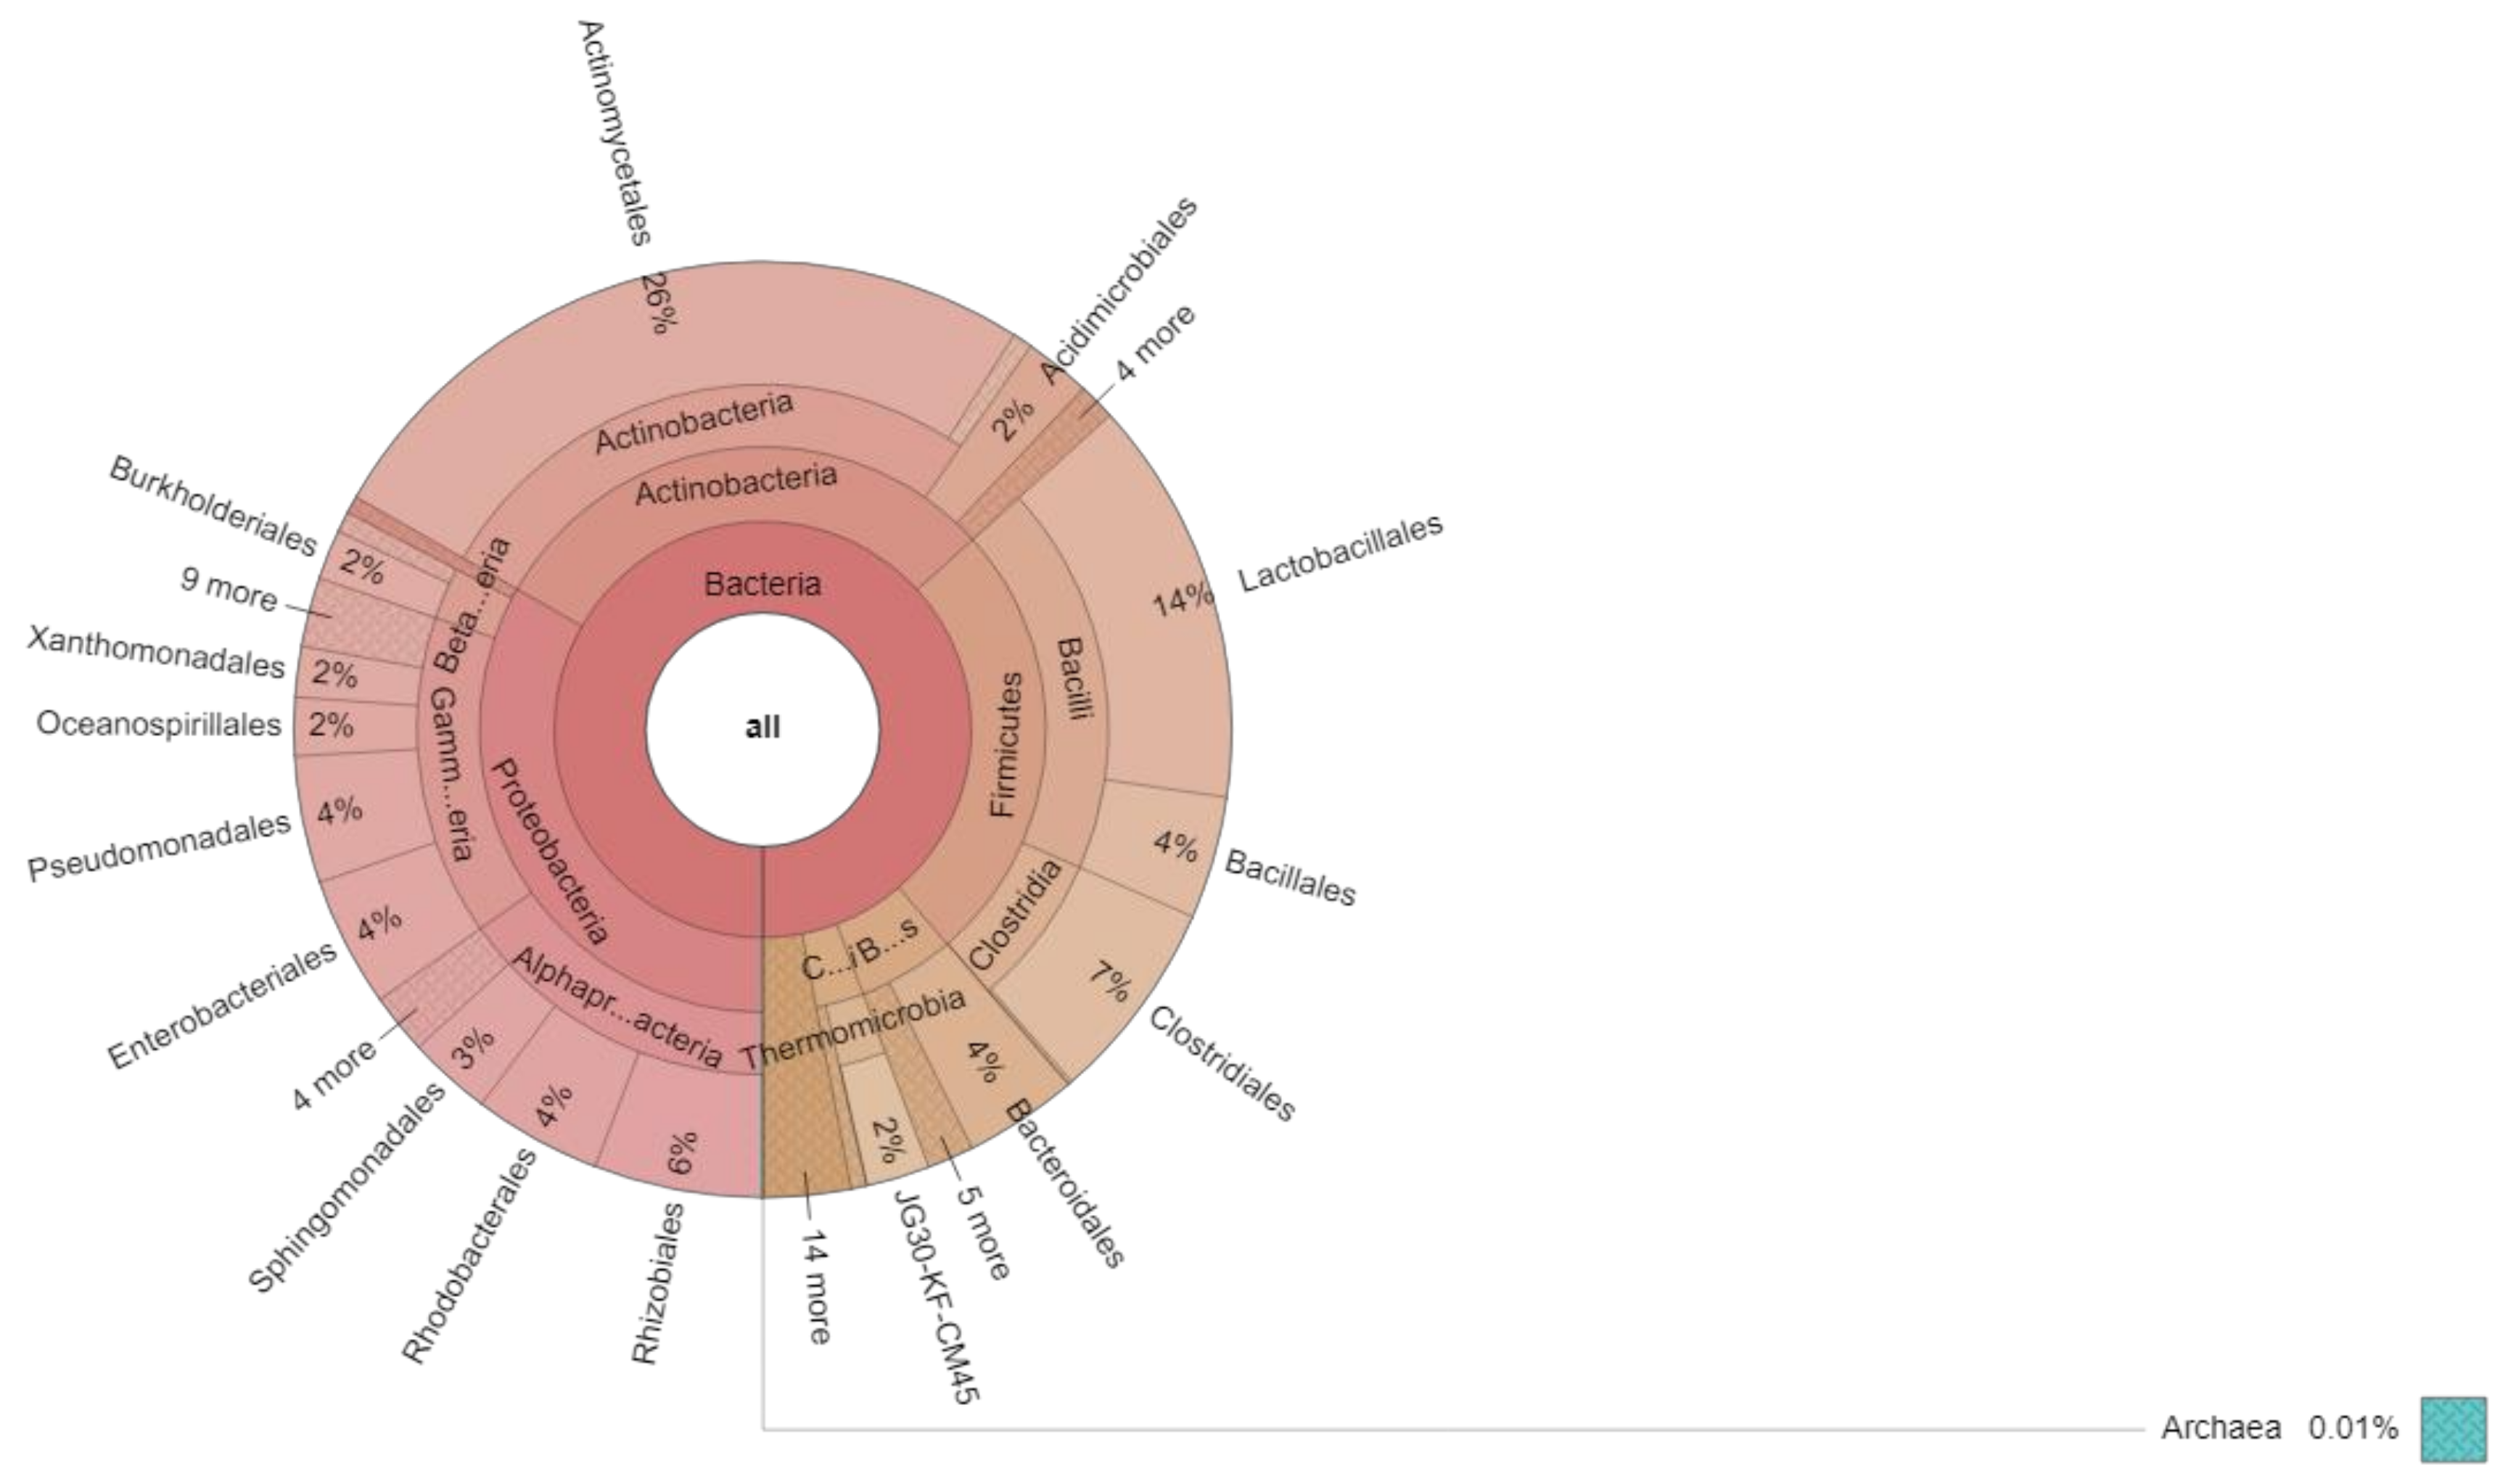
An interactive graphical overview of relative abundance of bacterial diversity and confidence limits within the complex hierarchy of OTUs classification from phylum upto order level was obtained through the Krona chart (Figure 4).
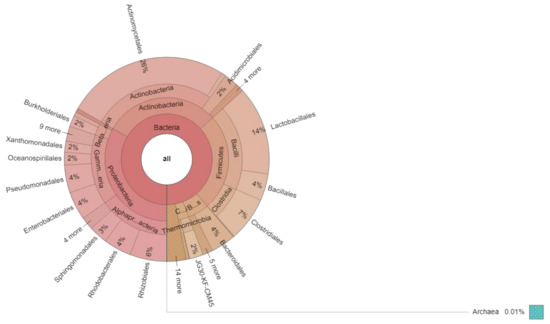
Figure 4.
Krona chart showing relative abundance of bacterial phylum up to order level.
The diversity of the microbial community structure of the muscovite sample was estimated by the alpha diversity index. In this study, we calculated the diversity index using different matrices namely the Shannon diversity index(H), Simpson (evenness index), Chao 1 and observed species (Table 3).

Table 3.
Alpha-diversity indexin muscovite sample.
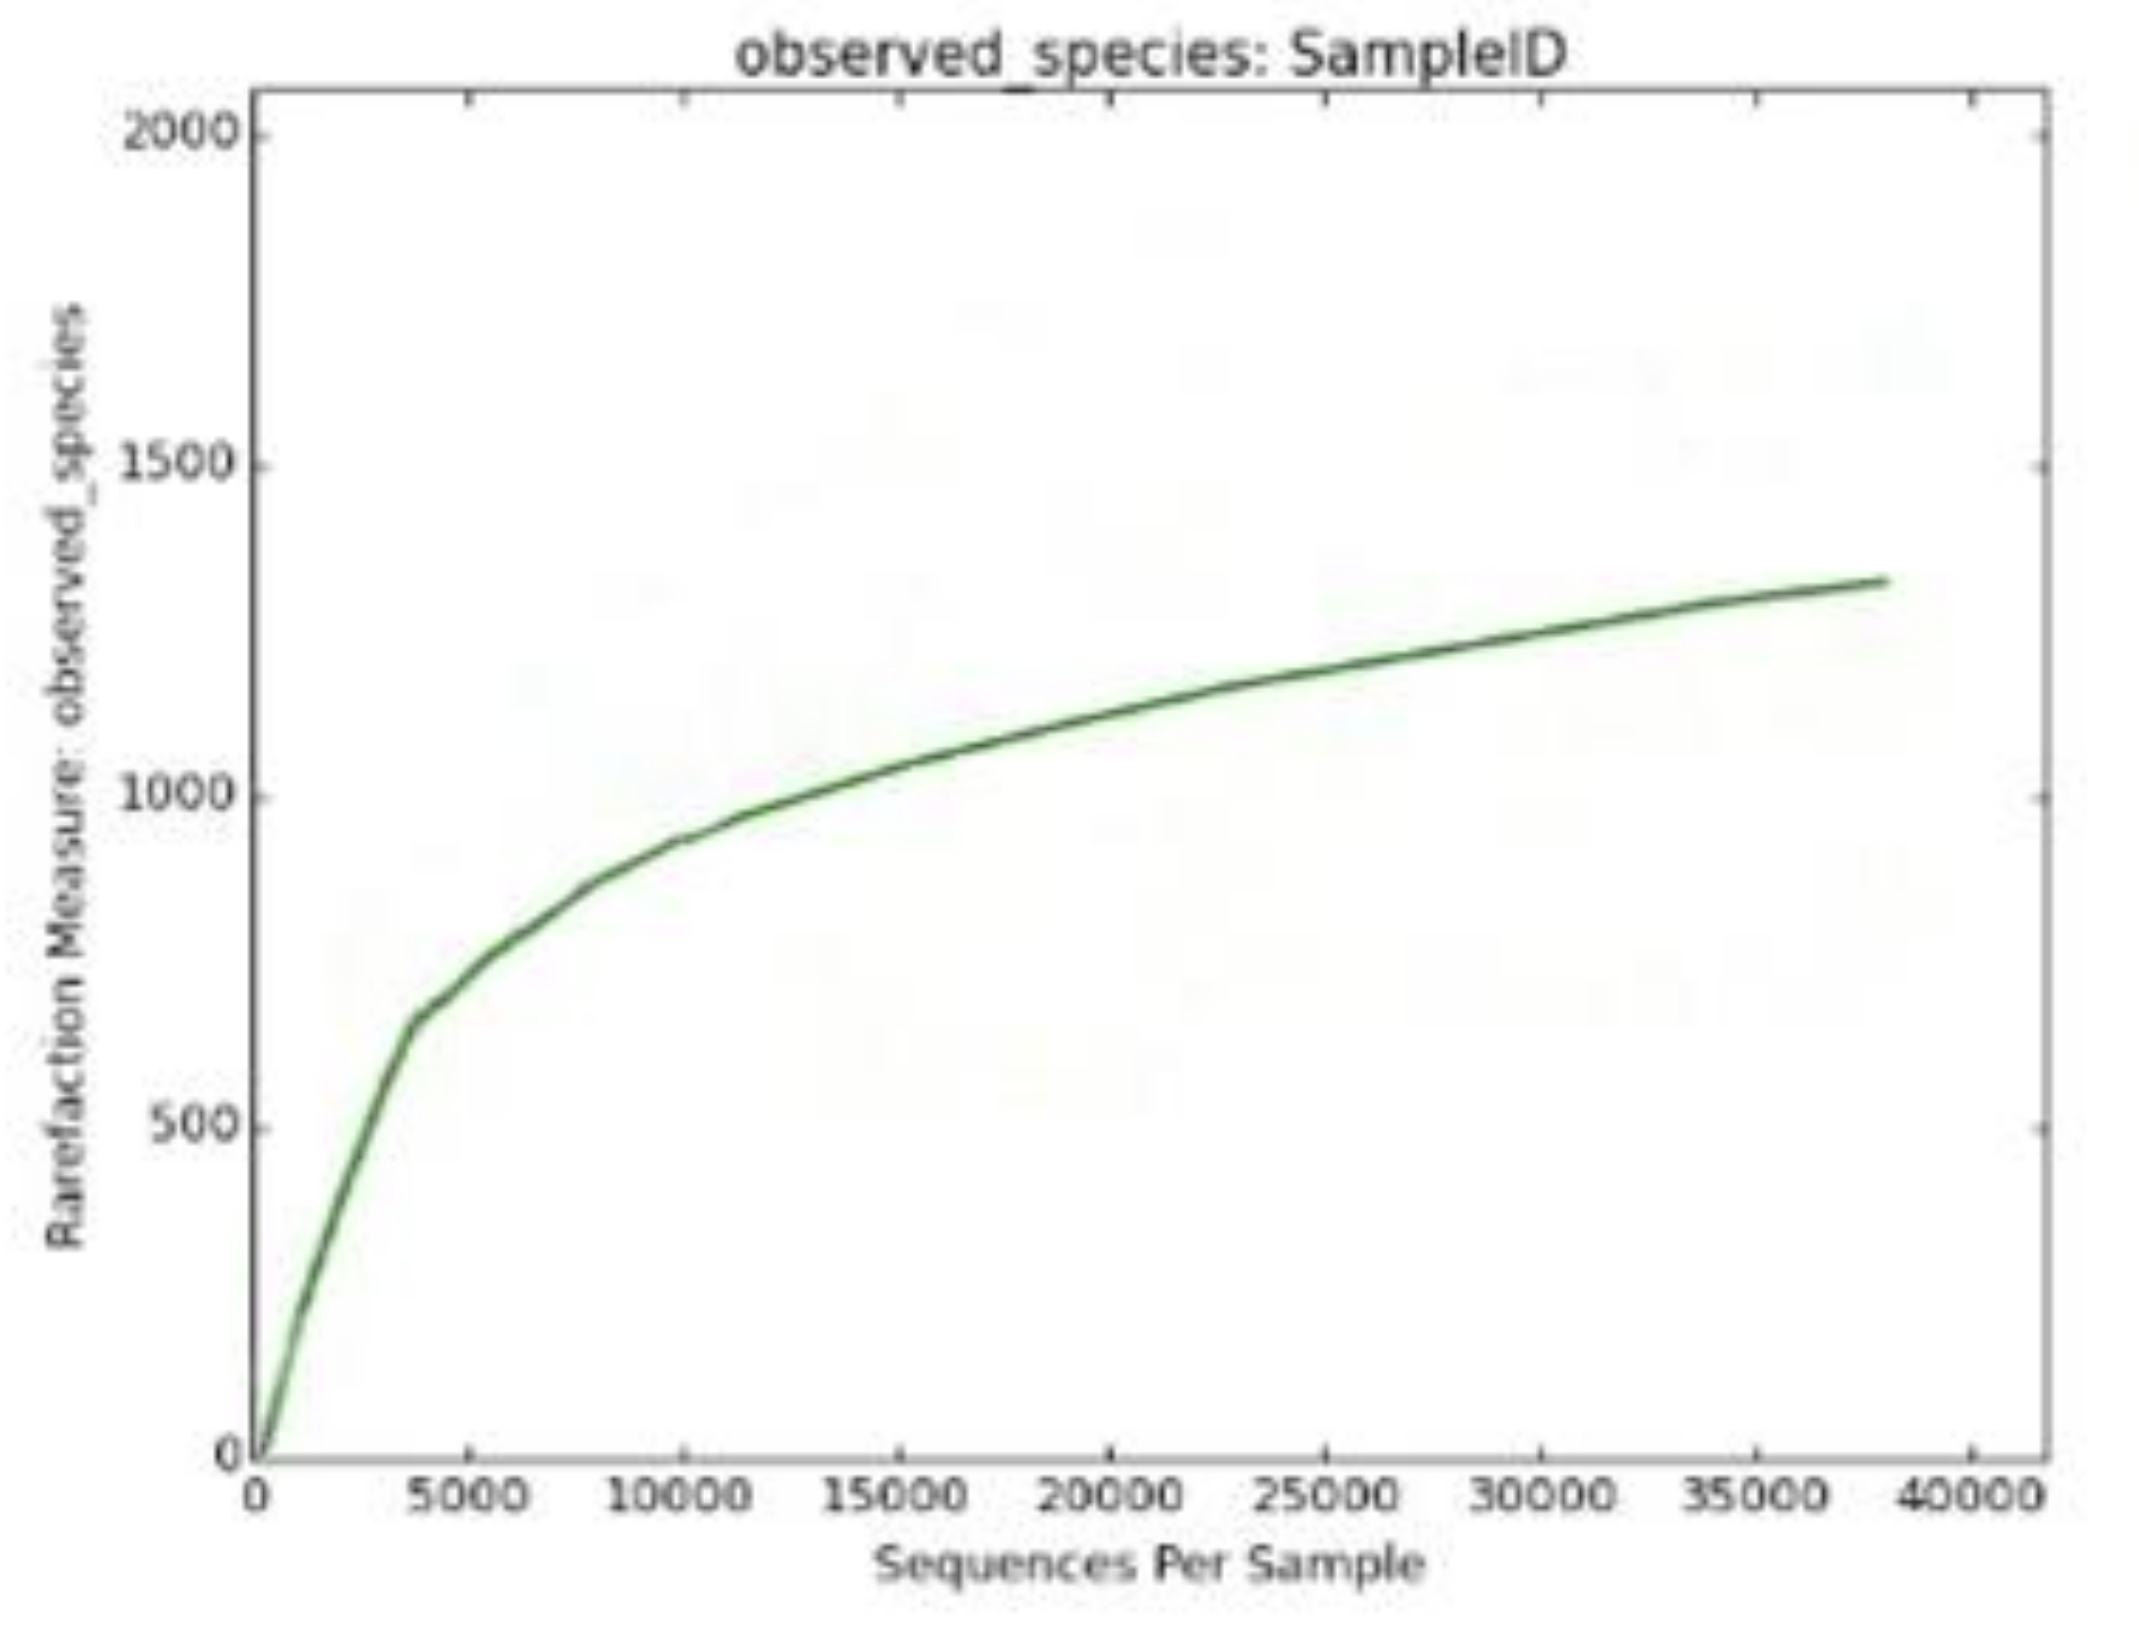
The Shannon diversity index (H) is an index commonly used to characterize species’ diversity in a community. In muscovite, we calculated it as 8.27735309509. The Shannon index accounts for both the abundance and evenness of the species. The Simpson diversity score is 0.991321004267, which is almost close to 1 and indicates high diversity in the muscovite samples. The Chao1 species richness value revealed that OUT richness is 2181.92727273. In addition, the rarefaction curve also revealed the same pattern of high relative diversity present in the muscovite sample (Figure 5). A significant number of species (1641) were also observed in the muscovite sample.
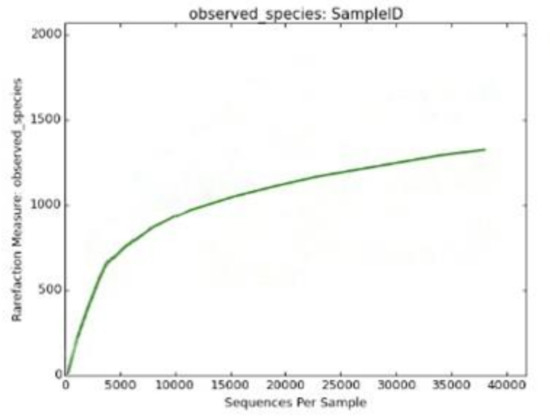
Figure 5.
Rarefaction curve revealing the high diversity in muscovite mineral.
Bacterial community distribution: The OTUs identified in the muscovite sample were categorized into different phyla, classes, orders, families and genera (Table 4).

Table 4.
Distribution of bacterial OTUs in muscovite samples.
The relative abundance of different bacterial phyla was identified as 20, classes as 55, orders as 96, families as 192, genuses as 382 and 482 species (Table 4).
The predominant phylum was Proteobacteria, accounting for 33.9% of total bacterial sequences, followed by Actinobacteria and Firmicutes with 29.9808% and 25.4479%, respectively (Table 5). However, Bacteroidetes and Chloroflexi represent 5.527% and 2.7357%, respectively. The remaining phyla Planctomycetes, Cyanobacteria, Thermi, Acidobacteria, TM7, Fusobacteria, BRC1, Nitrospirae, Tenericutes, Verrumicrobia, Gemmatimonadeta, Elusimicrobia, Armatimonadetes, SBR1093 and Eury archaeota were represented as <1.0%. The bacterial population present in the mica sample was represented by both abundant and rare species. The rare species were defined as those with a species frequency of <0.01% of the total population and the remaining ones are considered as abundant species. In all the samples there was a preponderance of rare species. In the muscovite sample, we observed 156 rare species and 306 abundant species. The presence of these rare and abundant species is unique to the picked samples and may be indicative of their crucial role in biogeochemical cycling. Some species can thrive well by using ATP-binding and ATP-independent periplasmic transporters [28]. Microbial communities are well-known key players of biogeochemical cycles and bacterial community structure is largely influenced by the mineral substrate present in the environment [29]. Our study also corroborated the above previous studies. In this nutrient-poor environment, natural selection favors the adaptations in microbial communities to sustain in these environments.

Table 5.
The abundance of different phyla in muscovite sample.
4. Conclusions
The present metagenomic study employed Illumina sequencing aimed at examining the taxonomical diversity of bacterial communities present in muscovite deposits. The oligotrophic muscovite deposit is a biodiversity hotspot region that harbors high phylogenetic diversity and is dominated by proteobacteria. The rarefaction curve revealed the high phylogenetic diversity from all hierarchies. A high proportion of rare species and unclassified sequences indicate the possibility of novel species. Further, research is needed to cultivate the uncultured communities or whole-genome sequencing is needed.
Author Contributions
C.T.P.—Investigation and Methodology; P.B.G.—Conceptualization, Data Analysis and Manuscript Editing; L.S.P., J.K. and V.C.—Data Analysis, Data Curation and Formal Analysis; P.C.—Supervision and Original Draft Preparation. All authors have read and agreed to the published version of the manuscript.
Funding
This research received no external funding.
Institutional Review Board Statement
Not applicable.
Informed Consent Statement
Not applicable.
Acknowledgments
Genotypic Technologies Ltd. is acknowledged for its help in DNA sequencing.
Conflicts of Interest
The authors declare no conflict of interest.
References
- Jannasch, H.W.; Eimhjell, K.; Farmanfa, A. Microbial degradation of organic matter in deep sea. Science 1971, 171, 672–675. [Google Scholar] [CrossRef] [PubMed]
- Parkes, R.J.; Cragg, B.A.; Getliff, J.M.; Goodman, K.; Rochelle, P.A.; Fry, J.C.; Weightman, A.J.; Harvey, S.M. Deep bacterial biosphere in pacific-Ocean sediments. Nature 1994, 371, 410–413. [Google Scholar] [CrossRef]
- Fry, J.C.; Parkes, R.J.; Cragg, B.A.; Weightman, A.J.; Webster, G. Prokaryotic biodiversity and activity in the deep subseafloor biosphere. FEMS Microbiol. Ecol. 2008, 66, 181–196. [Google Scholar] [CrossRef] [PubMed] [Green Version]
- Pikuta, E.V.; Hoover, R.B.; Tang, J. Microbial extremophiles at the limits of life. Crit. Rev. Microbiol. 2007, 33, 183–209. [Google Scholar] [CrossRef]
- Parkes, R.J.; Linnane, C.D.; Webster, G.; Sass, H.; Weightman, A.J.; Hornibrook, E.R.C.; Horsfield, B. Prokaryotes stimulate mineral H2 formation for the deep biosphere and subsequent thermogenic activity. Geology 2011, 39, 219–222. [Google Scholar] [CrossRef]
- Nealson, K.H.; Inagaki, F.; Takai, K. Hydrogen-driven subsurface lithoauthotrophic microbial ecosystem (SLiMEs). Do they exist and why should we care? Trends Microbiol. 2005, 13, 405–410. [Google Scholar] [CrossRef]
- El-Naggar, M.Y.; Wanger, G.; Leung, K.M.; Yuzvinsky, T.D.; Southam, G.; Yang, J.; Lau, W.M.; Nealson, K.H.; Gorby, Y.A. Electrical transport along bacterial nanowires from shewanlla oneidensis MR-1. Proc. Natl. Acad. Sci. USA 2010, 107, 18127–18131. [Google Scholar] [CrossRef] [Green Version]
- Wolfe-Simon, F.; Switzer Blum, J.; Kulp, T.R.; Gordon, G.W.; Hoeft, S.E.; Pett-Ridge, S.J.F.; Webb, S.M.; Weber, P.K.; Davies, P.C.W.; Anbar, A.D.; et al. A Bacterium that can grow by using arsenic instead of phosphorus. Science 2010, 332, 1163–1166. [Google Scholar] [CrossRef] [Green Version]
- Whitman, W.B.; Coleman, D.C.; Wiebe, W.J. Prokayotes: The unseen majority. Proc. Natl. Acad. Sci. USA 1998, 95, 6578–6583. [Google Scholar] [CrossRef] [Green Version]
- Monier, J.M.; Delmont, T.O.; Malandain, C.; Prestat, E.; Larose, C.; Simonet, P.; Vogel, T.M. Metagenomic mining for microbiologists. ISME J. 2011, 5, 1837–1843. [Google Scholar]
- Biswas, D.R.; Basak, B.B. Mobilization of potassium from waste mica by potassium solubilizing bacteria (Bacillus mucilaginosus) as influenced by temperature and incubation period under in-vitro laboratory condition. Agrochemica 2014, 38, 309–320. [Google Scholar]
- Subhashish, T.; Vivek Kumar, H.; John Loui, P.; Rana, B.; Jyoti Das, A.; Prabhat Kumar, M. Exploitation of mica depoits at Nellore mica belt, Andhrapradesh, India. Curr. Sci. 2020, 118, 593–602. [Google Scholar]
- Madhukar, B.B.L.; Srivastava, S.N.P. Mica and Mica Industry; Taylor and Francis: Oxford, UK, 1995. [Google Scholar]
- Riesenfeld, C.S.; Schloss, P.D.; Handelsman, J. Metagenomics: Genomic analysis of microbial communities. Annu. Rev. Genet. 2004, 38, 525–552. [Google Scholar] [CrossRef] [Green Version]
- Chevreux, B.; Pfisterer, T.; Drescher, B.; Driesel, A.J.; Werner, E.G.; Muller, W.E.G.; Wetter, T.; Suhai, S. Using the mira EST assembler for reliable and automated mRNA transcript assembly and SNP detection in sequenced ESTs. Genome Res. 2004, 14, 1147–1159. [Google Scholar] [CrossRef] [Green Version]
- Monier, J.M.; Demaneche, S.; Delmont, T.O.; Mathieu, A.; Vogel, T.M.; Simonet, P. Metagenomic exploration of antibiotic resistance in soil. Curr. Opin. Microbiol. 2011, 14, 229–235. [Google Scholar] [CrossRef]
- Chivian, D.; Brodie, E.L.; Alm, E.J.; Culley, D.E.; Dehal, P.S.; DeSantis, T.Z.; Gihring, T.M.; Lapidus, A.; Lin, L.H.; Lowry, S.R.; et al. Environmental genomics reveals a single-Species ecosystem deep with in Earth. Science 2008, 322, 275–278. [Google Scholar] [CrossRef] [Green Version]
- Brazelton, W.J.; Nelson, B.; Schrenk, M.O. Metagenomic evidence for h(2) oxidation and h(2) production by serpentinite- hosted subsurface microbial communities. Front. Microbiol. 2012, 2, 268. [Google Scholar] [CrossRef] [Green Version]
- Pang, B.; Son, J.; McFaline, J.L.; Taghizadeh, K.; Dedon, P.C. Surveying the damage: The challenges of developing nucleic acid biomarkers of inflammation. Mol. BioSyst. 2008, 4, 902–908. [Google Scholar]
- Shannon, C.E. A mathematical theory of communication. Bell Syst. Tech. J. 1948, 27, 379–423. [Google Scholar] [CrossRef] [Green Version]
- Simpson, E.H. Measurement of diversity. Nature 1949, 163, 688. [Google Scholar] [CrossRef]
- Chao, A. Estimating the population size for capture—Recapture data with unequal catchability. Biometrics 1987, 43, 783–791. [Google Scholar] [CrossRef]
- Caporaso, J.E.; Kuczynski, J.; Stombaugh, J.; Bittinger, K.; Bushman, F.D.; Costello, E.K.; Fierer, N.; Pena, A.G.; Goodrich, J.K.; Gordon, J.I.; et al. QIIME allows analysis of high-throughput community sequencing data. Nat. Methods 2010, 7, 335–336. [Google Scholar] [CrossRef] [Green Version]
- Li, W.; Godzik, A. Cd-hit: A fast program for clustering and comparing large sets of protein or nucleotide sequences. Bioinformatics 2006, 22, 1658–1659. [Google Scholar] [CrossRef] [Green Version]
- Lozupone, C.A.; Knight, R. Species divergence and the measurement of microbial diversity. FEMS Microbiol. Rev. 2008, 32, 557–578. [Google Scholar] [CrossRef]
- Shannon, C.E.; Weaver, W. The Mathematical Theory of Communication; University of Illinois Press: Urbana, IL, USA, 1949. [Google Scholar]
- Chao, A. Non-parametric estimation of the number of classes in a population. Scand. J. Stat. 1984, 11, 265–270. [Google Scholar]
- Kumbhare, S.V.; Dhotre, D.P.; Sunil Kumar, D.; Apte, D.A.; Shouche, Y.S.; Sharma, A. Insights into Diversity and imputed Metabolic potential of bacterial communities in the continental shelf of Agatti Island. PLoS ONE 2015, 10, e0129864. [Google Scholar] [CrossRef] [Green Version]
- Carson, J.K.; Campbell, L.; Rooney, D.; Clipson, N.; Gleeson, D.B. Minerals in soil selected district bacterial communities in their micro habitats. FEMS Microbiol. Ecol. 2009, 67, 381–388. [Google Scholar] [CrossRef]
Publisher’s Note: MDPI stays neutral with regard to jurisdictional claims in published maps and institutional affiliations. |
© 2022 by the authors. Licensee MDPI, Basel, Switzerland. This article is an open access article distributed under the terms and conditions of the Creative Commons Attribution (CC BY) license (https://creativecommons.org/licenses/by/4.0/).

