
Oligotrophic Bacterial Community Structure Associated with Muscovite Mineral Is Rich in Proteobacterial Microbiomes Revealed through Next-Generation Sequencing

 , , ,
, , ,
Abstract
:1. Introduction
2. Materials and Methods
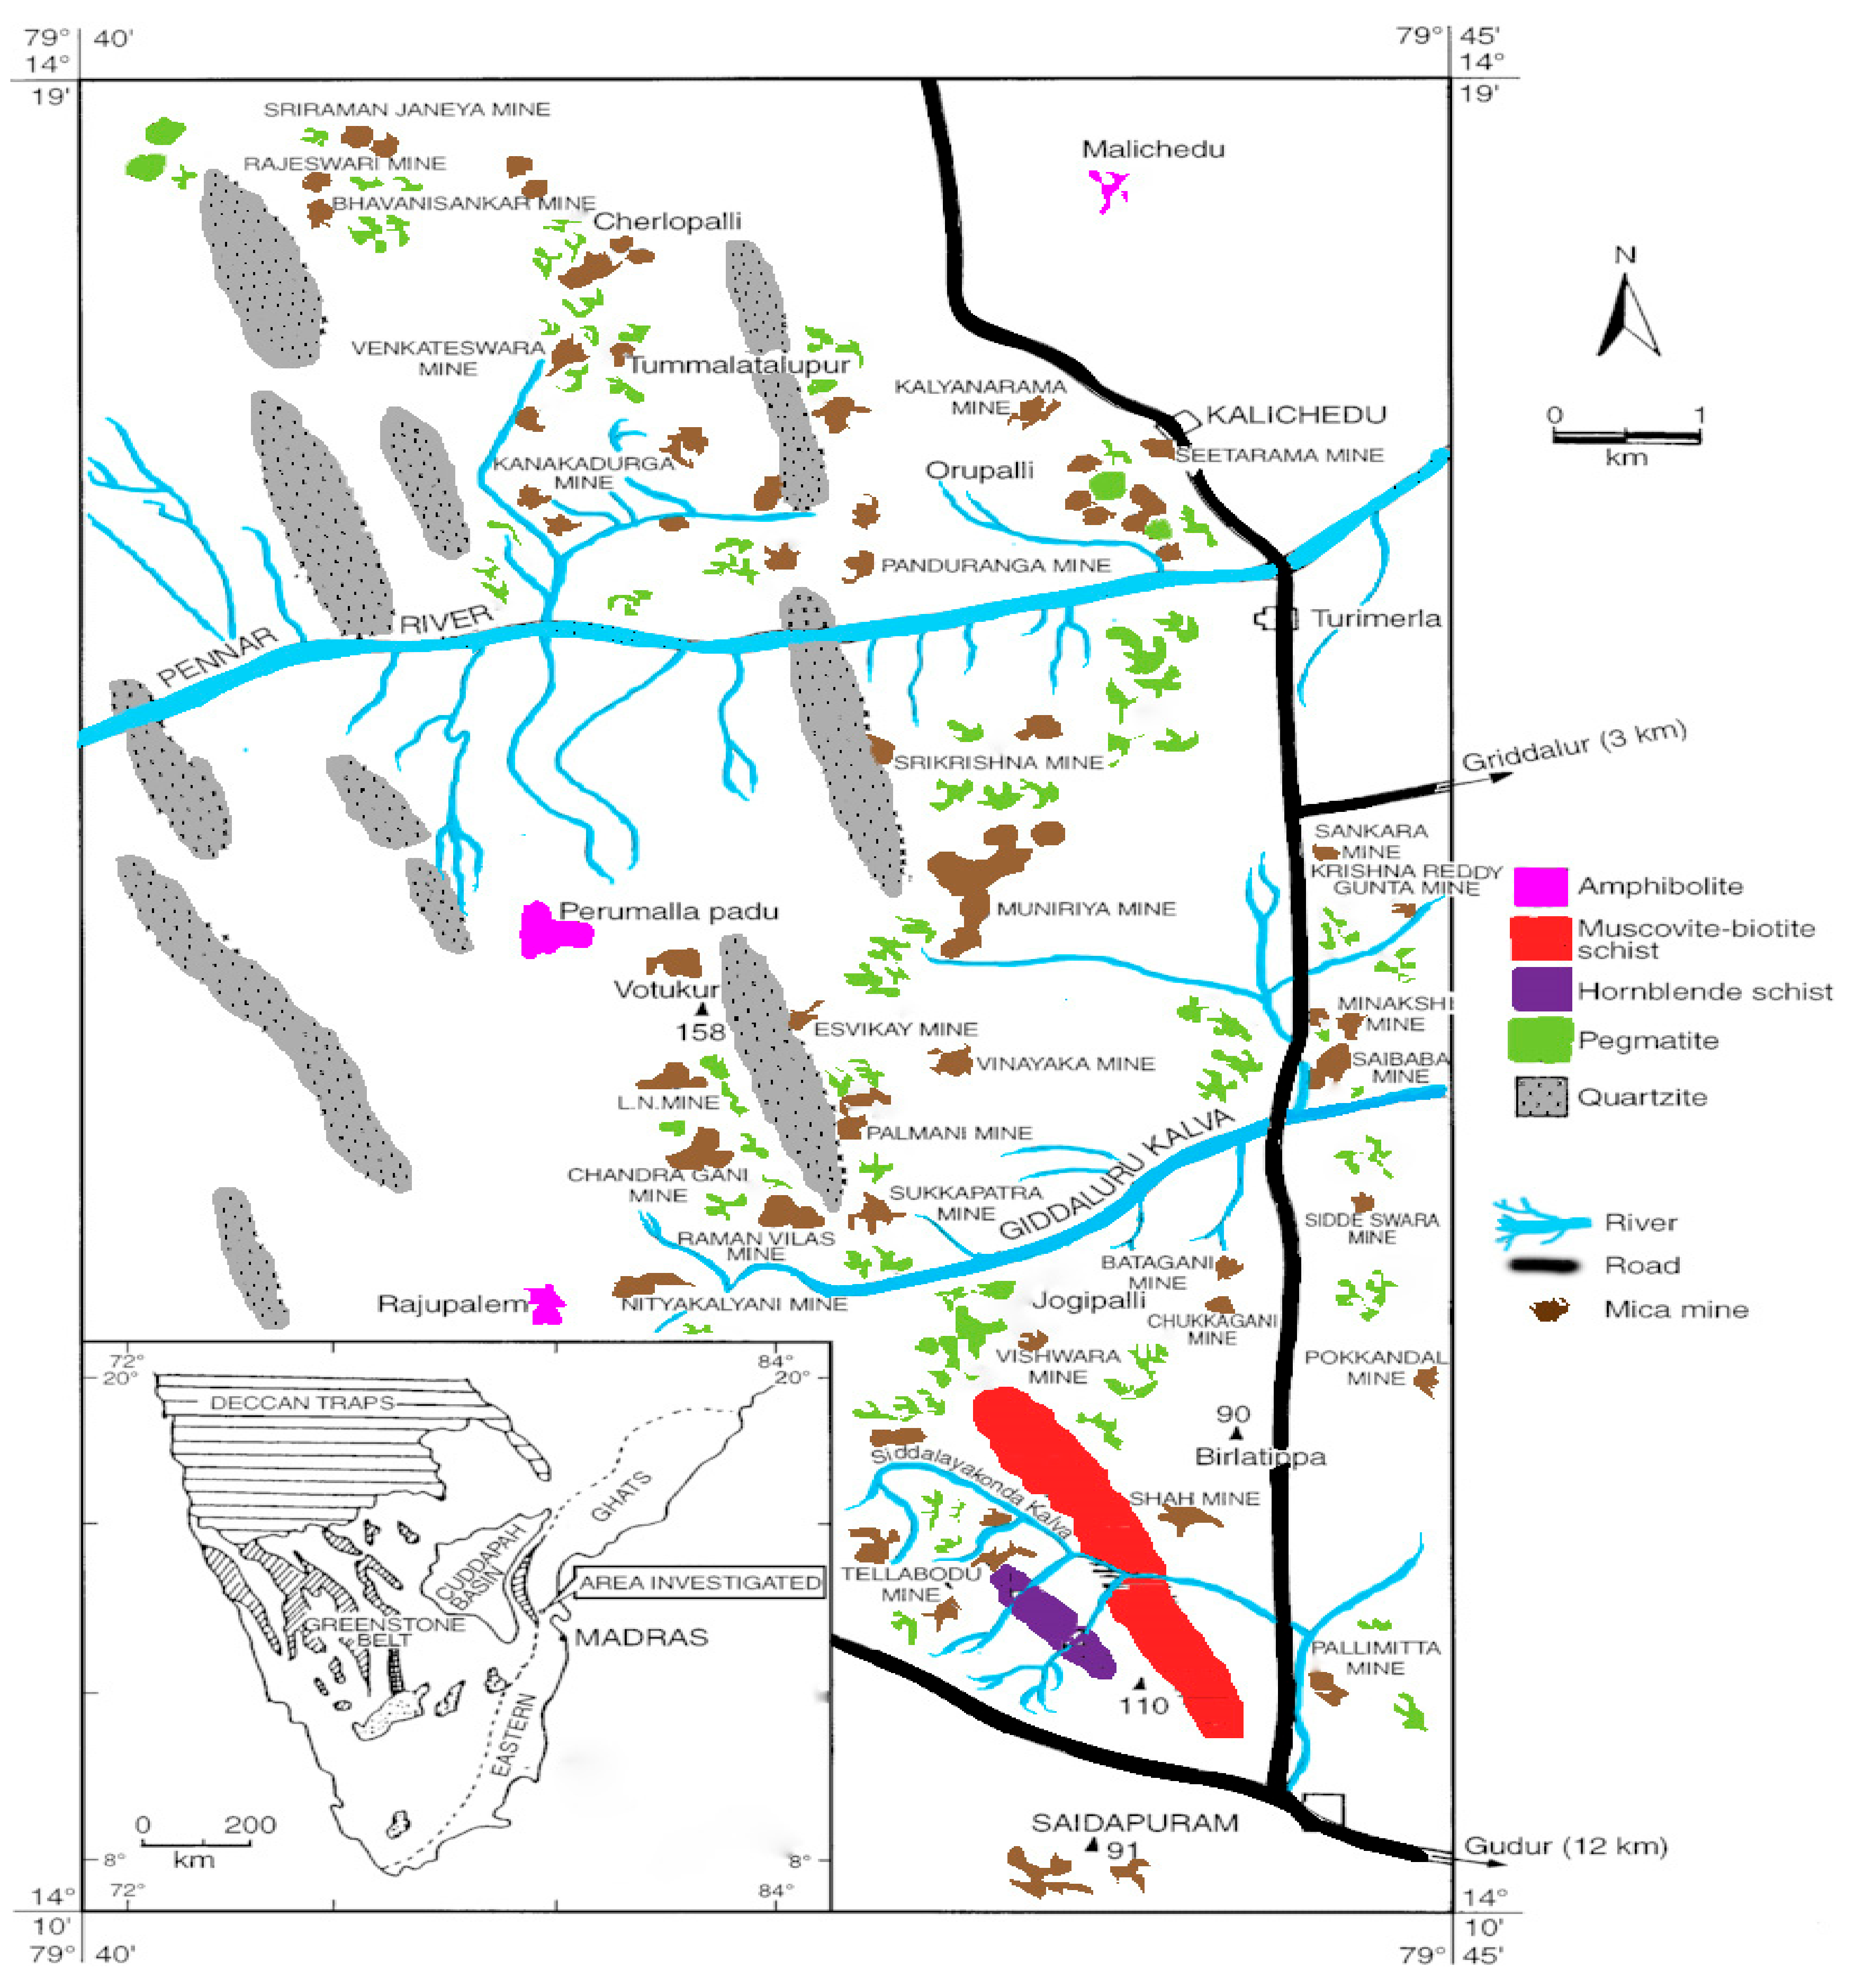
2.1. Description of the Sampling Site
2.2. Collection and Processing of Muscovite
2.3. Extraction of DNA from Muscovite Samples
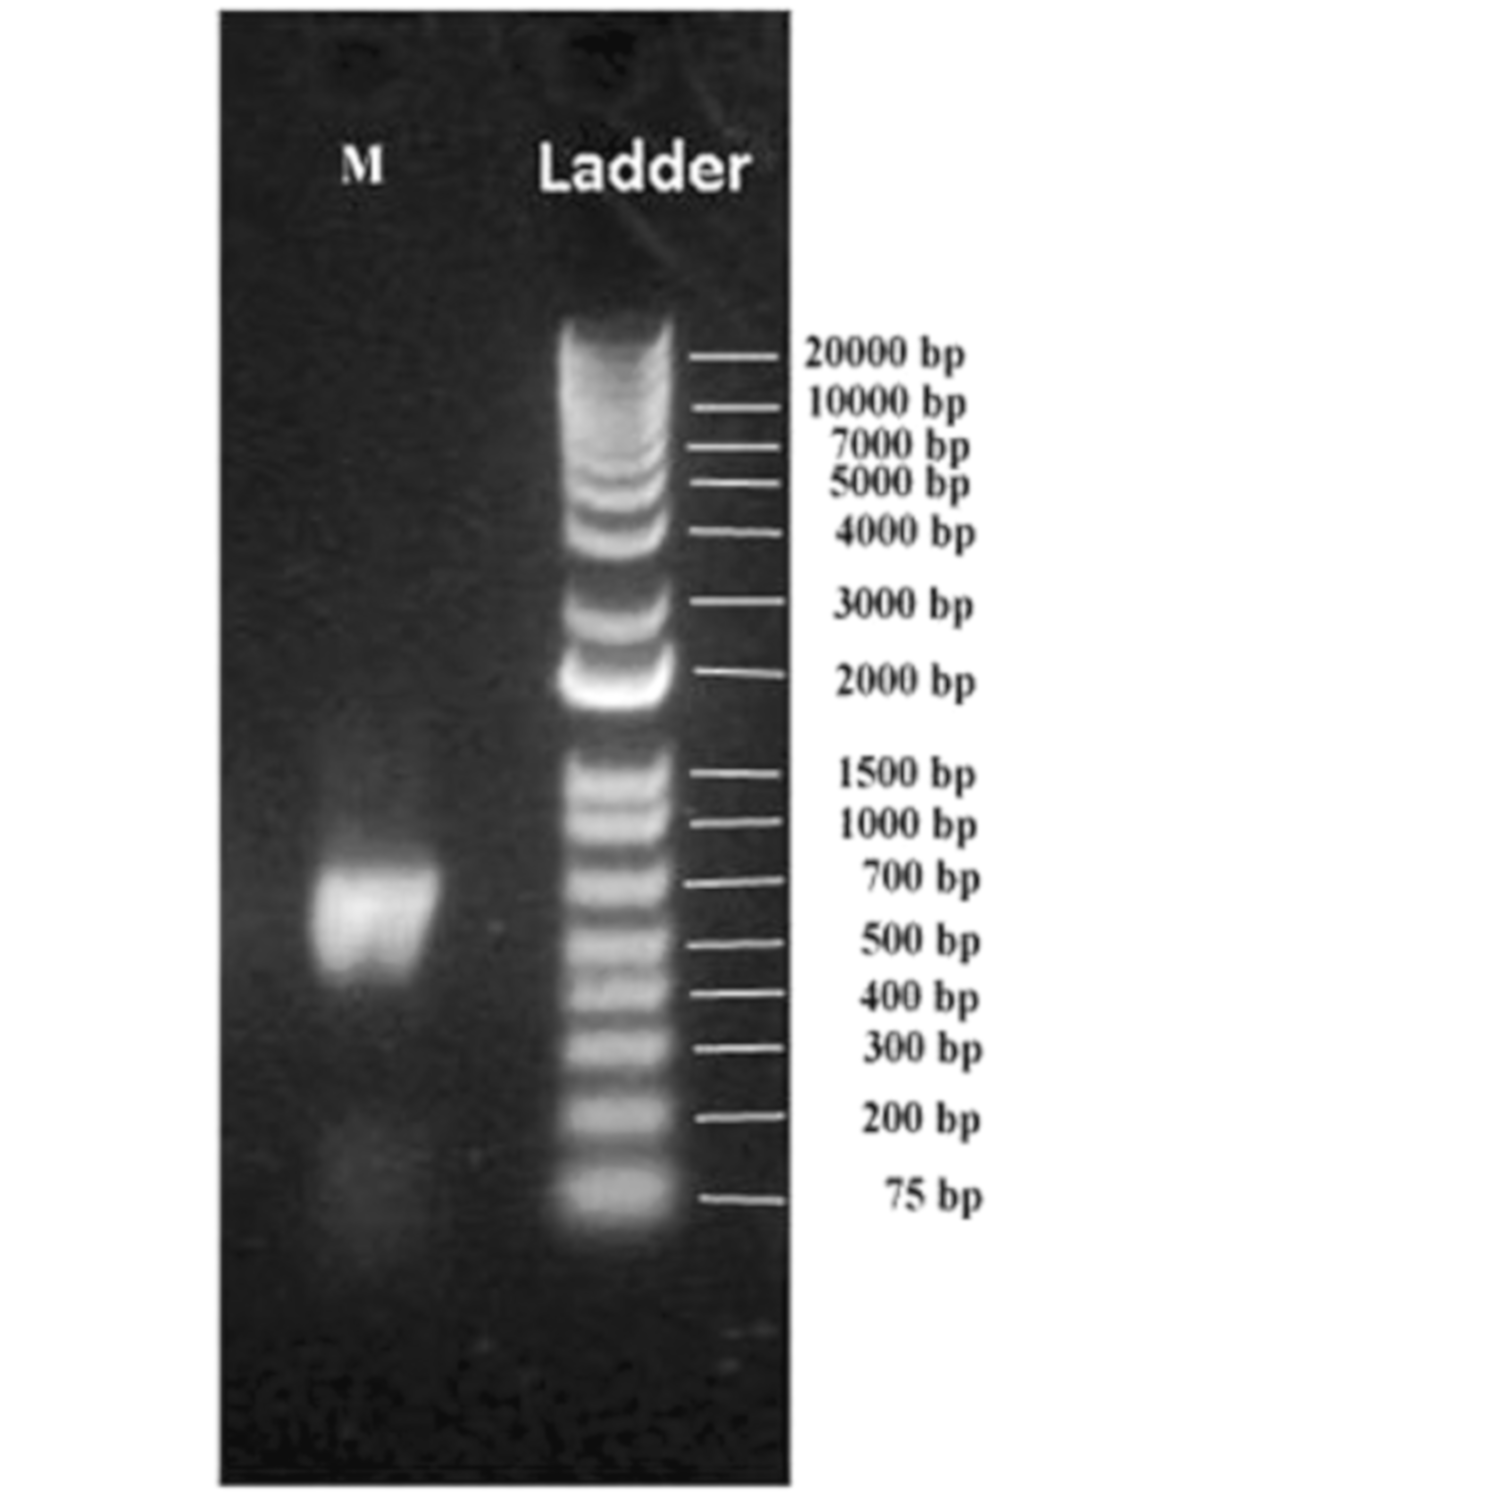
2.4. Amplification of V3–V4 Region Regions of 16S rDNA Region of Metagenome Using Polymerase Chain Reaction
2.5. Library Preparation and Illumina MI seq Sequencing
2.6. Processing and Bioinformatics Analysis of Sequence Reads
2.7. Statistical Analysis
3. Results and Discussion
4. Conclusions
Author Contributions
Funding
Institutional Review Board Statement
Informed Consent Statement
Acknowledgments
Conflicts of Interest
References
- Jannasch, H.W.; Eimhjell, K.; Farmanfa, A. Microbial degradation of organic matter in deep sea. Science 1971, 171, 672–675. [Google Scholar] [CrossRef] [PubMed]
- Parkes, R.J.; Cragg, B.A.; Getliff, J.M.; Goodman, K.; Rochelle, P.A.; Fry, J.C.; Weightman, A.J.; Harvey, S.M. Deep bacterial biosphere in pacific-Ocean sediments. Nature 1994, 371, 410–413. [Google Scholar] [CrossRef]
- Fry, J.C.; Parkes, R.J.; Cragg, B.A.; Weightman, A.J.; Webster, G. Prokaryotic biodiversity and activity in the deep subseafloor biosphere. FEMS Microbiol. Ecol. 2008, 66, 181–196. [Google Scholar] [CrossRef] [PubMed] [Green Version]
- Pikuta, E.V.; Hoover, R.B.; Tang, J. Microbial extremophiles at the limits of life. Crit. Rev. Microbiol. 2007, 33, 183–209. [Google Scholar] [CrossRef]
- Parkes, R.J.; Linnane, C.D.; Webster, G.; Sass, H.; Weightman, A.J.; Hornibrook, E.R.C.; Horsfield, B. Prokaryotes stimulate mineral H2 formation for the deep biosphere and subsequent thermogenic activity. Geology 2011, 39, 219–222. [Google Scholar] [CrossRef]
- Nealson, K.H.; Inagaki, F.; Takai, K. Hydrogen-driven subsurface lithoauthotrophic microbial ecosystem (SLiMEs). Do they exist and why should we care? Trends Microbiol. 2005, 13, 405–410. [Google Scholar] [CrossRef]
- El-Naggar, M.Y.; Wanger, G.; Leung, K.M.; Yuzvinsky, T.D.; Southam, G.; Yang, J.; Lau, W.M.; Nealson, K.H.; Gorby, Y.A. Electrical transport along bacterial nanowires from shewanlla oneidensis MR-1. Proc. Natl. Acad. Sci. USA 2010, 107, 18127–18131. [Google Scholar] [CrossRef] [Green Version]
- Wolfe-Simon, F.; Switzer Blum, J.; Kulp, T.R.; Gordon, G.W.; Hoeft, S.E.; Pett-Ridge, S.J.F.; Webb, S.M.; Weber, P.K.; Davies, P.C.W.; Anbar, A.D.; et al. A Bacterium that can grow by using arsenic instead of phosphorus. Science 2010, 332, 1163–1166. [Google Scholar] [CrossRef] [Green Version]
- Whitman, W.B.; Coleman, D.C.; Wiebe, W.J. Prokayotes: The unseen majority. Proc. Natl. Acad. Sci. USA 1998, 95, 6578–6583. [Google Scholar] [CrossRef] [Green Version]
- Monier, J.M.; Delmont, T.O.; Malandain, C.; Prestat, E.; Larose, C.; Simonet, P.; Vogel, T.M. Metagenomic mining for microbiologists. ISME J. 2011, 5, 1837–1843. [Google Scholar]
- Biswas, D.R.; Basak, B.B. Mobilization of potassium from waste mica by potassium solubilizing bacteria (Bacillus mucilaginosus) as influenced by temperature and incubation period under in-vitro laboratory condition. Agrochemica 2014, 38, 309–320. [Google Scholar]
- Subhashish, T.; Vivek Kumar, H.; John Loui, P.; Rana, B.; Jyoti Das, A.; Prabhat Kumar, M. Exploitation of mica depoits at Nellore mica belt, Andhrapradesh, India. Curr. Sci. 2020, 118, 593–602. [Google Scholar]
- Madhukar, B.B.L.; Srivastava, S.N.P. Mica and Mica Industry; Taylor and Francis: Oxford, UK, 1995. [Google Scholar]
- Riesenfeld, C.S.; Schloss, P.D.; Handelsman, J. Metagenomics: Genomic analysis of microbial communities. Annu. Rev. Genet. 2004, 38, 525–552. [Google Scholar] [CrossRef] [Green Version]
- Chevreux, B.; Pfisterer, T.; Drescher, B.; Driesel, A.J.; Werner, E.G.; Muller, W.E.G.; Wetter, T.; Suhai, S. Using the mira EST assembler for reliable and automated mRNA transcript assembly and SNP detection in sequenced ESTs. Genome Res. 2004, 14, 1147–1159. [Google Scholar] [CrossRef] [Green Version]
- Monier, J.M.; Demaneche, S.; Delmont, T.O.; Mathieu, A.; Vogel, T.M.; Simonet, P. Metagenomic exploration of antibiotic resistance in soil. Curr. Opin. Microbiol. 2011, 14, 229–235. [Google Scholar] [CrossRef]
- Chivian, D.; Brodie, E.L.; Alm, E.J.; Culley, D.E.; Dehal, P.S.; DeSantis, T.Z.; Gihring, T.M.; Lapidus, A.; Lin, L.H.; Lowry, S.R.; et al. Environmental genomics reveals a single-Species ecosystem deep with in Earth. Science 2008, 322, 275–278. [Google Scholar] [CrossRef] [Green Version]
- Brazelton, W.J.; Nelson, B.; Schrenk, M.O. Metagenomic evidence for h(2) oxidation and h(2) production by serpentinite- hosted subsurface microbial communities. Front. Microbiol. 2012, 2, 268. [Google Scholar] [CrossRef] [Green Version]
- Pang, B.; Son, J.; McFaline, J.L.; Taghizadeh, K.; Dedon, P.C. Surveying the damage: The challenges of developing nucleic acid biomarkers of inflammation. Mol. BioSyst. 2008, 4, 902–908. [Google Scholar]
- Shannon, C.E. A mathematical theory of communication. Bell Syst. Tech. J. 1948, 27, 379–423. [Google Scholar] [CrossRef] [Green Version]
- Simpson, E.H. Measurement of diversity. Nature 1949, 163, 688. [Google Scholar] [CrossRef]
- Chao, A. Estimating the population size for capture—Recapture data with unequal catchability. Biometrics 1987, 43, 783–791. [Google Scholar] [CrossRef]
- Caporaso, J.E.; Kuczynski, J.; Stombaugh, J.; Bittinger, K.; Bushman, F.D.; Costello, E.K.; Fierer, N.; Pena, A.G.; Goodrich, J.K.; Gordon, J.I.; et al. QIIME allows analysis of high-throughput community sequencing data. Nat. Methods 2010, 7, 335–336. [Google Scholar] [CrossRef] [Green Version]
- Li, W.; Godzik, A. Cd-hit: A fast program for clustering and comparing large sets of protein or nucleotide sequences. Bioinformatics 2006, 22, 1658–1659. [Google Scholar] [CrossRef] [Green Version]
- Lozupone, C.A.; Knight, R. Species divergence and the measurement of microbial diversity. FEMS Microbiol. Rev. 2008, 32, 557–578. [Google Scholar] [CrossRef]
- Shannon, C.E.; Weaver, W. The Mathematical Theory of Communication; University of Illinois Press: Urbana, IL, USA, 1949. [Google Scholar]
- Chao, A. Non-parametric estimation of the number of classes in a population. Scand. J. Stat. 1984, 11, 265–270. [Google Scholar]
- Kumbhare, S.V.; Dhotre, D.P.; Sunil Kumar, D.; Apte, D.A.; Shouche, Y.S.; Sharma, A. Insights into Diversity and imputed Metabolic potential of bacterial communities in the continental shelf of Agatti Island. PLoS ONE 2015, 10, e0129864. [Google Scholar] [CrossRef] [Green Version]
- Carson, J.K.; Campbell, L.; Rooney, D.; Clipson, N.; Gleeson, D.B. Minerals in soil selected district bacterial communities in their micro habitats. FEMS Microbiol. Ecol. 2009, 67, 381–388. [Google Scholar] [CrossRef]


| Index-1 | Index-1 Sequence | Index-2 | Index-2 Sequence |
|---|---|---|---|
| N712 | GTAGAGGA | S510 | CGTCTAAT |
| Total paired end reads | 197,924 |
| Processed reads | 193,837 |
| Total identified rRNA sequences | 86,412 |
| Total OUTs picked | 1641 |
| Diversity Index | Matrices |
|---|---|
| Shannon (H) | 8.27735309509 |
| Simpson | 0.991321004267 |
| Chao1 | 2181.92727273 |
| Observed species | 1641.0 |
| Taxonomical Status | Bacterial OTUs |
|---|---|
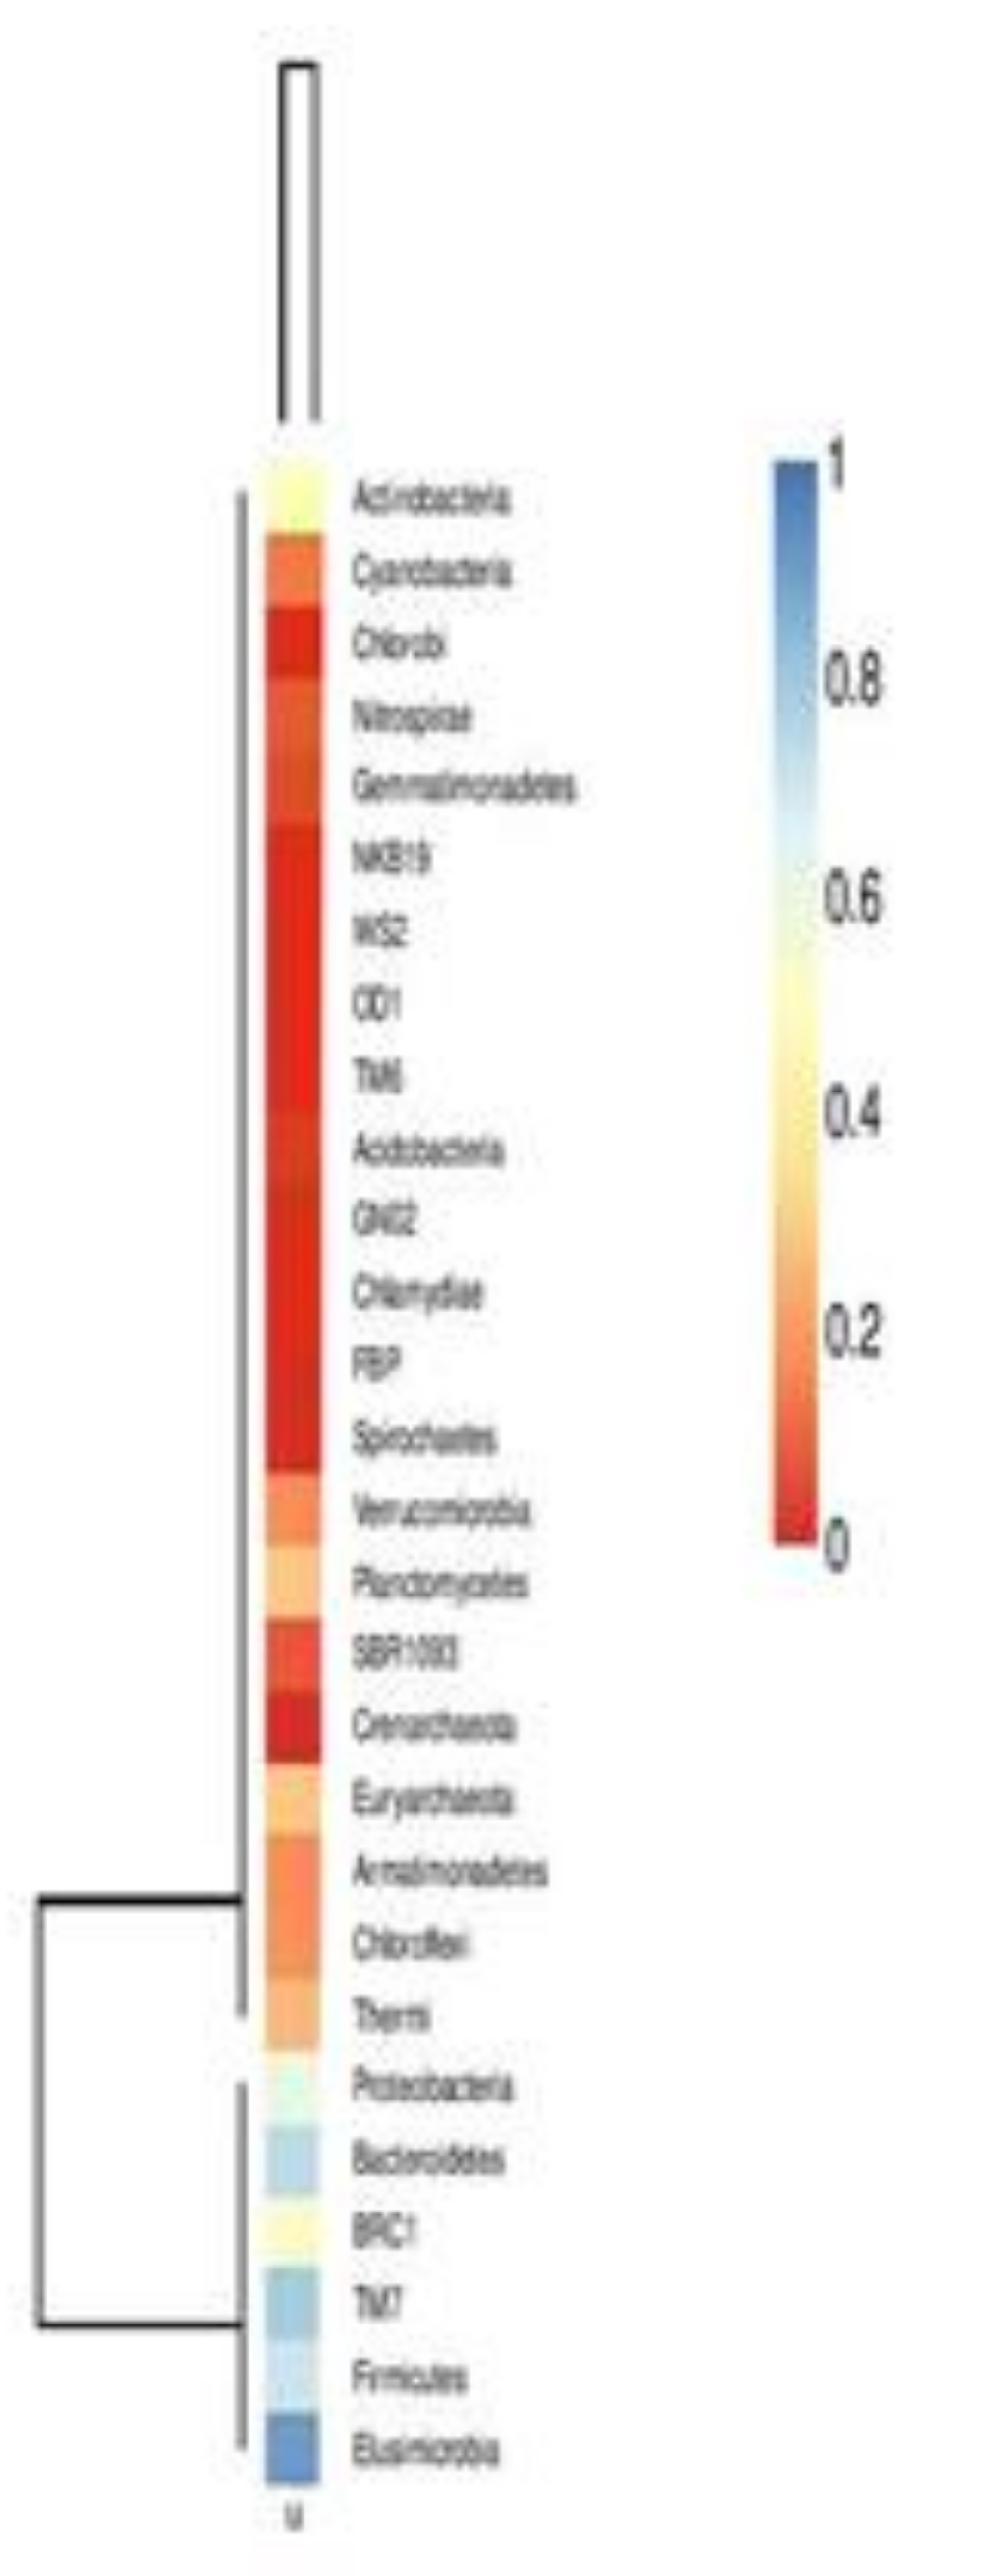
| Phylum | 20 |
| Classes | 55 |
| Orders | 96 |
| Family | 192 |
| Genus | 382 |
| Species | 462 |
| Name of the Kingdom | Name of the Phyla | Total Numbers | Percent (%) |
|---|---|---|---|
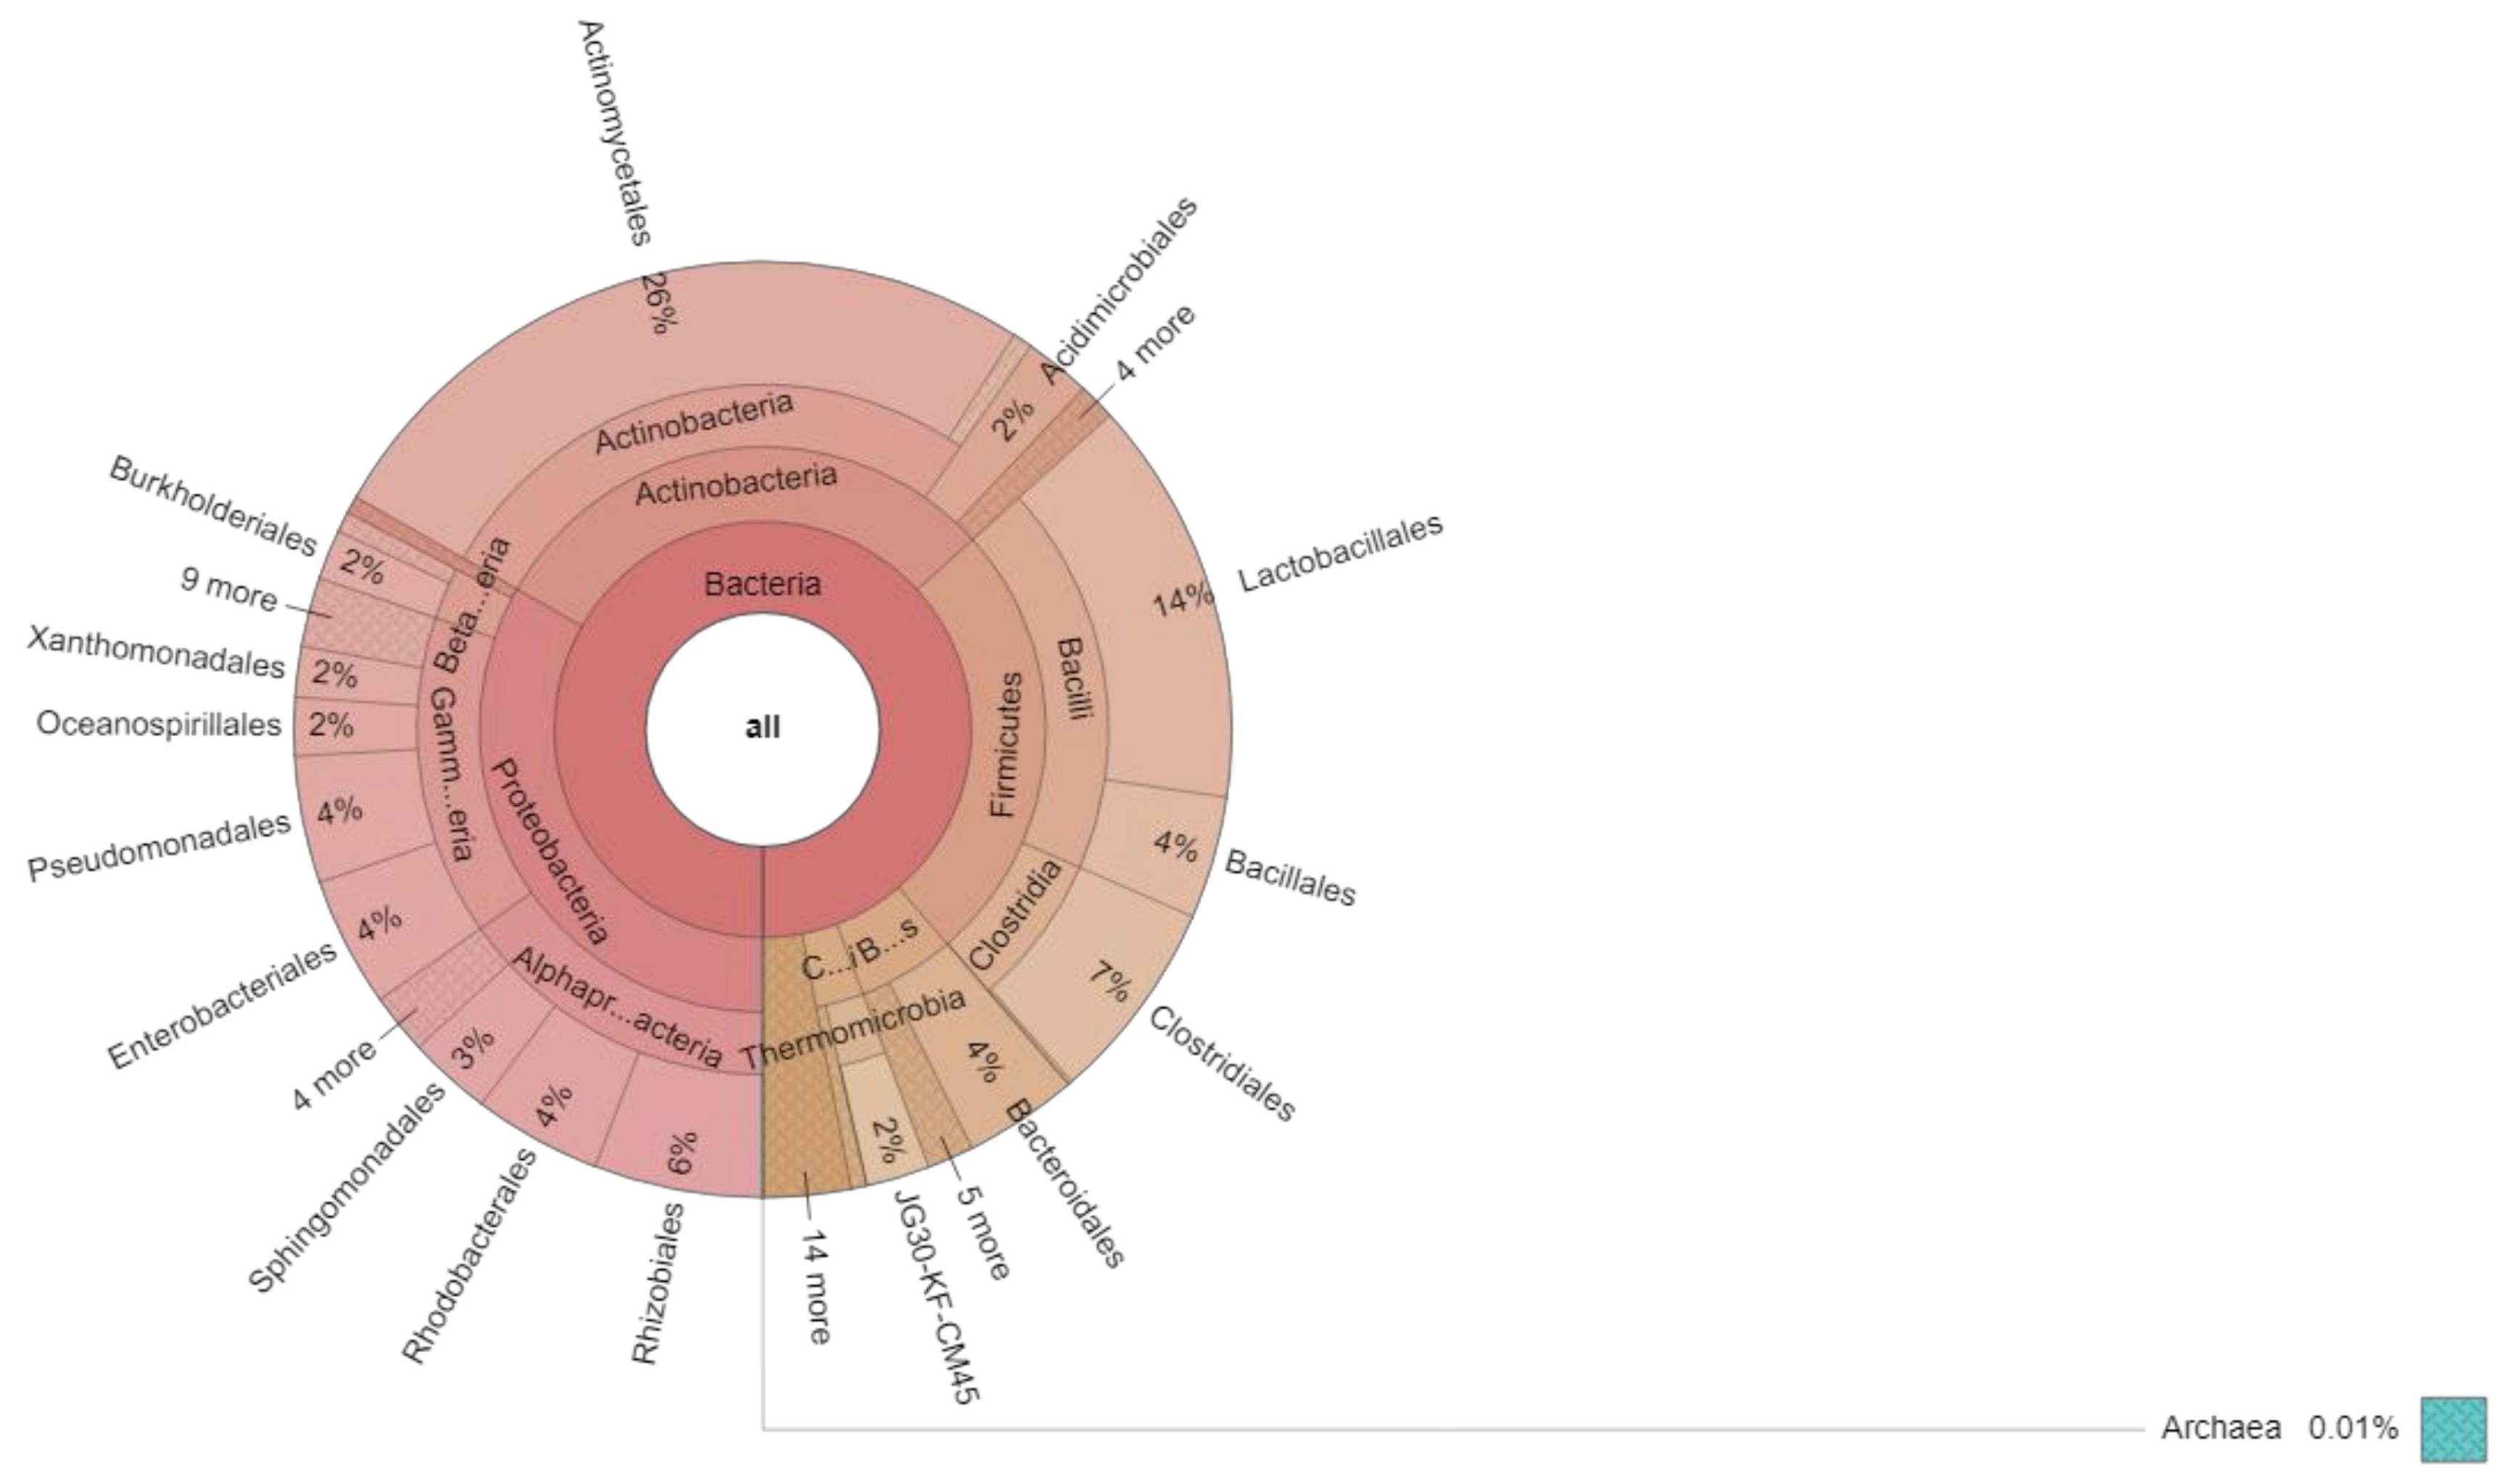
| Bacteria | Proteobacteria | 28,763 | 33.2859% |
| Bacteria | Actinobacteria | 25,907 | 29.9808 |
| Bacteria | Firmicutes | 21,990 | 25.4479 |
| Bacteria | Bacteroidetes | 4773 | 5.527 |
| Bacteria | Chloroflexii | 2364 | 2.7357 |
Publisher’s Note: MDPI stays neutral with regard to jurisdictional claims in published maps and institutional affiliations. |
© 2022 by the authors. Licensee MDPI, Basel, Switzerland. This article is an open access article distributed under the terms and conditions of the Creative Commons Attribution (CC BY) license (https://creativecommons.org/licenses/by/4.0/).
Share and Cite
Pindi, C.T.; Gundala, P.B.; Paruchuri, L.S.; Kolapratap, J.; Chennupati, V.; Chinthala, P. Oligotrophic Bacterial Community Structure Associated with Muscovite Mineral Is Rich in Proteobacterial Microbiomes Revealed through Next-Generation Sequencing. Microbiol. Res. 2022, 13, 210-218. https://doi.org/10.3390/microbiolres13020018
Pindi CT, Gundala PB, Paruchuri LS, Kolapratap J, Chennupati V, Chinthala P. Oligotrophic Bacterial Community Structure Associated with Muscovite Mineral Is Rich in Proteobacterial Microbiomes Revealed through Next-Generation Sequencing. Microbiology Research. 2022; 13(2):210-218. https://doi.org/10.3390/microbiolres13020018
Chicago/Turabian StylePindi, Charan Theja, Prasada Babu Gundala, Lakshmi Subhadra Paruchuri, Jyothirmayee Kolapratap, Vidyasagar Chennupati, and Paramageetham Chinthala. 2022. "Oligotrophic Bacterial Community Structure Associated with Muscovite Mineral Is Rich in Proteobacterial Microbiomes Revealed through Next-Generation Sequencing" Microbiology Research 13, no. 2: 210-218. https://doi.org/10.3390/microbiolres13020018
APA StylePindi, C. T., Gundala, P. B., Paruchuri, L. S., Kolapratap, J., Chennupati, V., & Chinthala, P. (2022). Oligotrophic Bacterial Community Structure Associated with Muscovite Mineral Is Rich in Proteobacterial Microbiomes Revealed through Next-Generation Sequencing. Microbiology Research, 13(2), 210-218. https://doi.org/10.3390/microbiolres13020018