
Multi-Year Analysis of Respiratory Viral Dynamics Reveals Significance of Rhinovirus in Young Children with Severe Respiratory Illness

 and
and
Abstract
1. Introduction
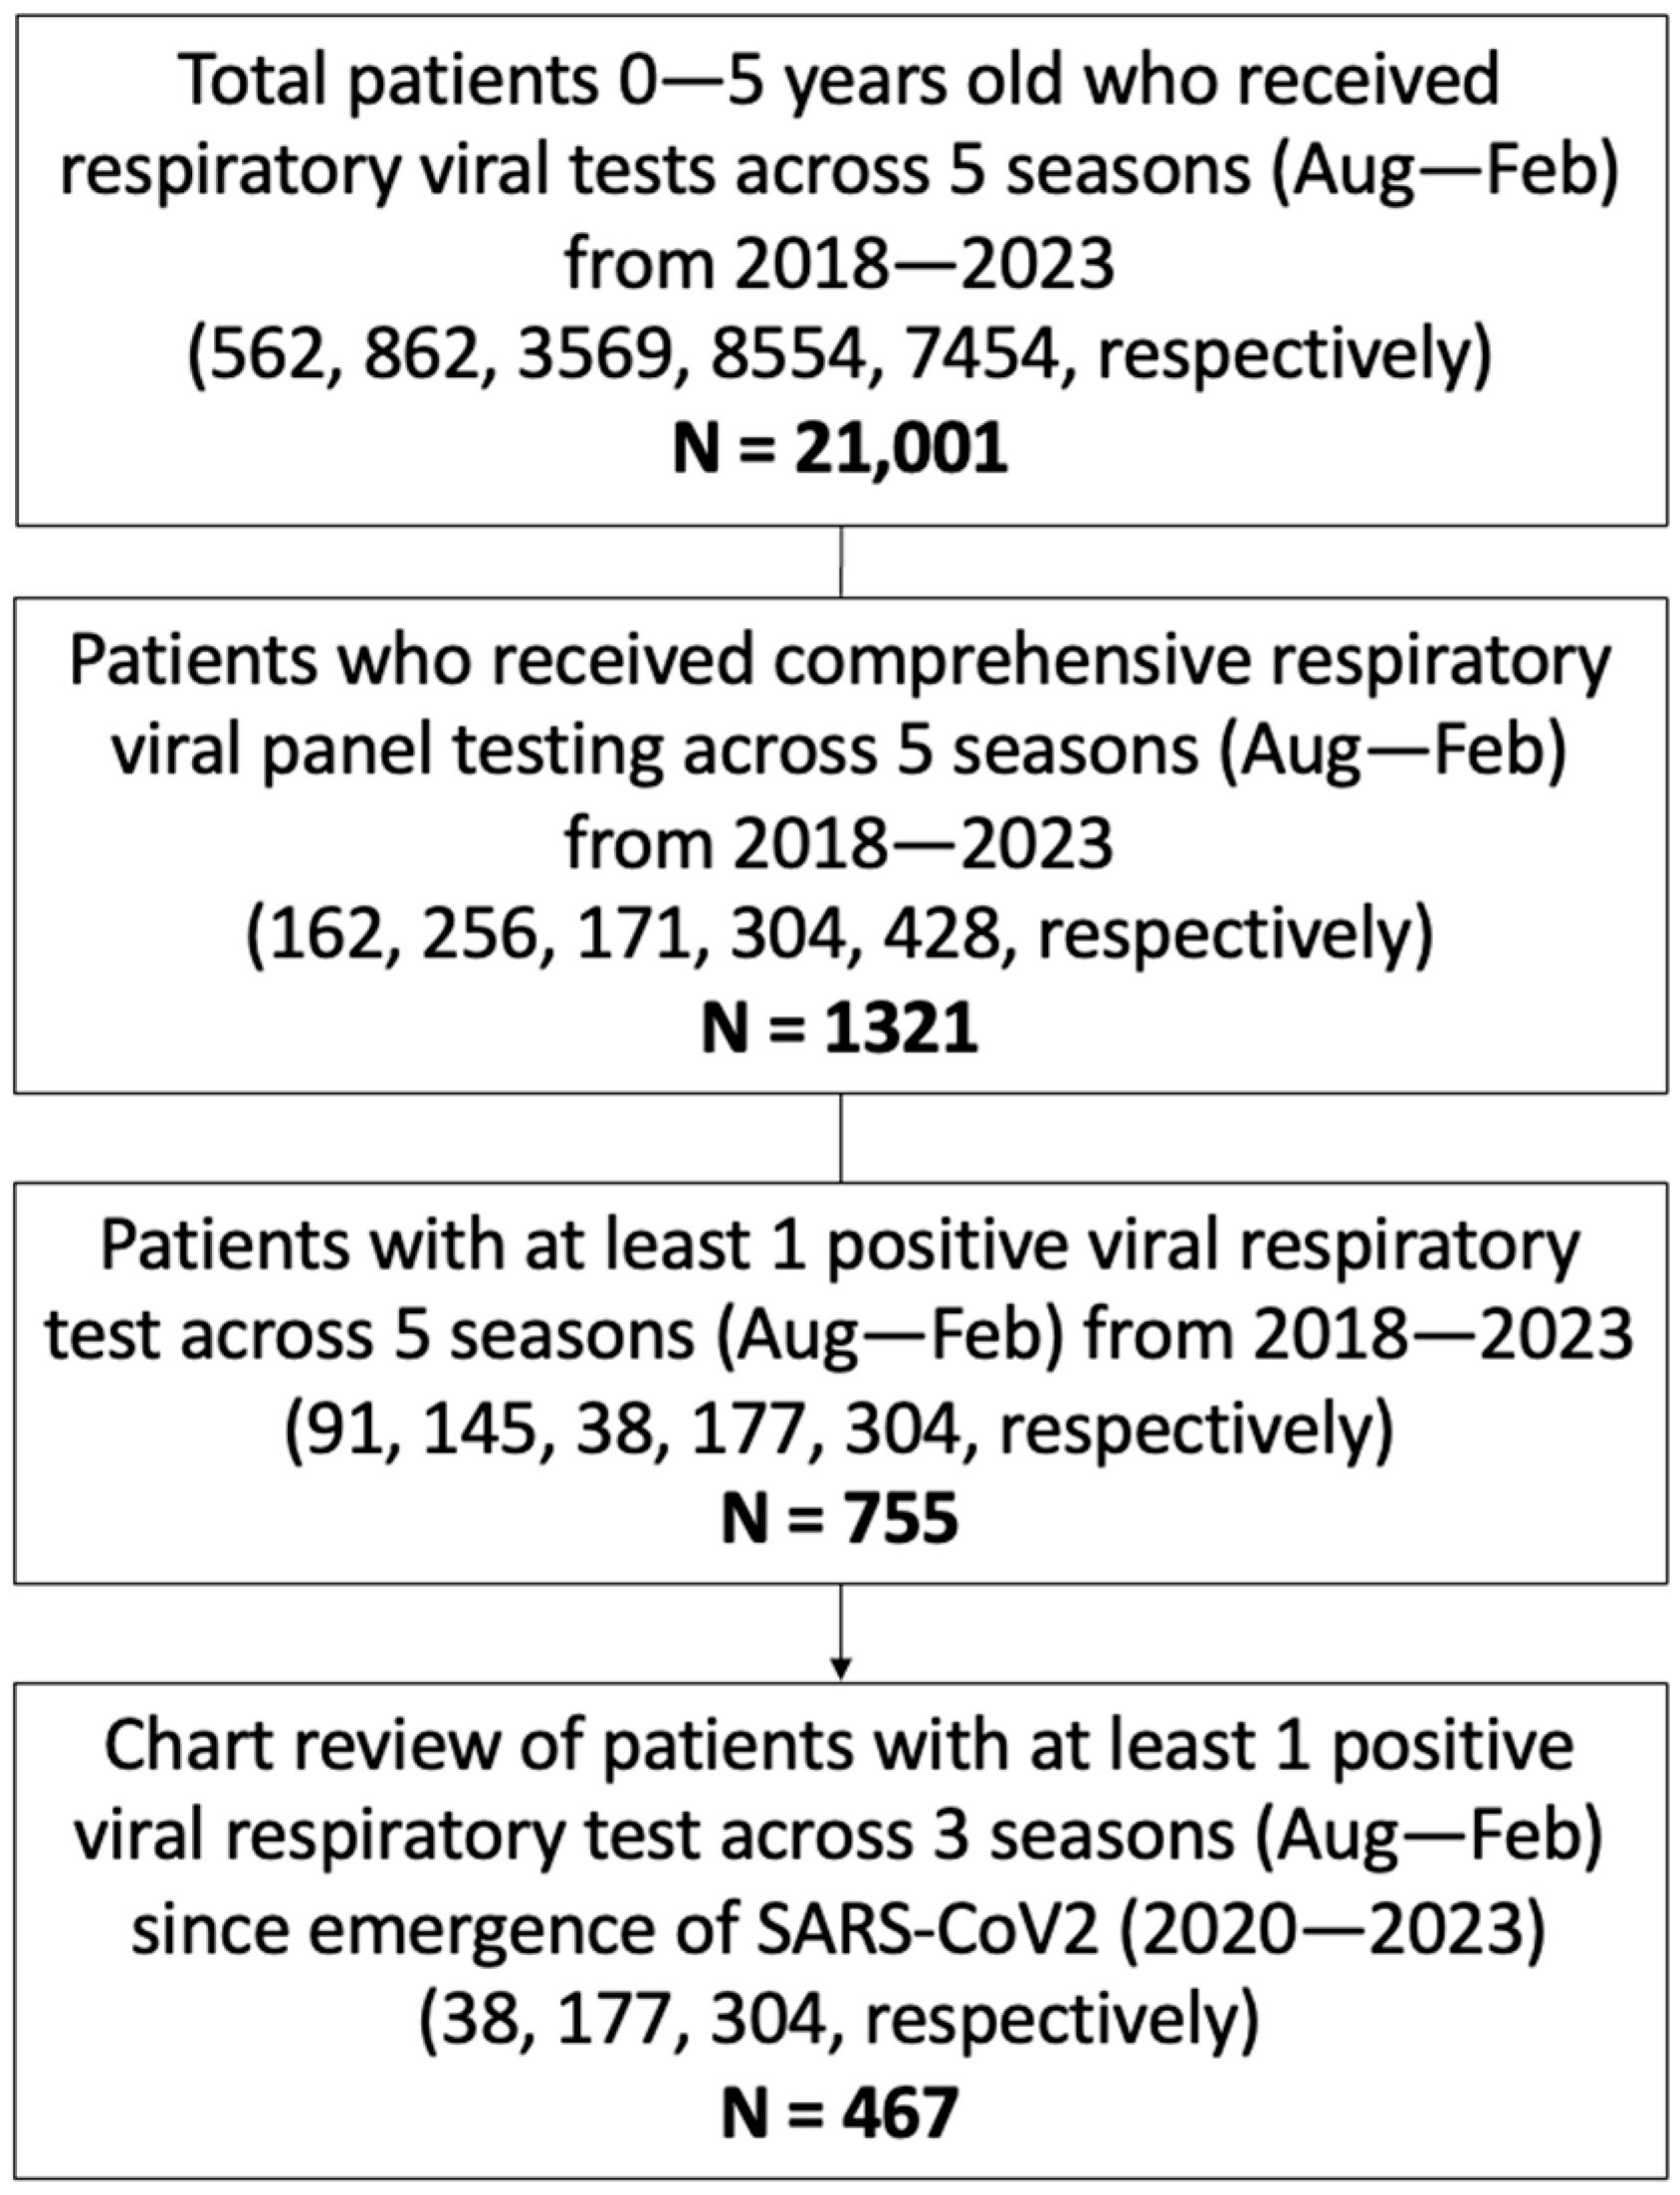
2. Methods
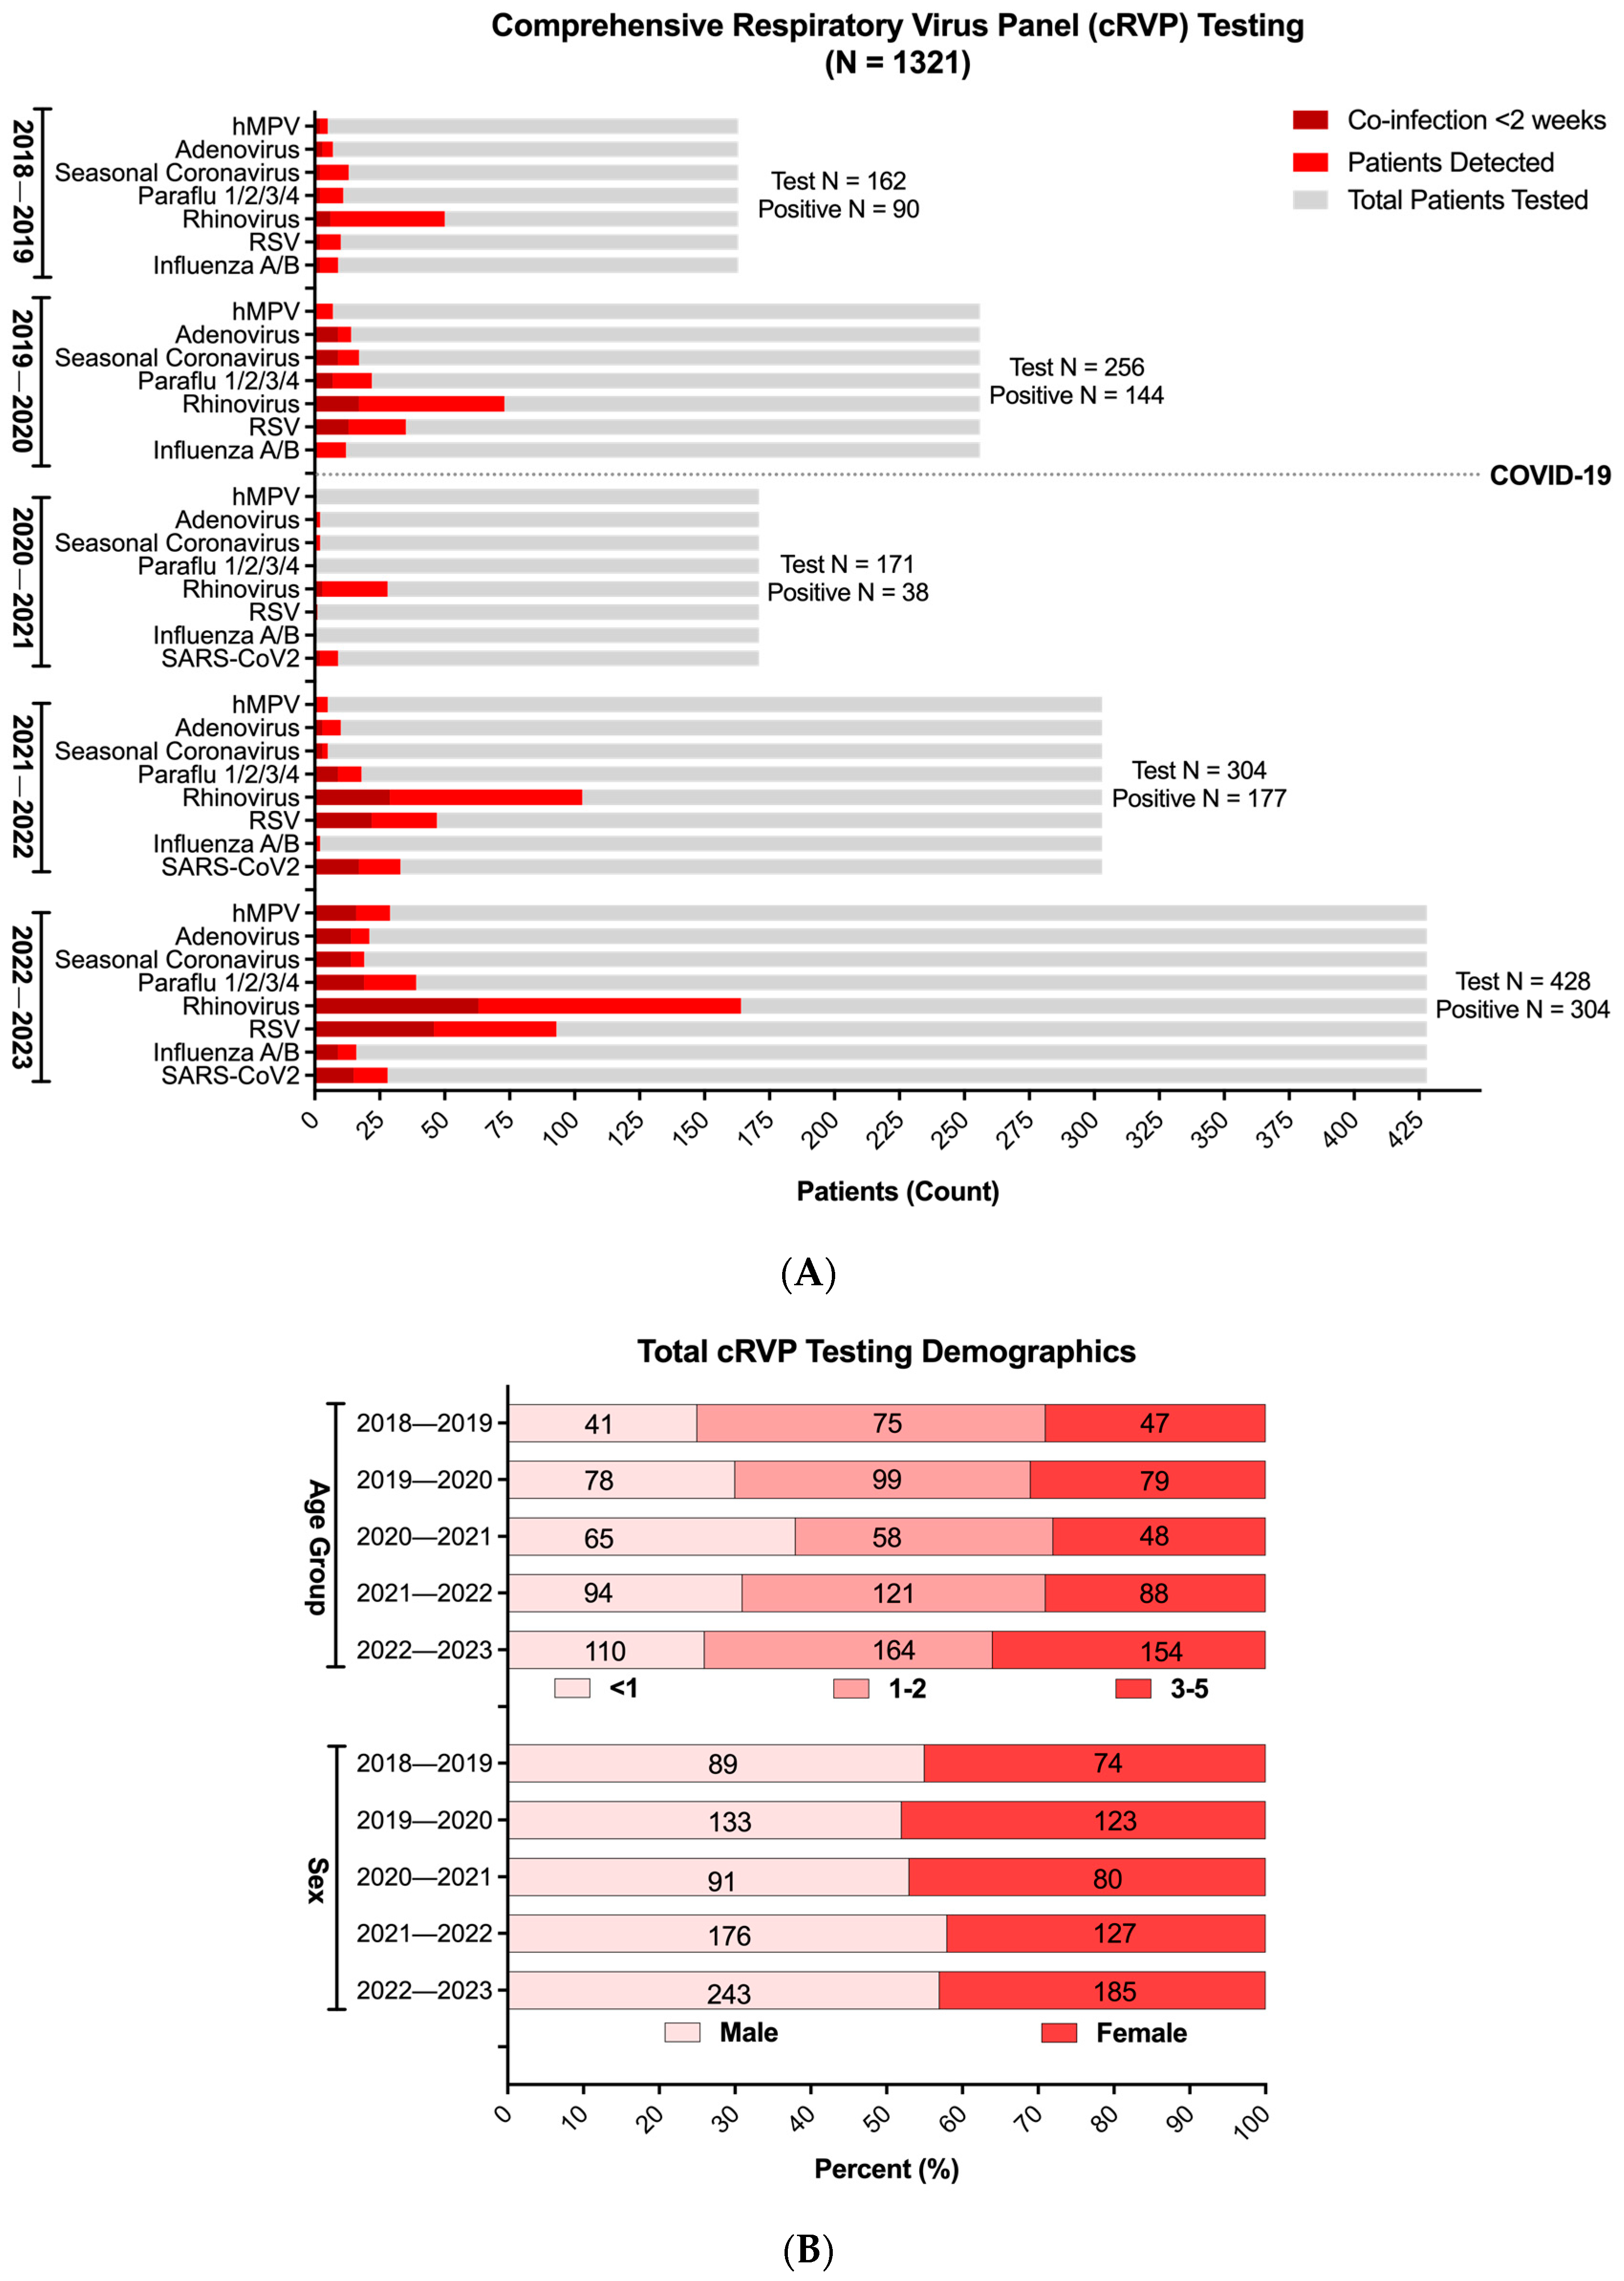
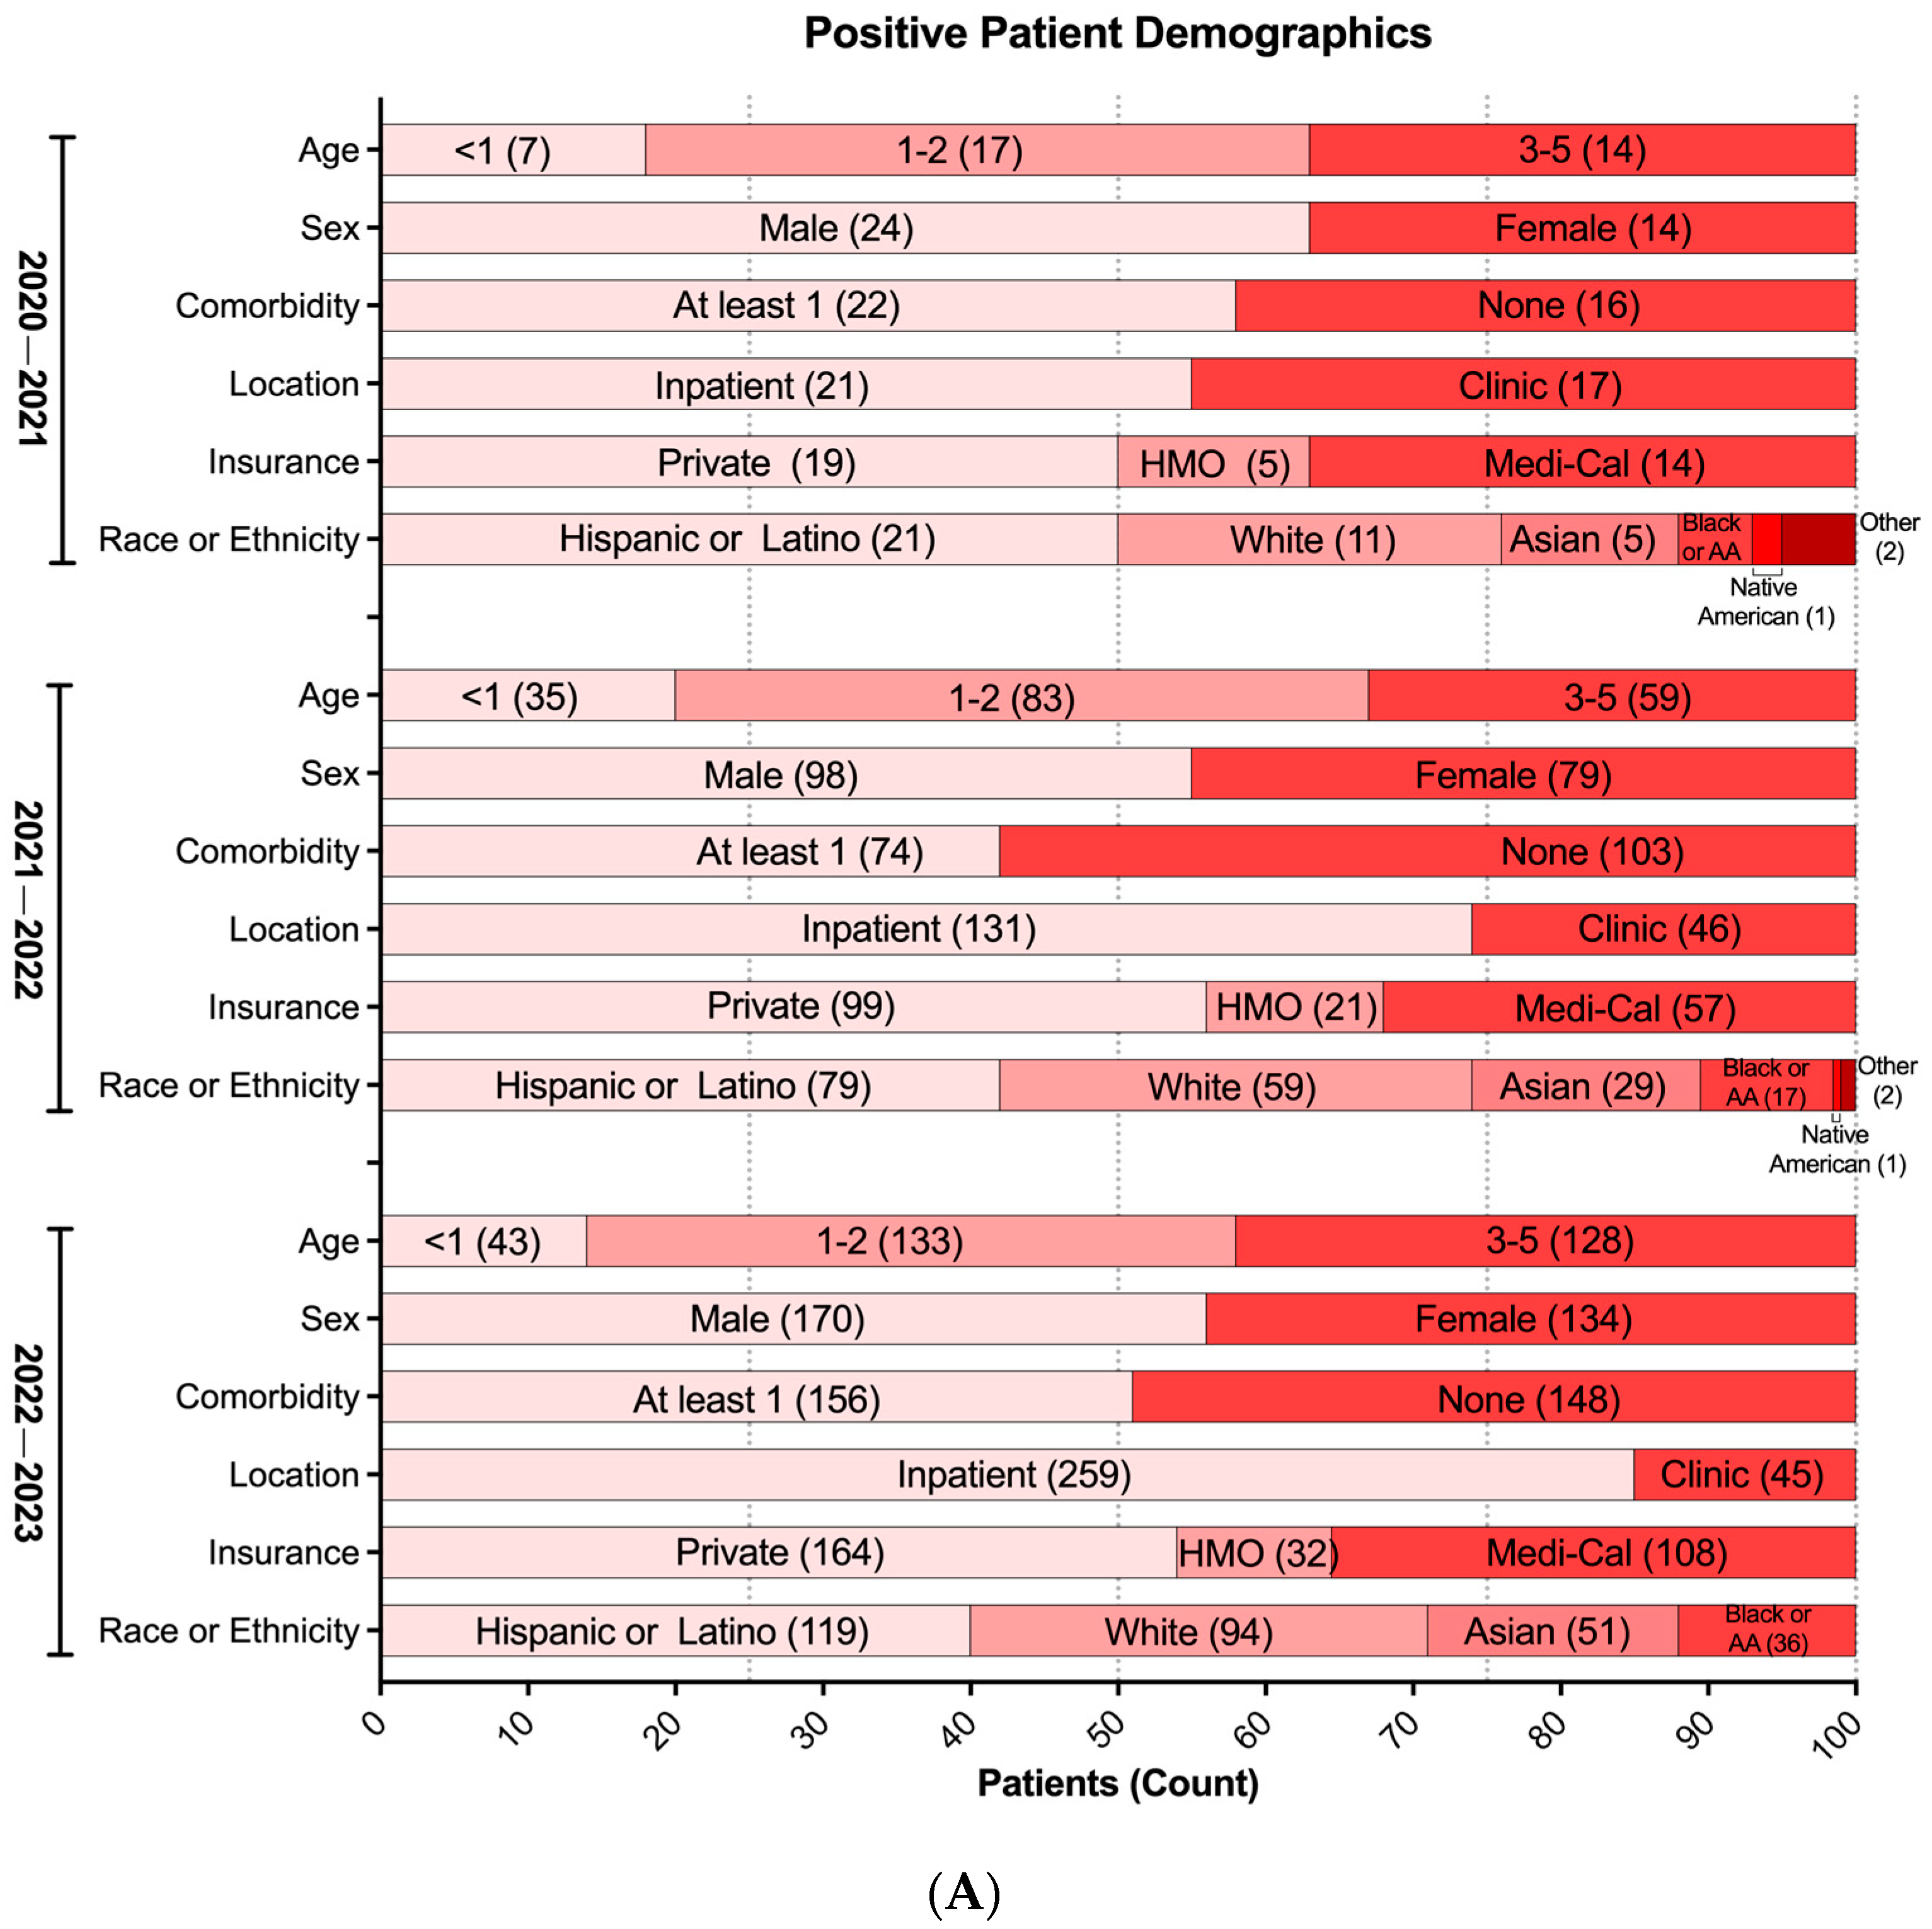
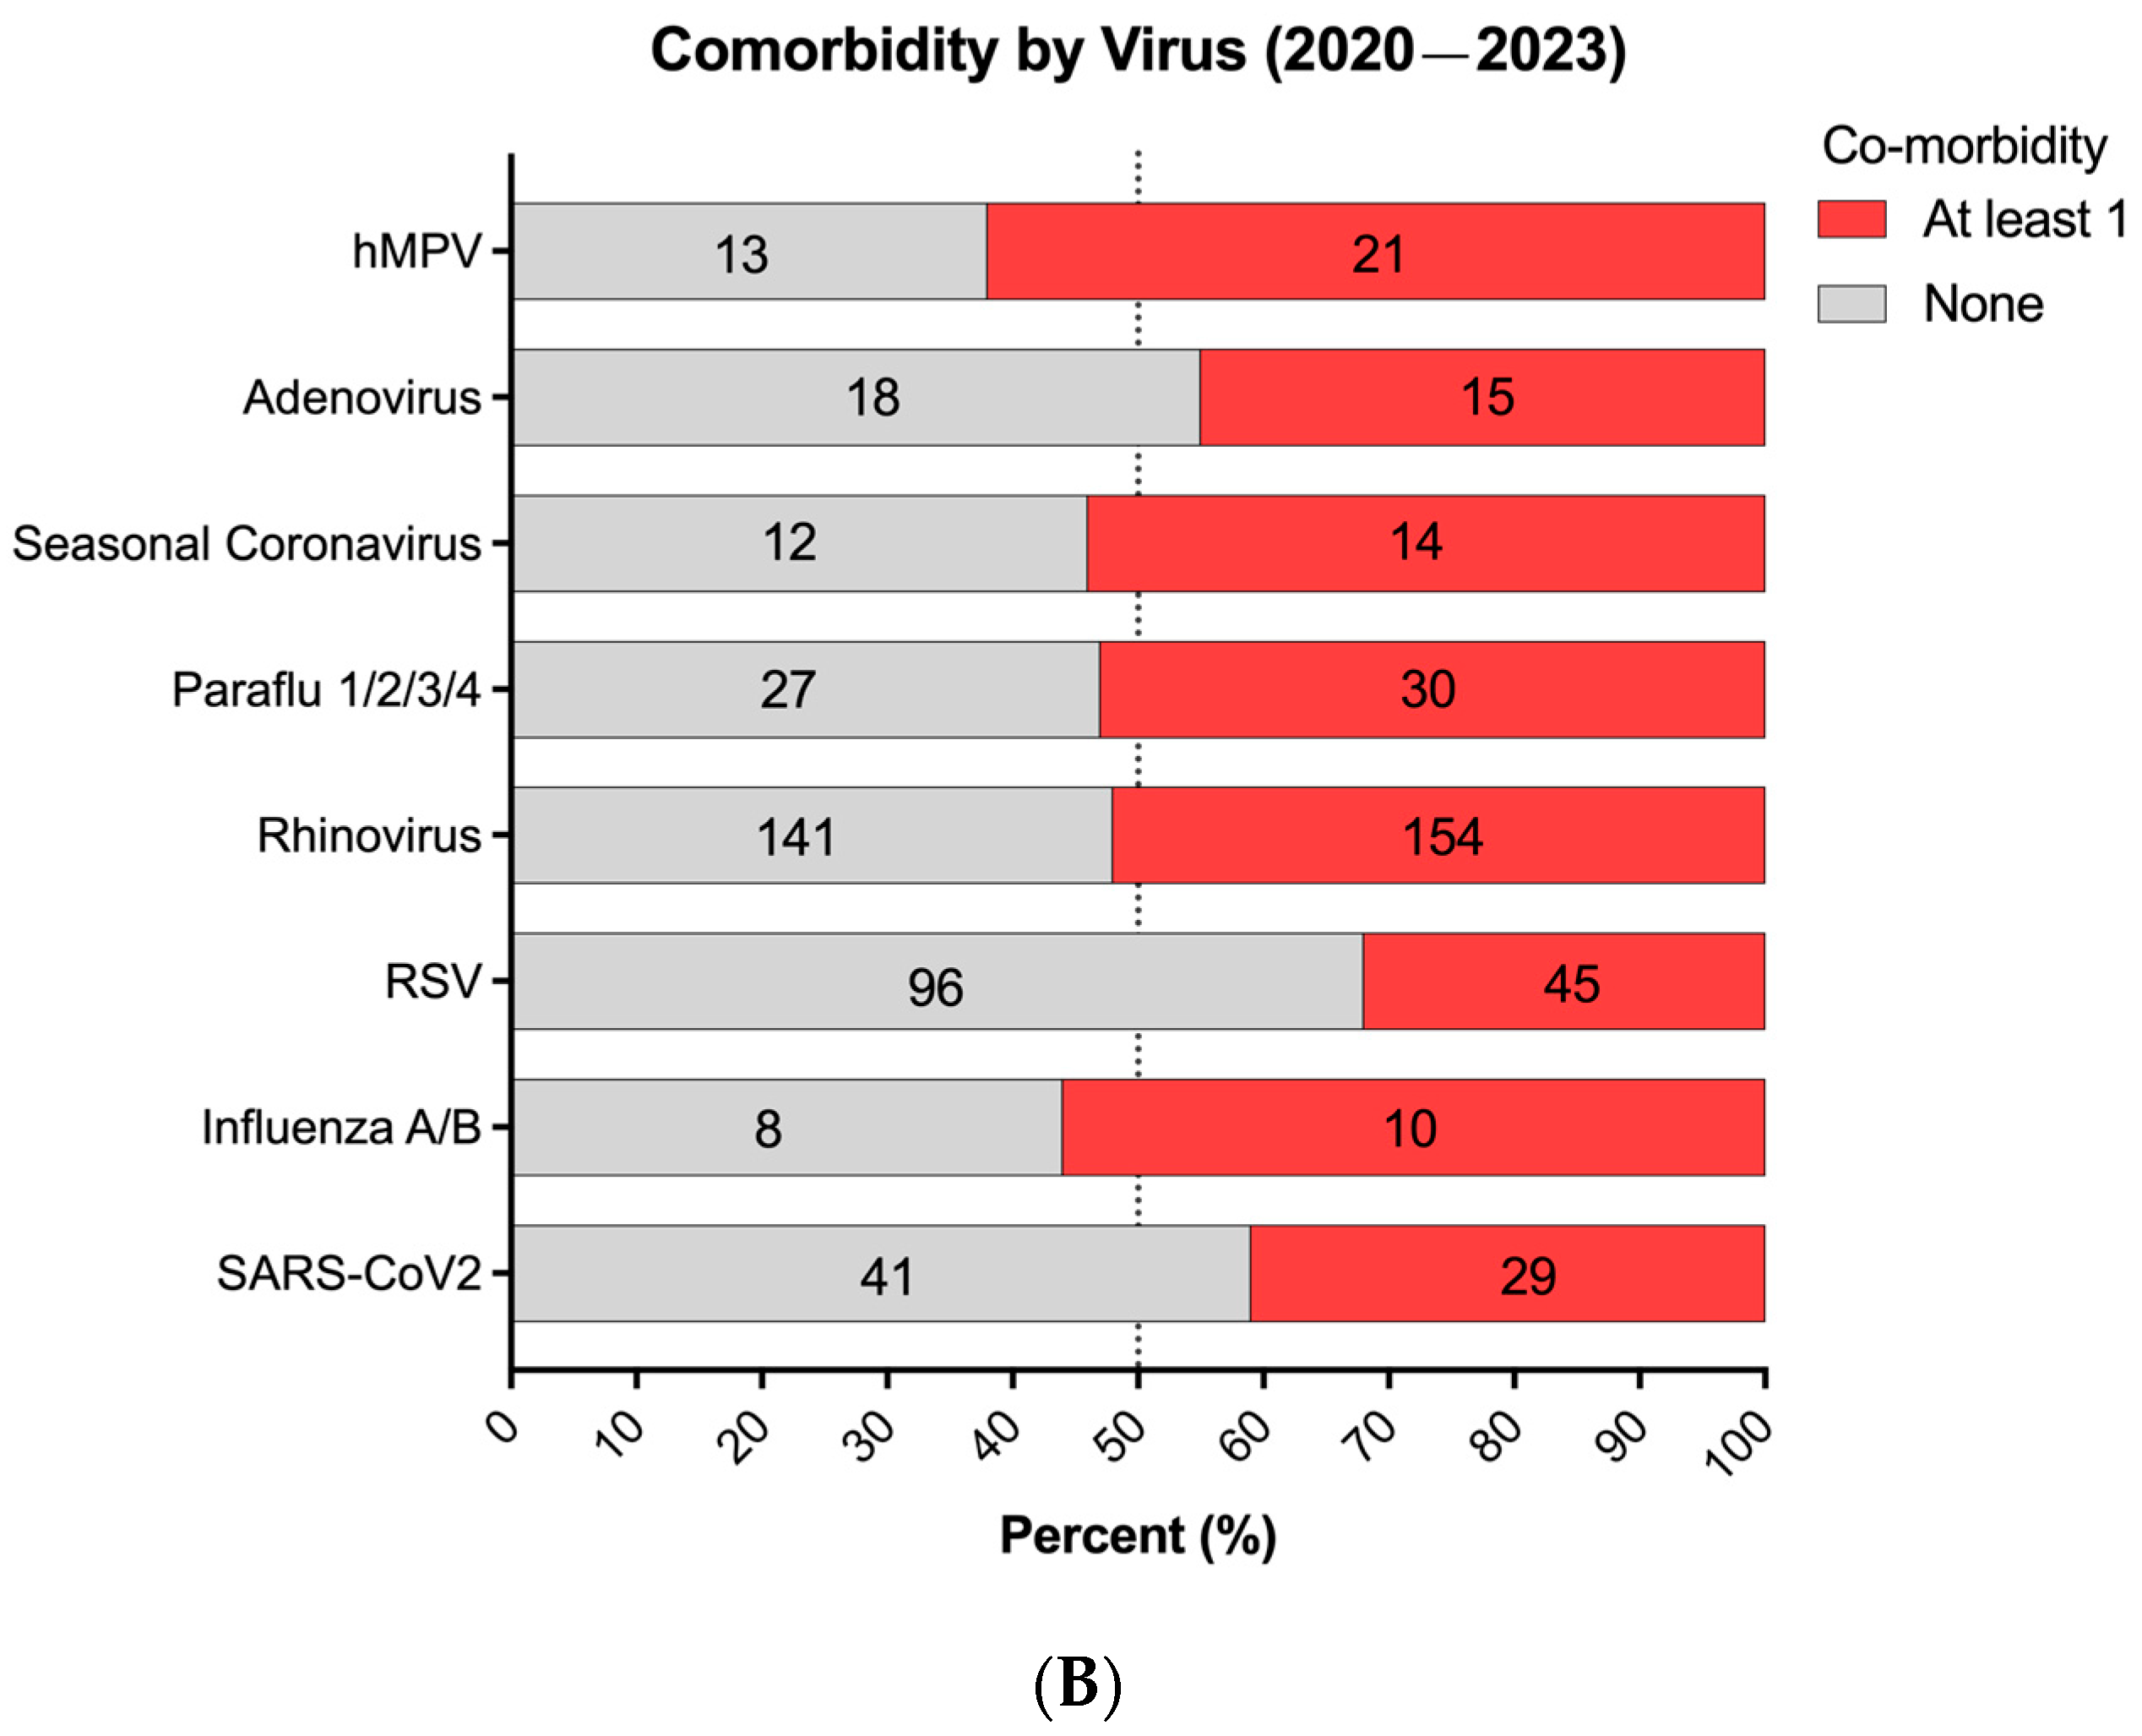
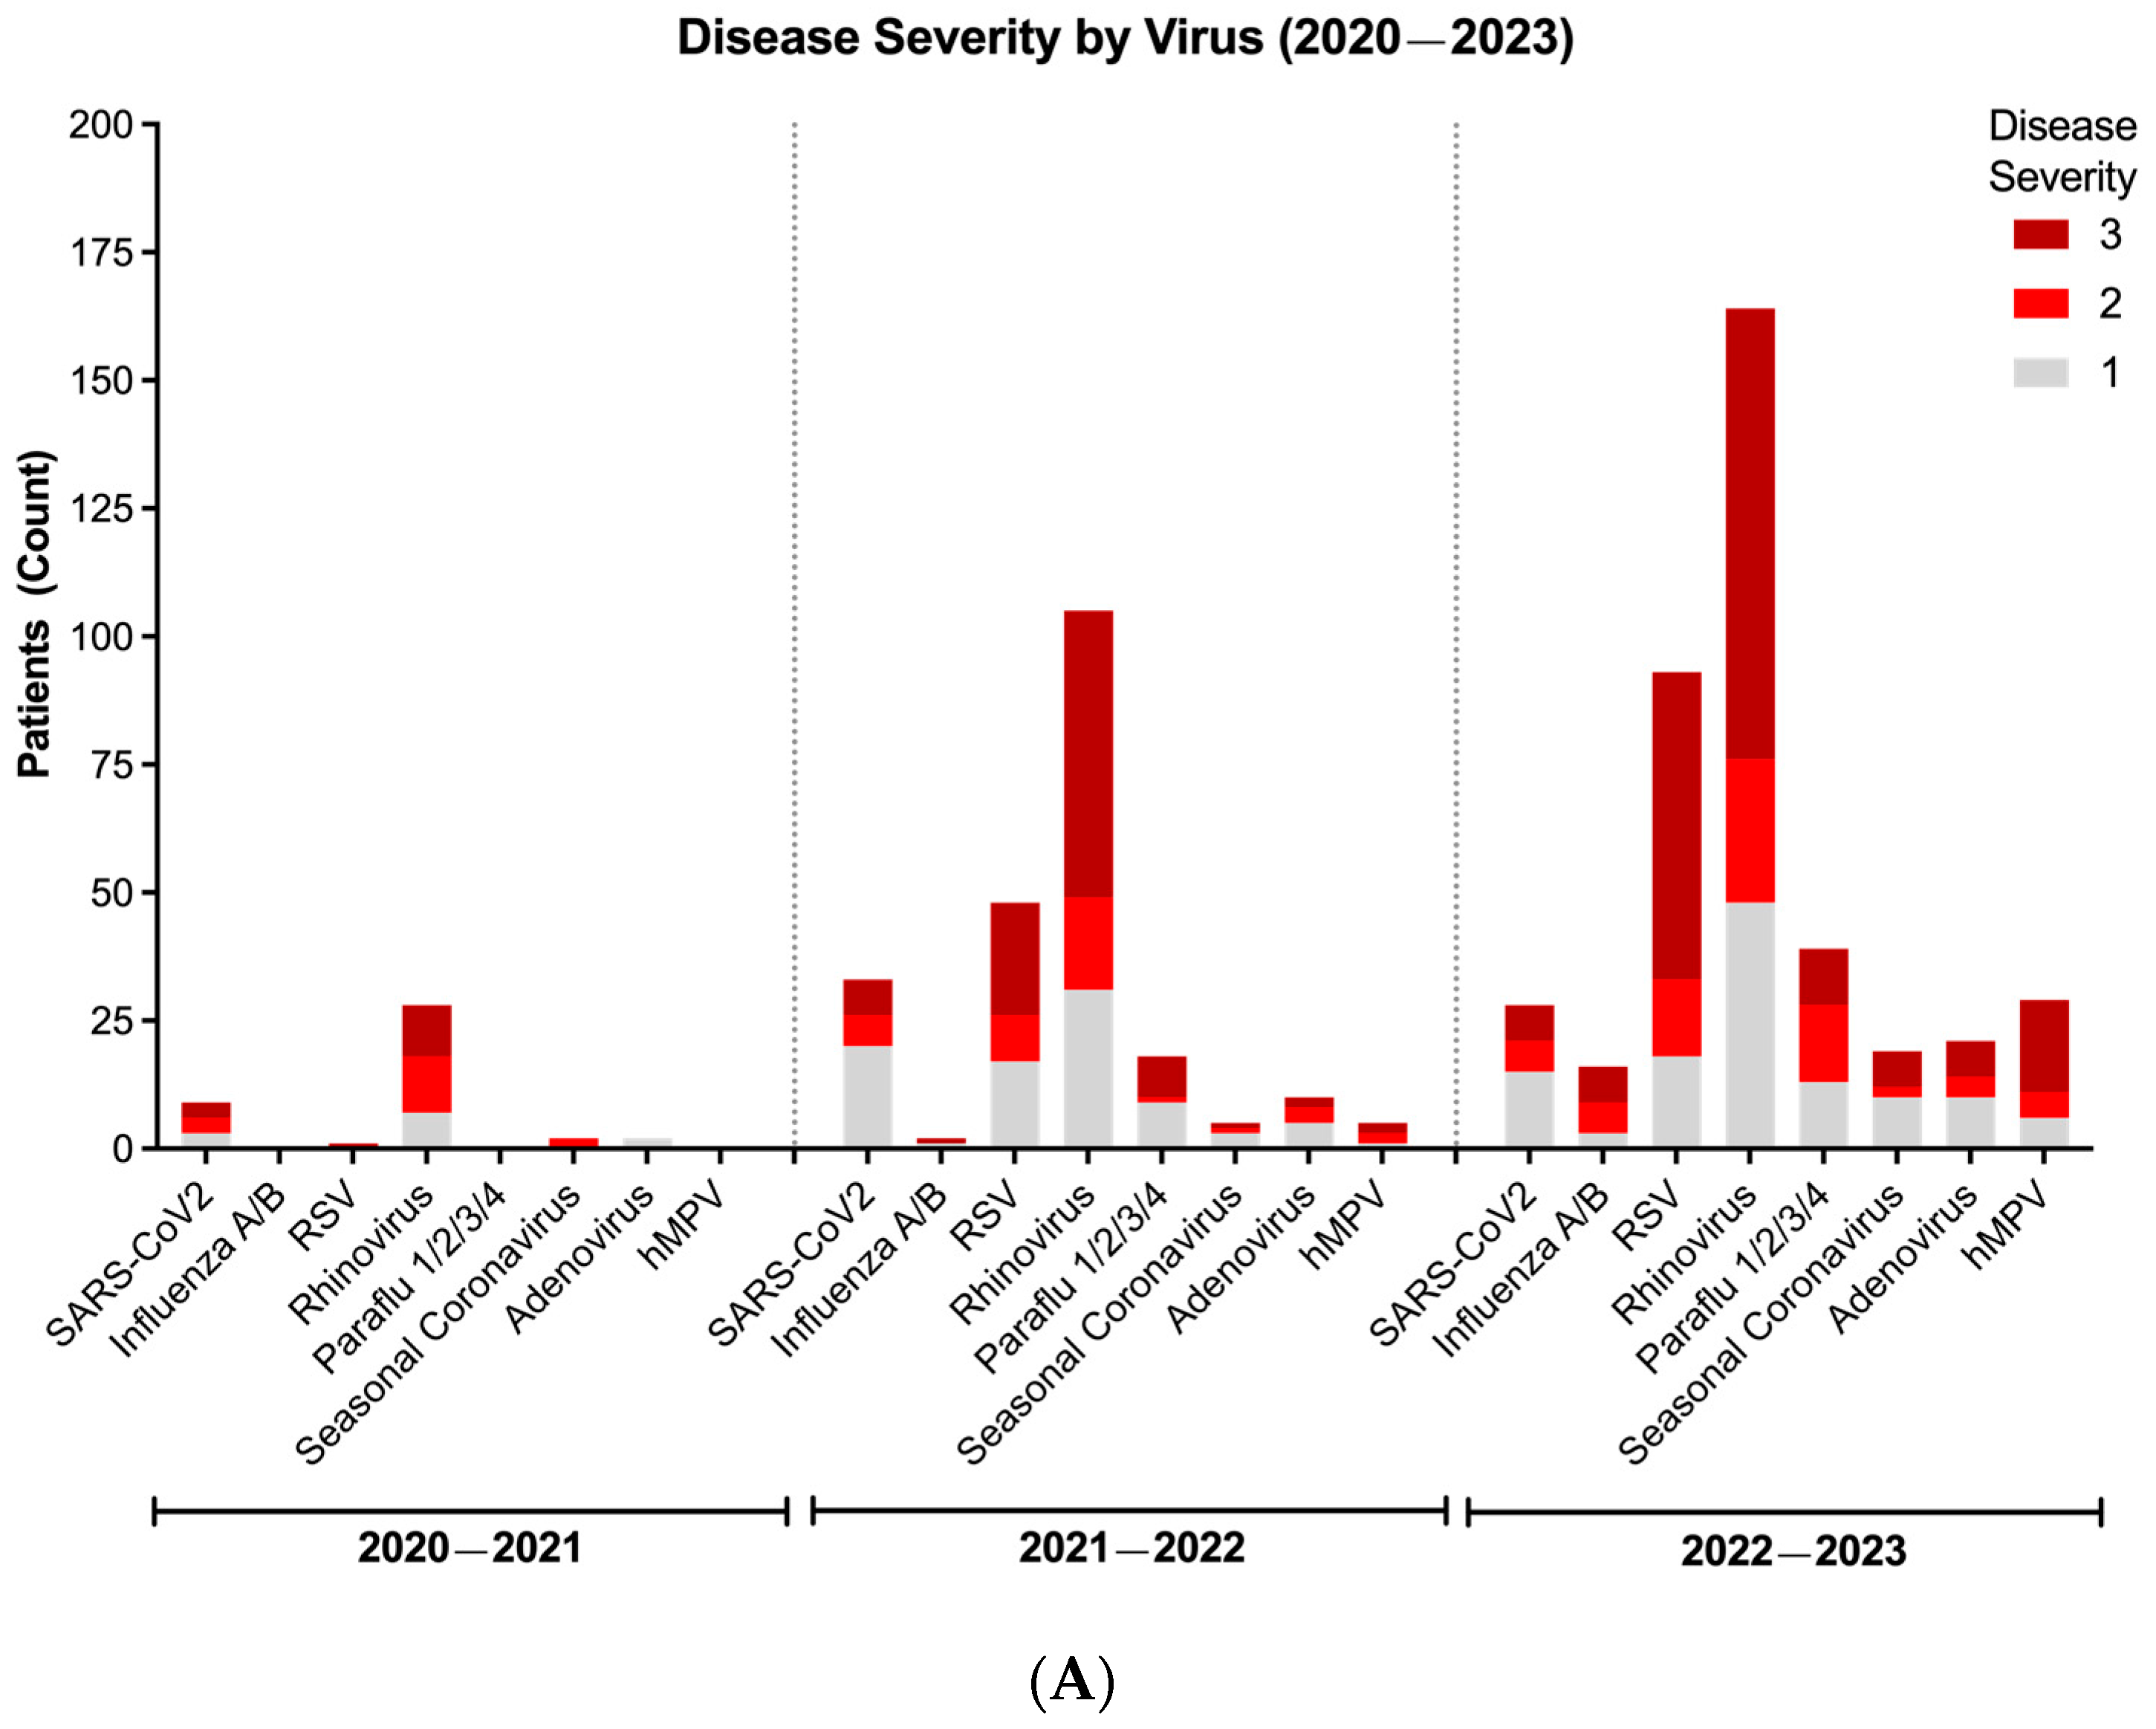
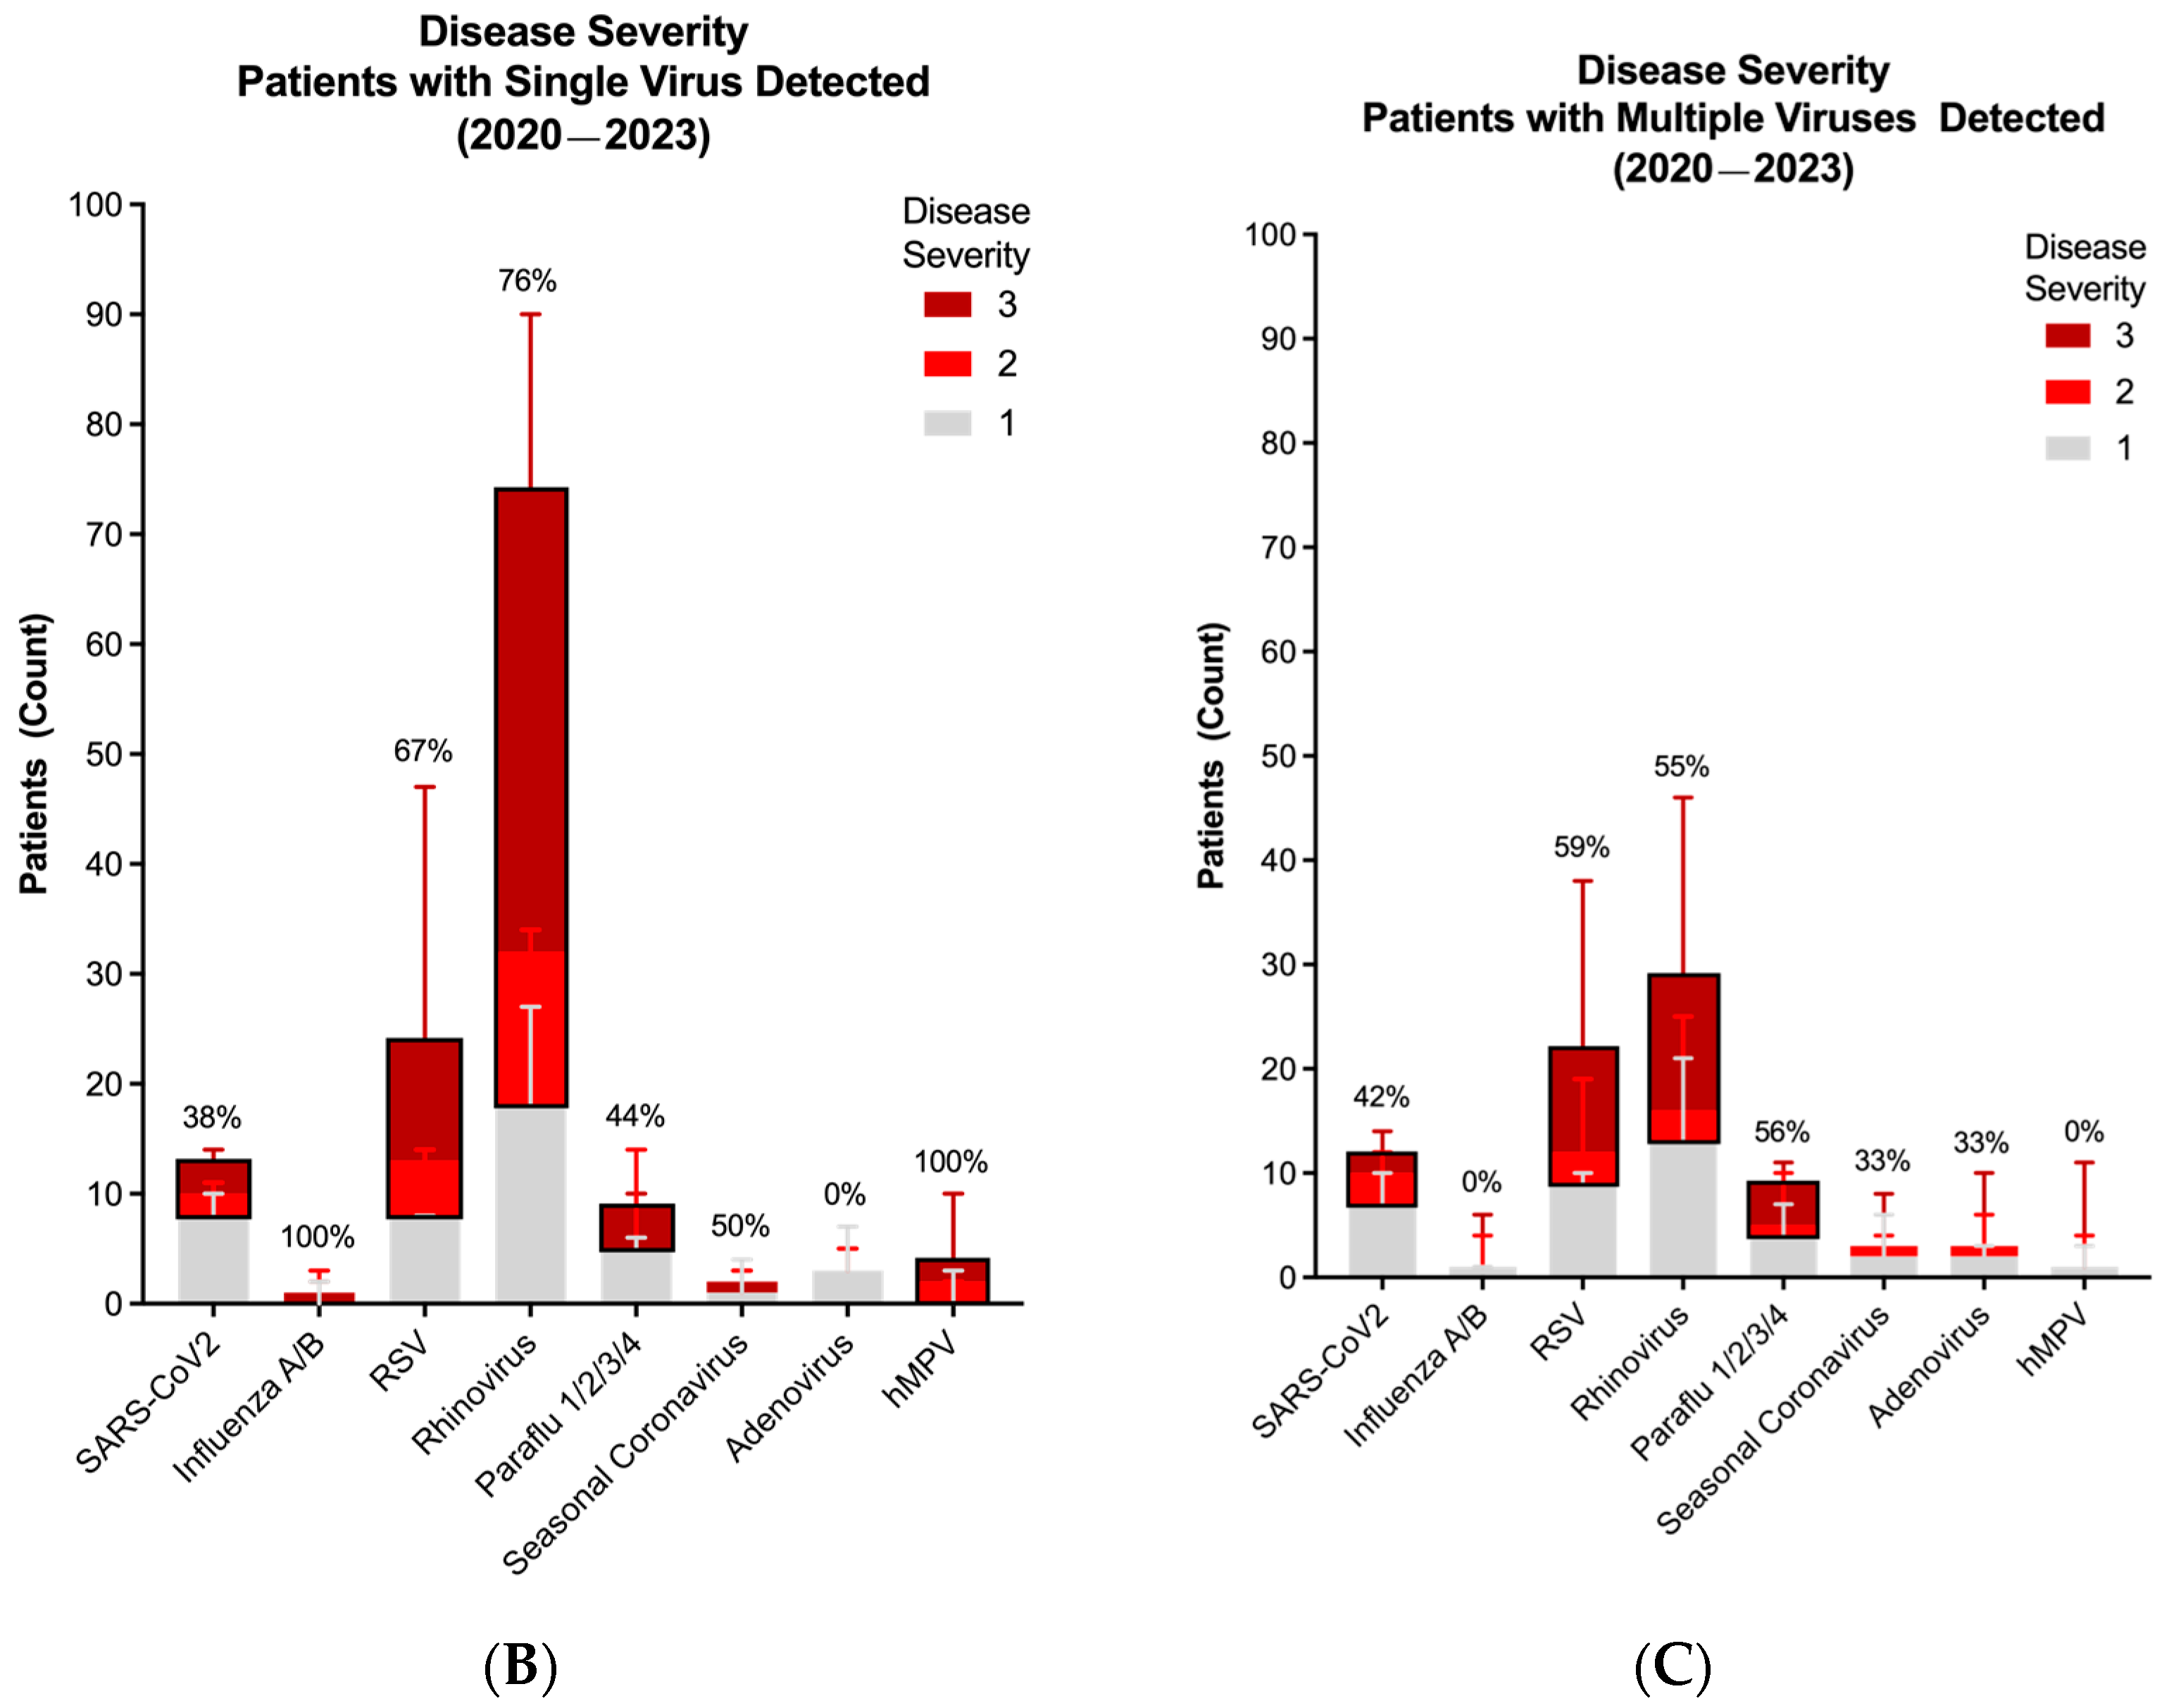
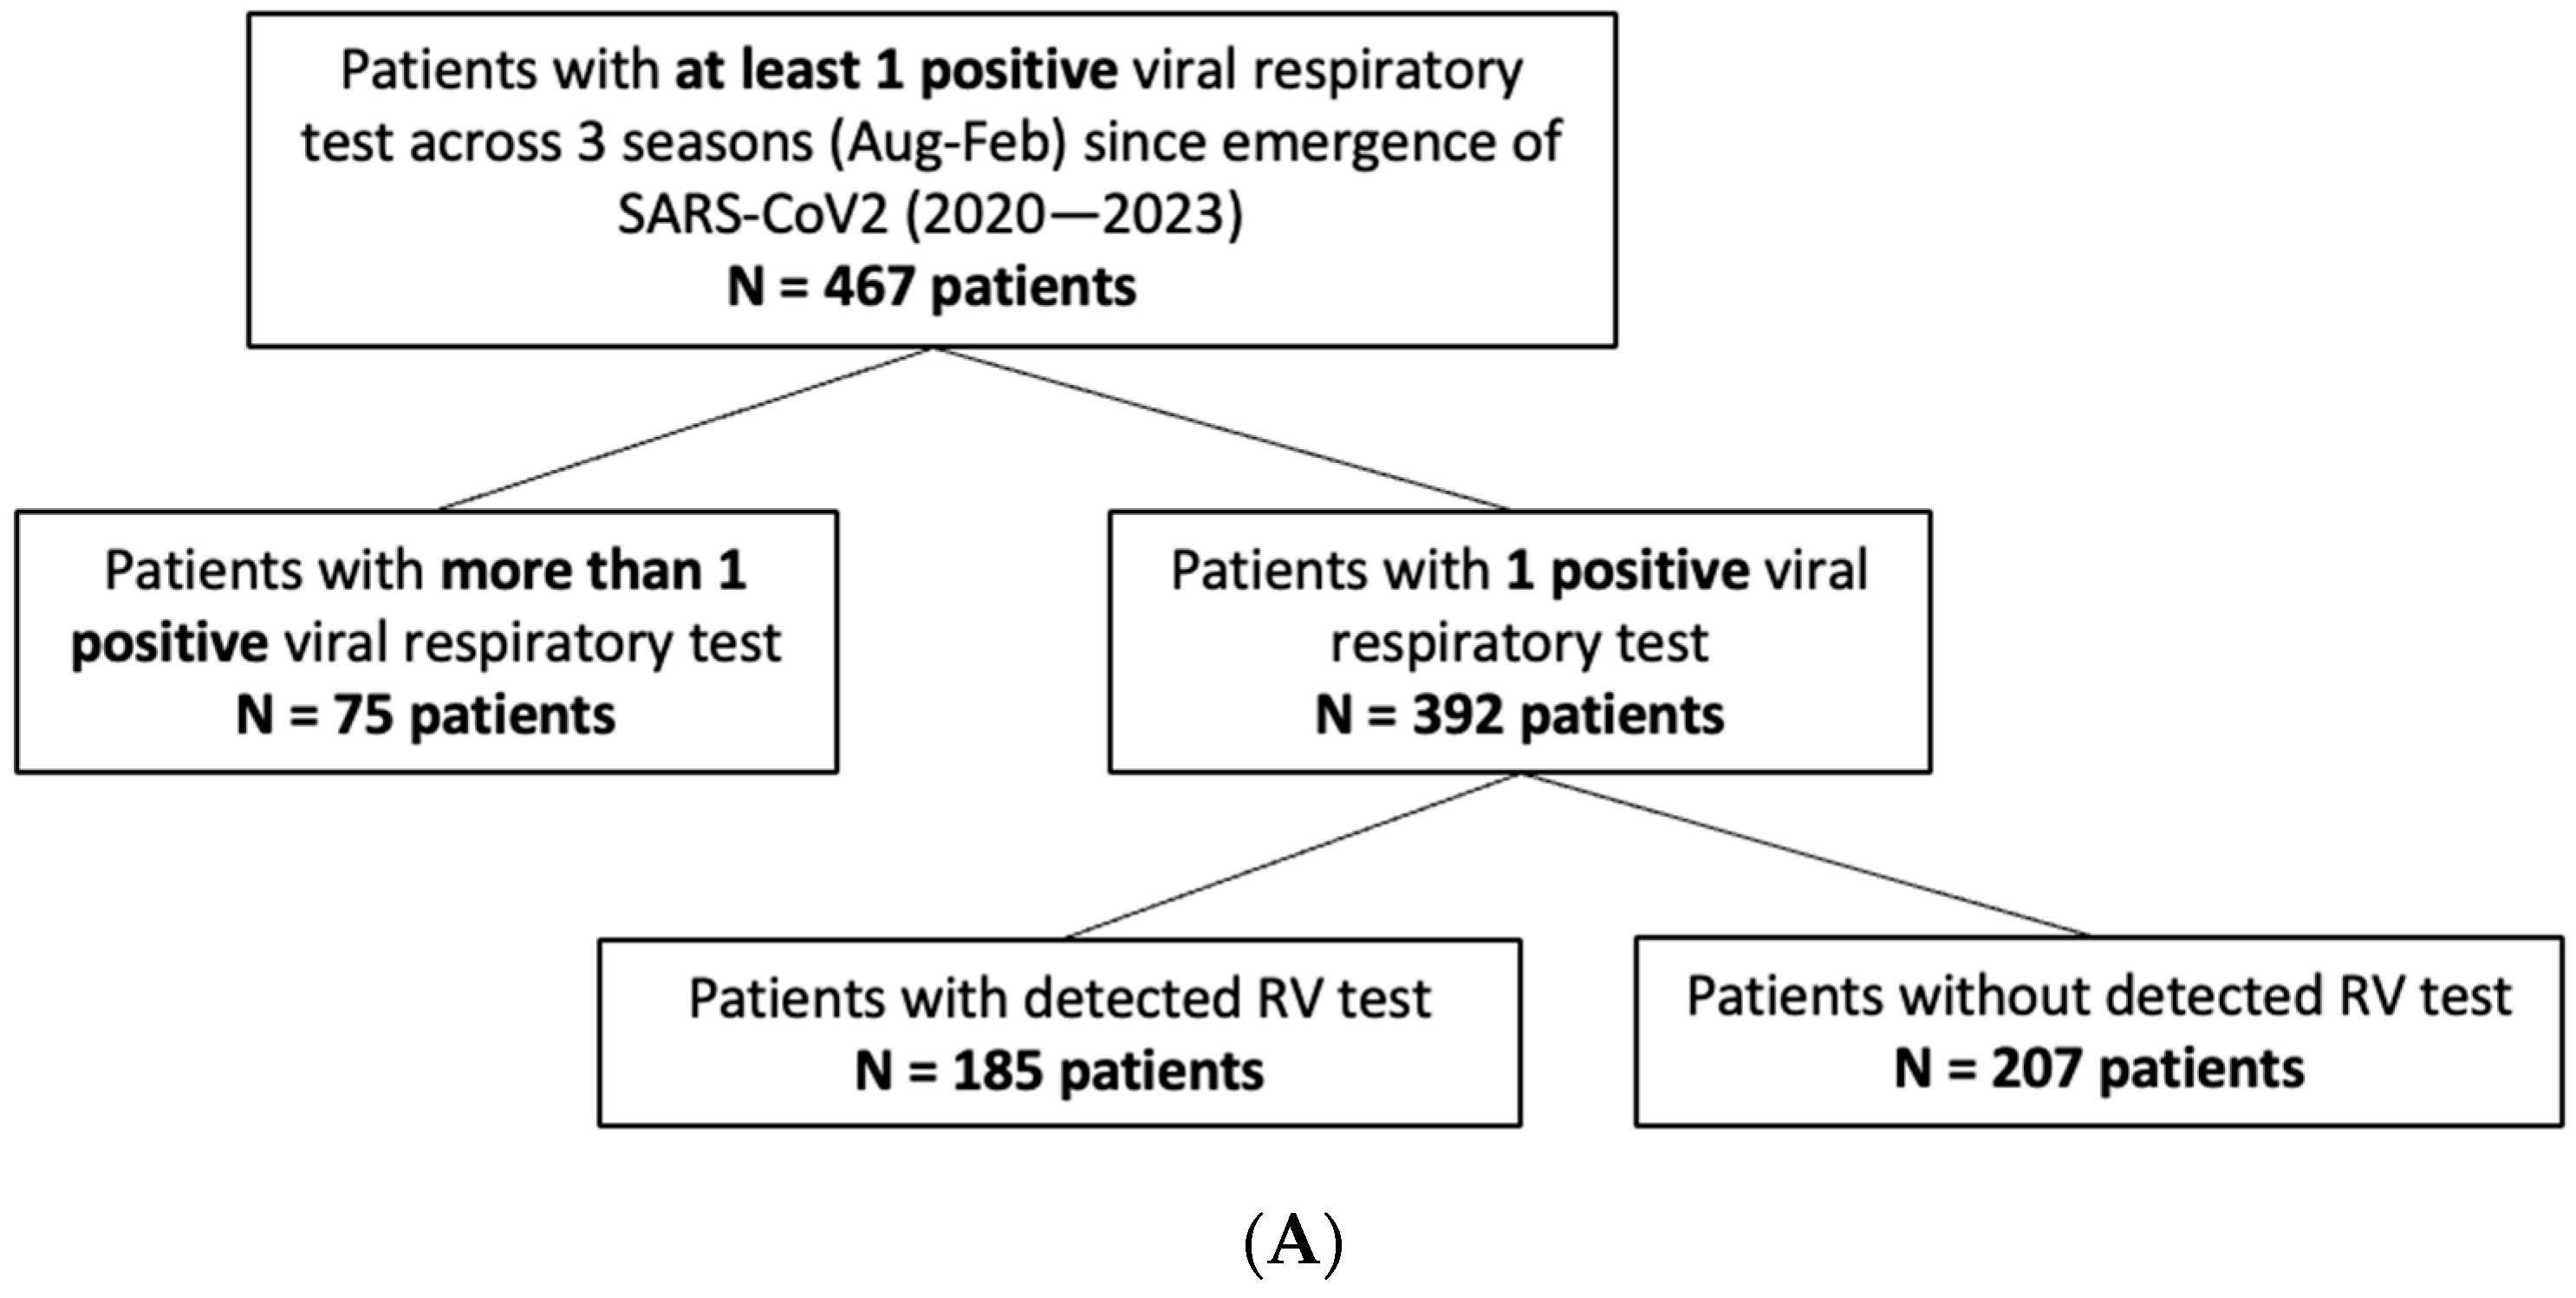
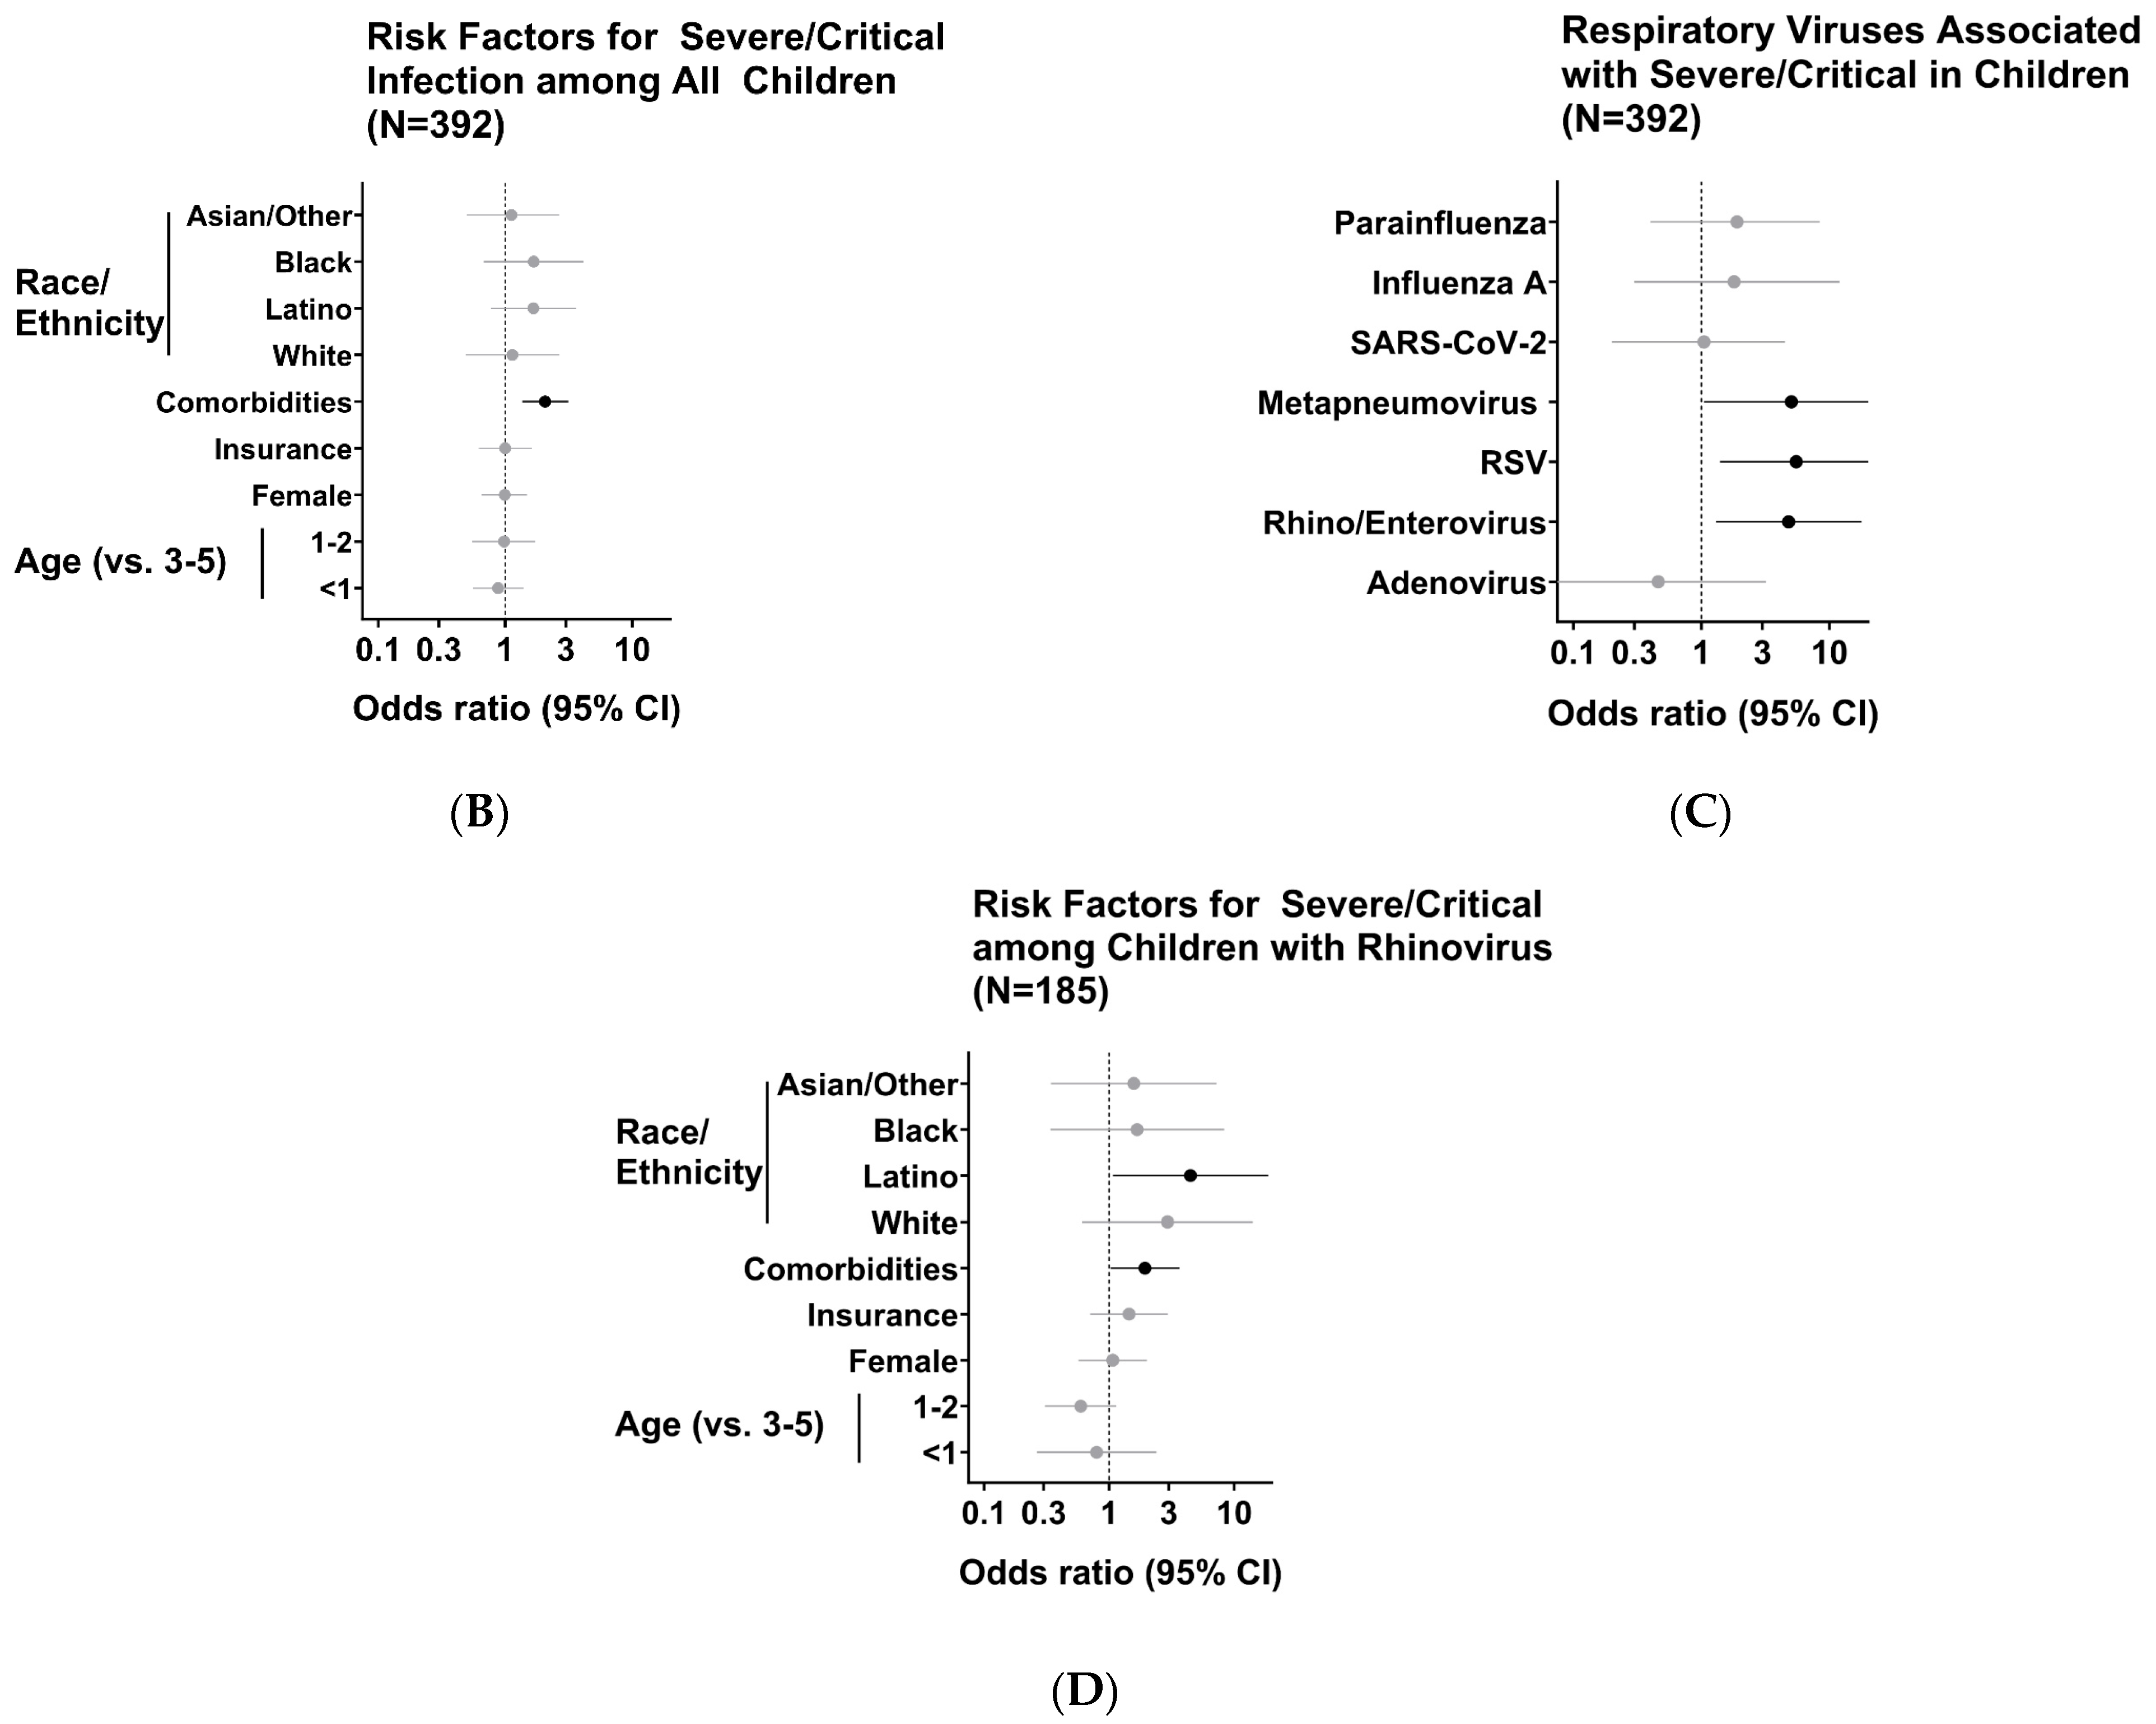
3. Results
4. Discussion
Supplementary Materials
Author Contributions
Funding
Institutional Review Board Statement
Informed Consent Statement
Data Availability Statement
Acknowledgments
Conflicts of Interest
References
- Weintraub, B. Upper Respiratory Tract Infections. Pediatr. Rev. 2015, 36, 554–556. [Google Scholar] [CrossRef] [PubMed]
- Teoh, Z.; Conrey, S.; McNeal, M.; Burrell, A.; Burke, R.M.; Mattison, C.; McMorrow, M.; Payne, D.C.; Morrow, A.L.; Staat, M.A. Burden of Respiratory Viruses in Children Less Than 2 Years Old in a Community-based Longitudinal US Birth Cohort. Clin. Infect. Dis. 2023, 77, 901–909. [Google Scholar] [CrossRef] [PubMed]
- Bolek, H.; Ozisik, L.; Caliskan, Z.; Tanriover, M.D. Clinical outcomes and economic burden of seasonal influenza and other respiratory virus infections in hospitalized adults. J. Med. Virol. 2023, 95, e28153. [Google Scholar] [CrossRef]
- US Centers for Disease Control and Prevention. RESP-NET Interactive Dashboard 2023 [Updated 10 June 2023]. Available online: https://www.cdc.gov/surveillance/resp-net/dashboard.html (accessed on 12 December 2023).
- Moriyama, M.; Hugentobler, W.J.; Iwasaki, A. Seasonality of Respiratory Viral Infections. Annu. Rev. Virol. 2020, 7, 83–101. [Google Scholar] [PubMed]
- Iannarella, R.; Lattanzi, C.; Cannata, G.; Argentiero, A.; Neglia, C.; Fainardi, V.; Pisi, G.; Esposito, S. Coronavirus infections in children: From SARS and MERS to COVID-19, a narrative review of epidemiological and clinical features. Acta Biomed. 2020, 91, e2020032. [Google Scholar]
- Agha, R.; Avner, J.R. Delayed Seasonal RSV Surge Observed During the COVID-19 Pandemic. Pediatrics 2021, 148, 2021052089. [Google Scholar]
- Casalegno, J.-S.; Ploin, D.; Cantais, A.; Masson, E.; Bard, E.; Valette, M.; Fanget, R.; Targe, S.C.; Myar-Dury, A.-F.; Doret-Dion, M.; et al. Characteristics of the delayed respiratory syncytial virus epidemic, 2020/2021, Rhône Loire, France. Eurosurveillance 2021, 26, 2100630. [Google Scholar] [CrossRef]
- van Summeren, J.; Meijer, A.; Aspelund, G.; Casalegno, J.S.; Erna, G.; Hoang, U.; Lina, B.; de Lusignan, S.; Teirlinck, A.C.; Thors, V.; et al. Low levels of respiratory syncytial virus activity in Europe during the 2020/21 season: What can we expect in the coming summer and autumn/winter? Eurosurveillance 2021, 26, 2100639. [Google Scholar]
- Foley, D.A.; Yeoh, D.K.; Minney-Smith, C.A.; Martin, A.C.; Mace, A.O.; Sikazwe, C.T.; Le, H.; Levy, A.; Moore, H.C.; Blyth, C.C. The Interseasonal Resurgence of Respiratory Syncytial Virus in Australian Children Following the Reduction of Coronavirus Disease 2019-Related Public Health Measures. Clin. Infect. Dis. 2021, 73, e2829–e2830. [Google Scholar] [CrossRef]
- Nott, R.; Fuller, T.L.; Brasil, P.; Nielsen-Saines, K. Out-of-Season Influenza during a COVID-19 Void in the State of Rio de Janeiro, Brazil: Temperature Matters. Vaccines 2022, 10, 821. [Google Scholar] [CrossRef]
- Amaddeo, A.; Cason, C.; Cozzi, G.; Ronfani, L.; Comar, M. Social distancing measures for COVID-19 are changing winter season. Arch. Dis. Child. 2021, 106, e47. [Google Scholar] [CrossRef] [PubMed]
- Kuitunen, I.; Artama, M.; Haapanen, M.; Renko, M. Rhinovirus spread in children during the COVID-19 pandemic despite social restrictions-A nationwide register study in Finland. J. Med. Virol. 2021, 93, 6063–6067. [Google Scholar]
- Marriott, D.; Beresford, R.; Mirdad, F.; Stark, D.; Glanville, A.; Chapman, S.; Harkness, J.; Dore, G.J.; Andresen, D.; Matthews, G.V. Concomitant Marked Decline in Prevalence of Severe Acute Respiratory Syndrome Coronavirus 2 (SARS-CoV-2) and Other Respiratory Viruses Among Symptomatic Patients Following Public Health Interventions in Australia: Data from St Vincent’s Hospital and Associated Screening Clinics, Sydney, NSW. Clin. Infect. Dis. 2021, 72, e649–e651. [Google Scholar]
- Park, S.; Michelow, I.C.; Choe, Y.J. Shifting Patterns of Respiratory Virus Activity Following Social Distancing Measures for Coronavirus Disease 2019 in South Korea. J. Infect. Dis. 2021, 224, 1900–1906. [Google Scholar]
- Poole, S.; Brendish, N.J.; Tanner, A.R.; Clark, T.W. Physical distancing in schools for SARS-CoV-2 and the resurgence of rhinovirus. Lancet Respir. Med. 2020, 8, e92–e93. [Google Scholar] [PubMed]
- Redlberger-Fritz, M.; Kundi, M.; Aberle, S.W.; Puchhammer-Stöckl, E. Significant impact of nationwide SARS-CoV-2 lockdown measures on the circulation of other respiratory virus infections in Austria. J. Clin. Virol. 2021, 137, 104795. [Google Scholar]
- Takashita, E.; Kawakami, C.; Momoki, T.; Saikusa, M.; Shimizu, K.; Ozawa, H.; Kumazaki, M.; Usuku, S.; Tanaka, N.; Okubo, I.; et al. Increased risk of rhinovirus infection in children during the coronavirus disease-19 pandemic. Influenza Other Respir. Viruses 2021, 15, 488–494. [Google Scholar] [CrossRef]
- Trenholme, A.; Webb, R.; Lawrence, S.; Arrol, S.; Taylor, S.; Ameratunga, S.; Byrnes, C.A. COVID-19 and Infant Hospitalizations for Seasonal Respiratory Virus Infections, New Zealand, 2020. Emerg. Infect. Dis. 2021, 27, 641–643. [Google Scholar] [PubMed]
- Oh, D.-Y.; Buda, S.; Biere, B.; Reiche, J.; Schlosser, F.; Duwe, S.; Wedde, M.; von Kleist, M.; Mielke, M.; Wolff, T.; et al. Trends in respiratory virus circulation following COVID-19-targeted nonpharmaceutical interventions in Germany, January–September 2020: Analysis of national surveillance data. Lancet Reg. Health Eur. 2021, 6, 100112. [Google Scholar] [CrossRef]
- Hodjat, P.; Christensen, P.A.; Subedi, S.; Bernard, D.W.; Olsen, R.J.; Long, S.W. The Reemergence of Seasonal Respiratory Viruses in Houston, Texas, after Relaxing COVID-19 Restrictions. Microbiol. Spectr. 2021, 9, e0043021. [Google Scholar] [CrossRef]
- Olsen, S.J.; Winn, A.K.; Budd, A.P.; Prill, M.M.; Steel, J.; Midgley, C.M.; Kniss, K.; Burns, E.; Rowe, T.; Foust, A.; et al. Changes in Influenza and Other Respiratory Virus Activity During the COVID-19 Pandemic—United States, 2020–2021. MMWR Morb. Mortal. Wkly. Rep. 2021, 70, 1013–1019. [Google Scholar] [CrossRef]
- Rodgers, L.; Sheppard, M.; Smith, A.; Dietz, S.; Jayanthi, P.; Yuan, Y.; Bull, L.; Wotiz, S.; Schwarze, T.; Azondekon, R.; et al. Changes in Seasonal Respiratory Illnesses in the United States During the Coronavirus Disease 2019 (COVID-19) Pandemic. Clin. Infect. Dis. 2021, 73 (Suppl. S1), S110–S117. [Google Scholar] [CrossRef] [PubMed]
- Haddadin, Z.; Schuster, J.E.; Spieker, A.J.; Rahman, H.; Blozinski, A.; Stewart, L.; Campbell, A.P.; Lively, J.Y.; Michaels, M.G.; Williams, J.V.; et al. Acute Respiratory Illnesses in Children in the SARS-CoV-2 Pandemic: Prospective Multicenter Study. Pediatrics 2021, 148, e2021051462. Available online: https://pubmed.ncbi.nlm.nih.gov/33986150/ (accessed on 13 May 2021). [CrossRef] [PubMed]
- Montgomery, D.C.; Peck, E.A.; Vining, G.G. Introduction to Linear Regression Analysis, 5th ed.; Wiley: Hoboken, NJ, USA, 2012.
- Respiratory Archive: Viral Respiratory Surveillance for LA County. Available online: http://www.publichealth.lacounty.gov/acd/resparchive/index.htm (accessed on 4 February 2025).
- Rankin, D.A.; Spieker, A.J.; Perez, A.; Stahl, A.L.; Rahman, H.K.; Stewart, L.S.; Schuster, J.E.; Lively, J.Y.; Haddadin, Z.; Probst, V.; et al. Circulation of Rhinoviruses and/or Enteroviruses in Pediatric Patients With Acute Respiratory Illness Before and During the COVID-19 Pandemic in the US. JAMA Netw. Open. 2023, 6, e2254909. [Google Scholar] [CrossRef]
- Quintero-Salgado, E.; Briseno-Ramírez, J.; Vega-Cornejo, G.; Damian-Negrete, R.; Rosales-Chavez, G.; De Arcos-Jiménez, J.C. Seasonal Shifts in Influenza, Respiratory Syncytial Virus, and Other Respiratory Viruses After the COVID-19 Pandemic: An Eight-Year Retrospective Study in Jalisco, Mexico. Viruses 2024, 16, 1892. [Google Scholar] [CrossRef] [PubMed]
- Signe, V.; Mohammad, A.; Kofoed, P.E. The Impact of Viral Co-Infection in Children Treated with Respiratory Support Due to Lower Respiratory Tract Infections. An Observational Study. Ped. Pulm. 2025, 60, e27467. [Google Scholar]
- Linder, J.E.; Kraft, D.C.; Mohamed, Y.; Lu, Z.; Heil, L.; Tollefson, S.; Saville, B.R.; Wright, P.F.; Williams, J.V.; Miller, E.K. Human rhinovirus C: Age, season, and lower respiratory illness over the past 3 decades. J. Allergy Clin. Immunol. 2013, 131, 69–77. [Google Scholar] [CrossRef]
- Hamid, S.; Winn, A.; Parikh, R.; Jones, J.M.; McMorrow, M.; Prill, M.M.; Silk, B.J.; Scobie, H.M.; Hall, A.J. Seasonality of Respiratory Syncytial Virus—United States, 2017–2023. MMWR Morb. Mortal. Wkly. Rep. 2023, 72, 355–361. [Google Scholar] [CrossRef]
- Jones, E.A.K.; Mitra, A.K.; Malone, S. Racial Disparities and Common Respiratory Infectious Diseases in Children of the United States: A Systematic Review and Meta-Analysis. Diseases 2023, 11, 23. [Google Scholar] [CrossRef]
- Dallmeyer, L.K.; Schüz, M.L.; Fragkou, P.C.; Omony, J.; Krumbein, H.; Dimopoulou, D.; Dimopoulou, K.; Skevaki, C. Epidemiology of respiratory viruses among children during the SARS-CoV-2 pandemic: A systematic review and meta-analysis. Int. J. Infect. Dis. 2023, 138, 10–18. [Google Scholar] [CrossRef]
- Ljubin-Sternak, S.; Meštrović, T. Rhinovirus-A True Respiratory Threat or a Common Inconvenience of Childhood? Viruses 2023, 15, 825. [Google Scholar] [CrossRef] [PubMed]
- Stott, E.J.; Heath, G.F. Factors affecting the growth of Rhinovirus 2 in suspension cultures of L132 cells. J. Gen. Virol. 1970, 6, 15–24. [Google Scholar] [PubMed]
- Ljubin-Sternak, S.; Meštrović, T.; Ivković-Jureković, I.; Kolarić, B.; Slović, A.; Forčić, D.; Tot, T.; Mijač, M.; Vraneš, J. The Emerging Role of Rhinoviruses in Lower Respiratory Tract Infections in Children—Clinical and Molecular Epidemiological Study From Croatia, 2017–2019. Front. Microbiol. 2019, 10, 2737. [Google Scholar]
- Papadopoulos, N.G.; Sanderson, G.; Hunter, J.; Johnston, S.L. Rhinoviruses replicate effectively at lower airway temperatures. J. Med. Virol. 1999, 58, 100–104. [Google Scholar]

| Variable | Odds Ratio (95% CI) |
|---|---|
| Race/ethnicity | |
| Asian or other | 1.12 (0.5–2.66) |
| Black or African American | 1.68 (0.68–4.12) |
| Hispanic or Latino | 1.67 (0.77–3.64) |
| White | 1.14 (0.49–2.68) |
| Comorbidities | 2.06 (1.36–3.14) |
| Insurance | 1 (0.62–1.62) |
| Female | 0.99 (0.65–1.49) |
| Age (years) * | |
| 1–2 | 0.98 (0.55–1.73) |
| <1 | 0.88 (0.56–1.39) |
| Virus | Odds Ratio (95% CI) |
|---|---|
| Adenovirus | 0.46 (0.07–3.2) |
| Rhinovirus | 4.8 (1.3–17.8) |
| Respiratory Syncytial Virus | 5.5 (1.4–21.5) |
| Metapneumovirus | 5.04 (1.05–24.1) |
| SARS-CoV-2 virus | 1.05 (0.2–4.5) |
| Influenza A virus | 1.8 (0.3–12) |
| Parainfluenza virus | 1.9 (0.4–8.4) |
| Variable | Odds Ratio (95% CI) |
|---|---|
| Race/ethnicity | |
| Asian or other | 1.58 (0.34–7.270 |
| Black or African American | 1.67 (0.34–8.3) |
| Hispanic or Latino | 4.48 (1.07–18.71) |
| White | 2.93 (0.61–14.13) |
| Comorbidities | 1.94 (1.03–3.65) |
| Insurance | 1.44 (0.71–2.96) |
| Female | 1.07 (0.57–2.01) |
| Age (years) * | |
| 1–2 | 0.6 (0.31–1.14) |
| <1 | 0.8 (0.27–2.39) |
Disclaimer/Publisher’s Note: The statements, opinions and data contained in all publications are solely those of the individual author(s) and contributor(s) and not of MDPI and/or the editor(s). MDPI and/or the editor(s) disclaim responsibility for any injury to people or property resulting from any ideas, methods, instructions or products referred to in the content. |
© 2025 by the authors. Licensee MDPI, Basel, Switzerland. This article is an open access article distributed under the terms and conditions of the Creative Commons Attribution (CC BY) license (https://creativecommons.org/licenses/by/4.0/).
Share and Cite
Caldera, J.R.; Saleh, T.; Fuller, T.; Yang, S.; Nielsen-Saines, K. Multi-Year Analysis of Respiratory Viral Dynamics Reveals Significance of Rhinovirus in Young Children with Severe Respiratory Illness. Infect. Dis. Rep. 2025, 17, 29. https://doi.org/10.3390/idr17020029
Caldera JR, Saleh T, Fuller T, Yang S, Nielsen-Saines K. Multi-Year Analysis of Respiratory Viral Dynamics Reveals Significance of Rhinovirus in Young Children with Severe Respiratory Illness. Infectious Disease Reports. 2025; 17(2):29. https://doi.org/10.3390/idr17020029
Chicago/Turabian StyleCaldera, Juan Raphael, Tawny Saleh, Trevon Fuller, Shangxin Yang, and Karin Nielsen-Saines. 2025. "Multi-Year Analysis of Respiratory Viral Dynamics Reveals Significance of Rhinovirus in Young Children with Severe Respiratory Illness" Infectious Disease Reports 17, no. 2: 29. https://doi.org/10.3390/idr17020029
APA StyleCaldera, J. R., Saleh, T., Fuller, T., Yang, S., & Nielsen-Saines, K. (2025). Multi-Year Analysis of Respiratory Viral Dynamics Reveals Significance of Rhinovirus in Young Children with Severe Respiratory Illness. Infectious Disease Reports, 17(2), 29. https://doi.org/10.3390/idr17020029