Article

A Radiological Assessment of the Angle and Distance Between the Superior Mesenteric Artery and the Abdominal Aorta: A CT Angiography-Based Morphometric Analysis

by
Balqees Al-Mahrizi
1,
Arwa Al-Mujaini
1,
Younis Al-Mufargi
2,
Hamdan Al Balushi
3,
Ahmed Mohammed Alidaroos
3,
Eiman Al-Ajmi
4,
Halima Albalushi
5,
Humoud Al-Dhuhli
4 and
Srinivasa Rao Sirasanagandla
5,*
1
Radiology Residency Program, Oman Medical Specialty Board, Al-Khoudh, Muscat 132, Oman
2
Department of Surgery, Medical City for Military and Security Services, Muscat 123, Oman
3
Sultan Qaboos University Hospital, University Medical City, Muscat 123, Oman
4
Department of Radiology and Molecular Imaging, Sultan Qaboos University Hospital, University Medical City, Muscat 123, Oman
5
Department of Human and Clinical Anatomy, College of Medicine and Health Sciences, Sultan Qaboos University, Muscat 123, Oman
*
Author to whom correspondence should be addressed.
Gastroenterol. Insights 2026, 17(2), 30; https://doi.org/10.3390/gastroent17020030
Submission received: 23 March 2026 / Revised: 23 April 2026 / Accepted: 28 April 2026 / Published: 7 May 2026

Abstract

Background: The distance and angle between the superior mesenteric artery (SMA) and abdominal aorta play a role in the etiology of SMA syndrome. Retroperitoneal fat has been reported to affect both the distance and angle. Very few studies have reported the normal range of these measurements. The present study aimed to evaluate the reference values of the aortomesenteric angle (AMA) and aortomesenteric distance (AMD) in asymptomatic patients, as well as to determine the influence of age, sex, and anthropometric variables on these values. Methods: A retrospective cross-sectional study was conducted at Sultan Qaboos University Hospital. Computed tomography angiography scans of the abdomen from 141 Omani adult patients (aged ≥18 years) were included in the study. The morphometric data of the AMA and AMD were measured at the third part of the duodenum using sagittal and axial multiplanar reconstruction of CTA images. Patient data, including age, sex, height, weight, and BMI, were collected from the medical records. Statistical analyses included the Mann–Whitney U, Kruskal–Wallis H and Jonckheere–Terpstra J-T tests with significance set at p < 0.05. Results: The mean AMA was 57.16 ± 22.06°, and the mean AMD was 21.35 ± 10.25 mm. The AMD varied significantly across age groups (H = 17.29, p < 0.001) and showed a positive trend with increasing age (p = 0.001). Both AMA (p = 0.001) and AMD (p < 0.001) differed significantly across BMI categories, with significant increasing trends (p = 0.033 and p ≤ 0.001, respectively). No statistically significant differences were observed between sexes and study parameters (p > 0.05). Conclusions: The present study demonstrates that the reference values of the AMA and AMD are within the range of those reported in other populations. The variations in these values with BMI and age underscore the importance of individualized imaging interpretation and preoperative planning. The reported baseline data may enhance diagnostic accuracy and assist with surgical planning and radiological evaluation of suspected SMA syndrome.

1. Introduction

The superior mesenteric artery (SMA) arises from the abdominal aorta (AA) at the level of the first lumbar vertebra (L1), approximately 1–2.5 cm below the celiac trunk [1]. It descends anterior to the left renal vein and the third part of the duodenum, crosses the uncinate process of the pancreas, and then enters the mesentery to supply the midgut [2,3,4]. The spatial relationship between the SMA and the aorta is defined by two key parameters: the aortomesenteric angle (AMA), which describes their divergence, and the aortomesenteric distance (AMD), the shortest span between them, typically measured at the level of the third part of the duodenum [4,5]. This region also contains the left renal vein, lymphatic structures, and a retroperitoneal fat cushion that maintains vascular spacing [3]. The left renal vein may also be compressed in this space, a phenomenon observed in CTA studies of healthy cohorts [6]. Embryologically, the SMA arises from the vitelline arteries of the primitive midgut and maintains a ventral trajectory from the aorta. As a result, both AMA and AMD are mechanically sensitive to factors such as posture, intra-abdominal pressure, and the amount of interposing fat [7].
Superior mesenteric artery syndrome (SMAS) is a rare condition in which the SMA compresses the third part of the duodenum against the aorta [5,8]. Patients typically present with non-specific upper gastrointestinal symptoms such as postprandial pain, nausea, early satiety, and vomiting. It is often associated with rapid weight loss, spinal deformity, and anatomical variants that reduce retroperitoneal fat [7,9]. Radiologically, SMAS is defined by a narrowed aortomesenteric angle (<22°) and reduced AMD (<8 mm). However, these thresholds are also observed in asymptomatic individuals, particularly those with low body mass index (BMI), limiting their diagnostic specificity [10]. This overlap underscores the need for population-specific normative values derived from healthy cohorts [3,11]. Individuals with low BMI tend to exhibit a reduced AMA and AMD due to loss of retroperitoneal fat, which normally cushions the SMA from the aorta [12]. This inverse relationship has been reproduced across multiple populations, reinforcing the biomechanical link between BMI and vascular spacing [2,11]. Nutritional studies further link caloric intake and weight change to SMA compression risk [12,13]. While BMI remains the dominant factor, age also contributes through fat redistribution and vascular compliance, with most studies reporting a moderate age-related decline in AMA and AMD [3,9]. In contrast, sex-based differences remain inconsistent, with most evidence showing no significant variation after adjusting for BMI [8,14].
Normative AMA and AMD values have been reported in multiple populations but show wide variation [2,3,15]. Recent CT analyses highlight effects of visceral fat and respiration [15] and identify low BMI as a surgical risk factor for SMA syndrome [16]. Despite extensive research, normative data remain absent for Gulf populations, including Oman, where differences in body composition, lifestyle, and diet may influence aortomesenteric anatomy. Existing studies from South Asia, the Middle East, and Europe are often constrained by small cohorts, inadequate stratification, and frequent reliance on non-contrast CT [11]. This gap highlights the need for population-specific reference values in asymptomatic Omani adults, derived using contrast-enhanced CT angiography (CTA) and stratified by age, sex, and BMI. Such an approach aligns with recent calls for standardized, population-based datasets to overcome variability in the existing literature [15,16]. This study therefore aims to establish normative AMA and AMD values in asymptomatic Omani adults and to assess their variation with key anthropometric factors, thereby providing a regional reference framework for clinical and radiological practice.

2. Materials and Methods

2.1. Study Design and Setting

The research team conducted this retrospective cross-sectional study at Sultan Qaboos University Hospital which operates as a tertiary care academic center in Muscat, Oman. The study followed Helsinki Declaration principles while obtaining Institutional Review Board (IRB) approval from Sultan Qaboos University (Approval Number: REF. NO. SQU-EC/057\2024; date: 27 March 2024). Patient consent was waived due to the retrospective nature of the study.

2.2. Study Population

Participants who underwent CTA and fulfilled the following conditions were included:
  • Adults aged ≥18 years.
  • The abdominal CTA images provided optimal arterial enhancement to show both the SMA and AA in detail.
  • Patients who underwent abdominal CTA for various clinical indications, including trauma without abdominal injury, evaluation of solid organ lesions, and lower abdominal pain. In cases of lower abdominal pain, patients had identifiable alternative diagnoses (e.g., acute appendicitis or colitis) and no imaging evidence of SMASor duodenal compression. All scans were performed between January 2023 and December 2023.
The following patients were excluded from the data analysis:
  • Patients who had existing aortic or mesenteric vascular problems including aneurysms and dissections and severe atherosclerosis.
  • CTA scans with poor image quality because of motion artifacts or insufficient arterial enhancement.
  • Aortic or mesenteric vascular surgery or stent placement or intra-abdominal masses that altered the body structure.

2.3. CT Acquisition Protocol

All CTA scans in this study were performed using a Siemens SOMATOM Force CT scanner (Siemens Healthineers, Erlangen, Germany). Bolus tracking was used to administer 65 mL of Omnipaque at a flow rate of 4.5 mL/s for arterial-phase contrast-enhanced imaging. The acquisition parameters included a slice thickness of 1 mm, a tube voltage of 80 kVp, and tube current modulation using CareDose automated exposure control.

2.4. Data Collection and Morphometric Measurements

Morphometric analysis was performed using the Synapse Picture Archiving and Communication System (PACS), version 5.7.102 (Synapse® Enterprise Imaging, Fujifilm Worldwide, Tokyo, Japan). Measurements were conducted using sagittal and axial multiplanar reconstructions to assess the AMD and AMA as described previously [3].
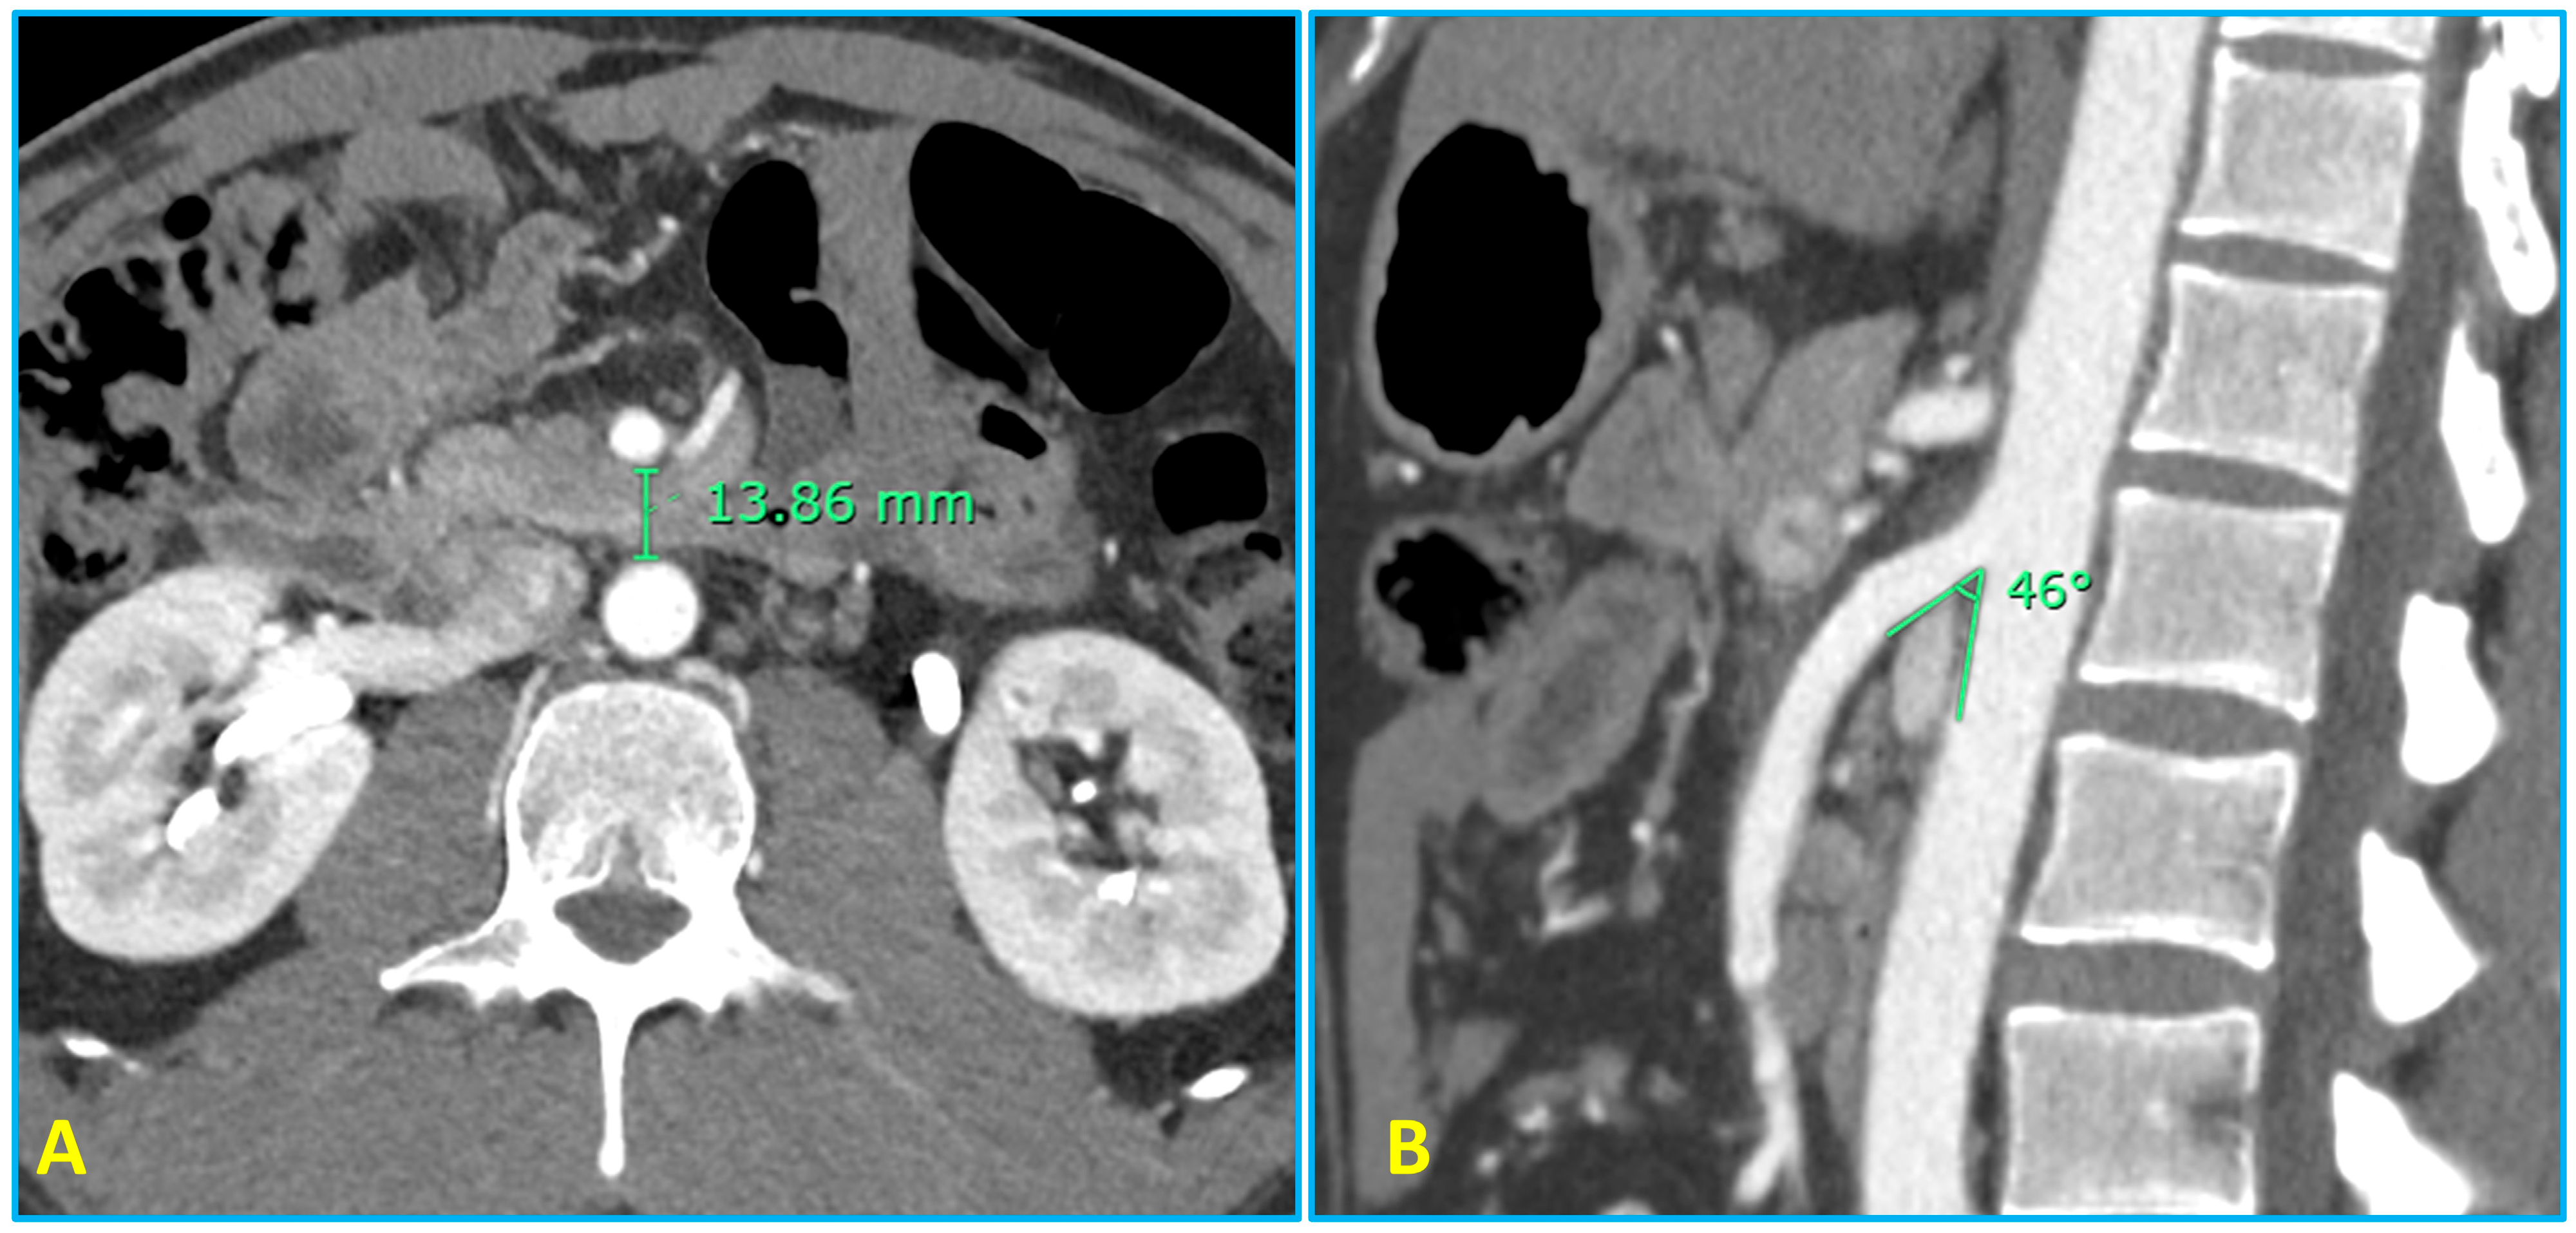
  • The perpendicular distance (AMD) was measured between the AA’s anterior border and the SMA’s posterior edge at the level of crossing of the third part of the duodenum. The measurement of the AMD was taken at the point of the maximum diameter of the third part of the duodenum dorsal to the SMA. Electronic calipers were used for the measurement.
  • The AMA was measured on oblique sagittal CT angiography MPR images at the origin of the SMA, using one line drawn along the posterior wall of the SMA and a second line drawn along the anterior wall of the abdominal aorta. The software automatically calculated the angle in degrees at the level of origin.
Two senior radiology residents conducted all measurements independently. Disagreements in the measurements were resolved through a thorough discussion with a senior consultant radiologist to reduce inter-observer variability. The anatomical measurements used to assess the relationship between the SMA and the AA are shown in Figure 1.

2.5. Sample Size Calculation

The sample size was calculated based on the primary objective of estimating the mean aortomesenteric distance (AMD). The required sample size for estimation of a single population mean was determined using the formula n = ( Z 1 α / 2 σ / d ) 2 , where Z 1 α / 2 = 1.96 for a 95% confidence level, σ = 10.25 mm was the expected standard deviation derived from pilot data, and d = 2 mm was the desired margin of error. The minimum required sample size was therefore calculated as n = ( 1.96 × 10.25 / 2 ) 2 = 100.9 , which was rounded up to 101 participants. The final sample of 141 participants exceeded this requirement.

2.6. Statistical Analysis

Descriptive statistics were used for all demographic variables together with anthropometric data and morphometric measurements. Normally distributed variables are presented as means ± standard deviations (SDs), whereas non-normally distributed variables are presented as medians with interquartile ranges (IQRs). The Shapiro–Wilk and Kolmogorov–Smirnov tests served to determine if the data followed a normal distribution. The Mann–Whitney U test was used to evaluate differences between male and female participants. The Kruskal–Wallis H test followed by the Jonckheere–Terpstra test evaluated trends between ordered groups when examining differences between age groups and BMI categories. The analysis used effect size calculations for group assessments with a p-value < 0.05 considered as statistically significant. All statistical analyses were performed using IBM SPSS Statistics Version 25 (IBM Corp., Armonk, NY, USA).

3. Results

The baseline demographic characteristics and SMA measurements of the study subjects are presented in Table 1. A total of 141 CT scans of the abdomen and/or patients were included in this study with a mean age of 54.18 ± 13.21 years. Male participants (n = 74) had a mean age of 51.50 ± 15.10 years, whereas females (n = 67) were significantly older, with a mean age of 57.13 ± 10.06 years (p = 0.019). The overall mean body weight was 72.58 ± 19.15 kg, with no significant difference between males and females (p = 0.147). Male participants were significantly taller than females (168.80 ± 7.99 cm vs. 154.94 ± 6.86 cm, p < 0.001). Conversely, females exhibited a significantly higher BMI compared with males (29.22 ± 8.04 kg/m2 vs. 26.19 ± 6.07 kg/m2, p = 0.036). The overall mean SMA angle was 57.16 ± 22.06°, and the mean SMA distance was 21.35 ± 10.25 mm. Although males demonstrated higher mean values for both SMA angle and SMA distance than females, these differences did not reach statistical significance (p = 0.122 and p = 0.061, respectively).
Comparisons of the AMA and AMD between male and female participants using the Mann–Whitney U test, along with effect sizes, are summarized in Table 2. Mann–Whitney U tests demonstrated no statistically significant differences in AMA (U = 2104.50; Z = −1.546; p = 0.122; r = 0.13) and AMD (U = 2025.00; Z = −1.874; p = 0.061; r = 0.16) between male and female participants. The effect sizes for both variables were small.
Comparisons of the AMA and distance across age groups using Kruskal–Wallis and Jonckheere–Terpstra tests are provided in Table 3. The Kruskal–Wallis test demonstrated no statistically significant differences in aortomesenteric angle (AMA) across age groups (H = 3.824, p = 0.148), although a gradual increase in mean ranks was observed. Similarly, the Jonckheere–Terpstra test indicated a non-significant positive trend (p = 0.102). In contrast, aortomesenteric distance (AMD) showed significant variation across age groups (H = 17.29, p < 0.001), with the Jonckheere–Terpstra test confirming a significant increasing trend with advancing age (p = 0.001).
Comparisons of the AMA and distance across BMI categories, assessed by Kruskal–Wallis and Jonckheere–Terpstra tests, are presented in Table 4. The analysis revealed that AMA exhibited significant differences between BMI categories (H = 17.06, p = 0.001) and Jonckheere–Terpstra results showed a positive trend with increasing BMI (p = 0.033). The analysis showed that AMD exhibited significant differences between BMI categories (H = 22.14, p < 0.001) with a strong positive association according to the Jonckheere–Terpstra test (p < 0.001).
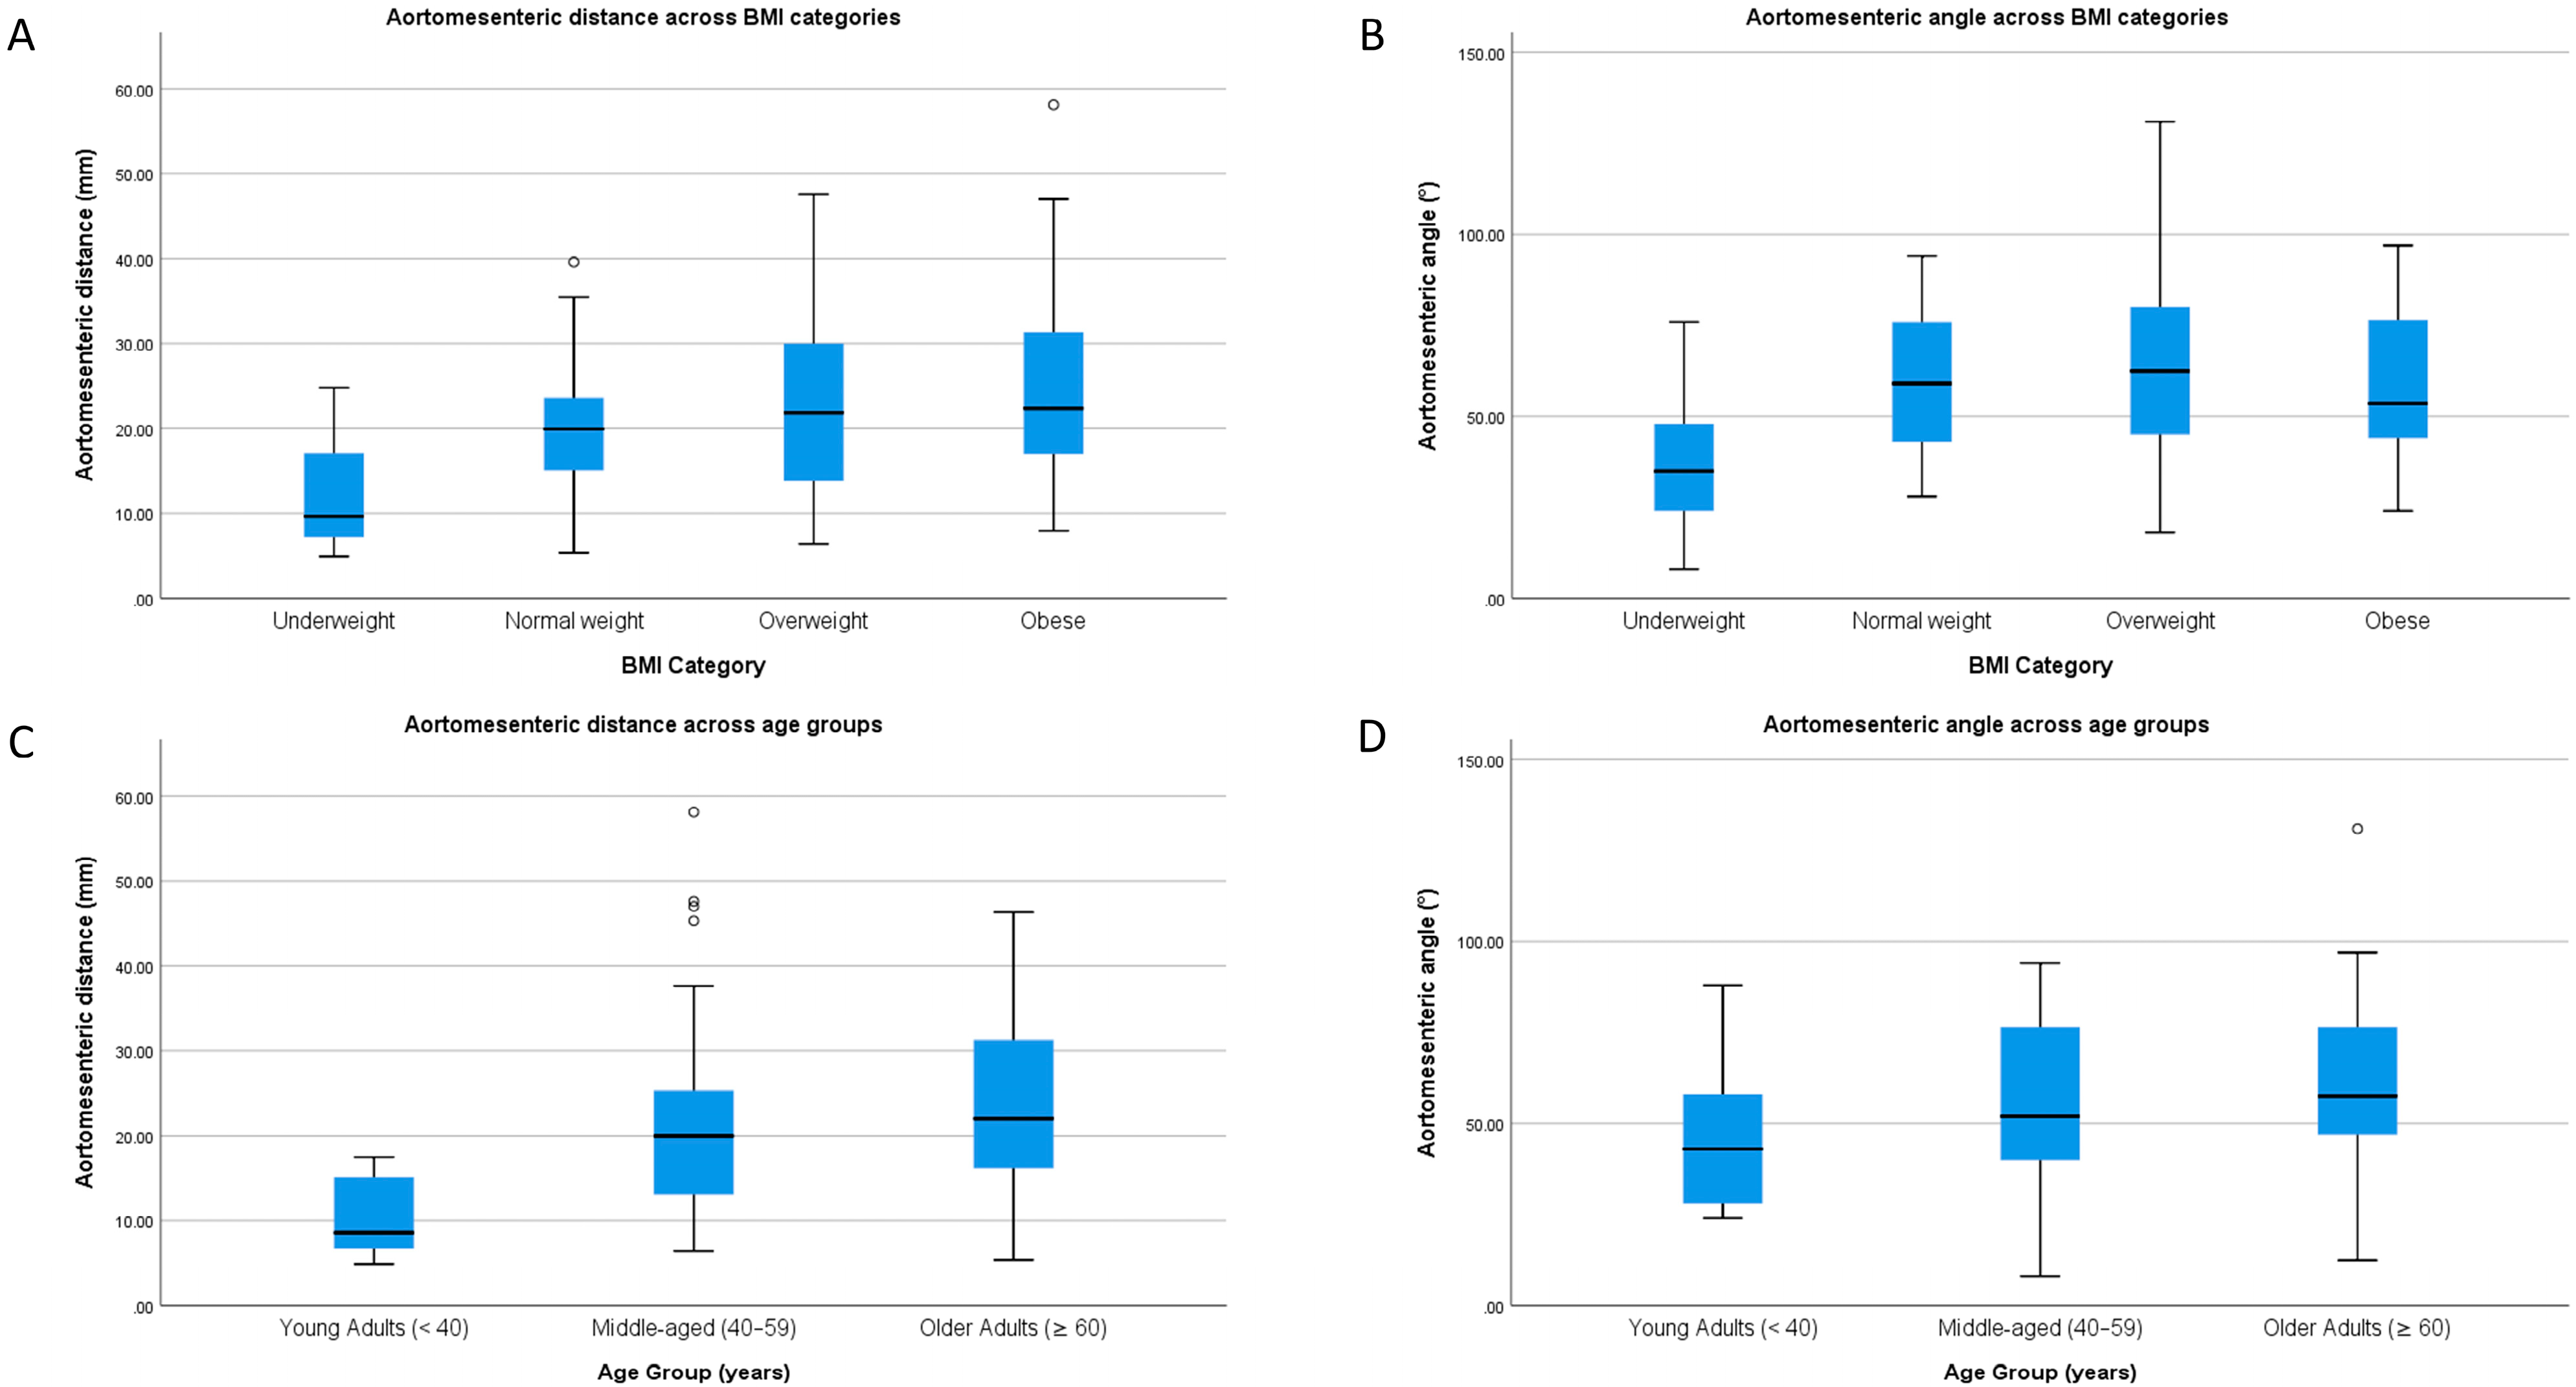
Figure 2 illustrates the distribution of aortomesenteric distance (AMD) and aortomesenteric angle (AMA) across BMI categories and age groups. A clear increasing trend in both AMD and AMA is observed with higher BMI categories, with greater dispersion in overweight and obese groups (Figure 2A,B). Across age groups, AMD demonstrates a progressive upward shift in distribution, whereas AMA shows comparatively less variation without a consistent trend (Figure 2C,D).

4. Discussion

Anatomical variations in the aortomesenteric relationship are known to differ not only between individuals but also across ethnic groups and geographic populations [3,15]. These study findings present reference values for AMA and AMD in a cohort of asymptomatic Omani adults and examine how these parameters vary with age, sex and BMI. The findings reveal that both AMA and AMD are significantly associated with BMI. Although AMA did not show statistically significant variation across age groups, a gradual increase in mean ranks was observed. This trend may not have reached statistical significance due to limited power, particularly given the small number of participants in the younger age group. No statistically significant differences were observed between sexes. The mean AMA in our cohort (57.16° ± 22.06°) closely matches values reported in Pakistani (58.7° ± 17.6°) [14] and Turkish (56.3° ± 14.9°) [17] populations but falls below the Iraqi cohort (67.3° ± 25.5°) [3], suggesting regional variation possibly influenced by population-specific body composition or imaging methodology. Similarly, the mean AMD (21.35 ± 10.25 mm) was greater than values from Nepal (13.3 mm) [2] and India (14.6 mm) [11], but lower than those reported in Iran (28.5 mm) [3], again reflecting ethnic and anatomical diversity. It is also important to consider that methodological differences such as slice thickness, measurement level, and patient positioning may contribute to variation in reported values across studies. For example, non-contrast CT may underestimate the aortomesenteric distance due to suboptimal visualization of vascular margins [11]. The comparative references of AMA and AMD values reported in prior studies, stratified by BMI, region, and imaging modality, are summarized in Table 5.
A consistent trend across our results and those of prior studies is the positive correlation between BMI and both AMA and AMD. Our data confirmed significant differences in both parameters across BMI categories, with a clear upward trend. This supports findings from multiple studies [11,18], and underscores the pivotal role of retroperitoneal fat in maintaining aortomesenteric spacing. Biomechanically, increased retroperitoneal adiposity, associated with higher BMI, expands the space between the SMA and aorta, thereby increasing both the angle and distance. This phenomenon has been corroborated in studies using CT-based fat quantification, suggesting a potential for future integration of adipose volume analysis alongside traditional linear metrics [17]. Notably, AMD may be a more BMI-sensitive parameter than AMA, as also suggested by Hadi et al. (2022) [3] and Jafarpisheh et al. (2019) [18], while other studies have supported this relationship without reporting effect sizes [2,14].
In contrast, no statistically significant sex-based differences were observed in either AMA or AMD which is consistent with the findings of Sayani et al. (2021) [14] and Oka et al. (2023) [8]. Minor numerical differences between males and females in our cohort likely reflect BMI or body habitus rather than intrinsic sex-related anatomical variation. The absence of significant sex-related differences in our study is consistent with the prior literature suggesting that once BMI is controlled, sex exerts minimal influence on AMA or AMD [14]. However, given known differences in fat distribution between sexes, further studies incorporating visceral fat thickness and hormonal profiles may clarify whether sex has a secondary role mediated through body composition.
Our findings have potential clinical relevance for the interpretation of cross-sectional imaging in the context of suspected SMA syndrome. The wide variability of AMA and AMD values in asymptomatic individuals, particularly those with low BMI, highlights the limitations of applying fixed diagnostic cut-offs. This supports consideration of individualized interpretation rather than rigid thresholds. From a diagnostic standpoint, incorporating BMI-adjusted thresholds into radiological criteria for SMA syndrome may improve specificity and reduce false positives. For instance, individuals with naturally low BMI may present with values traditionally considered pathological but remain asymptomatic [5,10,19]. However, this interpretation should be approached with caution. Our study cohort consisted exclusively of asymptomatic individuals and was not designed to evaluate or differentiate patients with SMA syndrome. Therefore, these observations are exploratory and hypothesis-generating, and require validation in studies including symptomatic patients and appropriate comparator groups. In this context, AMD may still represent a more BMI-sensitive parameter than AMA, particularly in underweight or elderly individuals, but its diagnostic utility should be confirmed in clinically selected populations. The establishment of population-specific reference values for Oman contributes to the growing body of literature advocating for contextual and individualized radiological assessment rather than universal cut-offs.
Despite the strengths of this study, including the use of contrast-enhanced CTA, standardized measurement techniques, and stratified analysis, there are several limitations that must be acknowledged. The study was conducted at a single tertiary care center, which may reduce generalizability to the broader Omani or Gulf population. Although inter-observer variability was minimized through consensus reading, formal reliability testing was not performed. Finally, factors such as visceral fat thickness, spinal deformity, or postural variation, which might influence AMA and AMD, were not assessed. Importantly, the absence of a symptomatic or pathological comparator group limits the direct clinical applicability of these findings and precludes determination of diagnostic thresholds. Furthermore, while our cohort focused on asymptomatic adults, similar morphometric evaluations in pediatric and post-operative populations such as post-scoliosis surgery are crucial, as these groups are at heightened risk for SMA syndrome due to rapid anatomical changes [16].

5. Conclusions

This study establishes normative reference ranges for AMA and AMD in Omani subjects and confirms the significant influence of BMI and age on these parameters. The findings align with the global literature while providing region-specific anatomical data that may enhance radiological interpretation and support individualized clinical assessment of SMA-related conditions. AMD may serve as a more sensitive indicator of body composition-related changes in vascular anatomy.

Author Contributions

Conceptualization: S.R.S., E.A.-A. and H.A.-D.; Data Curation: B.A.-M., A.A.-M., H.A.B. and A.M.A.; Formal Analysis: Y.A.-M. and S.R.S.; Visualization: E.A.-A., H.A.-D., Y.A.-M. and S.R.S.; Manuscript Writing: B.A.-M., A.M.A., H.A., H.A.B., Y.A.-M. and S.R.S.; Manuscript Review and Editing: S.R.S., E.A.-A., Y.A.-M. and H.A.-D. All authors have read and agreed to the published version of the manuscript.

Funding

The present study was funded by Sultan Qaboos University with reference number USRF/MED/RADIOl/25/03.

Institutional Review Board Statement

This study was conducted in accordance with the Declaration of Helsinki and was approved by the Institutional Review Board (IRB) at Sultan Qaboos University (Approval Number: REF. NO. SQU-EC/057\2024; date: 27 March 2024).

Informed Consent Statement

Patient consent was waived due to the retrospective nature of the study.

Data Availability Statement

The data presented in this study are available on request from the corresponding author due to privacy and ethical restrictions.

Conflicts of Interest

The authors declare no conflicts of interest.

References

  1. Agarwal, D.; Gupta, S.; Gadwal, S.K.; Singh, A.N.; Das, C.J. Mesenteric Arterial Vasculature: Normal Anatomy, Variants, and Its Clinical Implications. Curr. Probl. Diagn. Radiol. 2026, in press. [Google Scholar] [CrossRef] [Scilit] [PubMed]
  2. Adhikari, D.; Paudyal, S.; Paudel, B.; Paudel, D.; Acharya, I. Angulation and Distance of Superior Mesenteric Artery According to Body Mass Index on Patients Based on Computed Tomography Scan Study at Chitwan Medical College. J. Chitwan Med. Coll. 2019, 9, 74–78. [Google Scholar] [CrossRef] [Scilit]
  3. Hadi, S.S.; Kareem, T.F.; Kamal, A.M. Normal Values of Angle and Distance between the Superior Mesenteric Artery and Aorta in Iraqi Population: A Single Centre Study. J. Med. Radiat. Sci. 2022, 69, 191–197. [Google Scholar] [CrossRef] [Scilit] [PubMed]
  4. Ozkurt, H.; Cenker, M.M.; Bas, N.; Erturk, S.M.; Basak, M. Measurement of the Distance and Angle between the Aorta and Superior Mesenteric Artery: Normal Values in Different BMI Categories. Surg. Radiol. Anat. 2007, 29, 595–599. [Google Scholar] [CrossRef] [Scilit] [PubMed]
  5. Lee, T.H.; Lee, J.S.; Jo, Y.; Park, K.S.; Cheon, J.H.; Kim, Y.S.; Jang, J.Y.; Kang, Y.W. Superior Mesenteric Artery Syndrome: Where Do We Stand Today? J. Gastrointest. Surg. 2012, 16, 2203–2211. [Google Scholar] [CrossRef] [Scilit] [PubMed]
  6. Ribeiro, F.S.; Puech-Leão, P.; Zerati, A.E.; Nahas, W.C.; David-Neto, E.; De Luccia, N. Prevalence of Left Renal Vein Compression (Nutcracker Phenomenon) Signs on Computed Tomography Angiography of Healthy Individuals. J. Vasc. Surg. Venous Lymphat. Disord. 2020, 8, 1058–1065. [Google Scholar] [CrossRef] [Scilit] [PubMed]
  7. Rabie, M.E.; Ogunbiyi, O.; Al Qahtani, A.S.; Taha, S.B.M.; El Hadad, A.; El Hakeem, I. Superior Mesenteric Artery Syndrome: Clinical and Radiological Considerations. Surg. Res. Pract. 2015, 2015, 628705. [Google Scholar] [CrossRef] [Scilit] [PubMed]
  8. Oka, A.; Awoniyi, M.; Hasegawa, N.; Yoshida, Y.; Tobita, H.; Ishimura, N.; Ishihara, S. Superior Mesenteric Artery Syndrome: Diagnosis and Management. World J. Clin. Cases 2023, 11, 3369–3384. [Google Scholar] [CrossRef] [Scilit] [PubMed]
  9. Neri, S.; Signorelli, S.S.; Mondati, E.; Pulvirenti, D.; Campanile, E.; Di Pino, L.; Scuderi, M.; Giustolisi, N.; Di Prima, P.; Mauceri, B.; et al. Ultrasound Imaging in Diagnosis of Superior Mesenteric Artery Syndrome. J. Intern. Med. 2005, 257, 346–351. [Google Scholar] [CrossRef] [Scilit] [PubMed]
  10. Unal, B.; Aktaş, A.; Kemal, G.; Bilgili, Y.; Güliter, S.; Daphan, C.; Aydinuraz, K. Superior Mesenteric Artery Syndrome: CT and Ultrasonography Findings. Diagn. Interv. Radiol. 2005, 11, 90–95. [Google Scholar] [PubMed]
  11. Desai, A.B.; Shah, D.S.; Bhatt, C.J.; Vaishnav, K.U.; Salvi, B. Measurement of the Distance and Angle Between the Aorta and Superior Mesenteric Artery on CT Scan: Values in Indian Population in Different BMI Categories. Indian J. Surg. 2015, 77, 614–617. [Google Scholar] [CrossRef] [Scilit] [PubMed]
  12. Hakimian, D.; Torkelson, B. Superior Mesenteric Artery Syndrome: A Nutrition-Oriented Review. Pract. Gastroenterol. 2023, 13, 12–19. [Google Scholar]
  13. Thompson, K.L.; Ziegler, J.; Trate, T.C.; Trate, D.M. Superior Mesenteric Artery Syndrome: A Nutrition-Focused Clinical Update. Top. Clin. Nutr. 2017, 32, 2–14. [Google Scholar] [CrossRef] [Scilit]
  14. Sayani, R.; Belal Hafeez Chaudhry, M.; Hasan, M.; Janjua, A.; Nazir, I.; Khandwala, K. Measurement of the Angle Between the Superior Mesenteric Artery and the Aorta: Correlation with Body Mass Index. Int. J. Med. Imaging 2021, 9, 104–108. [Google Scholar] [CrossRef] [Scilit]
  15. Sekino, H.; Ishii, S.; Saito, Y.; Hara, J.; Yamakuni, R.; Fukushima, K.; Ito, H. Aortomesenteric Angle: A Contrast-Enhanced Computed Tomography Analysis of Respiratory Phase and Visceral Fat Impact. J. Clin. Imaging Sci. 2025, 15, 2. [Google Scholar] [CrossRef] [Scilit] [PubMed]
  16. Lamport, L.; DiMauro, J.-P.; Johnson, S.; Roberts, S.; Ziegler, J. Association between Underweight Status or Low Body Mass Index and the Risk of Developing Superior Mesenteric Artery Syndrome Following Scoliosis Corrective Surgery in Pediatric Patients: A Review of the Literature. Spine Deform. 2024, 12, 1529–1543. [Google Scholar] [CrossRef] [Scilit] [PubMed]
  17. Albayrak, E.; Demir, O. Assessment of the Relationship between Intraabdominal Fat Thickness and the Aortomesenteric Angle and Distance Using Computed Tomography. Cumhur. Med. J. 2017, 39, 675–682. [Google Scholar] [CrossRef] [Scilit]
  18. Jafarpisheh, S.; Nasri, M.; Ahrar, H. Computed Tomographic Evaluation of Angle and Distance between Superior Mesenteric Artery (SMA) and Abdominal Aorta in: Normal Values in Iranian Population According to Different Body Mass Index Value. Intern. Med. Med. Investig. J. 2019, 4, 16–20. [Google Scholar] [CrossRef] [Scilit]
  19. Olson, M.C.; Fletcher, J.G.; Nagpal, P.; Froemming, A.T.; Khandelwal, A. Mesenteric Ischemia: What the Radiologist Needs to Know. Cardiovasc. Diagn. Ther. 2019, 9, S74–S87. [Google Scholar] [CrossRef] [Scilit] [PubMed]
Figure 1. Axial (A) and sagittal (B) CT angiography images showing an aortomesenteric distance (AMD) of 13.86 mm and an aortomesenteric angle (AMA) of 46°. Note that AMD was measured between the abdominal aorta and the superior mesenteric artery (SMA) at the level of crossing of the third part of the duodenum. The measurement was taken at the point of the maximum diameter of the third part of the duodenum dorsal to the SMA. The AMA was measured at the origin of the SMA, using one line drawn along the posterior wall of the SMA and a second line drawn along the anterior wall of the abdominal aorta.
Gastroent 17 00030 g001
Figure 2. Distribution of aortomesenteric distance (AMD) and aortomesenteric angle (AMA) across BMI categories and age groups. (A) AMD by BMI category. (B) AMA by BMI category. Both AMD and AMA show an overall increase from underweight to obese groups, with greater variability in higher BMI categories. (C) AMD by age group, demonstrating a gradual increase from younger to older adults. (D) AMA by age group, showing modest variation across groups without a clear or consistent trend.
Gastroent 17 00030 g002
Table 1. Baseline demographic characteristics of the study subjects.
VariableMale (n = 74)Female (n = 67)Overall (n = 141)p-Value
Age (years)51.50 ± 15.1057.13 ± 10.0654.18 ± 13.210.019
Weight (kg)74.62 ± 17.8870.33 ± 20.3572.58 ± 19.150.147
Height (cm)168.80 ± 7.99154.94 ± 6.86162.22 ± 10.19<0.001
BMI (kg/m2)26.19 ± 6.0729.22 ± 8.0427.63 ± 7.210.036
AMA (°)59.64 ± 20.0554.43 ± 23.9357.16 ± 22.060.122
AMD (mm)22.80 ± 10.6919.74 ± 9.5721.35 ± 10.250.061
Note: Values are presented as Mean ± SD. p-values are based on the Mann–Whitney U test comparing males and females. BMI: Body Mass Index, AMA: aortomesenteric angle, AMD: aortomesenteric distance.
Table 2. Comparison of aortomesenteric angle and aortomesenteric distance between males and females.
VariableSexNumber Mean RankUZp-ValueEffect Size (r)
AMAMale7476.062104.50−1.5460.1220.13
Female6765.41
AMDMale7477.142025.00−1.8740.0610.16
Female6764.22
Note: Interpretation based on Cohen’s criteria: 0.10 = small, 0.30 = medium, and 0.50 = large effect size. Mann–Whitney U test (U = Mann–Whitney U statistic; Z = standardized test statistic, Z-score; r = effective size).
Table 3. Comparison of aortomesenteric angle and aortomesenteric distance across age groups.
VariableAge GroupsNMean RankKruskal–Wallis H (p)Jonckheere–Terpstra J-T (p)
AMA (°)Young (<40)1049.25H = 3.824 (p = 0.148)J-T = 3161.5 (p = 0.102)
Middle-aged (40–59)7569.95
Older (≥60)5676.29
AMD (mm)Young (<40)1023.20H = 17.29 (p < 0.001)J-T = 3588.0 (p = 0.001)
Middle-aged (40–59)7569.73
Older (≥60)5681.24
Note: Both Kruskal–Wallis and Jonckheere–Terpstra tests were applied, as age groups were ordinal. The J-T test was retained to detect potential monotonic trends that Kruskal–Wallis might not capture.
Table 4. Comparison of aortomesenteric angle and aortomesenteric distance across BMI categories.
VariableBMI CategoryNMean RankKruskal–Wallis H (p)Jonckheere–Terpstra J-T (p)
AMA (°)Underweight (<18.5)1632.34H = 17.06 (p = 0.001)J-T = 4162.5 (p = 0.033)
Normal (18.5–24.9)3974.01
Overweight (25–29.9)3881.13
Obese (≥30.0)4873.42
AMD (mm)Underweight (<18.5)1630.53H = 22.14 (p < 0.001)J-T = 4712.5 (p < 0.001)
Normal (18.5–24.9)3966.62
Overweight (25–29.9)3874.84
Obese (≥30.0)4885.01
Note: The Jonckheere–Terpstra test was used alongside the Kruskal–Wallis test due to the ordinal nature of BMI categories. Significant trends were detected across BMI levels for both AMA and AMD, supporting the hypothesis of monotonic relationships.
Table 5. Comparative summary of aortomesenteric angle and aortomesenteric distance measurements in relation to BMI and age across populations.
StudyCountrySample SizeMean AMA (°)Mean AMD (mm)Mean BMI (kg/m2)Age MeanBMI–AMA CorrelationBMI–AMD CorrelationImaging Technique
Current StudyOman14157.16 ± 22.0621.35 ± 10.2527.63 ± 7.2154.18 ± 13.21H = 17.06 (p = 0.001), J-T p = 0.033H = 22.14 (p < 0.001), J-T p < 0.001CTA
Hadi et al. (2022) [3]Iraq33367.3 ± 25.515.229.451r = 0.23 (p = 0.04)r = 0.46 (p < 0.001)CT
Sayani et al. (2021) [14]Pakistan33858.7 ± 17.618.9827.9551–60Females: r = 0.12
Males: r = 0.36
Females: r = 0.34
Males: r = 0.48
CT
Adhikari et al. (2019) [2]Nepal21054.7 ± 16.9113.3 ± 4.824.68 ± 4.6344.69 ± 16.23r = 0.122, p = 0.01r = 0.086, p = 0.12CT
Jafarpisheh et al. (2019) [18]Iran30054.95 ± 8.5328.5 ± 4.525.62 ± 4.9951.25 ± 7.67r = 0.505, p < 0.001r = 0.609, p < 0.001CT
Albayrak and Demir (2017) [17]Turkey8256.26 ± 14.9218.84 ± 5.61NR56.41 ± 12.94NRNRCT
Desai et al. (2015) [11]India100NRNRNR50r = 0.95r = 0.76 (D1)
r = 0.72 (D2)
r = 0.70 (D3)
CT
Note: AMA = aortomesenteric angle; AMD = aortomesenteric distance; BMI = body mass index; CTA = computed tomography angiography; CT = computed tomography; J-T = Jonckheere–Terpstra test; H = Kruskal–Wallis H statistic; r = Spearman’s correlation coefficient; NR = not reported. Values are presented as mean ± standard deviation unless otherwise indicated. Some studies reported separate correlation coefficients by sex or by anatomical level (D1–D3). Not all studies controlled for age or used contrast-enhanced imaging protocols.
Disclaimer/Publisher’s Note: The statements, opinions and data contained in all publications are solely those of the individual author(s) and contributor(s) and not of MDPI and/or the editor(s). MDPI and/or the editor(s) disclaim responsibility for any injury to people or property resulting from any ideas, methods, instructions or products referred to in the content.