Abstract
Introduction: Hepatitis B is the most prevalent virus that causes severe liver infection worldwide. According to the current guidelines, the HBV viral load and other factors can help in treatment decisions. Therefore, the present study explores the relationship between the HBV viral load and blood-based laboratory parameters. Methods: The HBV viral load was evaluated in blood samples from 159 HBsAg-positive patients (ICT-positive). The viral load was categorized as high (above 200,000 IU/mL), moderate (between 2000 and 200,000 IU/mL), or low (below 2000 IU/mL). The viral load was then compared with laboratory parameters. Results: A significant association was observed between the Hepatitis B viral load and the patient’s age (p < 0.01). The males showed a substantially higher viral load, with 29.2% of the male patients exhibiting elevated levels, compared to 11% of the females. A statistically significant correlation was found between the viral load and liver enzymes, specifically AST (p < 0.005) and ALT (p < 0.04), as well as calcium (p < 0.01). Notably, the elevated ALT and AST levels were more pronounced in the patients with moderate and high viral loads, suggesting a potential link to liver dysfunction. A remarkable insight uncovered in our study revolves around the notable increase in the serum calcium levels (p < 0.01). Conclusions: The AST, ALT, and serum calcium levels were the most altered parameters with high HBV viral load. Though limited reports are available on altered serum calcium levels, they could serve as potential laboratory markers for assessing disease progression in HBV infection. Moreover, focusing on potential therapies to normalize the AST, ALT, and serum calcium levels could offer promising avenues for combating HBV infection.
1. Introduction
The global burden of Hepatitis B virus (HBV) infection remains a pressing public health concern, affecting an estimated 296 million individuals worldwide, with an alarming annual incidence of 1.5 million new cases of Chronic Hepatitis B (CHB). The associated mortality rates are staggering, with 820,000 deaths attributed to hepatocellular carcinoma and cirrhosis in 2019 alone. Since its initial conceptualization by MacCallum in 1947, the recognition of “Hepatitis B” as a significant health threat gained official acknowledgment from The World Health Organization in 1973 [1,2]. HBV, primarily transmitted via blood or semen, plagues nearly 30% of the global population. Characterized by a partially double-stranded DNA structure, the virus manifests in human serum through a spectrum of serological markers, including HBsAg, HBeAg, and HBcAg, and their corresponding antibodies IgM/IgG, delineating various serotypes [3,4]. The primary sero-marker indicating active HBV infection, whether acute or chronic, is Hepatitis B surface antigen (HBsAg) in serum [5]. While some studies have observed positive correlations between markers like HBeAg or HBsAg titers and the serum HBV DNA levels, inconsistencies exist across the literature [6]. Previous studies have linked increased blood HBV DNA with disease progression and a higher risk of decompensated cirrhosis and hepatocellular carcinoma [7]. Several studies have explored the relationship between the serum HBV viral load and the extent of liver damage, as determined by clinical and laboratory markers. Understanding the relationship between the serum HBV viral load and the extent of liver damage has thus become imperative [8].
When considering HBV treatment options, factors such as biochemical parameters and the HBV DNA viral load should be taken into consideration [9]. Current guidelines use the viral load (VL) levels and other factors like liver enzymes, the age at presentation, and liver histology to guide treatment decisions. However, the histological findings and liver enzyme levels are not consistently associated with each other [10]. Numerous authors have attempted to establish a relationship between liver damage and various viral and host biochemical factors, including the genotype, viral load, ALT, AST, bilirubin, etc. Still, conclusive findings have not been reached [11]. Due to the high cost and challenges associated with treating the illness, particularly in resource-limited settings, studies suggest that serum HBsAg may serve as a marker for HBV DNA levels. The majority of Hepatitis B patients face significant challenges due to the high cost, limited accessibility, and prolonged turnaround times of HBV DNA viral load tests [12].
In our investigation, we delved into the relationship between the viral load present in patients with Hepatitis B virus (HBV) infection and a range of clinical laboratory parameters. These parameters included the levels of ALT and AST enzymes, albumin, urea, and calcium and the platelet count. Our focus was explicitly on samples that exhibited positivity for HBsAg, a key marker of HBV infection. Through our analysis, we uncovered robust associations between the viral load and these laboratory markers, shedding light on how HBV viral activity links with various aspects of patients’ physiological status. We also thoroughly documented the demographic information of the patients involved, giving a comprehensive background for our findings.
2. Materials and Methods
2.1. Study Design
This study used a retrospective cross-sectional design to evaluate the relationship between viral load and biochemical parameters among hepatitis B patients.
2.2. Study Area
The present study was conducted in the virology lab of the Microbiology department of All India Institute of Medical Sciences (AIIMS), Rishikesh, from the period of 1 January 2020 to 31 December 2020. AIIMS Rishikesh is a tertiary-care teaching hospital located in the foothills of the Himalayas, catering to the population of the plain and hilly areas of Uttarakhand and its vicinity.
2.3. Sampling Technique and Sample Size
Patients that utilized OPD and IPD services and tested positive for HBsAg through immunochromatography technique (ICT) were included in the study. A total of 159 ICT-positive cases were included, and they were further subjected to viral load testing through real-time polymerase chain reaction (RT-PCR). The data were collected from a hospital-wide registry retrospectively.
2.4. Sample Collection and Laboratory Diagnosis
A volume of 5 mL of venous blood was collected from each patient. The serum and plasma samples were kept at −80 °C for further processing. The primary laboratory diagnosis of Hepatitis B surface antigen (HBsAg) was performed using the immunochromatographic test (ICT) method. Positive cases identified through ICT were then processed for quantification of Hepatitis B virus (HBV) viral load. For HBV viral load testing, DNA was extracted using an automated extraction system (Kingfisher Duo Prime System, Thermo Fisher Scientific, Waltham, MA, USA).
Subsequently, HBV DNA viral load quantification was performed using the Altostar® HBV Viral load RT-PCR Kit (Altona Diagnostics GmbH, Hamburg, Germany) on the BIO-RAD CFX-96 system (BIO-RAD Laboratories, Hercules, CA, USA). The lower limit of detection for HBV DNA viral load was set at 10.2 IU/mL, ensuring sensitivity in detecting even low levels of viral presence.
2.5. Laboratory Parameters
The study included the measurement of various common biochemical parameters to comprehensively assess the health status of the participants. These parameters include bilirubin, Serum Glutamic Oxaloacetic Transaminase (SGOT), Serum Glutamic Pyruvic Transaminase (SGPT), Alkaline Phosphatase (Alkaline-P), Total Protein, albumin, urea, creatinine, uric acid, sodium, potassium, calcium, hemoglobin, Total Leukocyte Count (TLC), Differential Leukocyte Count (DLC), and platelet count. This comprehensive panel of biochemical markers allowed for a thorough evaluation of liver function, kidney function, electrolyte balance, and hematological parameters, providing valuable insights into the overall health profile of the study participants. Any parameter changed from the normal range, either high or low, was labeled abnormal.
2.6. Distribution of Viral Load
The viral load data were categorized into three distinct categories. Viral load levels exceeding 200,000 IU/mL were classified as high, indicating a substantial presence of the Hepatitis B virus in the bloodstream. Viral loads ranging between 2000 and 200,000 IU/mL were categorized as moderate, reflecting a moderate level of viral replication. Conversely, viral loads below 2000 IU/mL were designated as low, suggesting minimal viral activity in the bloodstream.
2.7. Statistical Analysis
Statistical analyses were performed with Microsoft Excel and R (R Foundation for Statistical Computing, Vienna, Austria). Descriptive analysis was performed for all the variables, and mean ± standard deviation or median and 25–75% interquartile range, as appropriate, were reported after checking for normality using the Shapiro–Wilk test. Categorical data were presented as absolute and relative frequency. The chi-square test or Fisher’s exact test (used when any cell had frequency ≤ 5) was applied to test the significance of any difference in viral load among the demographic and laboratory parameters. The confidence interval was set at 95%, and the significance level at 5%.
3. Results
3.1. Characteristics of the Study Population
The study population had a median age of 39 years (interquartile range (IQR), 27–53), indicating a relatively young demographic population. A majority of the patients, accounting for over 70%, were male, highlighting a gender imbalance within the cohort. The ratio of patients attending outpatient department (OPD) versus those admitted for inpatient care (IPD) was observed to be 3:2 (Table 1).

Table 1.
Distribution of sociodemographic and biochemical characteristics of HBV patients.
In terms of lifestyle factors, only a small proportion of the patients reported a history of alcohol consumption, with just three individuals having such a history, while ten patients were identified as smokers. Additionally, a subset of the patients had comorbidities, including diabetes (11 cases) and hypertension (7 cases), suggesting the presence of underlying health conditions in a portion of the study population.
Furthermore, a minority of the patients were found to be co-infected with other blood-borne pathogens, with one patient diagnosed with HIV and two patients with HCV. These findings underscore the complexity and potential challenges associated with managing viral hepatitis in patients with concurrent infections.
3.2. Variation in Viral Load Across Patient Groups
Approximately, 34% of the patients had a low viral load, indicating a small amount of the virus in their blood (below 2000 IU/mL). Approximately 25% of the patients had a high viral load, indicating a large amount of virus in their blood (over 200,000 IU/mL). Meanwhile, 31% of the patients had a moderate viral load, meaning they had a moderate amount of virus in their blood (ranging from 2001 to 200,000 IU/mL).
In our study, we observed a significant association (p-value < 0.01) between the patients’ ages and their viral loads, as shown in Table 2. We noticed that the younger and older adults tended to have higher viral loads, while the pediatric age groups were less affected. Specifically, the individuals aged 11–20 had the highest frequency of undetected cases, meaning the virus was not measurable in their blood. A low HBV viral load was most commonly found in the age group of 21–50. A moderate HBV viral load was prevalent in the age group of 21–40. A higher HBV viral load was observed in the age group of 41–70 years (Figure 1).

Table 2.
Viral load distribution and its association with demographic and laboratory parameters among Hepatitis B patients.
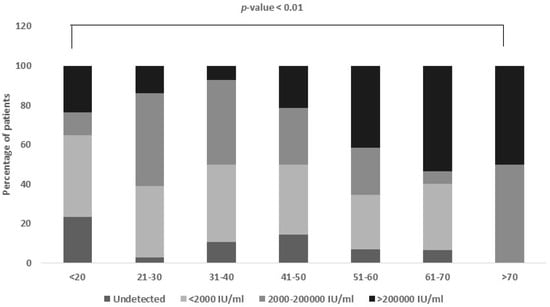
Figure 1.
Viral load distribution among different age groups. Age group 20–50 equally contributes to low and moderate viral load group, while age group 41–70 (p-value < 0.01) has higher viral load.
3.3. Association Between Viral Load and Gender
The association between HBV viral load and gender was found to be non-significant in our study. Out of the 159 patients included, the majority were male, comprising 71.7% of the total, while females accounted for 28.3%. Interestingly, we observed that a slightly smaller percentage of females (6.7%) than males (10.5%) had undetectable viral loads (Figure 2).
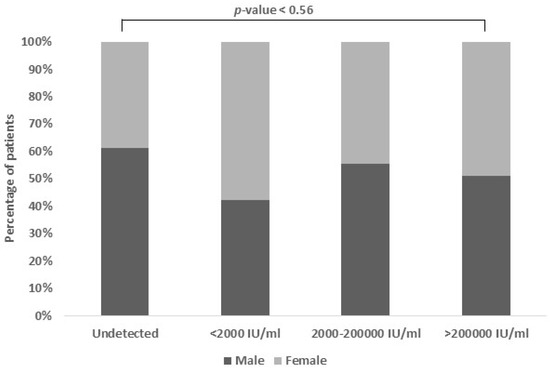
Figure 2.
Viral load association based on gender. The proportion of females with low viral loads was larger (42.2%), while the proportion of males with intermediate viral loads was higher (33.3%). The percentage of high viral loads in both genders were quite similar.
More females (42.2%) than males (30.7%) were categorized in the low viral load group. However, in the moderate viral load group, there was a slightly higher proportion of males (33.3%) compared to females (26.7%). Surprisingly, the prevalence of high viral load was similar between genders (males: 25.4% and females: 24.4%), indicating comparable rates of significant viral replication regardless of gender.
3.4. Association of Viral Load in OPD vs. IPD Samples
Out of the 159 individuals included in the study, about 59.6% were outpatients (OPD), with the remaining 40.4% being inpatients (IPD) at AIIMS Rishikesh. Approximately 10.7% of the OPD samples and 8.8% of the IPD samples were negative for HBV viral load, suggesting that the virus had not been detected in their blood (Figure 3).
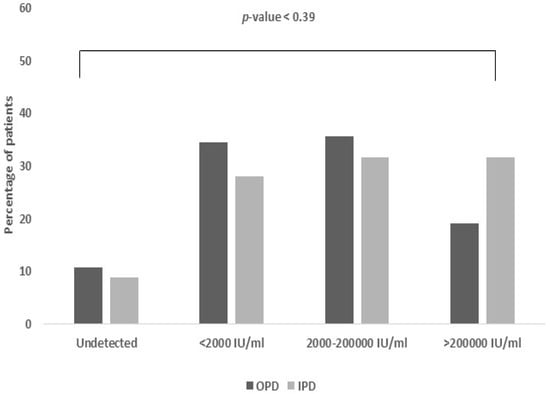
Figure 3.
Viral load association based on OPD vs. IPD. The majority of OPD samples exhibited low to moderate viral loads (34.5% and 35.7%, respectively), whereas IPD samples (31.6%) had higher viral loads.
Approximately 30.4% of the OPD samples and 28.1% of the IPD samples had viral loads less than 2000 IU/mL, indicating a low degree of viral replication. About 35.7% of the OPD samples and 31.6% of the IPD samples showed viral loads ranging from 2000 to 200,000 IU/mL, indicating a moderate amount of viral replication. Approximately 19.1% of the OPD samples and 31.6% of the IPD samples exhibited a viral load of more than 200,000 IU/mL, indicating a high level of viral replication.
3.5. Association Between Viral Load and SGOT (Serum Glutamic Oxaloacetic Transaminase)
In this study, a significant association (p-value < 0.005) was observed between the SGOT levels and HBV viral load. SGOT, which stands for Serum Glutamic Oxaloacetic Transaminase, normally falls within the range of 5–45 IU/mL. Elevated SGOT levels in the patients were found to be positively related with higher viral loads. Specifically, the proportion of abnormal SGOT levels increased with moderate and high viral loads, reaching 28.9% and 39.5%, respectively (Figure 4).
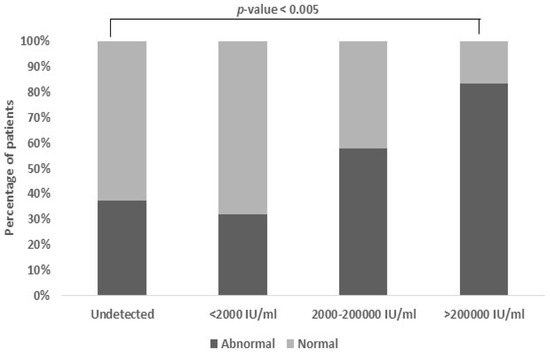
Figure 4.
Association between viral load and SGOT levels. Patients with higher and moderate viral load also had abnormal levels of SGOT (28.9% and 39.5%). The normal range of SGOT is 5–45 IU/mL (p-value < 0.005).
3.6. Association Between Viral Load and SGPT (Serum Glutamate Pyruvate Transaminase)
The findings of this study unveiled a notable association between the Serum Glutamate Pyruvate Transaminase (SGPT) levels and HBV viral load (p-value < 0.04). Typically, the normal range for serum SGPT levels is 5–40 IU/mL. There is a direct association between an increase in a patient’s SGPT levels and a higher HBV viral load. Specifically, as the viral load increases to moderate and high levels, the proportion of patients with abnormal SGPT levels also rises. For moderate viral loads, approximately 26.9% of the patients exhibited abnormal SGPT levels, while for high viral loads, this proportion increased to 42.3%. This suggests that the SGPT levels can serve as a potential indicator of the HBV viral load severity, aiding in the assessment and management of Hepatitis B infection (Figure 5).
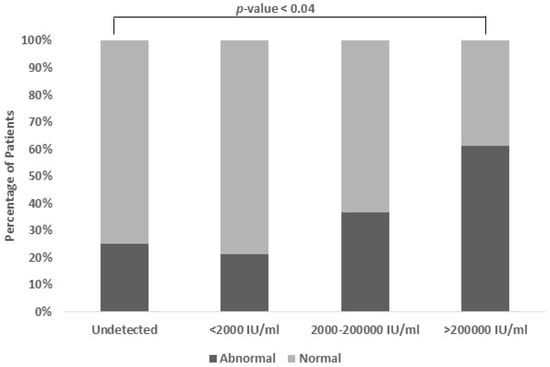
Figure 5.
Association between viral load and SGPT levels. Patients with moderate and high viral load also have abnormal levels of SGPT (26.9% and 42.3%). The normal range of SGPT is 5–40 IU/mL (p-value < 0.04).
3.7. Association Between Viral Load and Serum Albumin
This study investigated the relationship between the HBV viral load and serum albumin levels. A significant association (p-value < 0.08) was found, indicating a connection between higher viral loads and lower serum albumin levels. Serum albumin, crucial for liver function assessment, typically ranges between 3.5 and 5.5 gm/dL. As the HBV viral load increased, the serum albumin levels tended to decrease, suggesting liver damage. Tracking serum albumin alongside the HBV viral load may offer insights into Hepatitis B progression and liver damage severity (Figure 6).
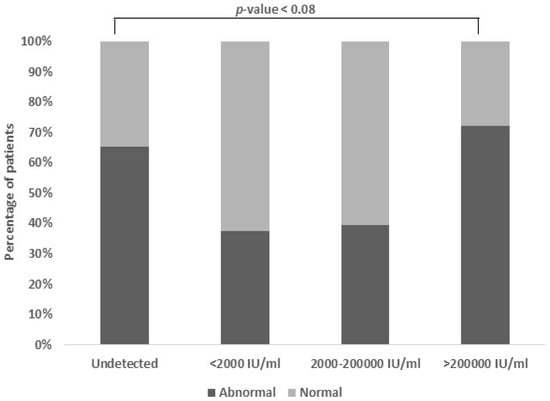
Figure 6.
Association between viral load and serum albumin. The normal range of albumin is 3.5–5.5 gm/dL. A portion of 37.9% of patients had low albumin levels and a high viral load, i.e., individuals who have increased viral loads also tend to have lower albumin levels (p-value < 0.08).
3.8. Association Between Viral Load and Serum Calcium
A noteworthy association (p-value < 0.01) was detected between the viral load and serum calcium levels. The serum calcium content typically falls within a narrow range, spanning from 8.0 to 10.5 mg/dL. Among the patients with a moderate viral load, a minority (27.6%) exhibited abnormal calcium levels, while a substantial portion (48.3%) displayed both abnormal calcium levels and a higher viral load (Figure 7).
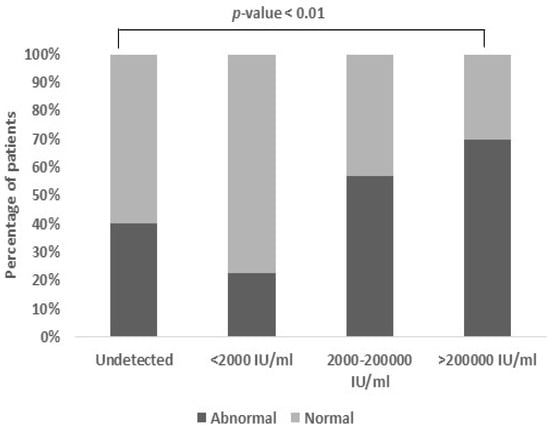
Figure 7.
Association between viral load and serum calcium: Patients with moderate and high viral load also had an abnormal range of serum calcium levels (27.6% and 48.3%, respectively) with an unexpectedly high association (p-value < 0.01). The normal range of serum calcium is 8–10.5 mg/dL (p-value < 0.01).
4. Discussion
India is classified as an intermediate endemic zone for Hepatitis B virus (HBV) infection worldwide. With a prevalence of 3–4.2% of HBsAg and an alarming 40 million HBV carriers, the country witnesses approximately 115,000 annual deaths attributed to HBV-related complications (as per WHO Factsheet-b-World Hepatitis Day, 2016). The imperative for controlling HBV infection underscores the necessity of the HBV DNA viral load test, aligned with current treatment guidelines. Treatment strategies are increasingly reliant on the viral load (VL) levels alongside other biochemical parameters [3]. Therefore, the present study aims to evaluate the correlation between the HBV viral load and biochemical parameters. Our findings revealed a significant HBV viral load in the younger and older population compared to the pediatric group (p-value < 0.01). This aligns with prior research indicating a heightened HBV viral load in these age groups, potentially linked to the adult population’s HBV-associated activity (CDC). (Chu et al. 2009) also elucidated that the immunological response in clearing HBV was generally higher in young adults, whereas the likelihood of disease progression increases with age [4].
Gender dynamics also emerge as significant, with males exhibiting a substantially higher HBV viral load (29.2%) compared to females (11%). This observation resonates with recent studies by (Cao et al. 2021) and (Lyu et al. 2016), attributing the gender disparity to the higher prevalence of alcohol consumption and smoking among males, predisposing them to HBV-related ailments [13,14]. In addition, we noticed no significant association between the HBV viral load and the patient’s inpatient or outpatient status.
Expanding our investigation to encompass blood-based biochemical parameters, such as the platelet count and the hemoglobin, TLC, bilirubin, ALT, AST, ALP, serum albumin, urea, creatinine, sodium, potassium, calcium, and uric acid levels, we aimed to unravel comprehensive insights. Remarkably, our findings showcased a significant correlation between the HBV viral load and only parameters including AST, ALT, and serum calcium.
Elevated levels of ALT and AST, indicative of liver dysfunction, emerged as pivotal markers. A statistically significant correlation was established between the AST (p-value < 0.005) and ALT (p-value < 0.04) levels with a high HBV viral load, with AST exhibiting highly altered levels in cases with HBV viral loads exceeding 20,000 IU/mL. Consistent with our findings, (Guclu et al. 2019) reported elevated AST levels correlating with liver damage in Chronic Hepatitis B patients [15]. Additionally, raised ALT levels were noted in individuals with an HBV viral load surpassing 20,000 IU/mL, corroborating the observations of (Esmaaeelzadeh et al. 2017), who linked elevated AST levels to the replicative activity of HBV. These insights underscore the critical role of routine AST and ALT screening, particularly given the significant elevation observed in HBV patients [16].
A remarkable insight uncovered in our study revolves around the notable increase in the serum calcium levels observed in the patients exhibiting high HBV viral loads. This intriguing finding hints at a potential link between HBV replication and calcium metabolism, adding a novel dimension to our understanding of HBV pathogenesis. This discovery resonates with previous research by (Cadranel et al. 1989), who similarly reported elevated calcium levels in individuals with Chronic Hepatitis B. Building upon this, studies by (Kong et al. 2024) have suggested that heightened calcium levels may assist in HBV multiplication and proliferation, presenting a compelling pathway for future investigations aimed at unraveling the intricacies of HBV infection mechanisms [17,18].
By unraveling these intricate correlations, our study underscores the multifaceted interplay between the HBV viral load and biochemical parameters, offering valuable insights for targeted interventions and enhanced management strategies in combating HBV infection.
Limitations
While our study provides significant insights into the HBV viral load and clinical parameters, it also has the following limitations. Firstly, we did not explore the HBV genotype diversity, a factor influencing disease progression and treatment response. Secondly, the absence of long-term follow-up data limits our understanding of HBV infection dynamics over time. Lastly, the lack of detailed treatment histories restricts our assessment of therapeutic efficacy. Despite these limitations, our findings contribute significantly to HBV research and provide paths for further exploration.
5. Conclusions
From the above findings, it is evident that out of all the biochemical parameters, the AST, ALT, and serum calcium levels were significantly affected in the individuals with a high HBV viral load. Regularly monitoring these parameters could provide valuable insights into the progression of HBV infection. Moreover, focusing on potential therapies to normalize the AST, ALT, and serum calcium levels could offer promising avenues for combating HBV.
Author Contributions
A.N.: conceptualization, data curation, formal analysis, investigation, software, writing—original draft, writing—review and editing. P.A.: visualization, writing—original draft, writing—review and editing. D.D.: formal analysis, resources, supervision, writing—review and editing. S.N.: data curation, methodology, writing—review and editing, resources. S.K.G.: investigation, Supervision, writing—original draft, writing—review and editing. D.K.: methodology, writing—original draft. Y.P.M.: conceptualization, data curation, investigation, project administration, validation, visualization, writing—original draft, writing—review and editing. All authors have read and agreed to the published version of the manuscript.
Funding
This research did not receive any specific grant from funding agencies in the public, commercial, or not-for-profit sectors.
Institutional Review Board Statement
Ethical clearance was obtained from the Institutional Review and Research Board (IRRB) committee at AIIMS Rishikesh, with Reference No-127/IEC/IM/NF/2024).
Informed Consent Statement
Not applicable.
Data Availability Statement
The raw data supporting the conclusions of this article will be made available by the authors, without undue reservation.
Acknowledgments
The authors would like to thank the Department of Health Research (DHR) and the Indian Council of Medical Research (ICMR) for the financial assistance.
Conflicts of Interest
The authors declare that the research was conducted in the absence of any commercial or financial relationships that could be construed as a potential conflict of interest.
Abbreviations
The following abbreviations are used in this manuscript:
| HBV | Hepatitis B virus |
| VL | Viral load |
| CHB | Chronic Hepatitis B |
| HBsAg | Hepatitis B surface antigen |
| AST | Aspartate Transaminases |
| ALT | Alanine Transaminases |
| ICT | Immunochromatographic testing |
| RT-PCR | Real-time PCR |
| SGOT | Serum Glutamic Oxaloacetic Transaminases |
| SGPT | Serum Glutamic Pyruvic Transaminases |
References
- Hepatitis B [Internet]. Available online: https://www.who.int/news-room/fact-sheets/detail/hepatitis-b (accessed on 3 April 2024).
- Lok, A.S. Hepatitis B infection: Pathogenesis and management. J. Hepatol. 2000, 32 (Suppl. S1), 89–97. [Google Scholar] [CrossRef] [PubMed]
- Trépo, C.; Chan, H.L.Y.; Lok, A. Hepatitis B virus infection. Lancet Lond. Engl. 2014, 384, 2053–2063. [Google Scholar] [CrossRef] [PubMed]
- Liaw, Y.F.; Chu, C.M. Hepatitis B virus infection. Lancet 2009, 373, 582–592. [Google Scholar] [CrossRef] [PubMed]
- Mittal, G.; Gupta, P.; Gupta, R.; Ahuja, V.; Mittal, M.; Dhar, M. Seroprevalence and Risk Factors of Hepatitis B and Hepatitis C Virus Infections in Uttarakhand, India. J. Clin. Exp. Hepatol. 2013, 3, 296–300. [Google Scholar] [CrossRef] [PubMed]
- Thompson, A.J.V.; Nguyen, T.; Iser, D.; Ayres, A.; Jackson, K.; Littlejohn, M.; Slavin, J.; Bowden, S.; Gane, E.J.; Abbott, W.; et al. Serum hepatitis B surface antigen and hepatitis B e antigen titers: Disease phase influences correlation with viral load and intrahepatic hepatitis B virus markers. Hepatology 2010, 51, 1933–1944. [Google Scholar] [CrossRef] [PubMed]
- Seto, W.K.; Lai, C.L.; Fung, J.; Wong, D.K.H.; Yuen, J.C.H.; Hung, I.F.N.; Yuen, M.-F. Significance of HBV DNA levels at 12 weeks of telbivudine treatment and the 3 years treatment outcome. J. Hepatol. 2011, 55, 522–528. [Google Scholar] [CrossRef] [PubMed]
- Behnava, B.; Assari, S.; Amini, M.; Hajibeigi, B.; Jouybari, H.M.; Alavian, S.M. HBV DNA Viral Load and Chronic Hepatitis Infection in Different Stages. Hepat. Mon. 2005, 5, 123–127. [Google Scholar]
- Ganji, A.; Esmaeilzadeh, A.; Ghafarzadegan, K.; Helalat, H.; Rafatpanah, H.; Mokhtarifar, A. Correlation between HBsAg quantitative assay results and HBV DNA levels in chronic HBV. Hepat. Mon. 2011, 11, 342–345. [Google Scholar]
- Iregbu, K.C.; Nwajiobi-Princewill, P.I. Viral Load Pattern Among Hepatitis B Surface Antigen-positive Patients: Laboratory Perspective and Implications for Therapy. Ann. Med. Health Sci. Res. 2016, 6, 95–99. [Google Scholar] [CrossRef]
- Ijaz, B.; Ahmad, W.; Javed, F.T.; Gull, S.; Sarwar, M.T.; Kausar, H.; Asad, S.; Jahan, S.; Khaliq, S.; Shahid, I.; et al. Association of laboratory parameters with viral factors in patients with hepatitis C. Virol. J. 2011, 8, 361. [Google Scholar] [CrossRef] [PubMed]
- Obiomah, C.; Amilo, G.; Ndulue, I. Evaluation of HBsAg Quantification as Surrogate to HBV DNA Viral Load in Hepatitis B Infected Patients in Anambra State, Nigeria. Am. J. Mol. Biol. 2020, 10, 129–140. [Google Scholar] [CrossRef]
- Cao, M.; Ding, C.; Xia, C.; Li, H.; Sun, D.; He, S.; Chen, W. Attributable deaths of liver cancer in China. Chin. J. Cancer Res. 2021, 33, 480. [Google Scholar] [CrossRef] [PubMed]
- Lyu, X.; Liu, K.; Chen, Y.; Wang, Z.; Yao, J.; Cai, G.; Jiang, Z.; Wang, Z.; Jiang, J.; Gu, H. Analysis of Risk Factors Associated with the Development of Hepatocellular Carcinoma in Chronic HBV-Infected Chinese: A Meta-Analysis. Int. J. Environ. Res. Public Health 2016, 13, 604. [Google Scholar] [CrossRef] [PubMed]
- Güçlü, E.; Öğütlü, A.; Kösem, M.; Erkorkmaz, Ü.; Karabay, O. Relationship Between Basic Laboratory Results and Fibrosis in Chronic Hepatitis B Patients. Viral Hepat. J. 2019, 25, 45–49. [Google Scholar] [CrossRef]
- Esmaeelzadeh, A.; Saadatnia, H.; Memar, B.; Amirmajdi, E.M.; Ganji, A.; Goshayeshi, L.; Meshkat, Z.; Pasdar, A.; Vosoughinia, H.; Farzanehfar, M.; et al. Evaluation of serum HBV viral load, transaminases and histological features in chronic HBeAg-negative hepatitis B patients. Gastroenterol. Hepatol. Bed Bench 2017, 10, 39–43. [Google Scholar] [PubMed]
- Cadranel, J.F.; Buffet, C.; Ink, O.; Pelletier, G.; Bismuth, E.; Etienne, J. Hypercalcaemia associated with chronic viral hepatitis. Postgrad. Med. J. 1989, 65, 678–680. [Google Scholar] [CrossRef] [PubMed]
- Kong, F.; Zhang, F.; Liu, X.; Qin, S.; Yang, X.; Kong, D.; Pan, X.; You, H.; Zheng, K.; Tang, R. Calcium signaling in hepatitis B virus infection and its potential as a therapeutic target. Cell Commun. Signal. 2021, 19, 82. [Google Scholar] [CrossRef] [PubMed]
Disclaimer/Publisher’s Note: The statements, opinions and data contained in all publications are solely those of the individual author(s) and contributor(s) and not of MDPI and/or the editor(s). MDPI and/or the editor(s) disclaim responsibility for any injury to people or property resulting from any ideas, methods, instructions or products referred to in the content. |
© 2025 by the authors. Licensee MDPI, Basel, Switzerland. This article is an open access article distributed under the terms and conditions of the Creative Commons Attribution (CC BY) license (https://creativecommons.org/licenses/by/4.0/).