Article

Colonic Dysbiosis Is Associated with Gastrointestinal Disorders More than Mother–Child Epidemiological Traits in Mexican Children with Autism Spectrum Disorders

by
Julián Herrera-Mejía
1,
Abraham Wall-Medrano
1,
Arnulfo Ramos-Jiménez
1,
Aarón F. González-Córdova
2,
Florinda Jiménez-Vega
1,* and
Rocio Campos-Vega
3,*
1
Instituto de Ciencias Biomédicas, Universidad Autónoma de Ciudad Juárez, Anillo Envolvente del PRONAF y Estocolmo s/n, Ciudad Juárez 32310, Chihuahua, Mexico
2
Laboratorio de Química y Biotecnología de Productos Lácteos, Centro de Investigación en Alimentación y Desarrollo A. C., Carretera Gustavo Enrique Astiazarán Rosas No. 46 Colonia La Victoria, Hermosillo 83304, Sonora, Mexico
3
Research and Graduate Studies in Food Science, School of Chemistry, Universidad Autónoma de Querétaro, Querétaro 76010, Querétaro, Mexico
*
Authors to whom correspondence should be addressed.
Gastroenterol. Insights 2025, 16(2), 15; https://doi.org/10.3390/gastroent16020015
Submission received: 5 February 2025 / Revised: 28 March 2025 / Accepted: 7 April 2025 / Published: 17 April 2025
(This article belongs to the Section Gastrointestinal Disease)

Abstract

:
Introduction: Functional gastrointestinal disorders (FGIDs) are common comorbidities that affect the life quality of children with autism. Objective: This study investigated the link between clinical history and specific colonic fecal microbiota (CFM) markers with the pathophysiology of FGIDs in young children with autism patients. Methods: Thirty-nine young patients (2 and 18 years) were included in the study of FGIDs (+) cases (n = 18) and FGIDs (-) (n = 21) controls. Gastrointestinal disorders were diagnosed by standardized clinical tools (ROMA-IV and six-item gastrointestinal severity index), while bacterial markers, including Bacteroidetes, Firmicutes, Actinomycetes (Phyla); Lactobacillales, Clostridiales, Bifidobacteriales (Orders); B. fragilis, F. prausnitzii, B. longum, D. vulgaris and A. muciniphila (Species), were detected by targeting 16S rRNA and two-step PCR protocol. Results: The overall prevalence of FGIDs was significantly (p < 0.05) associated with cesarean delivery, the duration of milk formula consumption, and the presence of early intestinal symptoms during infancy. Furthermore, Bacteroidetes, Lactobacillales, B. longum, D. vulgaris, and A. muciniphila concentrations were significantly (p ≤ 0.03) higher in stool of patients with moderate symptoms, compared to those who were asymptomatic. Conclusions: Our results suggest that the CFM composition is a potential physiological predictor of FGID pathophysiology in a severity-dependent way in children with autism.

1. Introduction

Autism spectrum disorders (ASDs) are a group of complex neurological and neurodevelopmental disorders that alter communication, socialization, and behavior (American Psychological Association [APA], 2013) [1]. Furthermore, individuals living with ASD have an increased risk of developing other diseases. Evidence supports that functional gastrointestinal disorders (FGIDs) are very frequent among ASD patients, reaching up to 48.67% (95% CI: 43.50–53.86) [2], and tend to impair their general health status and quality of life [3].
In children with autism, FGIDs mainly affect the distal structures of the gut [4]. However, the severity of intestinal symptoms varies individually from mild to severe [5]. The most prevalent include diarrheal stools, intestinal constipation, abdominal pain, and flatulence, which result in various clinical phenotypes between individuals [6]. Intestinal pathologies are frequent reasons for medical consultation, hospital admission, and the use of pharmacological agents [7,8], which destabilizes the economy of the nuclear family.
The etiology of FGIDs in children with ASD is a developing scientific topic. Evidence, although limited, suggests that they are products of food selectivity and digestive enzyme deficiencies [9], modulating the colonic fecal microbiota (CFM) composition, in response to physicochemical modifications (e.g., pH, osmolarity, carbon sources, etc.) occurring in the lumen of the digestive tract [10,11], derived from defects in the digestion of food matrices.
Next-generation sequencing (NGS) studies, based on metagenomics, have revealed that ASD patients present an abnormal colonic microbiota profile, compared to neurotypical (NT) ones [12]. Bacterial colonization patterns in the gut of ASD patients are inconsistent among the studies; higher concentrations of Lactobacillus, Bacteroides, Desulfovibrio, and Clostridium but lower Bifidobacterium, Blautia, Dialister, Prevotella, Veillonella and Turicibacter have often been reported [12,13].
Particularly, the abundance of Desulfovibrio and Clostridium species has been related to greater severity of FGIDs and ASD symptoms, due to metabolites produced that exert toxic effects on the epithelium gut cells [14,15]. These disturbances of the bacterial load result in intestinal permeability and the subsequent translocation of toxic bacterial metabolites to the mucosa, possibly associated with the natural history and clinical evolution of FGIDs [12]. Unfortunately, unknown factors influence the composition and type of bacteria comprising the digestive symptoms of children with ASD.
Strong biological arguments enable us to hypothesize that FGID risk in ASD patients originates from birth, as a consequence of unfavorable perinatal conditions, and is enhanced by clinical history and environmental demands of each individual during childhood and adolescence. Therefore, this study examined the epidemiological features and selected colonic fecal microbiota markers associated with functional gastrointestinal disorders in young people living with ASD.

2. Materials and Methods

2.1. Patient Characteristics

Thirty-nine patients with autism diagnosis and their primary caregivers participated in this study. The case group consisted of ASD patients diagnosed with functional gastrointestinal disorders (FGIDs) (n = 18) and the control group of those without FGIDs (n = 21). The inclusion criteria were as follows: (1) young males and females (2–18 years), (2) diagnosed with autism by a specialist (pediatric neurologist or child psychologist) according to the Diagnostic and Statistical Manual of Mental Disorders, 5th edition—DSM-V [1], and (3) residents in Ciudad Juarez-Chihuahua. Subjects were excluded who had ages outside the range, unconfirmed ASD diagnosis, congenital diseases (metabolic or genetic), or residents of other localities. All participants were recruited from special education institutions aimed at neurodevelopmental disorders.
General sociodemographic information was collected from all patients. Caregivers were asked for the mother’s clinical and obstetric history, the child’s perinatal information, and the patient’s recent clinical history.

2.2. Gastrointestinal Assessment and Diagnosis

Functional gastrointestinal disorders (FGIDs) such as constipation, diarrhea, and irritable bowel syndrome (IBS) were diagnosed with the ROME IV criteria from The Rome Foundation [16]. The shape and consistency of the patients’ stools were evaluated by the Bristol stool chart [17]. Interviewers qualitatively classified stools into 7 graphic categories, whose values correspond to hard, fragmented, and dry stools (categories 1 and 2; suggestive of constipation), stools of normal consistencies (categories 3 and 4), and irregular, very soft or liquid stools (categories 5–7; suggestive of diarrhea). The gastrointestinal severity was classified according to the 6-item gastrointestinal severity index (6-GSI) criteria [5]. Caregivers assigned a value between 0 and 2 for each of six symptoms (constipation, diarrhea, stool consistency, stool smell, flatulence, and abdominal pain) based on the weekly frequency, and the categories assigned according to the total score were as follows: 0 = asymptomatic, 1–4 = mild, 5–8 = moderate, and 9–12 = severe.

2.3. Methods and Assessments

Stool specimens (5–10 g) were collected by parents in sterile containers. The stool pre-treatment protocol was modified from Zhang et al. [18]. Fresh samples were kept at 4 °C during transport and delivered to the laboratory within 4 h, and frozen at −80 °C until use. On the day of DNA extraction, the samples (2.5 g) were thawed and homogenized in a saline solution (1:2 w/v, 0.9% NaCl) by vortex and centrifugation. Supernatants (~1.5 mL) were further transferred to microtubes, centrifuged (13,000 rpm, 5 min, 4 °C; Hermle Labnet Z216MK, Mandel Guelph, ON, Canada), and the supernatant discarded. The stool pellet was then rinsed in saline solution (1 mL) twice. Recovered pellets were immediately used for DNA extraction.

2.3.1. Fecal DNA Extraction

It was performed with phenol–chloroform–Isoamyl alcohol (25:24:1) solution, according to Green and Sambrook [19]. Stool pellets were dissolved in a lysis buffer. A quantity of 400 µL of PCA solution was added to each sample. The supernatant was washed three times by adding phenol–chloroform solution (24:1, 400 µL), and DNA was precipitated with ethanol (100%), sodium acetate solution (10:1 w/v, 400 µL) and cooled (−20 °C) overnight. The DNA pellet was resuspended (30 µL nuclease-free water), and the samples (100 ng/µL) were stored at −80 °C until analysis.

2.3.2. 16S rRNA Gene Amplification (2S-PCR)

Synthetic primers (Integrated DNA Technologies, Coralville, Iowa, USA) targeting the 16S rRNA gene (v3-v4 regions) used are listed in Supplementary Table S1. These markers were selected based on previous studies reporting statistically significant differences when comparing ASD vs. NT children stool samples [20,21,22,23]. The relevance of the bacterial markers on overall CFM maintenance or their implications in FGID pathogenesis were also considered. Eleven bacterial markers were evaluated: Bacteroidetes, Firmicutes, Actinomycetes (Phyla); Lactobacillales, Clostridiales, Bifidobacteriales (Orders); B. fragilis, F. prausnitzii, B. longum, D. vulgaris and A. muciniphila (Species). The specificity of all primers and 16S delimited rRNA fragments was checked against NCBI-deposited sequences for the same bacteria using the Basic Local Alignment Search software (BLAST; RRID: SCR_004870).
The adapted conventional PCR protocol was recently published by Herrera-Mejía et al. [24]. It consisted of two consecutive runs differing in annealing melting temperatures using the same primer set. Briefly, stage 1 [forty cycles; astringency (°Tm-5 °C)] and stage 2 [forty cycles; astringency (°Tm-0 °C)] polymerization reactions were performed in a ProFlexTM PCR system (Applied Biosystems, Forest City, CA, USA), and thermocycling conditions (denaturing/annealing/elongation) are described in Supplementary Table S1.
  • Stage 1: The reaction mixture (24 µL) consisted of 2 µL (200 ng) DNA template, 12 µL of GoTaq® (DNA polymerase, dNTPs, MgCl2, and reaction buffer), sense (Fw)/antisense (Rv) primers (1 µL, 200 µM each), 8 µL PCR-grade water.
  • Stage 2: 16S rRNA-amplified product (2 µL) was mixed with the same reaction mixture (total volume 24 µL) and amplified with a higher astringency (annealing temperature).
The molecular weight marker (100 bp DNA ladder Promega) and PCR amplicons (10 µL) were electrophoretically (40 min at 100 V) analyzed on agarose gels (1.8%) supplemented with ethidium bromide (EtBr, 0.1%). Gels were viewed using a UV transillumination system, the images were digitized (1.5–2.5 exposure, Kodak EDAS 290 system), and the densitometric analysis was performed with the Kodak 1D Image software Ver. 3.6 (Kodak, Rochester, NY, USA).

2.4. Statistical Analysis

Data were analyzed with GraphPad Prism version 8.0 statistical software (RRID: SCR_002798). The normality of quantitative values was assessed using the Shapiro–Wilk test. All quantitative variables are presented as means ± standard deviation (SD). Dichotomous or categorical variables were presented as absolute values and percentages. Associations between categorical variables and gastrointestinal health indicators were analyzed using Fisher exact for odds ratios (ORs) and Chi-square tests. While quantitative variables were analyzed with Student’s t-tests or Mann–Whitney U tests (2 groups) and one-way ANOVA or Kruskal–Wallis (≥2 groups), according to the normality of the data. All analyses were performed with 95% confidence, and values of p < 0.05 were considered significant.

3. Results and Discussion

3.1. Sociodemographic Information

The sociodemographic information of the participants is summarized in Table 1 and Table 2. The mean age of the caregivers was 37.6 ± 8.3 years, predominantly female (90%) with high school, technical, professional, or postgraduate education (70%). Seventy-nine percent of the patients were male (male/female ratio = 3/1), and the mean age was 10.2 ± 4.7 years. Most (77%) patients were schooled and had access to health services (77%). The sociodemographic characteristics between cases and controls (and their caregivers) were similar in most variables (p ≥ 0.5). But the proportion of caregivers with better education levels was higher in the control group with respect to cases (47.5% vs. 11%; X2 test p = 0.02).
In this study, ASD diagnosis was made at a mean age of 3.5 ± 1.9 years (preferably < 3 years). According to the Childhood Autism Rating Scale (CARS) scores, the mean score was 32.97 ± 6.1 points, corresponding to the classification range: “Mild to moderate”. Six patients (15%) scored below the cut-off point suggestive of autism (30 points); more than half (n = 24, 62%) classified in the mild to moderate autism category (≥30–36.5 points) and nine (23%) in the severe autism category.
The items with the highest severity scores were (0–4 range) overall impression (2.6 ± 0.8), level and consistency of intellectual response (2.6 ± 1.1), verbal communication (2.5 ± 1.2), relationship with others (2.5 ± 1.0), level of physical activity (2. 4 ± 1.0); those of low severity were affective response (1.9 ± 1.1), object use (1.9 ± 1.0), nonverbal communication (1.9 ± 1.0), and taste/smell/touch use and response (1.7 ± 1.0).
CARS scores were not different between cases and controls (34.9 ± 6.0 vs. 32 ± 6.0; U-Mann–Whitney p > 0.05) or the autism severity classification category (“mild to moderate” in both groups). Furthermore, the severity of intestinal symptoms did not correlate with the severity of autism (r = 0.19; p = 0.2), even in patients with intestinal pathologies (r = 0.26; p = 0.3).
Gastrointestinal severity is believed to correlate positively with autism features and neurocognitive deviations. Adams et al. [25] found a moderate, but significant correlation (0.59; p < 0.001) between gastrointestinal severity index and autism severity features; furthermore, higher Autism Treatment Evaluation Scale (ATEC) scores were found in ASD patients with moderate to severe SGI (6-GSI > 3; 81.5 ± 28) compared to those with mild symptoms (ISG < 3; 49.0 ± 28 points). However, systematic reviews and meta-analyses on this topic reveal that the associations of the studies are weak, heterogeneous [26], and with few apparent effects on the level of behavioral consistency and autism symptom severity [27], which is consistent with our results.

3.2. Perinatal Clinical History of the Participants

Among the mothers of the participants, 95% (45 mothers) reported obstetric comorbidities (1–8, mean 3 ± 2.5). The most prevalent were genitourinary infections (41%), high obstetric risk (30.8%), delivery complications (30.8%), and hemorrhage or bleeding (20.5%). Other complications (25.6%), included depression in pregnancy, fetal malposition, neuropathy, persistent vaginal pain, presence of meconium in the amniotic fluid, and preterm delivery (<37 weeks completed). None of these conditions was associated with the risk for FGIDs (p > 0.05) (Supplementary Table S2).
The perinatal history of ASD patients is shown in Table 1 and Table 2. The proportion of cesarean births among ASD patients in Ciudad Juarez was high (61.5%). Length (mean 51.7 ± 5.4 cm) and birth weight (mean 3046 ± 0.69 g) were within expected ranges [28]. However, 8% presented as underweight, 23% as insufficient weight, and 8% as macrosomia. The total duration of breastfeeding was low (4.2 ± 5.7 months) and insufficient (exclusive <6 months) in 30 patients (77%), while the time of formula feeding was high (mean 20.8 ± 18.6 months), but widely variable (between 0 and 90 months). These complications required patients (10–15%) to have oxygen therapy or incubation at birth. The FGIDs were positively associated with cesarean delivery (r = 0.78; cases 73% vs. controls 58%; p = 0.036), length at birth (r = 0.71; cases 54.1 ± 5.9 cm vs. controls 48.5 ± 5. 3 cm; t-student p = 0.002), and time of milk formula use (r = 0.56; cases 18.6 ± 18.4 months vs. controls 23.9 ± 19 months; p = 0.03) (Table 1); however, the causality of these relationships is unknown.
No existing study has identified maternal or neonatal risk factors associated with patients FGIDs, although epidemiological evidence about perinatal antecedents associated with the etiology of autism is relatively consistent [29,30]. Perinatal risk detection can improve preventive or therapeutic approaches targeting intestinal health from its origins because intestinal diseases represent a prevalent and unresolved clinical problem in autism [5]; so, they were of interest in this study.
Cesarean delivery was not only an ASD-related determinant of intestinal pathologies but also frequent in the case group compared to controls according to our results. Although this surgical procedure is indicated to intervene in life-threatening complications in the mother–child binomial, it has been associated with unfavorable short-, medium- and long-term health effects [31]. The biological association between cesarean delivery and FGIDs is presumably mediated by the intestinal microbiota changes in the neonate, due to cutaneous bacterial exposure, and not to those residing in the maternal vaginal canal [32]. According to large metagenomic studies, cesarean delivery is the main modifier of CFM in newborns [33]. Compositional CFM changes in early developmental stages potentially disrupt the flow of molecular signals involved in the maturation of intestinal tissues [34] that can influence FGID pathophysiology in patients with autism.
In this study, birth weight was not a diagnostic predictor of intestinal diseases, although three patients born with macrosomia (>4.0 kg) belonged to the case group. However, neonatal size (length) was significantly associated with intestinal diseases being larger (≈5.5 cm) in cases than in controls (Table 1). Information was insufficient to define the causality or randomization of that association due to the experimental design. Currently, size at birth is not considered a gastrointestinal risk factor in autism.
Magnetic resonance imaging (MRI) analyses have shown cerebral anatomical alterations in ASD patients. Bellani et al. [35] found that macrocephaly was more recurrent in children with autism than in NT. Given that cephalic length at birth is proportionally large (>50%) to the total length [36], an atypical brain enlargement during embryogenesis could influence size at birth. We posit that deviations in brain size reflect alterations in intestinal maturation that could represent increased risks of FGIDs because the central nervous system (CNS) and the enteric (ENS) are formed in the embryo by common biochemical signals from the neural crest [37]; however, studies are needed to test this hypothesis.
In this investigation, the time of milk formula consumption was significantly associated with intestinal diagnoses and was longer (≈6 months) in the case group. The constituents of commercial formulas are known to differ from those of breast milk, including the proportion and digestibility of all nutrients and bioactive compounds (i.e., polyunsaturated fatty acids, immunoglobulins, probiotics, and antimicrobial factors) [38], which are often absent in non-fortified commercial milk.
Jingran et al. [39] found that consumption of milk formulas modified the composition of the intestinal microbiota in neonates. They reported higher abundance of Bifidobacterium and lower prevalence of Veillonellaceae, Enterococcoccaceae, and Streptococcaceae in the feces of breastfed infants compared with those consuming milk formulas. CFM alterations during infancy promote colonization by pathogens, increasing the risk of infections and intestinal diseases [40], similarly related to our findings in this group of ASD patients.

3.3. Gastrointestinal Features of the Patients

Half of the caregivers perceived their children’s intestinal as fair (34%) or poor (16%). These patients presented adverse gastrointestinal symptoms (GISs) one month before the study. The most prevalent were gas or flatulence (67%), bowel constipation (43%), abdominal pain (3%), abdominal distension (32%), and diarrheal stools (32%) (Table 1 and Table 3). Based on the Bristol chart, 28 patients had stools of normal shape and consistency (type 3 or 4); 7 patients (18%) had hard, dry, and fragmented stools (type 1 or 2); and the rest (10%) had soft, very soft, and irregular stools (type 5 or 6).
Caregivers’ overall impression of patients’ gut health was strongly associated with FGIDs. In this regard, 89% (n = 16) of the parents in the case group indicated that the intestinal health of their children was inadequate (fair or poor); in contrast, 90% (n = 19) of the parents in the control group considered it to be good (OR: 26.7; 95% CI: 4.8–129.0, p < 0.0001). Older clinical history (since birth) predictors of FGIDs in this group of patients were only constipation and colitis (OR: 9.61; 95% CI = 1.1–95.5). The risk of FGIDs based on recent GIS (during the last month) was significantly (p < 0.05) associated with proctalgia (OR: 15.9; 95% CI 1.7–145.3), bowel constipation (OR: 10.9; 95% CI: 2.6–41.1), abdominal pain (OR: 5. 2; 95% CI: 1.4–20.1), jaundice and the presence of blood (in rectum or stool) (OR: 2.6; 95% CI: 1.8–3.9) (Table 1)
Unfortunately, there are no current biochemical indicators to diagnose FGIDs. Clinical practice is made according to the type, frequency, and symptom severity established in the ROME IV criteria (Rome Foundation, 2016) [41]. Considering that the symptomatic manifestations depend on the nature of each disorder [4], a deep intestinal examination and gastrointestinal history in the clinical–nutritional assessment facilitates FGID identification of patients and should be included in the protocols of care and follow-up focused on ASD patients.

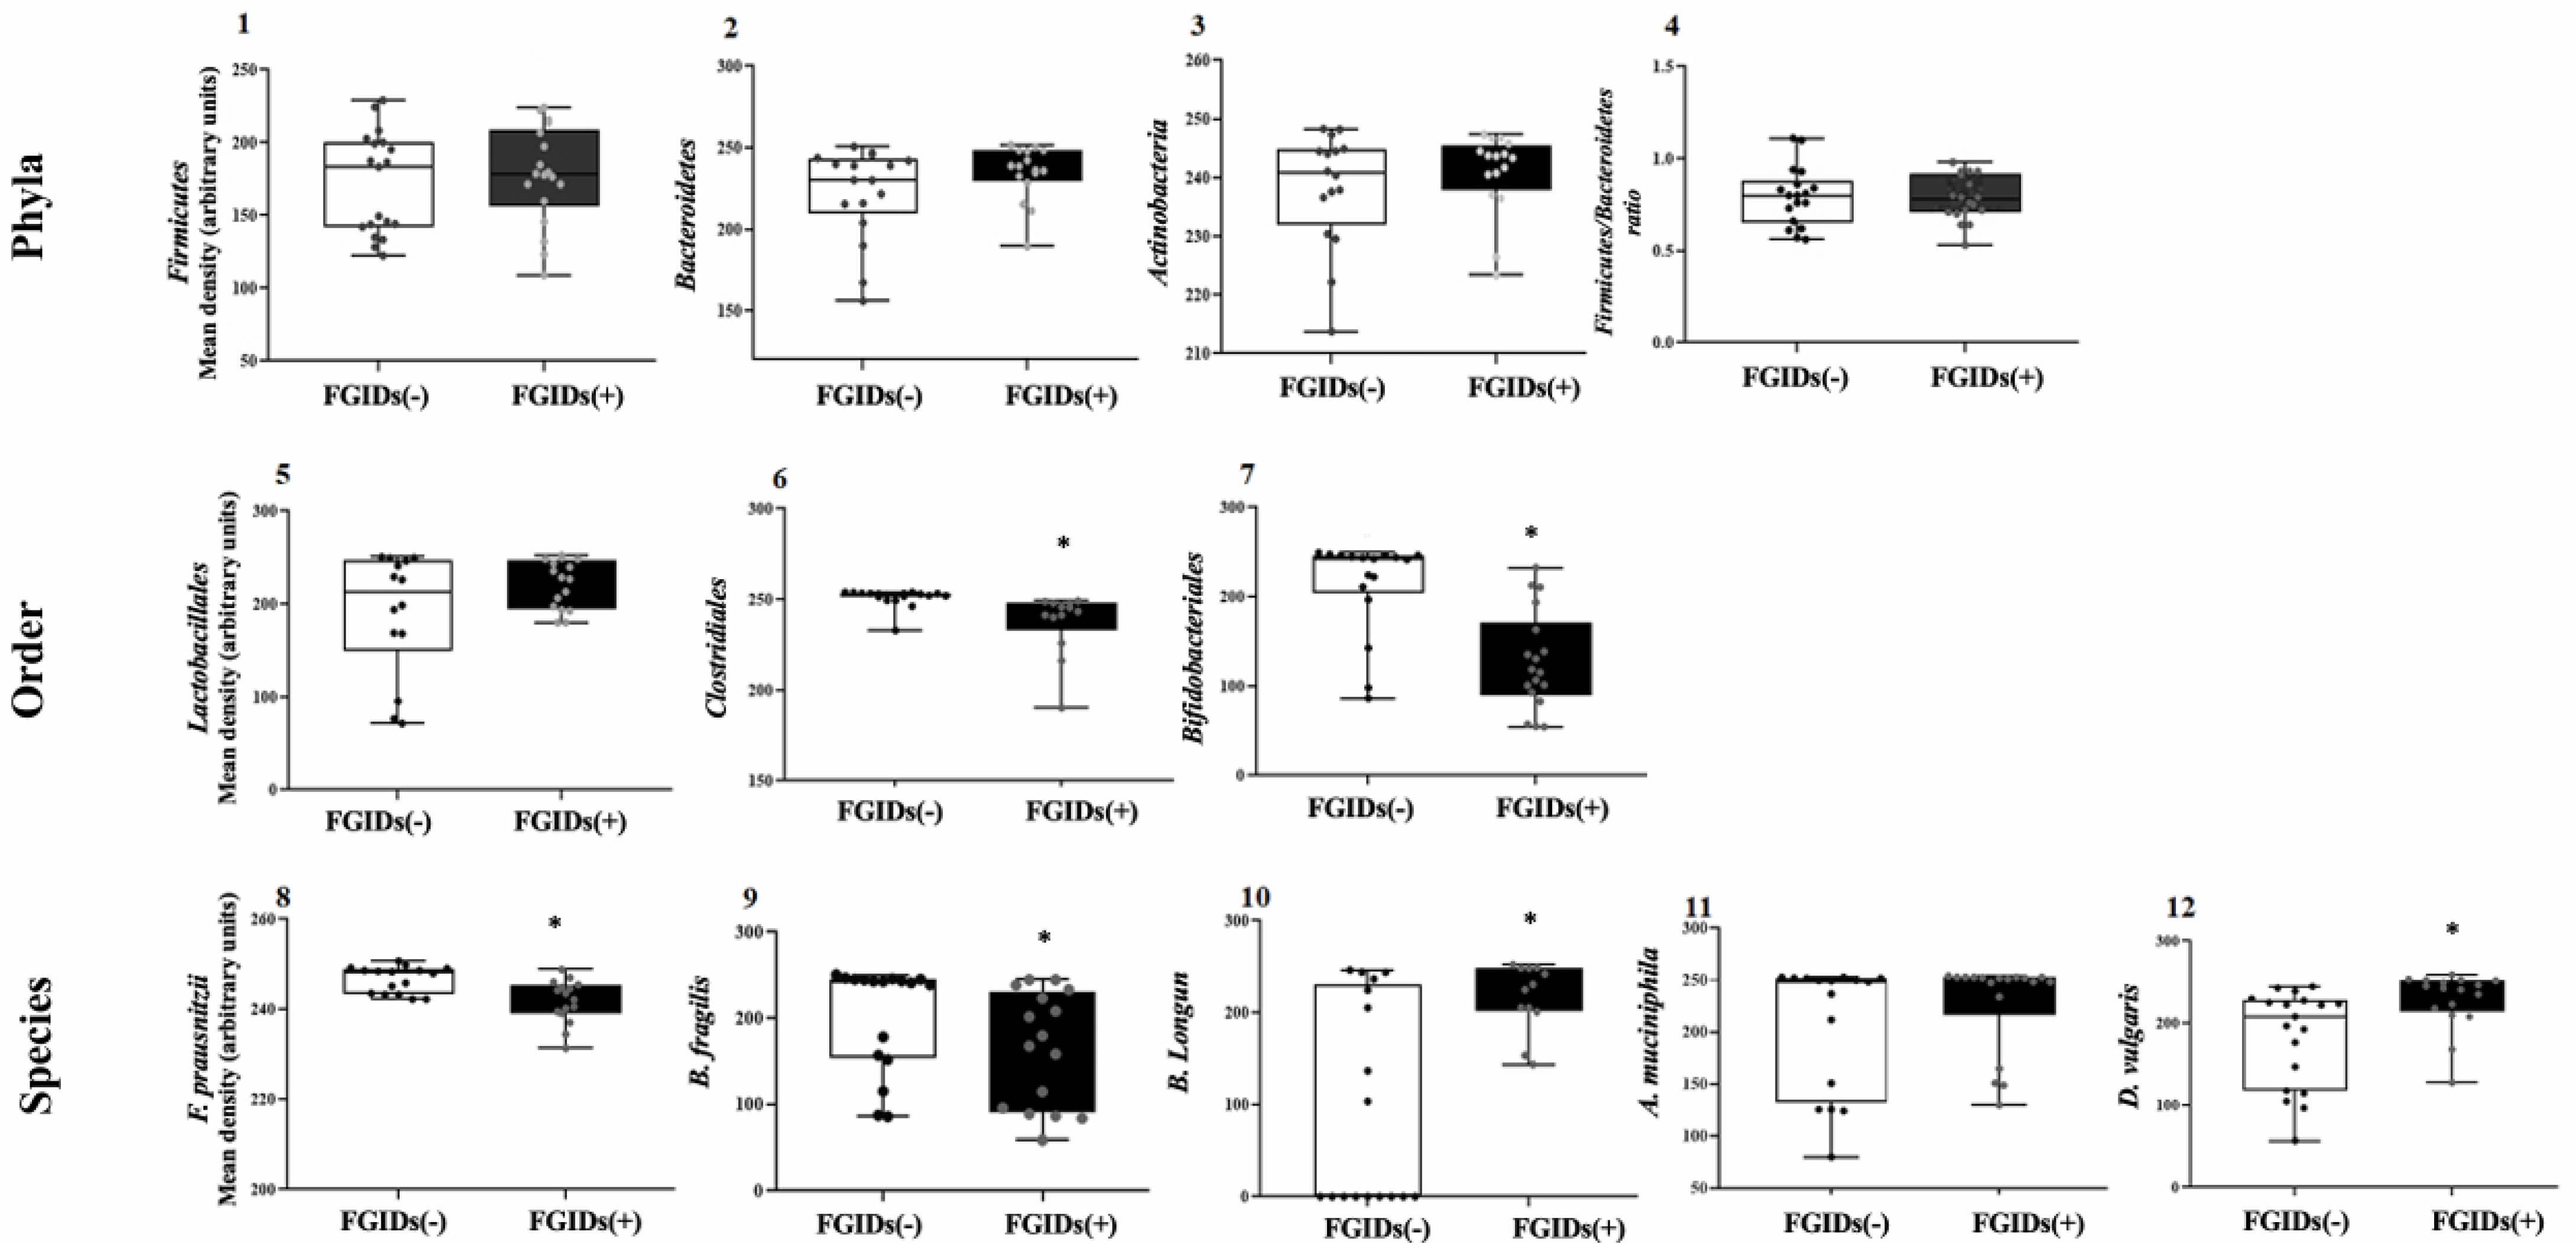
3.4. Colonic Fecal Microbiota Markers Associated with FGIDs in Autism

Three phyla (Firmicutes, Bacteroidetes, and Actinobacteria), three orders (Lactobacillales, Clostridiales, and Bifidobacteriales) and five bacterial species (F. prausnitzii, B. fragilis, B. longum, A. muciniphila, and D. vulgaris) were detected using a molecular amplification strategy with PCR in two consecutive series targeting and discriminating 16S rRNA fragments. Bacteroidetes and F. prausnitzii were present in all samples, whereas Lactobacillales and B. longum were partly detected (79% and 45% of positive samples, respectively). The others were present in at least 90% of stools. The proportions of positive/negative samples were similar in cases and controls (Fisher; p > 0.1) for all markers, except Lactobacillales, which were found more frequently in the stool of cases, relative to controls (94% vs. 67%; p = 0.049) (Supplementary Figure S1) and were associated with FGID prevalence (OR: 8.5; 95% CI: 1.132–100.4).
Children with autism have less abundant and diverse but more disproportionate microbiota than NT ones, with lower concentrations of Bifidobacterium and Firmicutes, but more enriched in Lactobacillus, Clostridium, Bacteroidetes and Desulfovibrio [12]. Considering that CFM is a complex multicellular entity constitutive of the gut (small and large) physiology [42], alterations in its composition are believed to contribute to FGID pathophysiology of ASD patients [43]. Unfortunately, there are few published studies on bacterial changes among ASD patients with different gut health states, which prompted this study.

3.5. Differences in Colonic Fecal Microbiota Markers Between Case and Control: ROME IV Stratification

The changes in phylum, order, and species abundance are shown in Figure 1. The fecal concentrations of Firmicutes, Bacteroidetes, or Actinobacteria were not different (p > 0.05) between cases and controls. However, densitometric units (Optical density-OD-) of Actinobacteria were similar to those of Bacteroidetes and visually higher than Firmicutes. In addition, the Firmicutes/Bacteroidetes ratio was statistically equal in both groups (p = 0.784) (Figure 1, panels 1–4).
Evaluation of bacterial phyla in metagenomic studies of the microbiota (rRNA 16S) has identified some general changes in structural bacterial ecosystem in CFM from patients with autism [44]. Fang et al. [21] found that the feces of autism patients were more abundant in Firmicutes and Actinobacteria, and lower in Bacteroidetes compared to NTs. Firmicutes enrichment favored ASD according to Agarwala et al. [45], although higher Actinobacteria concentrations were detected in NT and Bacteroidetes amounts were similar in both groups. These differences may correspond to methodological variations in microbiota assessment, characteristics of the subjects, and/or geographical regions where the investigations were performed.
Unfortunately, the differences between children with autism with and without FGIDs have been hardly explored. Recently, Wong et al. [46] found that the proportion of Firmicutes in the Firmicutes/Bacteroidetes ratio was higher in ASD preadolescents with FGIDs and that Actinobacteria were more abundant in those without FGIDs. Although these findings are contrary to our study, it is important to clarify that these researchers used different tools to classify FGIDs and methodologies for the CFM assessment. The ROME IV stratification does not differentiate phylum abundances between patients with and without intestinal diseases according to our findings.
Fecal enrichment of Clostridiales and Bifidobacteriales was significantly (p < 0.001) higher in the samples from the control compared to the cases. Furthermore, Lactobacillales concentrations did not vary between cases and controls (Figure 1, panels 5–7). Moreover, the high Clostridiales abundance from FGID (-) patients were consistent and uniform relative to those with FGIDs (+), while the interquartile ranges corresponding to Bifidobacteriales abundance values were exclusive between FGIDs (-) and FGIDs (+) patients. Taxonomic specificity apparently improves the methodological sensitivity to detect differential changes in the abundance of fecal colonic microbiota markers, between ASD patients with/without FGIDs. For decades, the genetic Clostridium lineage has been of great interest in medicine since several species possess infectious and pathogenic activities in the human intestine [47]. The enterotoxigenic mechanisms of pathogenic species are mediated by the production of toxins (Type A and B) that trigger immunological reactions with proinflammatory potential [48].
Patients with autism have low-risk infections, although reviews on this topic suggest a role in dysbiosis, FGIDs, and the severity of intestinal symptoms [49]. Surprisingly, in our study, the high fecal concentrations corresponded to patients without gastrointestinal diagnoses, but it could reflect lower colonization in the intestinal epithelium.
Inoue et al. [50] found higher Bifidobacteriales concentrations in the feces of NT children compared to those with autism. In addition, Wong et al. [46] reported higher enrichment of Bifidobacterium species in stool from children with ASD FGIDs (-) compared to children with FGIDs (+). Systematic reviews and meta-analyses on this topic suggest an association between Bifidobacterium and intestinal–neurological health in ASD patients, but the biochemical pathways involved in this axis have not been documented [51]. In our investigation, FGIDs (-) patients presented higher fecal abundance of Bifidobacteriales, corresponding with the protective effects reported in other studies.
The changes in the abundance of bacterial species are shown in Figure 1. The fecal concentrations of the other species were different between cases and controls (p < 0.05) unlike A. muciniphila. F. prausnitzii, B. longum, and D. vulgaris. OD values showed less interindividual variability in the case samples compared to the controls (Figure 1, panels 8–12). Chen et al. [52] reported negative correlations between fecal F. prausnitzii concentrations and 6-IGS scale total scores and degree of abdominal pain in patients with ASD, although we did not find information on F. prausnitzii concentrations in ASD patients with and without FGIDs. But the current evidence is too weak to argue for the clinical risks or benefits of F. prausnitzii on FGID symptomatology in these patients. According to our results, the fecal abundance of F. prausnitzii is a distinguishable FGID marker in ASD patients.
F. prausnitzii stands out for being the most abundant species of the microbiota in humans, also being the only one within its genus [53]; it is the main butyrate producer indicating its biological relevance [54]. In addition, it is actively involved in tryptophan metabolism required for serotonin synthesis [55], presumably related to benefits on ASD symptoms, but studies are required to prove this.
On the other hand, fecal B. fragilis concentrations were higher in samples from patients without FGIDs (Figure 1, panel 9). However, the distribution of abundance values in the interquartile ranges were overlapping in cases and controls, suggesting little predictive power over intestinal diagnoses in children with ASD. The few metagenomic studies on proportional changes in B. fragilis in the feces of children with autism and NT present discrepant results [56,57]. However, we did not find explicit information on the differences between children with autism with and without FGIDs, so further research is required on this topic.
This species (B. fragilis) influences non-digestible dietary carbohydrates’ metabolism, short-chain fatty acid (SCFA) and lactate production, and the intestinal immune system regulation [58]. However, enterotoxigenic strains of this species are related to clinically complex inflammatory pictures [59]. In autism, its probiotic effectiveness (neurological and intestinal) has only been studied in murine models [60], but its benefits in human patients are unknown.
Unlike previous species, B. longum concentrations were higher in fecal samples from patients diagnosed with FGIDs (Figure 1, panel 10); strains of this species are characterized by exerting fermentative functions and protecting the intestine from oxidative stress by providing it with lactate and reduced Niacin-Adenine dinucleotide (NADH+H) [61]. Although our results appear contradictory, we do not disregard that fecal enrichment in FGIDs patients results from adhesion loss in the intestinal epithelium and does not reflect abundance in the colonic microbiota. But studies evaluating the correlation between abundance in feces and epithelial tissue are required to confirm this hypothesis.
D. vulgaris abundance was higher in the samples corresponding to FGID patients (Figure 1, panel 12). Evidence from metagenomic studies in feces of children with autism suggests that Desulfovibrio species are more predominant than in NT children [62] and have been strongly associated with autism regression [63]. However, no studies in the literature specifically evaluated D. vulgaris presence or its contribution to the intestinal pathologies of ASD patients.
D. vulgaris genome is genetically related to Proteobacteria phylum [64]. Although present in the human intestine, it is not part of the commensal microbiota and is acquired through the ingestion of contaminated water or food. Its growth and proliferation depend on the availability of carbon, nitrogen, iron, and sulfur, which it obtains from undigested nutrients [65]. It uses H+, acetate, lactate, and alcohols for sulfate (SO4−2) reduction, resulting in the sulfide (H2S) production that exhibits cytotoxic properties in the epithelial cells [66].
A. muciniphila concentrations were the only non-differentiable marker between cases and controls (p > 0.05) in contrast to other bacterial species (Figure 1, panel 11). Wang et al. [23] first reported A. muciniphila decrease in fecal samples from ASD children compared to that of NTs. Similar reductions (~5 times) were also reported in feces from ASD patients [45]. But the therapeutic effects on TGIF and the neurological response of ASD patients have not been extensively evaluated.

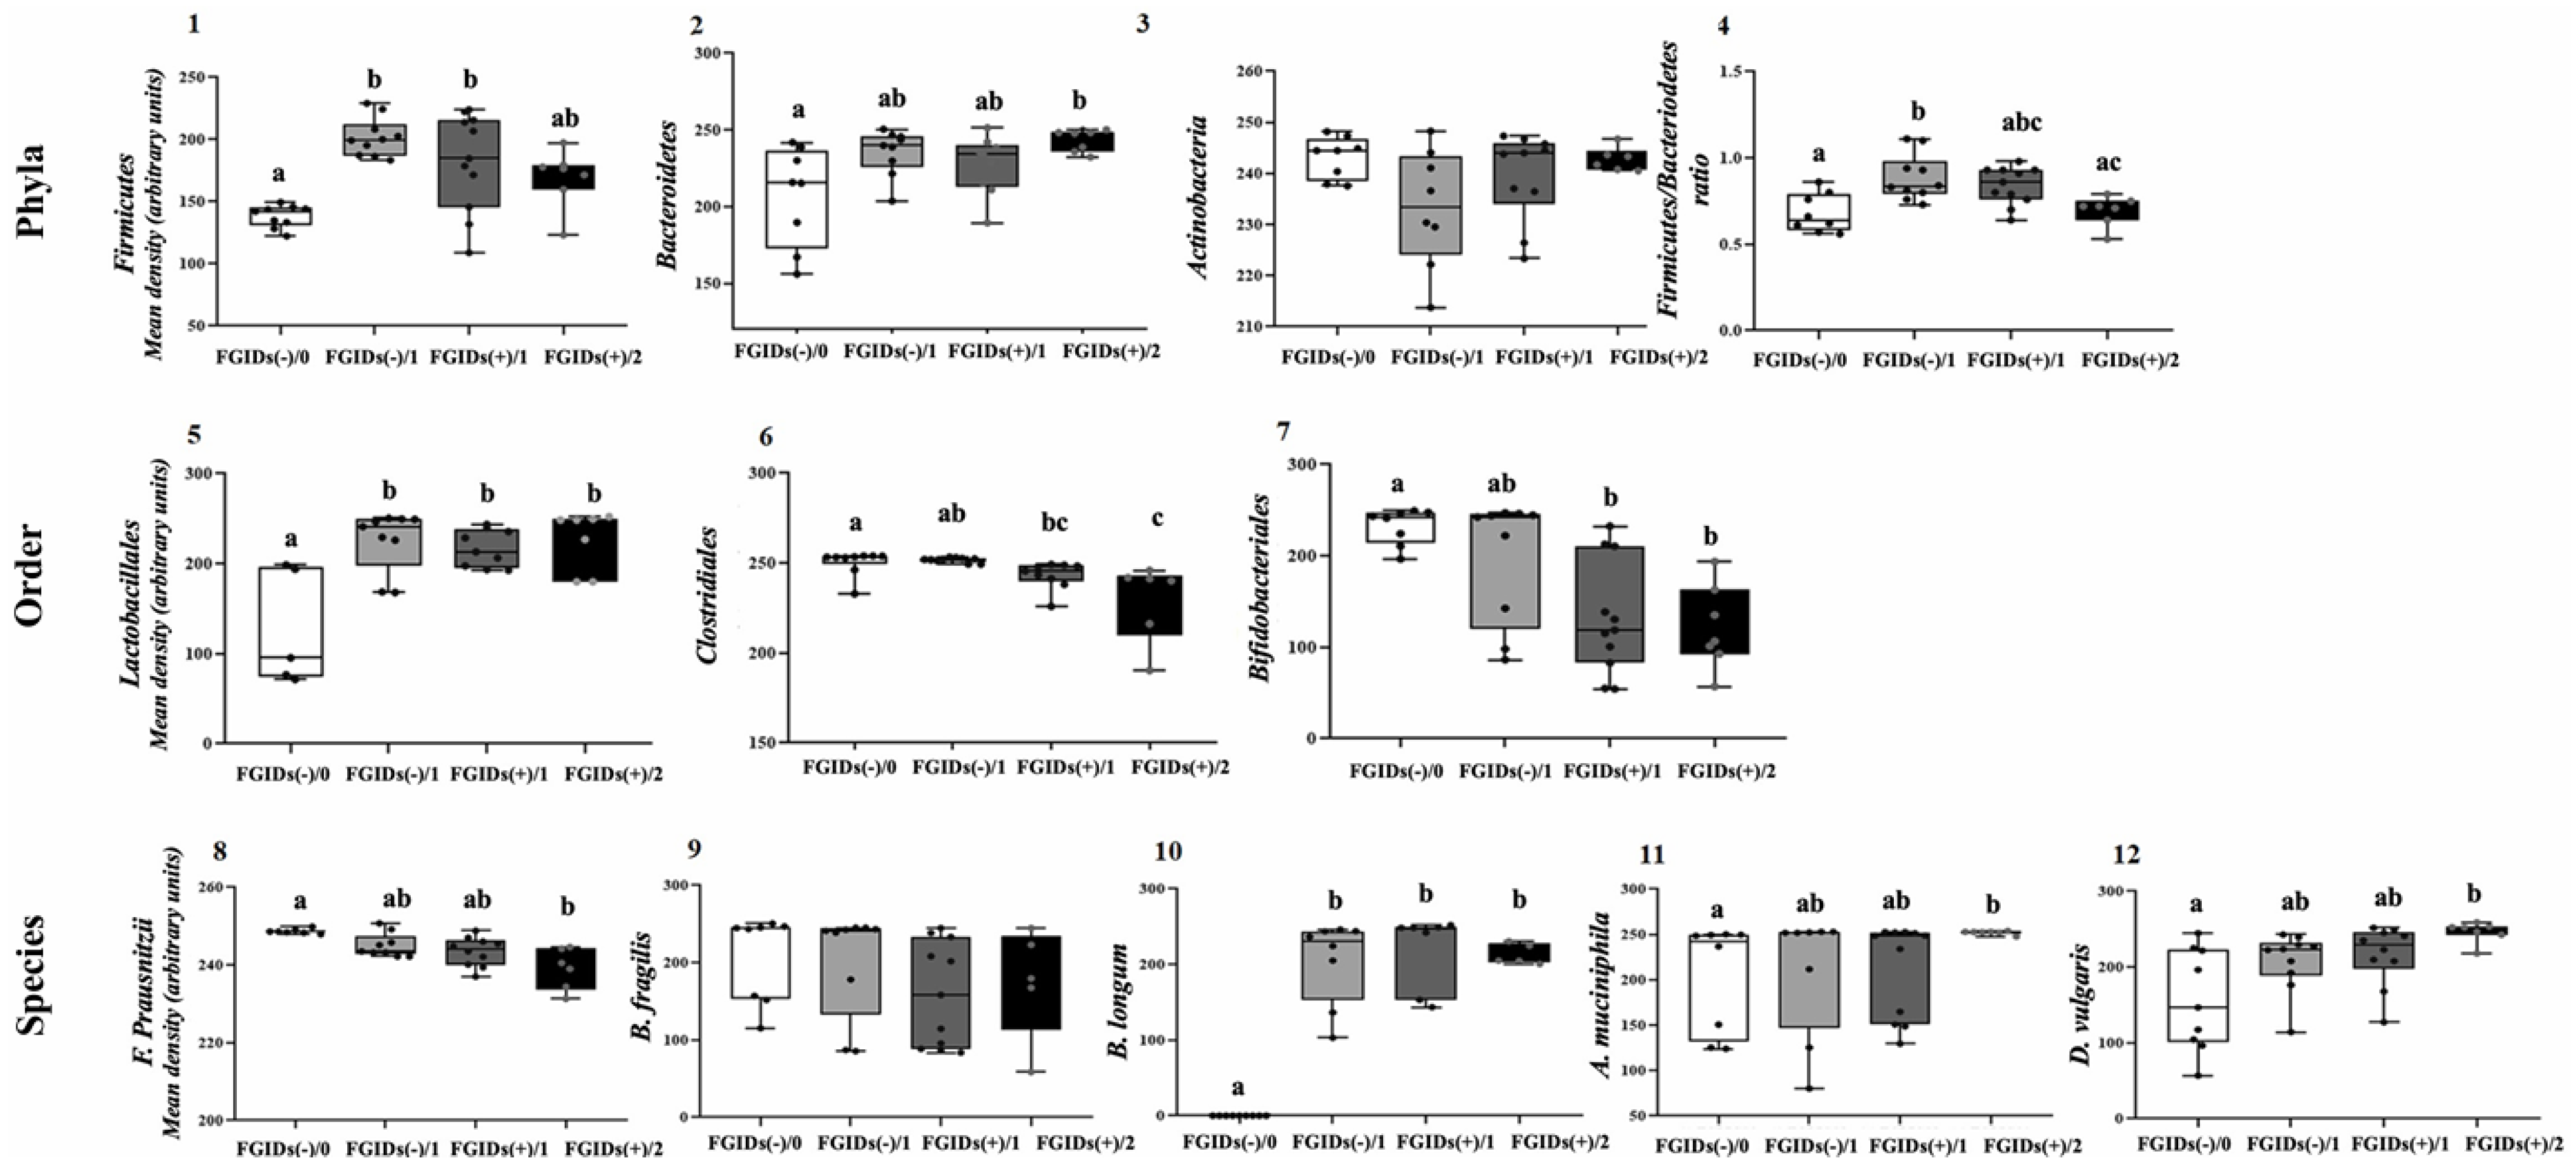
3.6. Differences in Colonic Fecal Microbiota Markers Grouped by Gastrointestinal Severity Index: ROME IV + 6-GSI Stratification

Patients in both groups (cases and controls) were subclassified according to intestinal severity levels (ROME IV + 6-GSI), as follows: (1) Without FGIDs and asymptomatic (FGIDs (-)/0; n = 9); (2) Without FGIDs and mild symptoms (FGIDs (-)/1; n = 12); (3) With FGIDs and mild symptoms (FGIDs (+)/1; n = 10); (4) With FGIDs and moderate symptoms (FGIDs (+)/2; n = 8), in order to evaluate variations in bacterial marker abundance, at more specific levels of their intestinal health (Figure 2).
Firmicutes were lower in stool from FGIDs (-)/0 patients than from mild-symptom-having patients (with/without FGIDs), but similar to that of FGIDs (+)/2. In contrast, Bacteroidetes values were higher and more homogeneous in samples from FGIDs (+)/2 patients than in those from FGIDs (-)/0 (OD = 243 ± 7.2 vs. 206.9 ± 32.5; p = 0.029). Due to these dynamics, the Firmicutes/Bacteroidetes ratio was not a discriminatory indicator of the health or disease status of ASD patients. Furthermore, fecal Actinobacteria concentrations were similar in all categories (p = 0.263).
The changes in the abundance of the bacterial orders are shown in Figure 2, panels 5–7. The stratification revealed specific differences between categories. The abundance of Clostridiales values from FGIDs (-)/0 patients were consistent and uniform in almost all samples. Lactobacillales (Firmicutes) concentration was lower and dispersed in feces from asymptomatic FGIDs (-)/0 patients (OD = 127 ± 63.6; p = 0.030), compared to other categories: FGIDs (-)/1, OD = 225 ± 33.5, FGIDs (+)/1, OD = 216.7 ± 20.5 and FGIDs (+)/2, OD = 226.4 ± 32.9; although the abundance values were similar among these categories (p > 0.3).
In contrast, Clostridiales (Firmicutes) and Bifidobacteriales (Actinobacteria) concentrations were inversely associated with the intestinal severity index (p = 0.001 and 0.04, respectively), with higher and homogeneous values in the samples of asymptomatic patients, compared to FGIDs patients, especially moderate. Even the abundance values between FGIDs (-)/0 and FGIDs (+)/2 patients were discrepant and exclusive in both markers: Clostridiales: OD = 250.4 ± 6.9 vs. 229.3 ± 20.4 (p = 0.001) and Bifidobacteriales: OD = 232.4 ± 33.5 vs. 121.4 ± 46.3 (p = 0.008). In addition, Clostridiales variability increased with increased GIS severity (Figure 2, panels 6 and 7).
As predicted, the stratification of the groups according to the ROME IV + 6-IGS classification discriminated the differences between specific categories more appropriately (Figure 2, panels 8–12):
F. prausnitzii abundance was inversely related to GIS of FGIDs, with higher and consistent values in asymptomatic patients (FGIDs (-)/0, OD = 258.7 ± 0.6), compared to those with moderate symptoms (FGIDs (+)/2, OD = 139.0 ± 5.3) (p < 0.001). Fecal concentrations of this specie increased proportionally to SGI severity (Figure 2, panel 8).
B. fragilis (Bacteroidetes) did not differ (p = 0.145) between any categories after stratifying patients according to ROME IV + 6-GIS classification (Figure 2, panel 9). This indicated that B. fragilis fecal abundance was not associated with FGIDs severity in this sample of ASD patients.
B. longum species presented a singular pattern in this investigation, as it was the only undetectable marker in all fecal samples from asymptomatic patients (FGIDs (+)/0), while the concentrations were high but similar to each other (p > 0.9) in those from ASD patients with mild (with/without FGIDs) or moderate intestinal symptoms (FGIDs (+)/2) (Figure 2, panel 10).
A. muciniphila concentrations were consistently similar in the feces of all FGIDs (+)/2 patients, whereas greater interindividual variations in abundance from the samples occurred in other categories. Statistical differences were specifically found between the feces from the healthiest (TGIF (-)/0 and the most severe intestinal symptoms (TGIF (+)/2) patients (OD = 204.3 ± 59.3 vs. 250 ± 2.0, respectively; p = 0.022) (Figure 2, Panel 11).
D. vulgaris concentrations increased with increasing gastrointestinal severity index, while the dispersion of the values of each category was inversely modified. As with the previous species, differences were found only between the FGIDs (-)/0 and FGIDs (+)/2 categories (OD 239 ± 59.3 vs. 246.3 ± 13.5; p < 0.001) (Figure 2, Panel 12).
Our results indicate that the stratification of intestinal health of ASD patients enables better discrimination of compositional changes in CFM patients with and without FGIDs through the combination of the ROME IV + 6-IGS diagnostic criteria. However, more rigorous investigations with representative samples are required to verify this hypothesis. If this approach is true, the possibilities are opened to improve the FGID clinical screening criteria through the use of bacterial markers that co-direct the confirmation of the diagnosis.
Today, understanding the complexity of the associations between CFM and the FGIDs pathogenesis in ASD children is a major challenge for researchers dedicated to this field of knowledge [67], but it is necessary to improve therapeutic interventions.
Considering that there are few studies aimed at evaluating the microbiota in ASD patients with and without FGIDs, one of the main contributions of this research to the field of knowledge was the evaluation of bacterial marker abundance in the CFM of patients with different categories of intestinal health, resulting from the unification of ROME IV + 6-IGS criteria. This methodological approach allowed us to detect differences in the fecal abundance of several bacterial markers according to the intestinal health status of 39 ASD patients from Ciudad Juarez–Chihuahua.
Due to the contrasting findings between the studies based on the NGS technologies, we speculate that these results could vary according to the specific characteristics of the patients, including geographic location, age, socioeconomic status, clinical history, dietary pattern, etc. This invites the identification of markers applicable to specific geographic regions, considering the environmental factors involved in the compositional changes in the fecal colonic microbiota of individuals living with autism.

3.7. Limitations of the Study

This research presented representative methodological weaknesses. One of them was the small sample size (n = 39), since participant recruitment was limited by family and institutional access restrictions during COVID-19. This affected the statistical power of the results. Therefore, the results of this investigation describe only the characteristics of the set of patients evaluated but not ASD patients overall.
In agreement with experimental procedures, the extraction of fecal DNA and the detection of molecular markers in the feces of these patients were performed by conventional techniques, which have lower detection sensitivity compared to next-generation sequencing technologies based on bacterial 16S rRNA gene [68]. Therefore, the results obtained are susceptible to the margins of error of the techniques used. In this study, the methodological approach was able to detect differences among specific bacterial markers, according to the gut health status of ASD patients.

4. Conclusions

This research describes the epidemiological characteristics and risk factors associated with FGIDs in a group of children and adolescents with ASD residing in Ciudad Juarez–Chihuahua (Mexico). According to our results, FGIDs are a prevalent health problem in these patients, especially functional constipation.
The risks of these diseases originate during the early stages of development, in response to intrauterine growth, cesarean delivery, and prolonged use of milk formulas. These risks have been associated with changes in the commensal microbiota and deviations in colonization patterns during early and late infancy. Low concentrations of Clostridiales, Bifidobacteriales, F. prausnitzii, and B. fragilis and high abundance of Bacteroidetes, Lactobacillales, B. longum, and D. vulgaris were good predictor markers of FGIDs, especially in those with greater impairment of their intestinal health, and they could be useful in the screening and diagnosis of FGIDs in ASD patients.

Supplementary Materials

The following supporting information can be downloaded at: https://www.mdpi.com/article/10.3390/gastroent16020015/s1, Table S1: Primers used for bacterial markers detection [69,70,71,72,73]; Table S2: Mother’s obstetric history; Figure S1: Mapping of detection of bacterial markers in fecal samples from 39 patients with ASD.

Author Contributions

Conceptualization, J.H.-M., F.J.-V. and R.C.-V.; Data curation, A.R.-J. and F.J.-V.; Formal analysis, J.H.-M. and F.J.-V.; Funding acquisition, A.W.-M. and F.J.-V.; Investigation, J.H.-M., A.W.-M. and A.F.G.-C.; Methodology, F.J.-V.; Project administration, A.W.-M. and R.C.-V.; Resources, A.F.G.-C. and F.J.-V.; Supervision, A.W.-M., A.R.-J., F.J.-V. and R.C.-V.; Validation, A.F.G.-C. and F.J.-V.; Writing—original draft, J.H.-M.; Writing—review and editing, A.W.-M. and R.C.-V. All authors have read and agreed to the published version of the manuscript.

Funding

The authors did not receive funding from any institution for the development of the study, preparation or submission of the manuscript.

Institutional Review Board Statement

This study was reviewed and approved by the Bioethics Committee of the Autonomous University of Ciudad Juarez (Authorization CIEB-2020-1-20) and was conducted in accordance with the Declaration of Helsinki [DoH; https://www.wma.net/what-we-do/medical-ethics/declaration-of-helsinki/ (accessed on 1 March 2024)] and Mexican regulations for clinical studies and biological waste handling and disposal.

Informed Consent Statement

Informed consent was obtained from all subjects involved in the study.

Data Availability Statement

The data presented in this study are available on request from the corresponding author. The data are not publicly available due to privacy reasons.

Acknowledgments

J.H.M. wishes to thank the Consejo Nacional de Humanidades Ciencias y Tecnología (CONAHCyT) for the granted doctoral scholarship (2019-000037-02NACF-21922). All authors are indebted to Association Horizonte Azul Unidos por el Autismo (Ciudad Juárez, Chihuahua, México), especially its director Gladys Durán Carrillo and the mothers/guardians of the participants for their willingness to participate.

Conflicts of Interest

The authors declare no conflicts of interest.

References

  1. American Psychological Association [APA]. Manual de Diagnóstico y Estadístico de los Trastornos Mentales (DSM-5); Editorial Médica Panamericana: Madrid, Spain, 2013. [Google Scholar]
  2. Wang, J.; Ma, B.; Wang, J.; Zhang, Z.; Chen, O. Global prevalence of autism spectrum disorder and its gastrointestinal symptoms: A systematic review and meta-analysis. Front. Psychiatry 2022, 13, 963102. [Google Scholar] [CrossRef]
  3. Madra, M.; Ringel, R.; Margolis, K.G. Gastrointestinal issues and autism spectrum disorder. Child Adolesc. Psychiatr. Clin. N. Am. 2020, 29, 501–513. [Google Scholar] [CrossRef]
  4. Drossman, D.A. Functional gastrointestinal disorders: History, pathophysiology, clinical features, and Rome IV. Gastroenterology 2016, 150, 1262–1279.e2. [Google Scholar] [CrossRef] [PubMed]
  5. Thulasi, V.; Steer, R.A.; Monteiro, I.M.; Ming, X. Overall severities of gastrointestinal symptoms in pediatric outpatients with and without autism spectrum disorder. Autism 2019, 23, 524–530. [Google Scholar] [CrossRef] [PubMed]
  6. Margolis, K.G.; Buie, T.M.; Turner, J.B.; Silberman, A.E.; Feldman, J.F.; Murray, K.F.; McSwiggan-Hardin, M.; Levy, J.; Bauman, M.L.; Veenstra-VanderWeele, J.; et al. Development of a brief parent-report screen for common gastrointestinal disorders in autism spectrum disorder. J. Autism Dev. Disord. 2018, 49, 349–362. [Google Scholar] [CrossRef]
  7. Lavelle, T.A.; Weinstein, M.C.; Newhouse, J.P.; Munir, K.; Kuhlthau, K.A.; Prosser, L.A. Economic burden of childhood autism spectrum disorders. Pediatrics 2014, 133, e520–e529. [Google Scholar] [CrossRef]
  8. Lyall, K.; Croen, L.; Daniels, J.; Fallin, M.D.; Ladd-Acosta, C.; Lee, B.K.; Park, B.Y.; Snyder, N.W.; Schendel, D.; Volk, H.; et al. The changing epidemiology of autism spectrum disorders. Annu. Rev. Public Health 2017, 38, 81–102. [Google Scholar] [CrossRef] [PubMed]
  9. Sanctuary, M.R.; Kain, J.N.; Angkustsiri, K.; German, J.B. Dietary considerations in autism spectrum disorders: The potential role of protein digestion and microbial putrefaction in the gut-brain axis. Front. Nutr. 2018, 5, 40. [Google Scholar] [CrossRef]
  10. Berding, K.; Donovan, S.M. Microbiome and nutrition in autism spectrum disorder: Current knowledge and research needs. Nutr. Rev. 2016, 74, 723–736. [Google Scholar] [CrossRef]
  11. Williams, B.L.; Hornig, M.; Buie, T.; Bauman, M.L.; Paik, M.C.; Wick, I.; Bennett, A.; Jabado, O.; Hirschberg, D.L.; Lipkin, W.I. Impaired carbohydrate digestion and transport and mucosal dysbiosis in the intestines of children with autism and gastrointestinal disturbances. PLoS ONE 2011, 6, e24585. [Google Scholar] [CrossRef]
  12. Li, Q.; Han, Y.; Dy, A.B.C.; Hagerman, R.J. The gut microbiota and autism spectrum disorders. Front. Cell. Neurosci. 2017, 11, 120. [Google Scholar] [CrossRef]
  13. Liu, F.; Li, J.; Wu, F.; Zheng, H.; Peng, Q.; Zhou, H. Altered composition and function of intestinal microbiota in autism spectrum disorders: A systematic review. Transl. Psychiatry 2019, 9, 43. [Google Scholar] [CrossRef] [PubMed]
  14. Fattorusso, A.; Di Genova, L.; Dell’Isola, G.B.; Mencaroni, E.; Esposito, S. Autism Spectrum Disorders and the Gut Microbiota. Nutrients 2019, 11, 521. [Google Scholar] [CrossRef] [PubMed]
  15. Tomova, A.; Husarova, V.; Lakatosova, S.; Bakos, J.; Vlkova, B.; Babinska, K.; Ostatnikova, D. Gastrointestinal microbiota in children with autism in Slovakia. Physiol. Behav. 2015, 138, 179–187. [Google Scholar] [CrossRef]
  16. Blesa Baviera, L.C. Trastornos digestivos funcionales pediátricos. Criterios Roma IV. Actual. Pediatría 2017, 3, 99–114. [Google Scholar]
  17. Heaton, K.W.; Radvan, J.; Cripps, H.; Mountford, R.A.; Braddon, F.E.; Hughes, A.O. Defecation frequency and timing, and stool form in the general population: A prospective study. Gut 1992, 33, 818–824. [Google Scholar] [CrossRef]
  18. Zhang, B.-W.; Li, M.; Ma, L.-C.; Wei, F.-W. A widely applicable protocol for DNA isolation from fecal samples. Biochem. Genet. 2006, 44, 494–503. [Google Scholar] [CrossRef]
  19. Green, M.R.; Sambrook, J. Isolation of high-molecular-weight DNA using organic solvents. Cold Spring Harb. Protoc. 2017, 2017, 356–359. [Google Scholar] [CrossRef]
  20. Coretti, L.; Paparo, L.; Riccio, M.P.; Amato, F.; Cuomo, M.; Natale, A.; Borrelli, L.; Corrado, G.; De Caro, C.; Comegna, M.; et al. Gut microbiota features in young children with autism spectrum disorders. Front. Microbiol. 2018, 9, 3146. [Google Scholar] [CrossRef]
  21. Ye, F.; Gao, X.; Wang, Z.; Cao, S.; Liang, G.; He, D.; Lv, Z.; Wang, L.; Xu, P.; Zhang, Q. Comparison of gut microbiota in autism spectrum disorders and neurotypical boys in China: A case-control study. Synth. Syst. Biotechnol. 2021, 6, 120–126. [Google Scholar] [CrossRef]
  22. Fitzgerald, C.B.; Shkoporov, A.N.; Sutton, T.D.S.; Chaplin, A.V.; Velayudhan, V.; Ross, R.P.; Hill, C. Comparative analysis of Faecalibacterium prausnitzii genomes shows a high level of genome plasticity and warrants separation into new species-level taxa. BMC Genom. 2018, 19, 931. [Google Scholar] [CrossRef] [PubMed]
  23. Wang, L.; Christophersen, C.T.; Sorich, M.J.; Gerber, J.P.; Angley, M.T.; Conlon, M.A. Low relative abundances of the mucolytic bacterium Akkermansia muciniphila and Bifidobacterium spp. in feces of children with autism. Appl. Environ. Microbiol. 2011, 77, 6718–6721. [Google Scholar] [CrossRef]
  24. Herrera-Mejía, J.; Campos-Vega, R.; Wall-Medrano, A.; Jiménez-Vega, F. A Two-Step single plex PCR method for evaluating key colonic microbiota markers in young Mexicans with autism spectrum disorders: Protocol and pilot epidemiological application. Diagnostics 2023, 13, 2387. [Google Scholar] [CrossRef]
  25. Adams, J.B.; Johansen, L.J.; Powell, L.D.; Quig, D.; Rubin, R.A. Gastrointestinal flora and gastrointestinal status in children with autism–comparisons to typical children and correlation with autism severity. BMC Gastroenterol. 2011, 11, 22. [Google Scholar] [CrossRef] [PubMed]
  26. Leader, G.; Abberton, C.; Cunningham, S.; Gilmartin, K.; Grudzien, M.; Higgins, E.; Joshi, L.; Whelan, S.; Mannion, A. Gastrointestinal symptoms in autism spectrum disorder: A systematic review. Nutrients 2022, 14, 1471. [Google Scholar] [CrossRef] [PubMed]
  27. Deng, W.; Wang, S.; Li, F.; Wang, F.; Xing, Y.P.; Li, Y.; Lv, Y.; Ke, H.; Li, Z.; Lv, P.J.; et al. Gastrointestinal symptoms have a minor impact on autism spectrum disorder and associations with gut microbiota and short-chain fatty acids. Front. Microbiol. 2022, 13, 1000419. [Google Scholar] [CrossRef]
  28. Wingate, M.S.; Epstein, A.E.; Bello, F.O. Perinatal Epidemiology. In International Encyclopedia of Public Health; Academic Press: Cambridge, MA, USA, 2017; pp. 442–448. [Google Scholar] [CrossRef]
  29. Lyall, K.; Schmidt, R.J.; Hertz-Picciotto, I. Maternal lifestyle and environmental risk factors for autism spectrum disorders. Int. J. Epidemiol. 2014, 43, 443–464. [Google Scholar] [CrossRef]
  30. Yong, Z.; Dou, Y.; Gao, Y.; Xu, X.; Xiao, Y.; Zhu, H.; Li, S.; Yuan, B. Prenatal, perinatal, and postnatal factors associated with autism spectrum disorder cases in Xuzhou, China. Transl. Pediatr. 2021, 10, 635–646. [Google Scholar] [CrossRef]
  31. Sandall, J.; Tribe, R.M.; Avery, L.; Mola, G.; Visser, G.H.; Homer, C.S.; Gibbons, D.; Kelly, N.M.; Kennedy, H.P.; Kidanto, H.; et al. Short-term and long-term effects of caesarean section on the health of women and children. Lancet 2018, 392, 1349–1357. [Google Scholar] [CrossRef]
  32. Hoang, D.M.; Levy, E.I.; Vandenplas, Y. The impact of Caesarean section on the infant gut microbiome. Acta Paediatr. 2021, 110, 60–67. [Google Scholar] [CrossRef]
  33. Zhang, C.; Li, L.; Jin, B.; Xu, X.; Zuo, X.; Li, Y.; Li, Z. The Effects of Delivery Mode on the Gut Microbiota and Health: State of Art. Front. Microbiol. 2021, 12, 724449. [Google Scholar] [CrossRef] [PubMed]
  34. Fabiano, V.; Indrio, F.; Verduci, E.; Calcaterra, V.; Pop, T.L.; Mari, A.; Zuccotti, G.V.; Cokugras, F.C.; Pettoello-Mantovani, M.; Goulet, O. Term infant formulas influencing gut microbiota: An overview. Nutrients 2021, 13, 4200. [Google Scholar] [CrossRef] [PubMed]
  35. Bellani, M.; Calderoni, S.; Muratori, F.; Brambilla, P. Brain anatomy of autism spectrum disorders II. Focus on amygdala. Epidemiol. Psychiatr. Sci. 2013, 22, 309–312. [Google Scholar] [CrossRef]
  36. Nishi, M.; Miyake, H.; Akashi, H.; Shimizu, H.; Tateyama, H.; Chaki, R.; Tsukuda, H.; Nomura, H.; Hatanaka, Y.; Nishi, M. An index for proportion of head size to body mass during infancy college. J. Child Neurol. 1992, 7, 400–403. [Google Scholar] [CrossRef] [PubMed]
  37. Goldstein, A.M.; Hofstra, R.M.W.; Burns, A.J. Building a brain in the gut: Development of the enteric nervous system. Clin. Genet. 2013, 83, 307–316. [Google Scholar] [CrossRef]
  38. Martin, C.R.; Ling, P.-R.; Blackburn, G.L. Review of infant feeding: Key features of breast milk and infant formula. Nutrients 2016, 8, 279. [Google Scholar] [CrossRef]
  39. Ma, J.; Li, Z.; Zhang, W.; Zhang, C.; Zhang, Y.; Mei, H.; Zhuo, N.; Wang, H.; Wang, L.; Wu, D. Comparison of gut microbiota in exclusively breast-fed and formula-fed babies: A study of 91 term infants. Sci. Rep. 2020, 10, 15792. [Google Scholar] [CrossRef]
  40. Laursen, M.F. Gut Microbiota Development: Influence of Diet from Infancy to Toddlerhood. Ann. Nutr. Metab. 2021, 77, 21–34. [Google Scholar] [CrossRef]
  41. ROME IV Diagnostic Criteria Disorders of Gut-Brain Interaction (DGBI); Rome Foundation: Rome, Italy, 2016.
  42. Rinninella, E.; Raoul, P.; Cintoni, M.; Franceschi, F.; Miggiano, G.A.D.; Gasbarrini, A.; Mele, M.C. What is the healthy gut microbiota composition? A changing ecosystem across age, environment, diet, and diseases. Microorganisms 2019, 7, 14. [Google Scholar] [CrossRef]
  43. Rose, D.R.; Yang, H.; Serena, G.; Sturgeon, C.; Ma, B.; Careaga, M.; Hughes, H.K.; Angkustsiri, K.; Rose, M.; Hertz-Picciotto, I.; et al. Differential immune responses and microbiota profiles in children with autism spectrum disorders and co-morbid gastrointestinal symptoms. Brain Behav. Immun. 2018, 70, 354–368. [Google Scholar] [CrossRef]
  44. Xu, M.; Xu, X.; Li, J.; Li, F. Association between gut microbiota and autism spectrum disorder: A systematic review and meta-analysis. Front. Psychiatry 2019, 10, 473. [Google Scholar] [CrossRef] [PubMed]
  45. Agarwala, S.; Naik, B.; Ramachandra, N.B. Mucosa-associated specific bacterial species disrupt the intestinal epithelial barrier in the autism phenome. Brain Behav. Immun.-Health 2021, 15, 100269. [Google Scholar] [CrossRef] [PubMed]
  46. Wong, O.W.H.; Lam, A.M.W.; Or, B.P.N.; Mo, F.Y.M.; Shea, C.K.S.; Lai, K.Y.C.; Ma, S.L.; Hung, S.F.; Chan, S.; Kwong, T.N.Y.; et al. Disentangling the relationship of gut microbiota, functional gastrointestinal disorders and autism: A case–control study on prepubertal Chinese boys. Sci. Rep. 2022, 12, 10659. [Google Scholar] [CrossRef]
  47. Borriello, S. Clostridial disease of the gut. Clin. Infect. Dis. 1995, 20, S242–S250. [Google Scholar] [CrossRef]
  48. Uzal, F.A.; Navarro, M.A.; Li, J.; Freedman, J.C.; Shrestha, A.; McClane, B.A. Comparative pathogenesis of enteric clostridial infections in humans and animals. Anaerobe 2018, 53, 11–20. [Google Scholar] [CrossRef]
  49. Hughes, H.K.; Rose, D.; Ashwood, P. The gut microbiota and dysbiosis in autism spectrum disorders. Curr. Neurol. Neurosci. Rep. 2018, 18, 81. [Google Scholar] [CrossRef] [PubMed]
  50. Inoue, R.; Sakaue, Y.; Sawai, C.; Sawai, T.; Ozeki, M.; Romero-Pérez, G.A.; Tsukahara, T. A preliminary investigation on the relationship between gut microbiota and gene expressions in peripheral mononuclear cells of infants with autism spectrum disorders. Biosci. Biotechnol. Biochem. 2016, 80, 2450–2458. [Google Scholar] [CrossRef]
  51. He, X.; Liu, W.; Tang, F.; Chen, X.; Song, G. Effects of probiotics on autism spectrum disorder in children: A systematic review and meta-analysis of clinical trials. Nutrients 2023, 15, 1415. [Google Scholar] [CrossRef]
  52. Chen, Z.; Shi, K.; Liu, X.; Dai, Y.; Liu, Y.; Zhang, L.; Du, X.; Zhu, T.; Yu, J.; Fang, S.; et al. Gut microbial profile is associated with the severity of social impairment and IQ performance in children with autism spectrum disorder. Front. Psychiatry 2021, 12, 789864. [Google Scholar] [CrossRef]
  53. Lopez-Siles, M.; Duncan, S.H.; Garcia-Gil, L.J.; Martinez-Medina, M. Faecalibacterium prausnitzii: From microbiology to diagnostics and prognostics. ISME J. 2017, 11, 841–852. [Google Scholar] [CrossRef]
  54. Gilbert, J.A.; Krajmalnik-Brown, R.; Porazinska, D.L.; Weiss, S.J.; Knight, R. Towards effective probiotics for autism and other mental disorders? Cell 2013, 155, 1446–1448. [Google Scholar] [CrossRef] [PubMed]
  55. Ding, X.; Xu, Y.; Zhang, X.; Zhang, L.; Duan, G.; Song, C.; Li, Z.; Yang, Y.; Wang, Y.; Wang, X.; et al. Gut microbiota changes in patients with autism spectrum disorders. J. Psychiatr. Res. 2020, 129, 149–159. [Google Scholar] [CrossRef]
  56. De Angelis, M.; Piccolo, M.; Vannini, L.; Siragusa, S.; De Giacomo, A.; Serrazzanetti, D.I.; Cristofori, F.; Guerzoni, M.E.; Gobbetti, M.; Francavilla, R. Fecal microbiota and metabolome of children with autism and pervasive developmental disorder not otherwise specified. PLoS ONE 2013, 8, e76993. [Google Scholar] [CrossRef] [PubMed]
  57. Zou, R.; Xu, F.; Wang, Y.; Duan, M.; Guo, M.; Zhang, Q.; Zhao, H.; Zheng, H. Changes in the Gut Microbiota of Children with Autism Spectrum Disorder. Autism Res. 2020, 13, 1614–1625. [Google Scholar] [CrossRef]
  58. Elsaghir, H.; Reddy Reddivari, A.K. Bacteroides Fragilis. In StatPearls; StatPearls Publishing: Treasure Island, FL, USA, 2021. Available online: https://www.ncbi.nlm.nih.gov/books/NBK553032/ (accessed on 1 March 2024).
  59. Zamani, S.; Shariati, S.H.; Zali, M.R.; Aghdaei, H.A.; Asiabar, A.S.; Bokaie, S.; Nomanpour, B.; Sechi, L.A.; Feizabadi, M.M. Detection of enterotoxigenic Bacteroides fragilis in patients with ulcerative colitis. Gut Pathog. 2017, 9, 53. [Google Scholar] [CrossRef] [PubMed]
  60. Lin, T.-L.; Lu, C.-C.; Chen, T.-W.; Huang, C.-W.; Lu, J.-J.; Lai, W.-F.; Wu, T.-S.; Lai, C.-H.; Lai, H.-C.; Chen, Y.-L. Amelioration of maternal immune activation-induced autism relevant behaviors by gut commensal Parabacteroides goldsteinii. Int. J. Mol. Sci. 2022, 23, 13070. [Google Scholar] [CrossRef]
  61. Yao, S.; Zhao, Z.; Wang, W.; Liu, X. Bifidobacterium longum: Protection against inflammatory bowel disease. J. Immunol. Res. 2021, 2021, 8030297. [Google Scholar] [CrossRef]
  62. Srikantha, P.; Mohajeri, M.H. The possible role of the microbiota-gut-brain-axis in autism spectrum disorder. Int. J. Mol. Sci. 2019, 20, 2115. [Google Scholar] [CrossRef]
  63. Finegold, S.M. Desulfovibrio species are potentially important in regressive autism. Med. Hypotheses 2011, 77, 270–274. [Google Scholar] [CrossRef]
  64. Luo, Y.; Lan, C.; Li, H.; Ouyang, Q.; Kong, F.; Wu, A.; Ren, Z.; Tian, G.; Cai, J.; Yu, B.; et al. Rational consideration of Akkermansia muciniphila targeting intestinal health: Advantages and challenges. npj Biofilms Microbiomes 2022, 8, 81. [Google Scholar] [CrossRef]
  65. Clark, M.E.; He, Z.; Redding, A.M.; Joachimiak, M.P.; Keasling, J.D.; Zhou, J.Z.; Arkin, A.P.; Mukhopadhyay, A.; Fields, M.W. Transcriptomic and proteomic analyses of Desulfovibrio vulgaris biofilms: Carbon and energy flow contribute to the distinct biofilm growth state. BMC Genom. 2012, 13, 138. [Google Scholar] [CrossRef] [PubMed]
  66. Heidelberg, J.F.; Seshadri, R.; Haveman, S.A.; Hemme, C.L.; Paulsen, I.T.; Kolonay, J.F.; Eisen, J.A.; Ward, N.; Methe, B.; Brinkac, L.M.; et al. The genome sequence of the anaerobic, sulfate-reducing bacterium Desulfovibrio vulgaris Hildenborough. Nat. Biotechnol. 2004, 22, 554–559. [Google Scholar] [CrossRef] [PubMed]
  67. Monteiro, M.A.; dos Santos, A.A.A.; Gomes, L.M.M.; Rito, R.V.V.F. Autism spectrum disorder: A systematic review about nutritional interventions. Rev. Paul. Pediatr. 2020, 38, e2018262. [Google Scholar] [CrossRef]
  68. Hert, D.G.; Fredlake, C.P.; Barron, A.E. Advantages and limitations of next-generation sequencing technologies: A Comparison of electrophoresis and non-electrophoresis methods. Electrophoresis 2008, 29, 4618–4626. [Google Scholar] [CrossRef] [PubMed]
  69. Guo, X.; Xia, X.; Tang, R.; Zhou, J.; Zhao, H.; Wang, K. Development of a real-time PCR method for Firmicutes and Bacteroidetes in faeces and its application to quantify intestinal population of obese and lean pigs. Lett. Appl. Microbiol. 2008, 47, 367–373. [Google Scholar] [CrossRef] [PubMed]
  70. Yang, Y.W.; Chen, M.K.; Yang, B.Y.; Huang, X.J.; Zhang, X.R.; He, L.Q.; Zhang, J.; Hua, Z.C. Use of 16S rRNA Gene-Targeted Group-Specific Primers for Real-Time PCR Analysis of Predominant Bacteria in Mouse Feces. Appl. Environ. Microbiol. 2015, 81, 6749–6756. [Google Scholar] [CrossRef] [PubMed] [PubMed Central]
  71. Delroisse, J.M.; Boulvin, A.L.; Parmentier, I.; Dauphin, R.D.; Vandenbol, M.; Portetelle, D. Quantification of Bifidobacterium spp. and Lactobacillus spp. in rat fecal samples by real-time PCR. Microbiol. Res. 2008, 163, 663–670. [Google Scholar] [CrossRef] [PubMed]
  72. Rodríguez-Lara, A.; Plaza-Díaz, J.; López-Uriarte, P.; Vázquez-Aguilar, A.; Reyes-Castillo, Z.; Álvarez-Mercado, A.I. Fiber Consumption Mediates Differences in Several Gut Microbes in a Subpopulation of Young Mexican Adults. Nutrients 2022, 14, 1214. [Google Scholar] [CrossRef] [PubMed] [PubMed Central]
  73. Matsuki, T.; Watanabe, K.; Tanaka, R.; Fukuda, M.; Oyaizu, H. Distribution of bifidobacterial species in human intestinal microflora examined with 16S rRNA-gene-targeted species-specific primers. Appl. Environ. Microbiol. 1999, 65, 4506–4512. [Google Scholar] [CrossRef] [PubMed] [PubMed Central]
Figure 1. Differences in eleven colonic microbiota (CM) markers in young ASD Mexicans with FGIDs (+) and without FGIDs (-). Phyla (1–4), order (5–7) and species (8–12). (1) Firmicutes, (2) Bacteroidetes, (3) Actinobacteria, (4) Firmicutes/Bacteroidetes ratio, (5) Lactobacillales, (6) Clostridiales, (7) Bifidobacteriales, (8) F. prausnitzii, (9) B. fragilis, (10) B. longum, (11) A. muciniphila and (12) D. vulgaris. Each box plot extends from the 25th–75th percentile, median value (inner horizontal line), and whiskers (dots) show the highest and lowest values (excluding outliers. * indicate statistical differences (p < 0.05; MannWhitney U test).
Gastroent 16 00015 g001
Figure 2. Differences in eleven colonic microbiota (CM) markers in Mexicans children with autism with FGIDs (+)/without FGIDs (-) and different severity states Phyla (1–4), order (5–7) and species (8–12). (1) Firmicutes, (2) Bacteroidetes, (3) Actinobacteria, (4) Firmicutes/Bacteroidetes ratio, (5) Lactobacillales, (6) Clostridiales, (7) Bifidobacteriales, (8) F. prausnitzii, (9) B. fragilis, (10) B. longum, (11) A. muciniphila and (12) D. vulgaris. Each box plot extends from the 25th–75th percentile, median value (inner horizontal line), and whiskers (dots) show the highest and lowest values (excluding outliers). Different superscript letters indicate statistical differences (p < 0.05; Kruskal Wallis test). ROME IV + 6-GIS categories: FGIDs(-)/0 = Without FGIDs and asymptomatic (reference); FGIDs(-)/1 = Without FGIDs and mild symptoms; FGIDs(+)/1 = With FGIDs and mild symptoms and FGIDs(+)/2 = With FGIDs and moderate symptoms.
Gastroent 16 00015 g002
Table 1. Descriptive data of participants.
FGID (-)FGID (+)p Value
Subjects (n)n = 21n = 18-
Age (years)9.7 ± 4.110.8 ± 4.50.761
Gender (n) 0.711
  Male16 (77%)15 (83%)
  Female5 (23%)3 (17%)
Health services (n) 0.423
  Yes14 (67%)16 (89%)
  No7 (33%)2 (11%)
Type of delivery (n) 0.031
  Vaginal10 (48%)5 (27%)
  Cesarean11 (52%)13 (73%)
Size at birth (cm)49.1 ± 5.054.1 ± 5.90.034
Duration of formula feeding (months)18.5 ± 17.623.9 ± 19.00.028
ROME IV diagnostic (n) 0.00
  None18 (100%)-
  Diarrhea-1 (5%)
  Constipation-14 (78%)
  Irritable bowel syndrome + Constipation-3 (17%)
Gastrointestinal severity index (value)2.1 (±1.0)4.6 (±1.7)0.014
Gastrointestinal symptoms
(last month) (n)
  Gas/Flatulence10 (48%)13 (72%)0.043
  Bowel constipation4 (19%)13 (72%)0.001
  Abdominal pain310 (56%)0.010
  Rectal pain07 (39%)0.006
  Jaundice02 (11%)0.036
  Bloody stools02 (11%)0.036
Autistic severity (value)32.5 (±1.2)34.5 (±1.1)0.565
All variables were compared according to FGID diagnosis (ROMA IV (-/+) criteria). Proportional differences (%) were evaluated by Chi-square test. Quantitative variables (mean ± standard deviation) were analyzed with Student’s t-tests. Statistical differences (p values ≤ 0.05) were highlighted in bold.
Table 2. Sociodemographic characteristics and birth information of ASD patients.
VariablesTotal
(n = 39)
FGID (-) (n = 21)FGID (+) (n = 18)p Value *
Caregiver age (years)37.6 ± 8.338.2 ± 8.037.5 ± 8.80.88
Birth weight (g)3046 ± 0.693005 ± 0.583388 ± 0.670.78
Duration of lactation (months)4.2 ± 5.75.5 ± 6.52.9 ± 3.80.13
(n, %)
Caregiver sex
  Male4 (10)2 (9.5)2 (11)
  Female35 (90)19 (90.5)16 (89)0.81
Caregiver education level 0.02 *
  Primary4 (10)0 (0)4 (23)
  Secondary8 (20)2 (9.5)6 (33)
  High school15 (39)9 (43)6 (33)
  Technical//Bachelor’s degree10 (26)9 (43)1 (5.5)
  Postgraduate2 (5)1 (4.5)1 (5.5)
Patient education status 0.45
  Schooled30 (77)15 (71)15 (83)
  Unschooled9 (33)6 (29)3 (17)
Birth weight classification (WHO) 0.67
  Low (1500–2499 g)3 (8)1 (4.5)2 (11)
  Insufficient (2500–2999 g)9 (23)7 (33.5)2 (11)
  Adequate (3000–3999 g)24 (61)13 (62)11 (61)
  Macrosomia (≥4000 g)3 (8)0 (0)3 (17)
Oxygen requirement at birth 0.42
  Yes4 (10)1 (5)3 (17)
  No35 (90)20 (95)15 (83)
Incubation at birth 0.07
  Yes6 (15)2 (9.5)4 (22)
  No33 (85)19 (90.5)14 (72)
All variables were analyzed in the complete sample and compared according to FGID diagnosis (ROMA IV criteria -/+). Proportional differences (%) of categorical variables were evaluated by Chi-square test. Quantitative variables are presented as mean ± standard deviation (SD) and analyzed with Student’s t-tests. * Statistical differences (p values ≤ 0.05).
Table 3. Patients’ medical history and health antecedents.
ComorbidityTotal
(n = 39)
FGID (-) (n = 21)FGID (+) (n = 18)OR
(CI 95%)
p Value *
(n, %)
Respiratory infections17 (43.6)7 (33.3)10 (55.6)2.67
(0.919–8.859)
0.302
Sleep disorders14 (35.9)8 (38.3)6 (33.3)0.99
(0.255–1.473)
0.347
Intestinal infections13 (33.3)5 (26.9)6 (33.3)1.36
(0.367–5.021)
0.876
Abdominal distension12 (31.8)5 (23.8)7 (38.9)1.72
(0.478–6.238)
0.402
Diarrheal stools12 (31.8)5 (23.8)7 (38.9)1.72
(0.478–6.238)
0.402
Hospitalizations12 (30.8)6 (28.6)6 (33.3)1.12
(0.311–4.071)
0.831
Urinary infections12 (30.8)7 (33.3)5 (27.8)0.84
(0.320–2.280)
0.811
Epilepsy8 (20.5)4 (19.0)4 (22.2)1.11
(0.246–3.111)
0.947
Dehydration7 (17.9)4 (19.0)3 (16.7)0.98
(0.112–1.981)
0.712
Changes in stool frequency7 (17.9)2 (19.2)5 (27.8)1.61
(0.391–6.680)
0.506
Inappetence6 (15.4)3 (14.2)3 (16.7)1.00
(0.215–5.640)
0.909
Low heigh6 (15.4)2 (9.5)4 (22.2)1.72
(0.426–11.267)
0.341
Diarrheal stools5 (12.8)3 (14.2)2 (11.1)0.98
(0.397–1.800)
0.201
Otitis5 (12.8)1 (4.8)4 (22.2)5.12
(0.996–25.989)
0.050
Asthma5 (12.8)3 (14.2)2 (11.1)0.96
(0.308–2.484)
0.565
Anemia4 (10.2)2 (9.5)2 (11.1)1.01
(0.292–2.163)
0.578
Undernutrition2 (5.1)1 (4.8)1 (5.6)1.56
(0.186–2.137)
0.149
The health history of total sample was analyzed and compared according to FGID diagnosis (ROMA IV criteria -/+). The prevalence was listed from highest to lowest (in the total sample). Odds ratio (OR) calculation and the exact Fisher’s test were conducted for evaluating risk factors of FGID. * Statistical differences: p values ≤ 0.05.
Disclaimer/Publisher’s Note: The statements, opinions and data contained in all publications are solely those of the individual author(s) and contributor(s) and not of MDPI and/or the editor(s). MDPI and/or the editor(s) disclaim responsibility for any injury to people or property resulting from any ideas, methods, instructions or products referred to in the content.

