Article

Point Shear Wave Elastography and 2-Dimensional Shear Wave Elastography as a Non-Invasive Method in Differentiating Benign from Malignant Liver Lesions

by
Emiliya Lyubomirova Nacheva-Georgieva
1,*,
Daniel Ilianov Doykov
1,
Vladimir Nikolov Andonov
1,
Katya Angelova Doykova
2 and
Silviya Bogdanova Tsvetkova
2
1
Second Department of Internal Diseases, Section of Gastroenterology, Medical University of Plovdiv, 4000 Plovdiv, Bulgaria
2
Department of Radiology, Medical University of Plovdiv, 4000 Plovdiv, Bulgaria
*
Author to whom correspondence should be addressed.
Gastroenterol. Insights 2022, 13(3), 296-304; https://doi.org/10.3390/gastroent13030030
Submission received: 15 August 2022 / Revised: 30 August 2022 / Accepted: 5 September 2022 / Published: 10 September 2022
(This article belongs to the Special Issue Novelties in Diagnostics and Therapeutics in Hepatology)

Abstract

:
Non-invasive, ultrasound-based methods for visualizing and measuring tissue elasticity are becoming more and more common in routine daily practice. An accurate diagnosis of malignant and benign tumors is essential for determining the appropriate treatment. Despite the wide use of imaging techniques, the investigation for assessing the elasticity of focal liver lesions and their differentiating is still continuing. Aim: To investigate the value of point shear wave elastography (pSWE) and two-dimensional shear wave elastography (2D-SWE) for the differential diagnosis of benign and malignant focal liver lesions. Materials and Methods: A total of 125 adult patients were included from the Clinic of Gastroenterology of University Hospital Kaspela, Plovdiv city, Bulgaria, in the period from January 2021 to July 2022. Participants were divided into two groups—with benign (hemangiomas) and malignant focal liver lesions (hepatocellular carcinoma). The group with benign lesions included 63 patients and the group with malignant focal liver lesions (FLLs)—62 patients. Point shear wave elastography (pSWE) and two-dimensional shear wave elastography (2D-SWE) integrated in the same ultrasound machine (Esaote MyLab™ 9Exp) were performed for each lesion. Results: Malignant FLLs have significantly higher stiffness in both pSWE (2.52–4.32 m/s, 90% CI: 2.37 to 2.68, 90% CI: 4.19 to 4.55) and 2d-SWE (2.52–4.43 m/s, 90% CI: 2.31 to 2.65, 90% CI: 4.27 to 4.61). Conclusion: 2D-SWE and pSWE could provide complementary data about FLLs. They enable us to conveniently and easily obtain accurate stiffness information of FLLs.

1. Introduction

Ultrasonography was first introduced in the clinical practice in the 1970s. Since then, it has been widely used for diagnosis in many medical specialties [1]. Ultrasound is the first method of choice in the assessment of pathological conditions of the liver, in particular focal liver lesions (FLLs). It is important to have a useful tool for their diagnosis, management, treatment and follow-up. Many of the FLLs are incidental findings, they remain unclear in standard B-mode and are difficult to verify with the laboratory and other imaging methods. Liver biopsy is a method of verification, but it is associated with a risk of bleeding, especially in cases of FLLs that have occurred on the background of already damaged liver parenchyma.
Conventional imaging techniques do not provide information on tissue mechanical properties, although its stiffness may vary considerably. Elastography was developed in the 1990s to map tissue stiffness, and replaces the palpation performed by clinicians. Nowadays, it is widely used for diagnostics of different diseases [2,3]. Elastography gives a new aspect in the diagnostic algorithm of the conventional ultrasound examination, by adding the liver stiffness quantification. In addition, many different diseases and conditions can lead to changes in tissue stiffness. Tumors, especially malignant ones, are generally stiffer than the normal surrounding tissue. Several elastographic approaches have been developed, such as transient elastography, strain imaging, magnetic resonance elastography (MRE) and share wave imaging (SWE). The last one includes point shear wave elastography (pSWE) and two-dimensional shear wave elastography (2D-SWE) [4,5,6,7,8]. Shear wave elastography measures the speed of the shear waves generated into the tissue when an external force is applied. Based on the type of impulse that generates the shear waves, SWE is subdivided into transient elastography (TE—where a mechanical stimulus is applied to the tissue) and acoustic radiation force impulse (ARFI) techniques (where the stimulus deforming the tissue is an acoustic “push pulse” generated by the transducer). ARFI elastography is subdivided into point SWE and multidimensional SWE (2D-SWE and 3D-SWE). Point shear wave elastography measures only a fixed area (approximately 5 mm × 10 mm) without displaying a color image in a region of interest (ROI). Two-dimensional shear-wave elastography technique allows real-time measurements of liver stiffness over a larger region of interest, resulting in a significantly larger sampling volume and in which a color-coded elastogram is obtained. In the last few years, point shear wave elastography and two-dimensional shear wave elastography become more popular.

AIM

The aim of this study is to evaluate the performance of point shear wave elastography (pSWE) and two-dimensional shear wave elastography (2D-SWE) for differential diagnosis of benign focal liver lesions (hemangiomas) and malignant focal liver lesions, such as hepatocellular carcinoma (HCC).

2. Materials and Methods

2.1. Patients

The present study included 125 patients from the Clinic of Gastroenterology, of University Hospital Kaspela, Plovdiv city, Bulgaria, in the period from January 2021 to July 2022. It is a single center prospective observational control trial. The study participants were divided into two groups—benign (hemangiomas) and malignant focal liver lesions (hepatocellular carcinoma). The group with benign lesions included 63 patients between 24 and 67 years. The group with malignant focal liver lesions included 62 patients between 56 to 81 years. Each participant had a physical and US examination. We evaluate liver size, shape, edge, echogeneity, outlines of the focal liver lesions and their structure. The differential diagnosis of FLLs requires an analysis of different types of data, including age, underlying liver disease, blood investigation, family history of malignancy, risk factors for liver cirrhosis and other imaging findings. In our study:
Benign focal liver lesions (hemangiomas)—final diagnoses are confirmed by other imaging modality such as contrast-enhanced computed tomography (CECT).
Malignant focal liver lesions (hepatocellular carcinoma)—final diagnoses are confirmed by ultrasound-guided percutaneous liver biopsy (using Tru-cut 18 Ga, 22 mm biopsy needle TSK Laboratory, Tochigi-Shi, Japan) and histopathological analysis.
All patients signed informed consent before entering the study in accordance with the ethical recommendations of the Helsinki Declaration and Good Clinical Practice (approval code—55/151020, approval date 15 October 2020).

2.2. Methods

The focal liver lesions stiffness was assessed by pSWE and 2D-SWE integrated in the same ultrasound machine, Esaote MyLab™ 9 Exp; Esaote, Genova, Italy. A convex C1-8IQ appleprobe transducer was used. Before the point shear wave elastography and two-dimensional shear-wave elastography performance, all patients underwent a B-mode ultrasound examination of the liver. The participants were recruited during US examinations for surveillance of chronic liver disease or work-up of incidentally found focal liver lesions at the Department of Gastroenterology of University Hospital Kaspela, Plovdiv city, Bulgaria. The inclusion criteria were: presence of a solid benign (hemangiomas) or malignant focal liver lesion (HCC), absence of any previous local treatments for hepatocellular carcinoma (radiofrequency ablation, percutaneous ethanol injection, trans-arterial chemo-embolization); focal liver lesions clearly visualized at gray scale ultrasound; localized at least 2 cm under Glisson’s capsule with a maximum depth of 7.5 cm. The size of the measured hemangiomas in our study was between 15–45 mm. We considered hemangiomas larger than 5 cm as giant [9]. Exclusion criteria for our study were deep-seated focal liver lesions located in the left lobe, close to the heart. This area is a subject of motion due to cardiac pulsation. We started with an adequate visualization of the whole liver. We subsequentially assess the liver size, structure, capsule, parenchyma heterogeneity, liver edge and the presence of focal liver lesions and ascites. For the right lobe measurements, the transducer was positioned in an intercostal position. For the left liver lobe measurements, the transducer was in a subcostal epigastric position, with sampling from the central portion of the left liver lobe. Ultrasonography has been also used as a tool to support the diagnosis of liver cirrhosis and portal hypertension. Measures were taken for liver size in a sagittal section in the medioclavicular line; presence of splenomegaly; the diameter of the portal vein. The enlarged spleen was defined as spleen length > 12 cm [10]. All participants were at least 18 years old and provided written informed consent to participate in the present study. Ten elastographic measurements were performed with a validation criterion-median interquartile range (IQR/M) < 30. The acquisition time for each shear wave elastography method was defined as the time from the start to the end of obtaining 10 valid LS measurements. All patients fasted for at least a minimum of two hours and rest for 10 min prior to the examination to avoid falsely elevated liver stiffness measurements [11]. Study participants were instructed to hold breaths at mid-respiration and avoid deep inspiration or expiration, following a recent ultrasound elastography guidelines [12,13]. If a patient had multiple benign liver masses with the same ultrasound characteristics, only one mass of interest with the largest size was chosen. 2D-SWE image and B-mode are displayed separately, side-by-side. The measurement box for both pSWE and 2D-SWE is placed parallel to the liver capsule. The upper edge of the measurement box should be placed 1.5 to 2.0 cm apart from the liver capsule to minimize the effect of reflection artifact. Some shear wave elastography systems allow an option for the image scale and the measurements to be reported in units of either msor kPa. There are many other reasons why it is appropriate to report results in units of ms−1 rather than kPa. This is the unit of shear wave speed cs, which is the quantity measured by the scanner. If the user requests the results in kPa, the unit of elastic modulus, the scanner must convert the measured data to an elastic modulus. The important thing is to realize that because of the squared relationship between modulus and speed, means and standard deviations calculated for data recorded in ms−1 and then converted to kPa will not be equal to the means and standard deviations calculated after first converting the original data values to kPa.

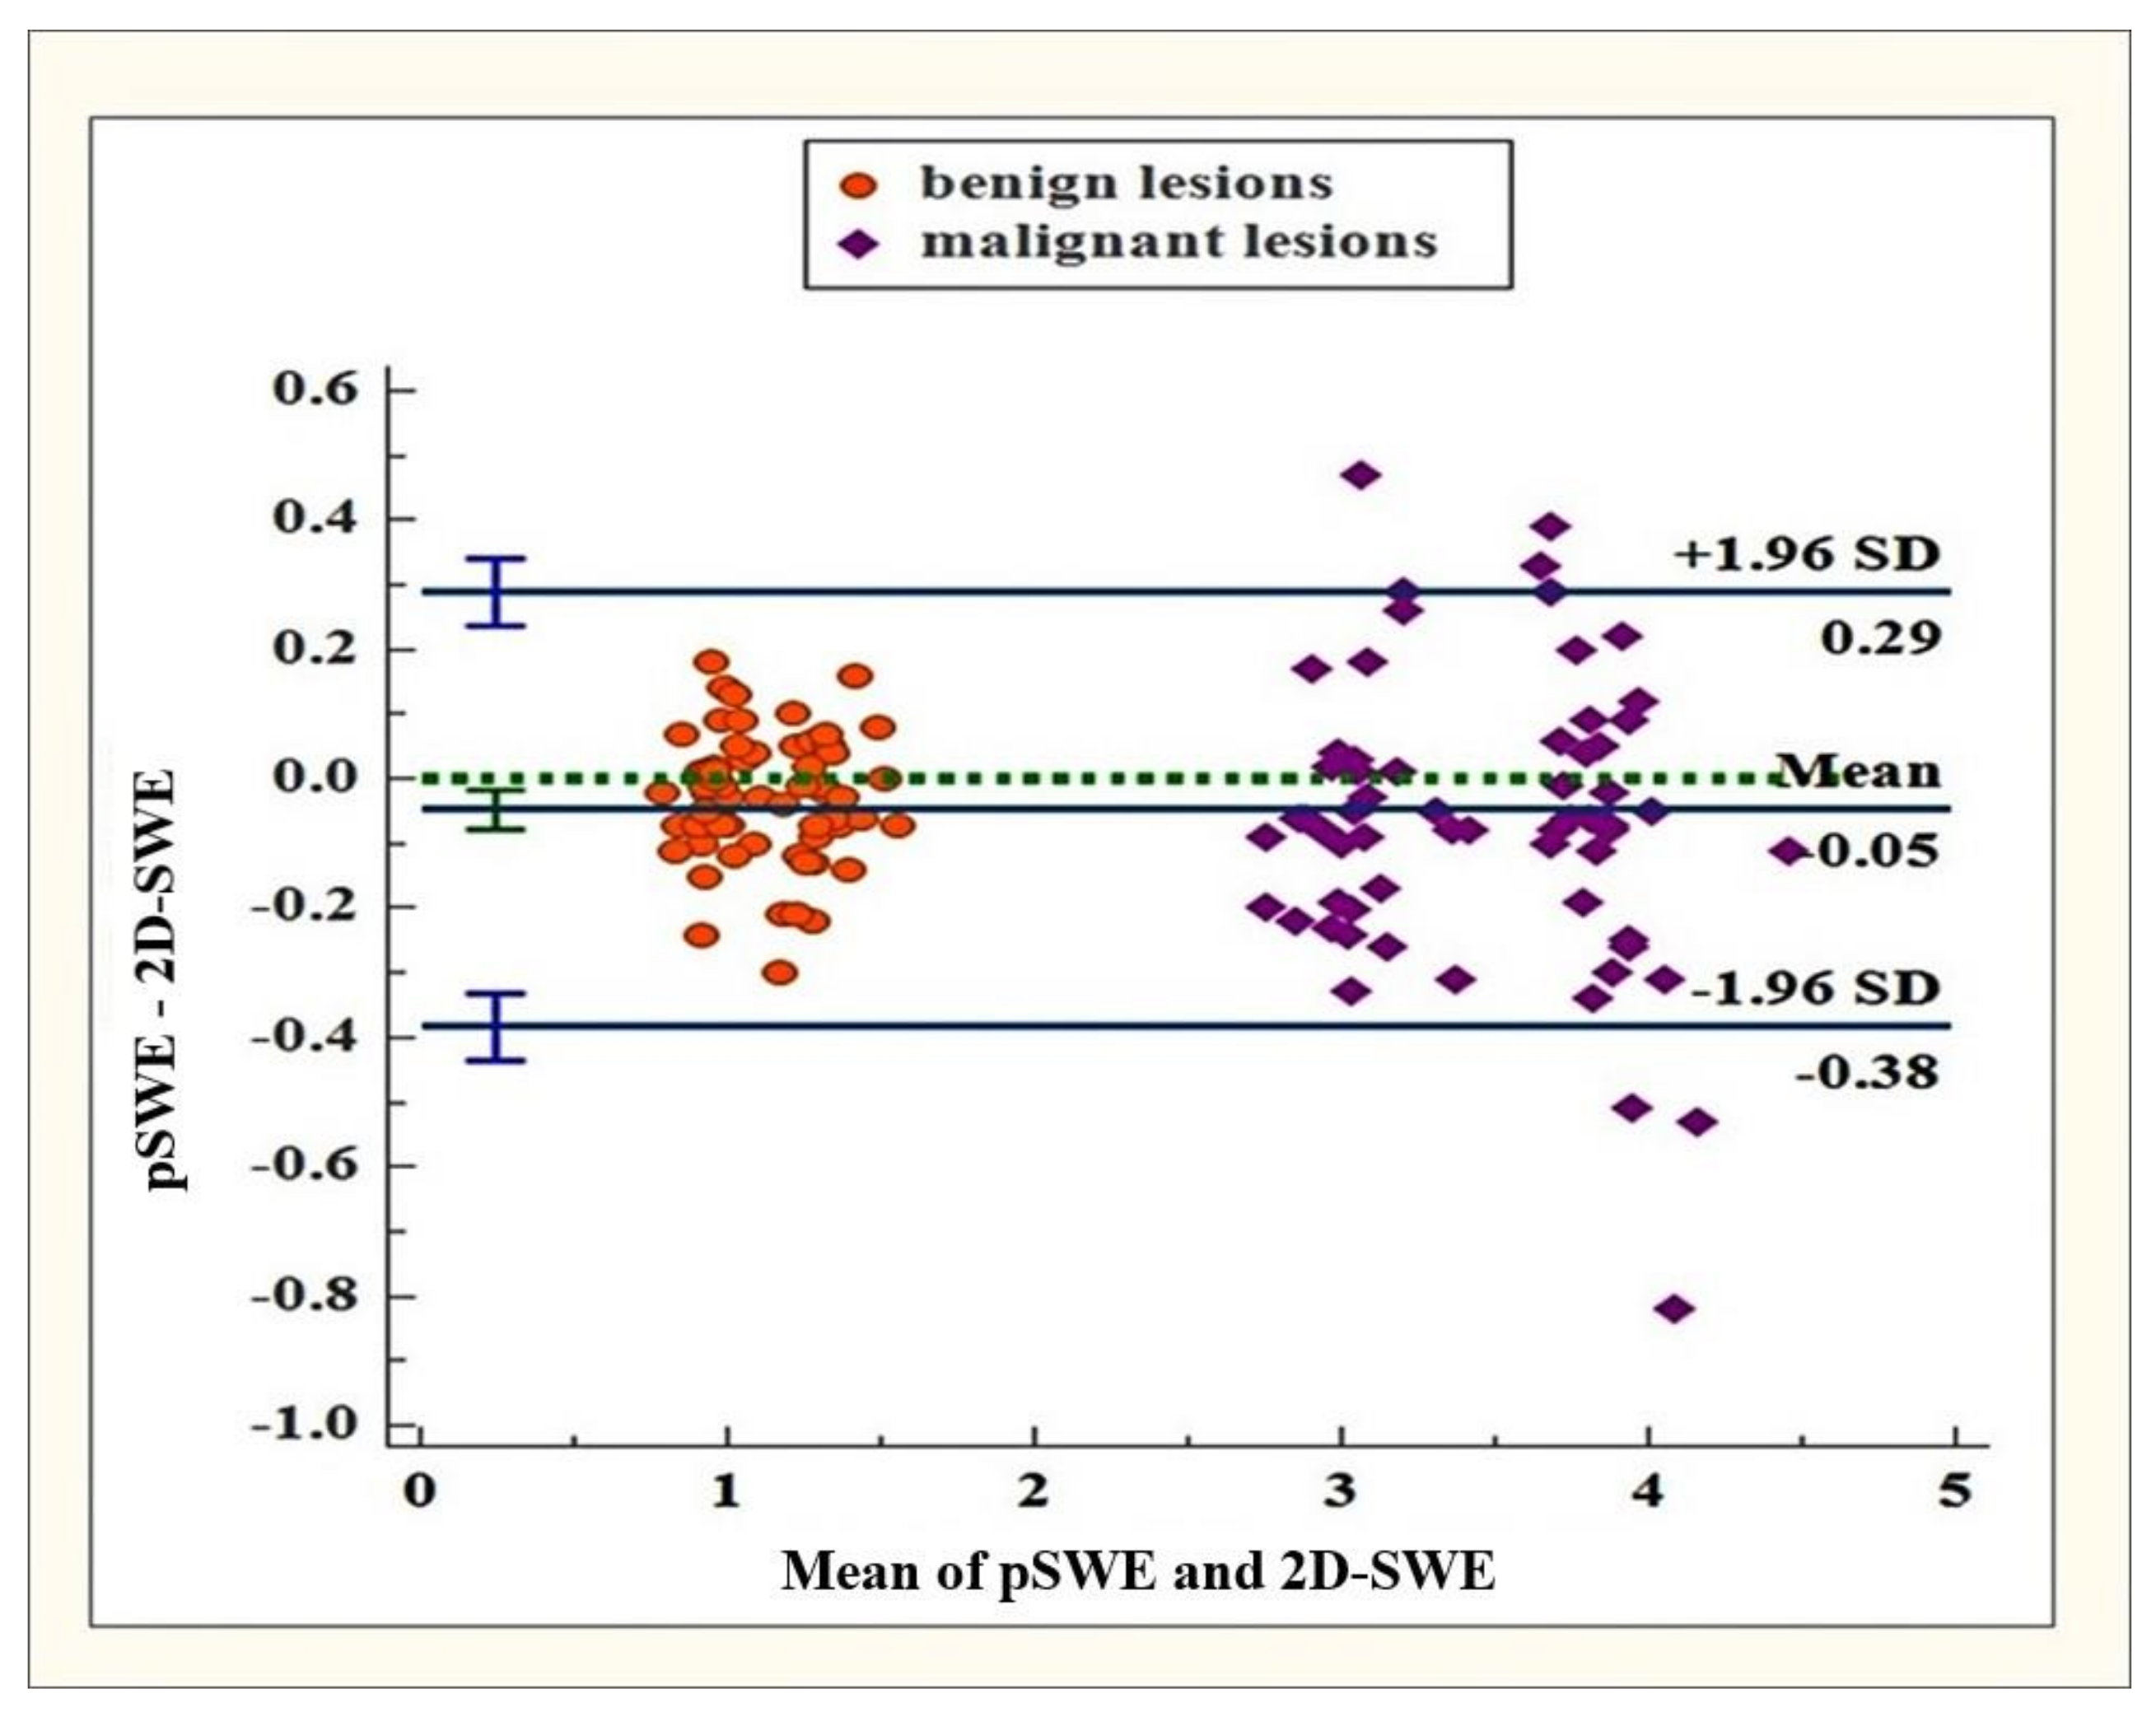
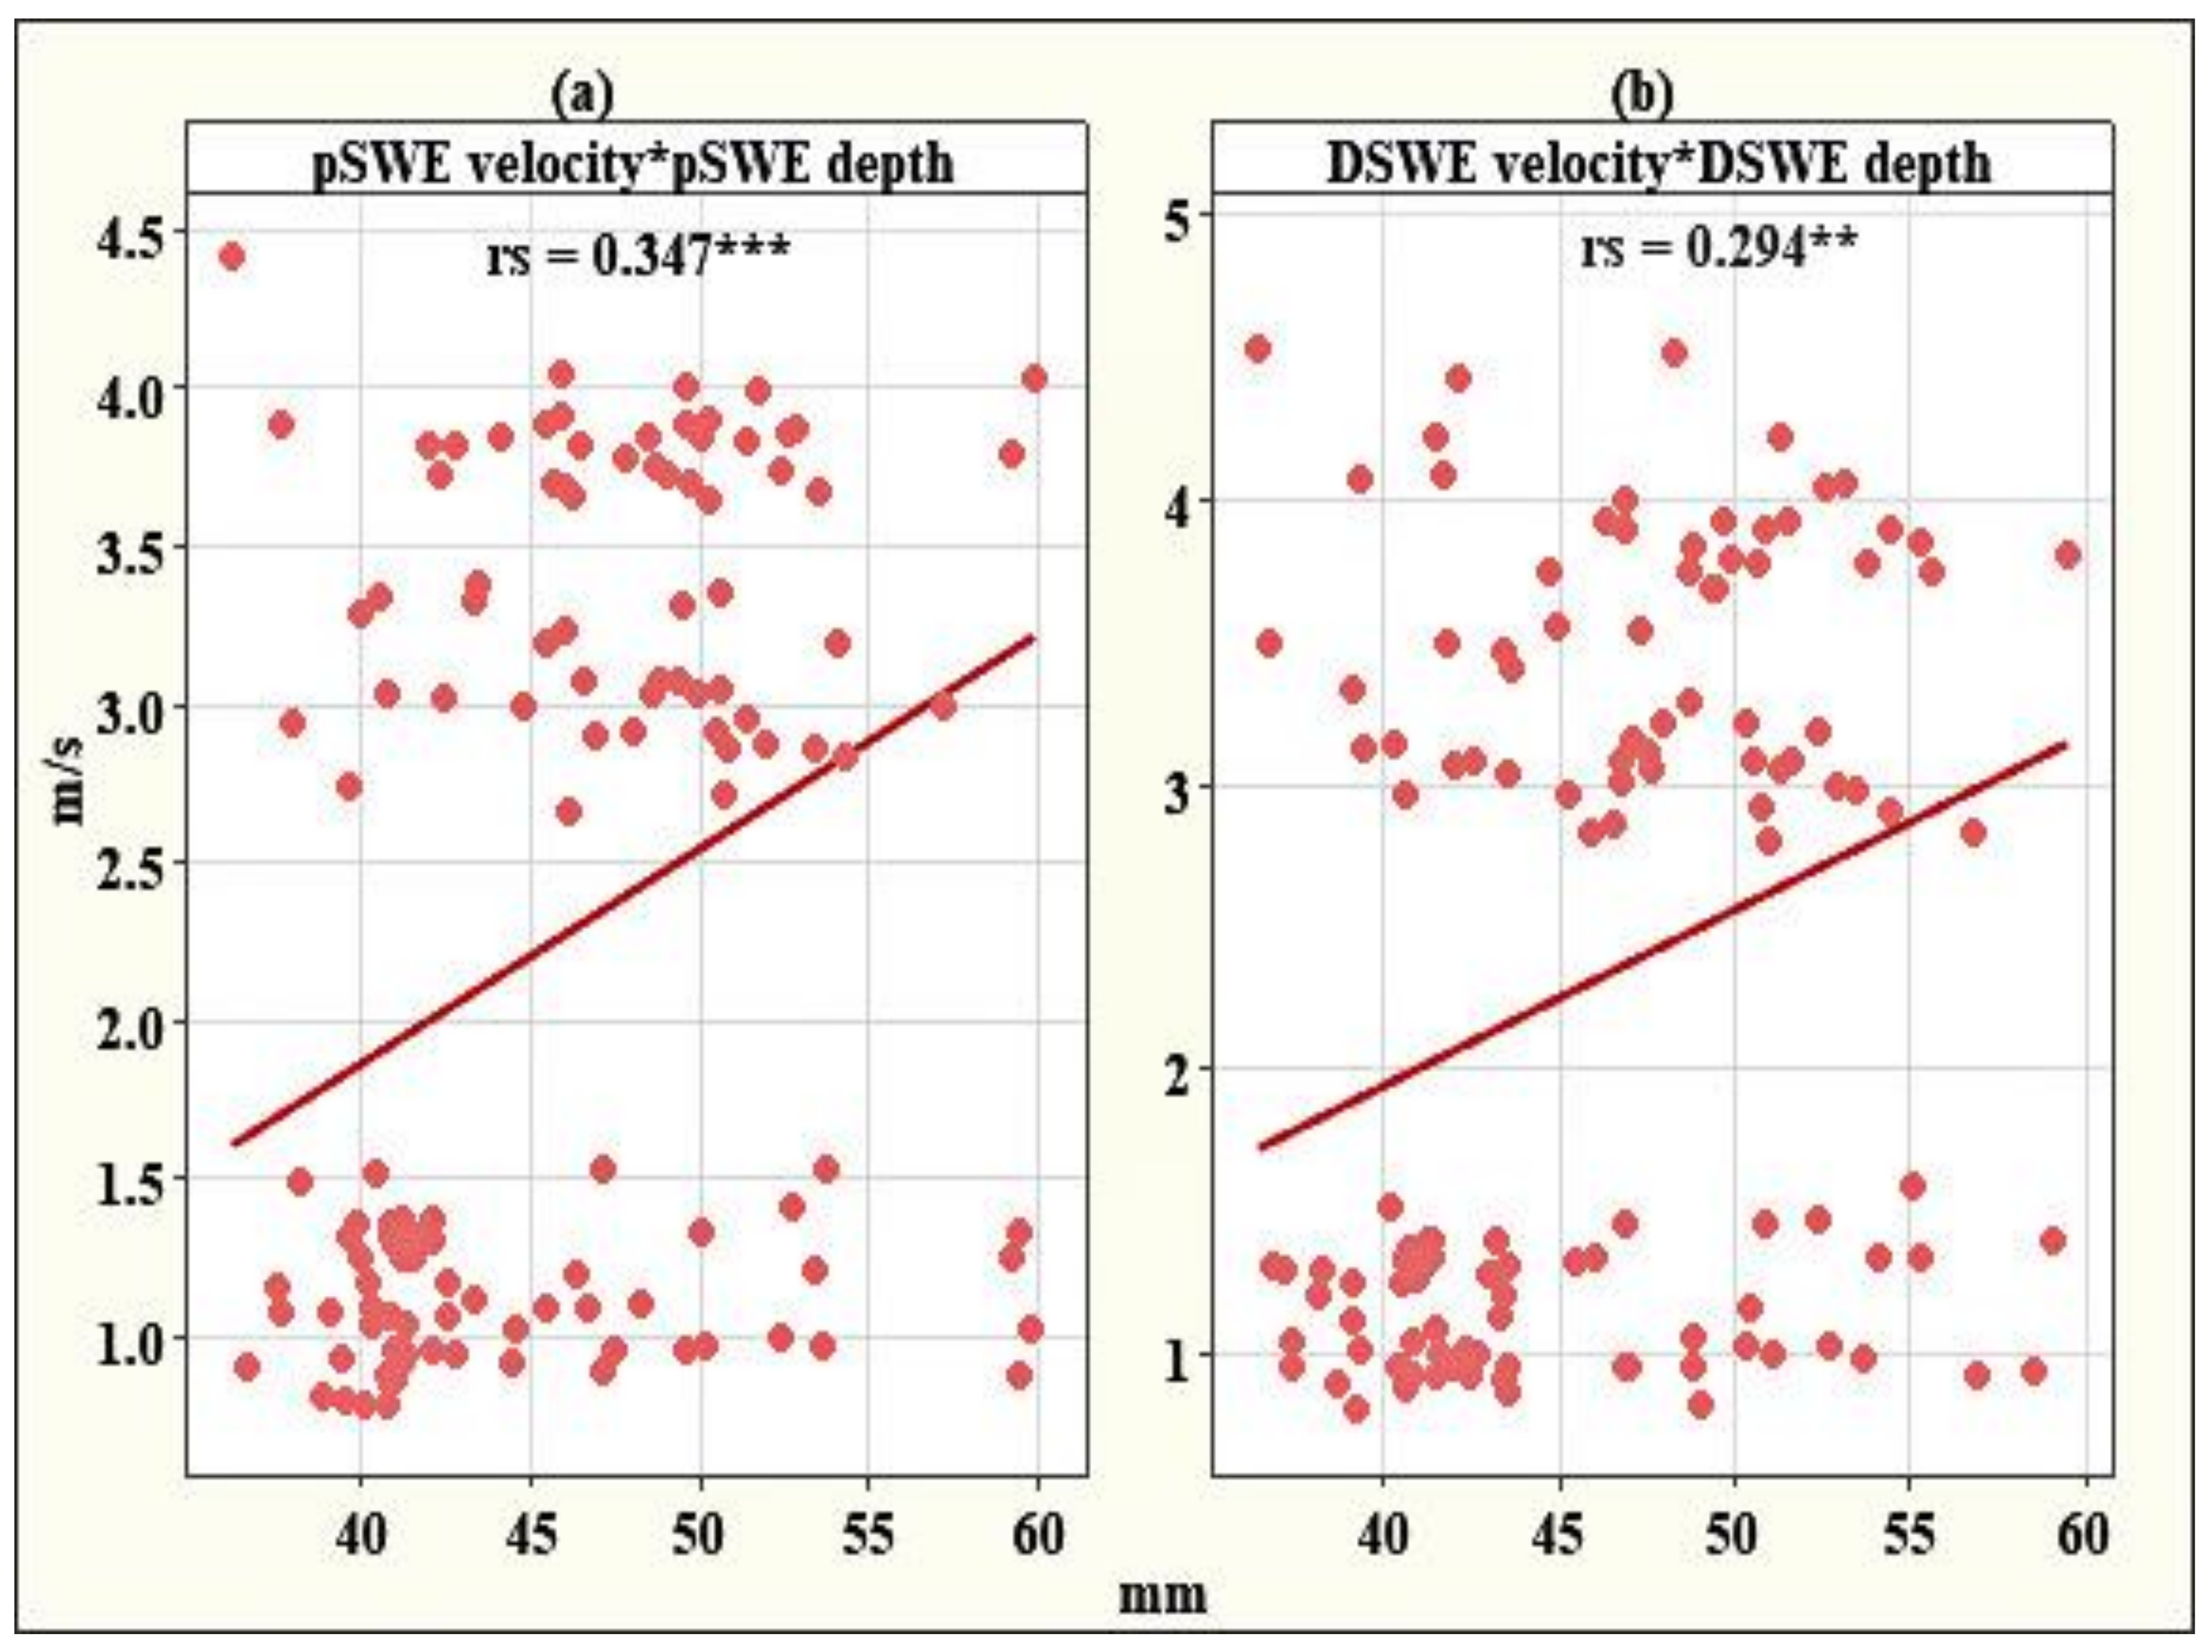
2.3. Statistical Analysis

We used the statistical software IBM SPSS version 27 (Chicago, IL, USA, 2020) to perform the data analysis. Continuously measured variables with normal distributions (Shapiro-Wilk test, p > 0.05) were described by the mean values and standard deviations and compared between the malignant and benign lesions through t-tests for independent samples. Categorical variables were presented with frequencies and percentages and associations were tested through Fisher’s exact test (two categories) and the Chi-square test (more than two categories). The 95% reference intervals (RIs) for benign and malignant lesions were calculated using the MedCalc program, version 20.014 (MedCalc Software Ltd., Ostend, Belgium, 2021). The level of agreement between the two methods, point shear wave elastography and two-dimensional shear wave elastography, was established through the Bland-Altman’s plot. The receiver operating characteristic (ROC) curve was used to establish the diagnostic accuracy of point shear wave elastography and two-dimensional shear wave elastography for distinguishing malignant from benign lesions. The Spearman rank-order correlation was used to explore the relationship between the measurements of velocity and depth. All statistical tests were two-tailed, and statistical significance was accepted at p < 0.05.

3. Results

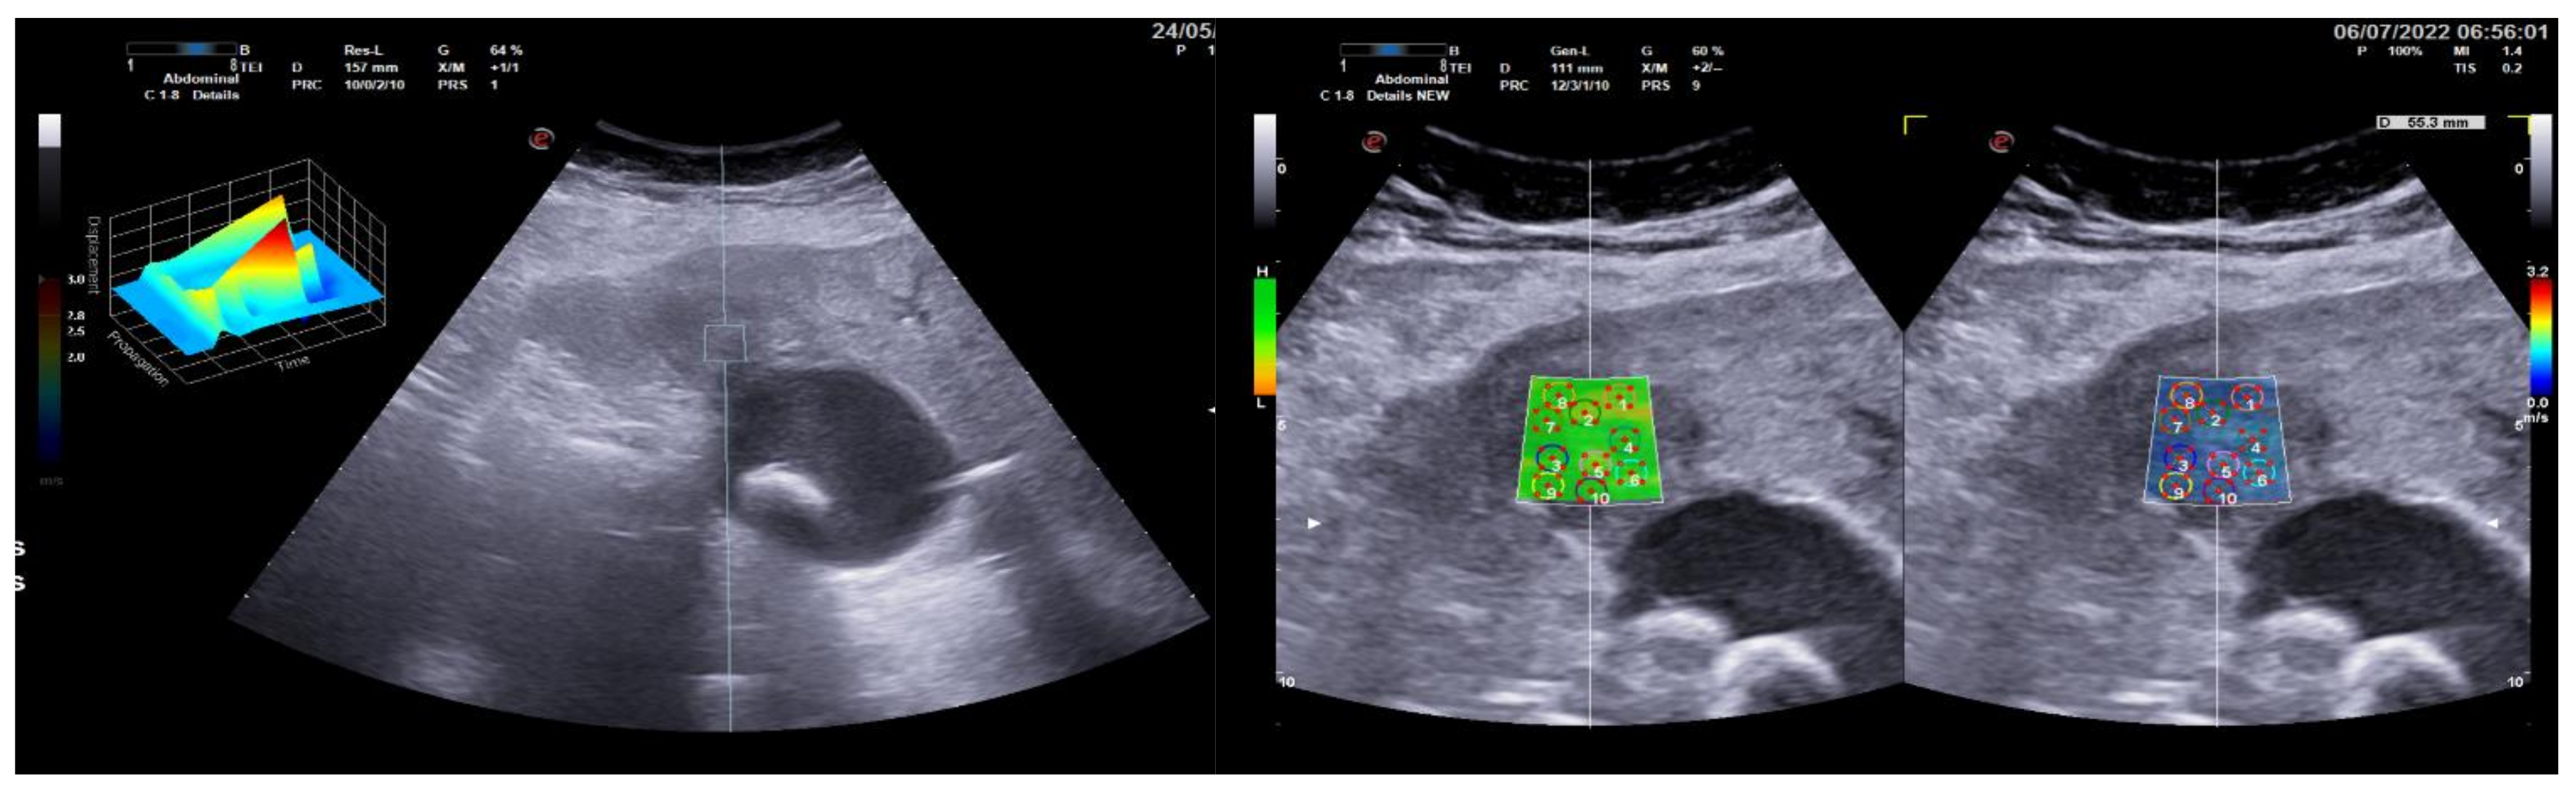
3.1. Group 1: Benign Focal Liver Lesions (Hemangiomas)

The group with benign lesions included 63 patients with a mean age of 43.23 ± 12.41 years, between 24 and 67 years, of whom 30 (47.62%) were men and 33 (52.38%) were women. As no significant differences were detected between the men and women, reference intervals (RIs) for benign lesions were determined on the basis of all 63 patients. For pSWE, an RI between 0.76 m/s (90% CI: 0.72 to 0.81) and 1.58 m/s (90% CI: 1.49 to 1.67) was estimated. A comparable RI, with only marginal differences, was calculated for two-dimensional shear wave elastography, from 0.78 m/s (90% CI: 0.72 to 0.82) to 1.62 m/s (90%CI: 1.53 to 1.75) (Figure 1).

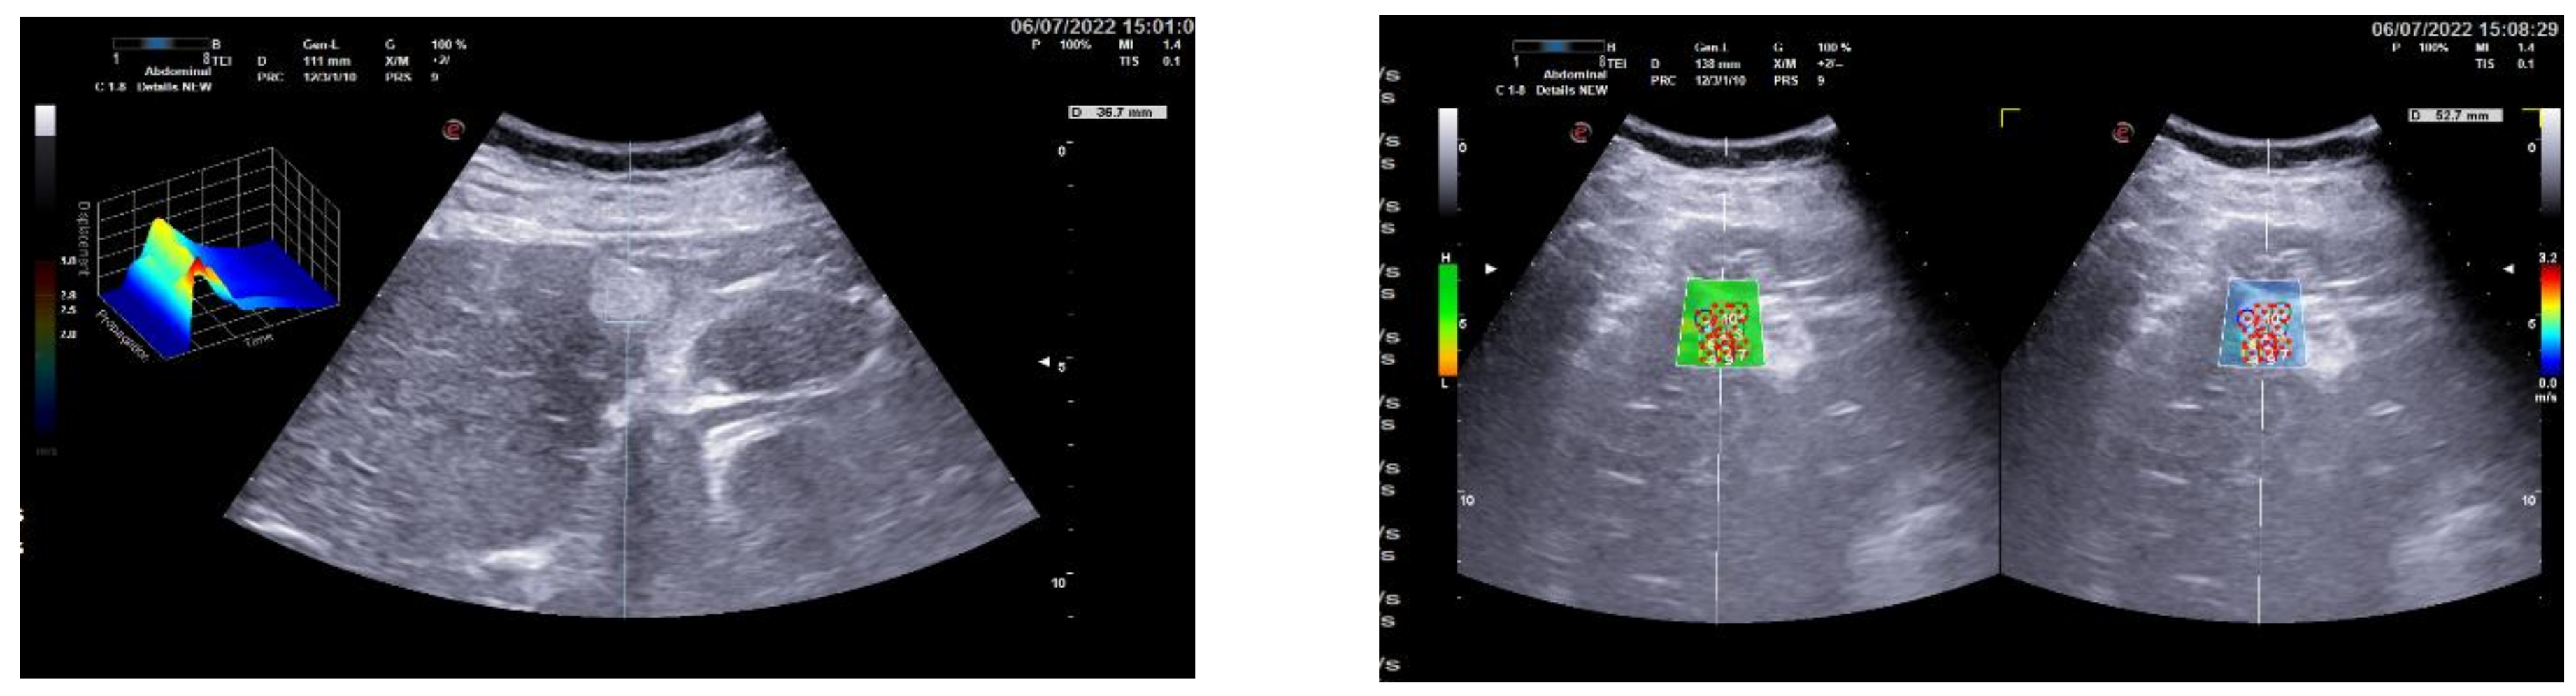
3.2. Group 2: Malignant Focal Liver Lesions (Hepatocellular Carcinoma)

The group with malignant lesions consisted of 62 patients, aged 56 to 81 years, with a mean age of 43.23 ± 12.41 years, and a significant presence of men (63.00%; n = 39) versus women (47.00%; n = 23), p = 0.007. The most frequent types of malignant tumors were well-differentiated hepatocellular carcinoma—59.67%; moderately differentiated hepatocellular carcinoma—27.42%; and poorly-differentiated hepatocellular carcinoma- 12.90%. The men and women did not differ significantly in mean age (p = 0.075), histology (p = 0.155), type of malignant lesions (1.000), mean BMI (0.286), pSWE velocity (0.590), 2D-SWE (p = 0.278), pSWE depth (p = 0.565) and 2D-SWE depth (p = 0.555) (Figure 2).
Table 1 summarizes all statistical information on malignant lesions, depending on histology, point shear wave elastography (pSWE) and two-dimensional shear wave elastography (2D-SWE).
In this study, RIs for malignant lesions were determined on the basis of all 62 patients without the need to partition them into men and women because of the absence of significant sex differences in all background and target variables. The RI for the point shear wave elastography was calculated to be between 2.52 m/s (90% CI: 2.37 to 2.68) and 4.32 m/s (90% CI: 4.19 to 4.55). A similar RI was shown for two-dimensional shear wave elastography, with the same lower limit of 2.52 m/s (90% CI: 2.31 to 2.65) and a slightly higher upper limit of 4.43 m/s (90% CI: 4.27 to 4.61).
The Bland-Altman plot revealed an arithmetic mean difference of −0.05 m/s (95% CI: −0.07 to −0.02) between the two methods of measuring shear wave velocities (pSWE and 2D-SWE). It should be noted that a higher level of disagreement was observed when measuring malignant lesions. As shown in the plot, some individual values were located outside the limits of agreement (Figure 3). This variability might reverberate tumor heterogeneity or inclusion of necrosis and/or internal hemorrhage in malignant tumors reduces the stiffness.
Both methods identified malignant from benign tumors with 100% accuracy (AUC = 1.000; 95% CI: 0.971 to 1.000 for both methods) at very similar cut-off values: >1.58 m/s for point shear wave elastography and >1.59 m/s for two-dimensional shear wave elastography, according to the ROC curve analysis. A significant positive association was found between the measures of velocity and depth by both methods: pSWE-rs = 0.347 (95% CI: 0.17 to 0.49), p < 0.001; 2D-SWE— rs = 0.294 (95% CI: 0.12 to 0.45), p = 0.001. (Figure 4).

4. Discussion

Shear wave elastography imaging is successfully integrated into the ultrasound systems. It can be performed with single conventional probe so that the operator can visualize the liver directly. The region of interest can be positioned manually at the specific location. Since the B-mode image is used to trace the shear wave in both the point shear wave elastography and two-dimensional shear wave elastography, B-mode images are high-quality, without artifacts and should be acquired for reliable and accurate liver stiffness measurement.
The results from both elastographic techniques, point shear wave elastography and two-dimensional shear wave elastography, demonstrated significant differences between the stiffness of malignant (HCC) and benign focal liver lesions (hemangiomas). Malignant focal liver lesions are significantly stiffer than benign. Both methods identified HCC from hemangiomas with 100% accuracy (AUC = 1.000; 95% CI: 0.971 to 1.000 for both methods) at very similar cut-off values: >1.58 m/s for point shear wave elastography and >1.59 m/s for two-dimensional shear wave elastography, according to the ROC curve analysis.
Several studies have confirmed the diagnostic benefit of the point shear wave elastography using ARFI [14,15] and two-dimensional shear wave elastography—for the stiffness investigation of focal liver lesions [16].
Despite the promising results of our study, there were few facts that should be taken into consideration. First, the maximum detection depth of shear wave elastography is limited and it is difficult to detect the shear wave of a deep-seated HCC and hemangiomas lesion [17]. The transmission of an acoustic radiation impulse was allowed only up to 10 cm from the skin in pSWE, for safety reasons. The maximum detection depth of two-dimensional shear wave elastography would be deeper than point shear wave elastography but would depend on the type of probe.
Second, the shear wave’s speed that shear wave elastography measured was susceptible to motion-related factors, and the accuracy of the results decreased when the lesion was close to the heart and large vessels, or when patients had poor breath-holds. Third, the overlap of some values in patients with hemangiomas and HCC needs to be mentioned. It seems like malignant liver lesions (HCC) tend to have a higher stiffness, as compared with benign ones (hemangiomas) [18].
The limitation of our study is that it involved only two types of focal liver lesions—hemangiomas and HCC—but the number of participants is statistically significant. We do not have enough number of patients belonging to other groups, such as liver cysts, focal nodular hyperplasia, liver metastases and cholangiocarcinoma, which is why, in the future, we will continue our work in that direction.
In clinical practice, imaging plays an important role in the assessment of focal liver lesions. Conventional ultrasound is the first choice for the detection and diagnosis of focal liver lesions. Some of the advantages are real-time imaging, portability, lack of radiation exposure and low cost. Computed tomography (CT) scans are highly sensitive but require ionizing radiation. Another disadvantage of CT and magnetic resonance imaging (MRI) is their higher cost. Moreover, contraindicated for MRI, are patients with claustrophobia, cardiac pacemakers, implanted cardioverter-defibrillator and metallic implants of foreign bodies. This may limit their use in daily practice. Compared to liver biopsy, liver elastography is non-invasive method and has high patient compliance [19,20,21,22,23]. Liver biopsy is an invasive technique with a number of complications, significant mortality and morbidity [24,25]. A liver biopsy is prone to sampling errors and the histological verification has a high observer variability [26,27].
Shear wave elastography is an informative and widely used method to obtain accurate stiffness information of focal liver lesions. Summarizing the information up to now, the diagnostic accuracy of combined interpretation of elastography is of notable interest. Two-dimensional shear wave elastography and point shear wave elastography imaging demonstrated high sensitivity and specificity in differentiating HCC and hemangiomas. Both elastographic techniques could be successfully adopted as a promising non-invasive method for the evaluation of focal liver lesions. As our study demonstrates, point shear wave elastography and two-dimensional shear wave elastography should not be considered as a substitute for malignant focal liver lesions biopsy because of the stiffness values overlap.

5. Conclusions

In conclusion, both elastographic techniques—point shear wave elastography and two-dimensional shear wave elastography of the liver—can be considered to be encouraging new steps in the diagnosis of focal liver lesions. As our present study demonstrated, both methods bring additional information about focal liver lesions stiffness and can be feasible to predict their benign or malignant nature. Differentiation between benign and malignant focal liver lesions still remains a challenge for imaging-based modalities. The search continues, but for the present, liver biopsy is the gold standard. A lot of multicenter studies are awaited before elastography can be recommended for daily medical practice for the differentiation of focal liver lesions.

Author Contributions

Methodology, E.L.N.-G.; Resources, D.I.D. and K.A.D.; Supervision, V.N.A. and S.B.T. All authors have read and agreed to the published version of the manuscript.

Funding

This research received no external funding.

Institutional Review Board Statement

The study was conducted in accordance with the Declaration of Helsinki, and approved by Local Ethics Committee of UMBAL Kaspela (protocol code—55/151020, approval date 15 October 2020).

Informed Consent Statement

Informed consent was obtained from all subjects involved in the study.

Conflicts of Interest

The authors declare no conflict of interest.

References

  1. Merritt, C.R.B.; Foreman, M.; Bluth, E.I.; Sullivan, M.A. Abdominal ultrasound: Clinical application of realtime. Appl. Radiol. 1981, 10, 83–94. [Google Scholar]
  2. Hadzhidekov, G.; Grudeva, V. Ultrasound elastography in breast. Rentgenol. Radiol. 2010, 1, 31–36. [Google Scholar]
  3. Vasilska, A.; Doykov, M.; Kumchev, E. Changes in renal stiffness, measured by ultrasound elastography in chronic kidney disease, Nephrology. Hemo Dial. Transplant. 2022, 1, 22–25. [Google Scholar]
  4. Castera, L. Invasive and non-invasive methods for the assessment of fibrosis and disease progression in chronic liver disease. Best Pract. Res. Clin. Gastroenterol. 2011, 25, 291–303. [Google Scholar] [CrossRef]
  5. Yoon, J.H.; Lee, J.M.; Joo, I.; Lee, E.S.; Sohn, J.Y.; Jang, S.K.; Lee, K.B.; Han, J.K.; Choi, B.I. Hepatic fibrosis: Prospective comparison of MR elastography and US shear-wave elastography for evaluation. Radiology 2014, 273, 772–782. [Google Scholar] [CrossRef]
  6. Lee, J.E.; Lee, J.M.; Lee, K.B.; Yoon, J.H.; Shin, C.I.; Han, J.K.; Choi, B.I. Noninvasive assessment of hepatic fibrosis in patients with chronic hepatitis B viral infection using magnetic resonance elastography. Korean J. Radiol. 2014, 15, 210–217. [Google Scholar] [CrossRef]
  7. Tsochatzis, E.A.; Gurusamy, K.S.; Ntaoula, S.; Cholongitas, E.; Davidson, B.R.; Burroughs, A.K. Elastography for the diagnosis of severity of fibrosis in chronic liver disease: A meta-analysis of diagnostic accuracy. J. Hepatol. 2011, 54, 650–659. [Google Scholar] [CrossRef]
  8. Stebbing, J.; Farouk, L.; Panos, G.; Anderson, M.; Jiao, L.R.; Mandalia, S.; Bower, M.; Gazzard, B.; Nelson, M. A meta-analysis of transient elastography for the detection of hepatic fibrosis. J. Clin. Gastroenterol. 2010, 44, 214–219. [Google Scholar] [CrossRef]
  9. Duxbury, M.S.; Garden, O.J. Giant haemangiona of the liver: Observation or resection? Dig. Surg. 2010, 27, 7–11. [Google Scholar] [CrossRef] [PubMed]
  10. Chapman, J.; Azevedo, A.M. Splenomegaly; StatPearls Publishing: Treasure Island, FL, USA, 2019. [Google Scholar]
  11. Gersak, M.M.; Sorantin, E.; Windhaber, J.; Dudea, S.M.; Riccabona, M. The influence of acute physical effort on liver stiffness estimation using Virtual Touch Quantification (VTQ). Preliminary results. Med. Ultrason. 2016, 18, 151–156. [Google Scholar] [CrossRef] [PubMed]
  12. Shiina, T.; Nightingale, K.R.; Palmeri, M.L.; Hall, T.J.; Bamber, J.C.; Barr, R.G.; Castera, L.; Choi, B.I.; Chou, Y.H.; Cosgrove, D.; et al. WFUMB guidelines and recommendations for clinical use of ultrasound elastography: Part 1: Basis principals and terminology. Ultrasound Med. Biol. 2015, 41, 1126–1147. [Google Scholar] [CrossRef]
  13. Ferraioli, G.; Filice, C.; Castera, L.; Choi, B.I.; Sporea, I.; Wilson, S.R.; Cosgrove, D.; Dietrich, C.F.; Amy, D.; Bamber, J.C.; et al. WFUMB guidelines and recommendations for clinical use of ultrasound elastography: Part 3: Liver. Ultrasound Med. Biol. 2015, 41, 1161–1179. [Google Scholar] [CrossRef]
  14. Park, H.S.; Kim, Y.J.; Yu, M.H.; Jung, S.I.; Jeon, H.J. Shear Wave Elastography of Focal Liver Lesion: Intraobserver Reproducibility and Elasticity Characterization. Ultrasound Q. 2015, 31, 262–271. [Google Scholar] [CrossRef]
  15. Guibal, A.; Boularan, C.; Bruce, M.; Vallin, M.; Pilleul, F.; Walter, T.; Scoazec, J.Y.; Boublay, N.; Dumortier, J.; Lefort, T. Evaluation of shearwave elastography for the characterisation of focal liver lesions on ultrasound. Eur. Radiol. 2013, 23, 1138–1149. [Google Scholar] [CrossRef]
  16. Brunel, T.; Guibal, A.; Boularan, C.; Ducerf, C.; Mabrut, J.Y.; Bancel, B.; Boussel, L.; Rode, A. Focal nodular hyperplasia and hepatocellular adenoma: The value of shear wave elastography for differential diagnosis. Eur. J. Radiol. 2015, 84, 2059–2064. [Google Scholar] [CrossRef]
  17. Fahey, B.J.; Nightingale, K.R.; Nelson, R.C.; Palmeri, M.L.; Trahey, G.E. Acoustic radiation force impulse imaging of the abdomen: Demonstration of feasibility and utility. Ultrasound Med. Biol. 2005, 31, 1185–1198. [Google Scholar] [CrossRef]
  18. Frulio, N.; Laumonier, H.; Carteret, T.; Laurent, C.; Maire, F.; Balabaud, C.; Bioulac-Sage, P.; Trillaud, H. Evaluation of liver tumors using acoustic radiation force impulse elastography and correlation with histologic data. J. Ultrasound Med. Off. J. Am. Inst. Ultrasound Med. 2013, 32, 121–130. [Google Scholar] [CrossRef]
  19. Kim, D.W.; Suh, C.H.; Kim, K.W.; Pyo, J.; Park, C.; Jung, S.C. Technical Performance of Two-Dimensional Shear Wave Elastography for Measuring Liver Stiffness: A Systematic Review and Meta-Analysis. Korean J. Radiol. 2019, 20, 880–893. [Google Scholar] [CrossRef]
  20. Fraquelli, M.; Rigamonti, C.; Casazza, G.; Conte, D.; Donato, M.F.; Ronchi, G.; Colombo, M. Reproducibility of transient elastography in the evaluation of liver fibrosis in patients with chronic liver disease. Gut 2007, 56, 968–973. [Google Scholar] [CrossRef]
  21. Jaffer, O.S.; Lung, P.F.C.; Bosanac, D.; Patel, V.M.; Ryan, S.M.; Heneghan, M.A.; Quaglia, A.; Sidhu, P.S. Acoustic radiation force impulse quantification: Repeatability of measurements in selected liver segments and influence of age, body mass index and liver capsule-to-box distance. Br. J. Radiol. 2012, 85, e858–e863. [Google Scholar] [CrossRef]
  22. Fang, C.; Konstantatou, E.; Romanos, O.; Yusuf, G.T.; Quinlan, D.J.; Sidhu, P.S. Reproducibility of 2-Dimensional Shear Wave Elastography Assessment of the Liver: A Direct Comparison with Point Shear Wave Elastography in Healthy Volunteers. J. Ultrasound Med. 2017, 36, 1563–1569. [Google Scholar] [CrossRef] [PubMed]
  23. Ferraioli, G.; Tinelli, C.; Lissandrin, R.; Zicchetti, M.; Dal Bello, B.; Filice, G.; Filice, C. Point shear wave elastography method for assessing liver stiffness. World J. Gastroenterol. 2014, 20, 4787–4796. [Google Scholar] [CrossRef] [PubMed]
  24. Piccinino, F.; Sagnelli, E.; Pasquale, G.; Giusti, G. Complications following percutaneous liver biopsy. A multicentre retrospective study on 68,276 biopsies. J. Hepatol. 1986, 2, 165–173. [Google Scholar] [CrossRef]
  25. McGill, D.B.; Rakela, J.; Zinsmeister, A.R.; Ott, B.J. A 21-year experience with major hemorrhage after percutaneous liver biopsy. Gastroenterology 1990, 99, 1396–1400. [Google Scholar] [CrossRef]
  26. Bedossa, P.; Dargère, D.; Paradis, V. Sampling variability of liver fibrosis in chronic hepatitis C. Hepatology 2003, 38, 1449–1457. [Google Scholar] [CrossRef]
  27. Persico, M.; Palmentieri, B.; Vecchione, R.; Torella, R.; De Sio, I. Diagnosis of chronic liver disease: Reproducibility and validation of liver biopsy. Am. J. Gastroenterol. 2002, 97, 491–492. [Google Scholar] [CrossRef]
Figure 1. Patient with benign FLL (hemangioma)—pSWE on the right and 2D-SWE on the left.
Gastroent 13 00030 g001
Figure 2. Patient with hepatocellular carcinoma (HCC)- point shear wave elastography (pSWE) on the right and two-dimensional shear wave elastography (2D-SWE) on the left.
Gastroent 13 00030 g002
Figure 3. Bland-Altman plot showing the limits of agreement between point shear wave elastography (pSWE) and two-dimensional shear wave elastography (2D-SWE). The horizontal dotted line marks zero difference/perfect agreement.
Gastroent 13 00030 g003
Figure 4. Significant positive association between point shear wave elastography (pSWE) velocity and depth (a) and two-dimensional shear wave elastography (2D-SWE) velocity and depth (b). *** Statistical significance < 0.001; ** Statistical significance < 0.01; * Statistical significance < 0.05.
Gastroent 13 00030 g004
Table 1. Summarizes all statistical information on malignant lesions, depending on histology, point shear wave elastography (pSWE) and two-dimensional shear wave elastography (2D-SWE).
VariablesTotal
(n = 62)
Men
(n = 39)
Women
(n = 23)
P
Age
Mean (±SD)69.30 ± 6.3770.41 ± 5.6667.43 ± 7.160.075 t
Minimum-maximum56–8159–8056–810.075 t
WD-HCC37 (59.67%)25 (67.56%)12 (32.43%)0.155 χ2
MD-HCC17 (27.42%)13 (76.40%)4 (23.60%)0.155 χ2
PD-HCC8 (12.90%)7 (87.50%)1 (12.50%)0.155 χ2
BMI
Mean (±SD)22.36 ± 1.3522.50 ± 1.3422.12 ± 1.360.286 t
Minimum-maximum19.90 to 25.1019.90 to 25.1019.90 to 24.800.286 t
Median (IQR)3.50 (0.80)3.65 (0.77)3.35 (0.95)0.590 U
Minimum-maximum2.65 to 4.402.74 to 4.402.65 to 4.030.590 U
2D-SWE (m/s)
Median (IQR)3.48(0.01)3.49 (0.80)3.33 (0.92)0.278 U
Minimum-maximum2.80 to 4.512.83 to 4.512.80 to 4.210.278 U
pSWE depth (mm)
Median (IQR)48.68 (5.45)48.65 (4.75)49.62 (7.87)0.565 U
Minimum-maximum36.26 to 59.8836.26 to 59.8840.06 to 57.270.565 U
2-D-SWE depth (mm)
Median (IQR)48.15 (7.62)47.60 (7.20)49.30 (8.20)0.555 U
Minimum-maximum36.50 to 59.4036.50 to 59.4039.10 to 56.800.555 U
IQR-interquartile range, t—independent samples t-test; χ2—Chi-square test; U—Mann-Whitney; HCC—hepatocellular carcinoma; WD-HCC—well-differentiated hepatocellular carcinoma; MD-HCC—moderately-differentiated hepatocellular carcinoma; PD-HCC—poorly differentiated hepatocellular carcinoma.
Publisher’s Note: MDPI stays neutral with regard to jurisdictional claims in published maps and institutional affiliations.

