
Pretreatment Cranial Computed Tomography Perfusion Predicts Dynamic Cerebral Autoregulation Changes in Acute Hemispheric Stroke Patients Having Undergone Recanalizing Therapy: A Retrospective Study

 , , and
Abstract
1. Introduction
2. Methods
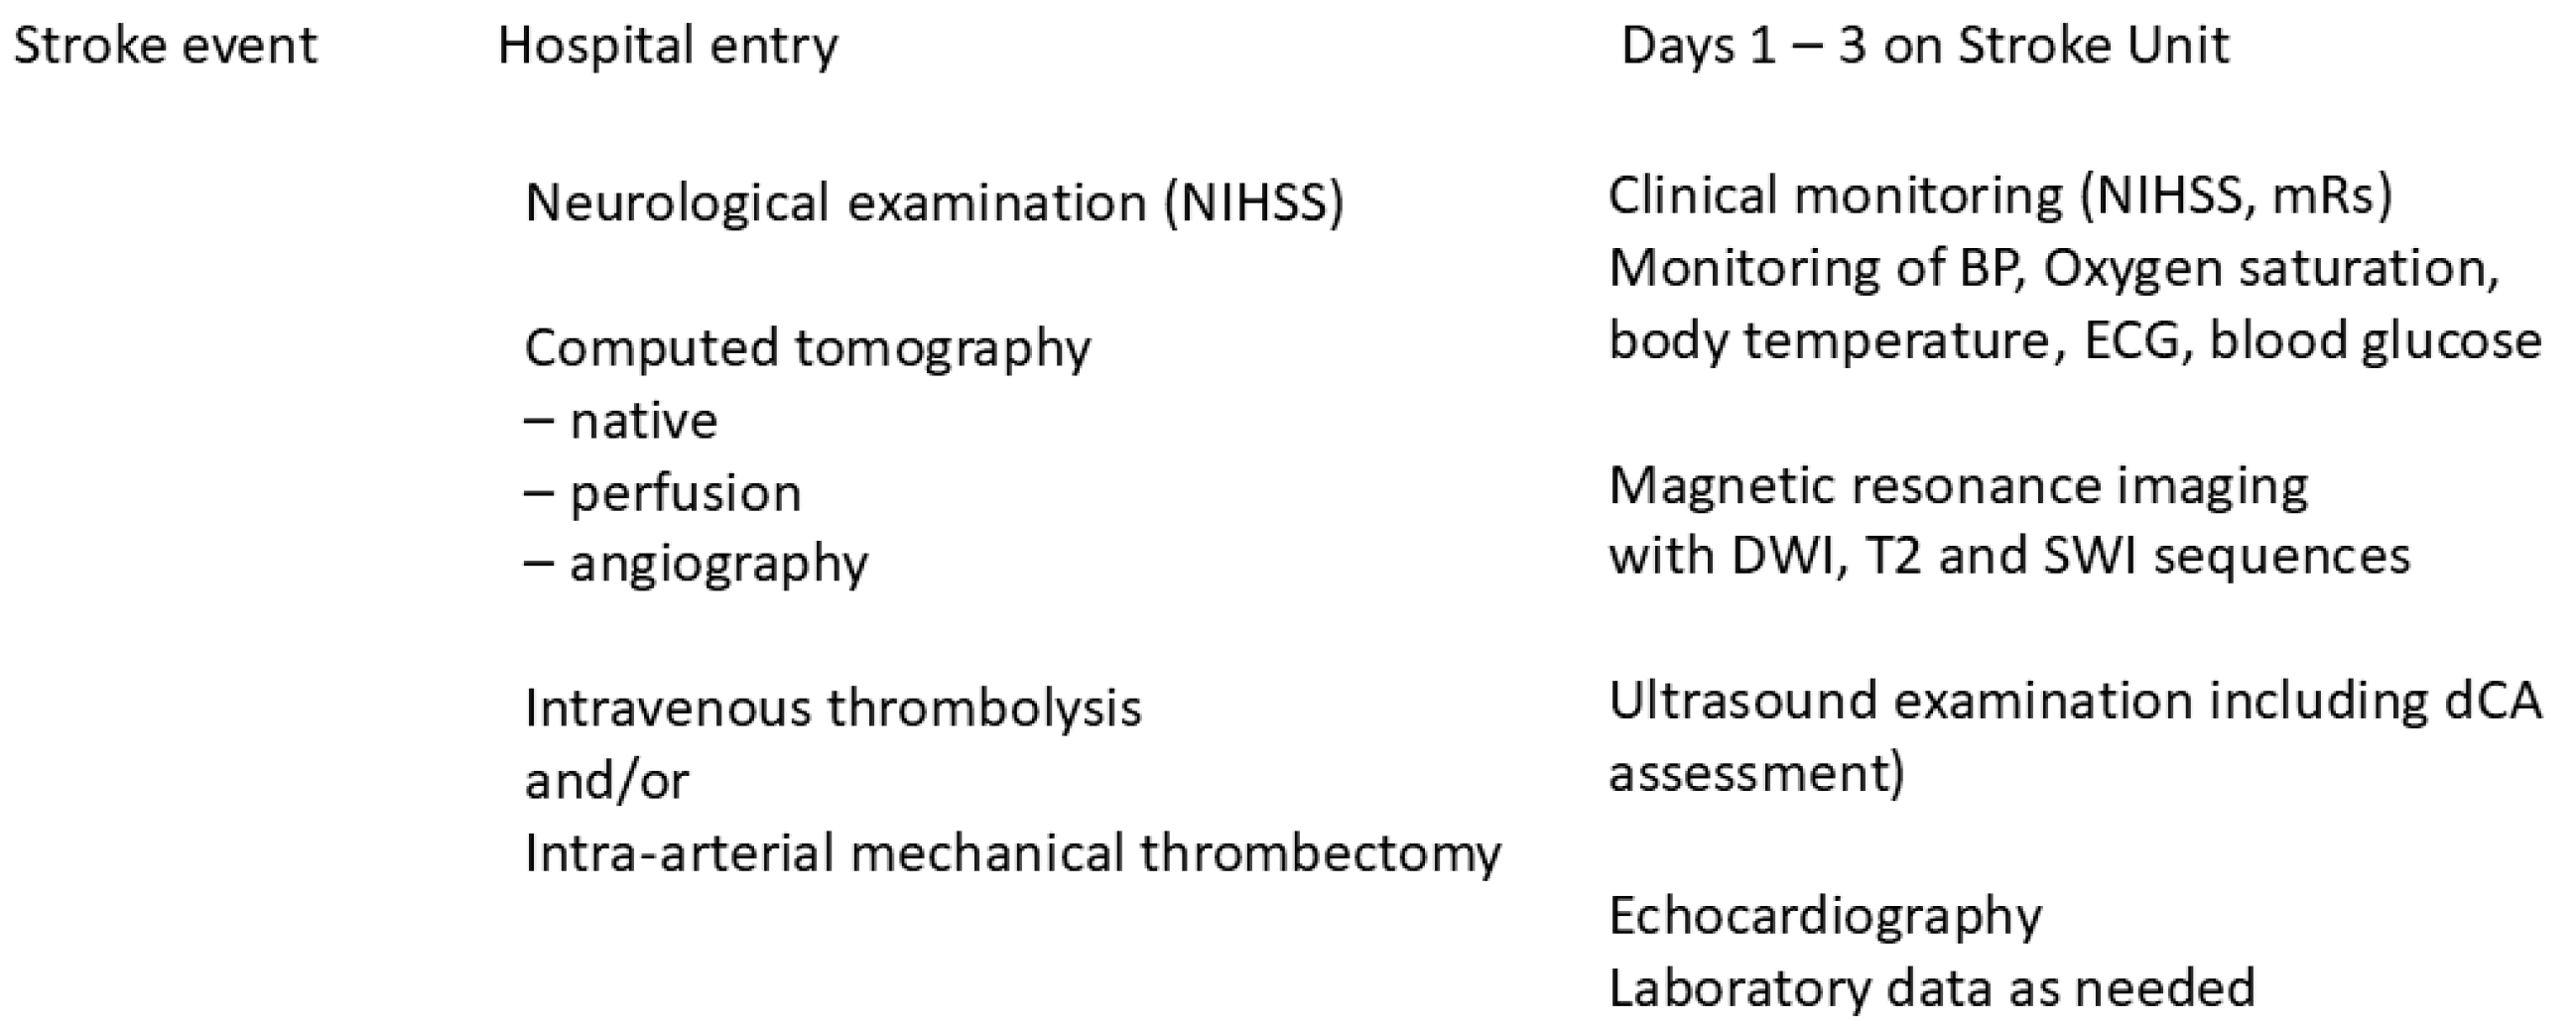
2.1. Study Setting
2.2. Cranial Computed Tomography Perfusion (CTP)
2.3. Dynamic Cerebral Autoregulation (dCA)
2.4. Patients
2.5. Statistical Analyses
3. Results
3.1. MT Procedures
3.2. Dynamic Cerebral Autoregulation (dCA) Assessment
3.3. Linear Regression Analysis
3.3.1. CBFV in the Affected Hemisphere
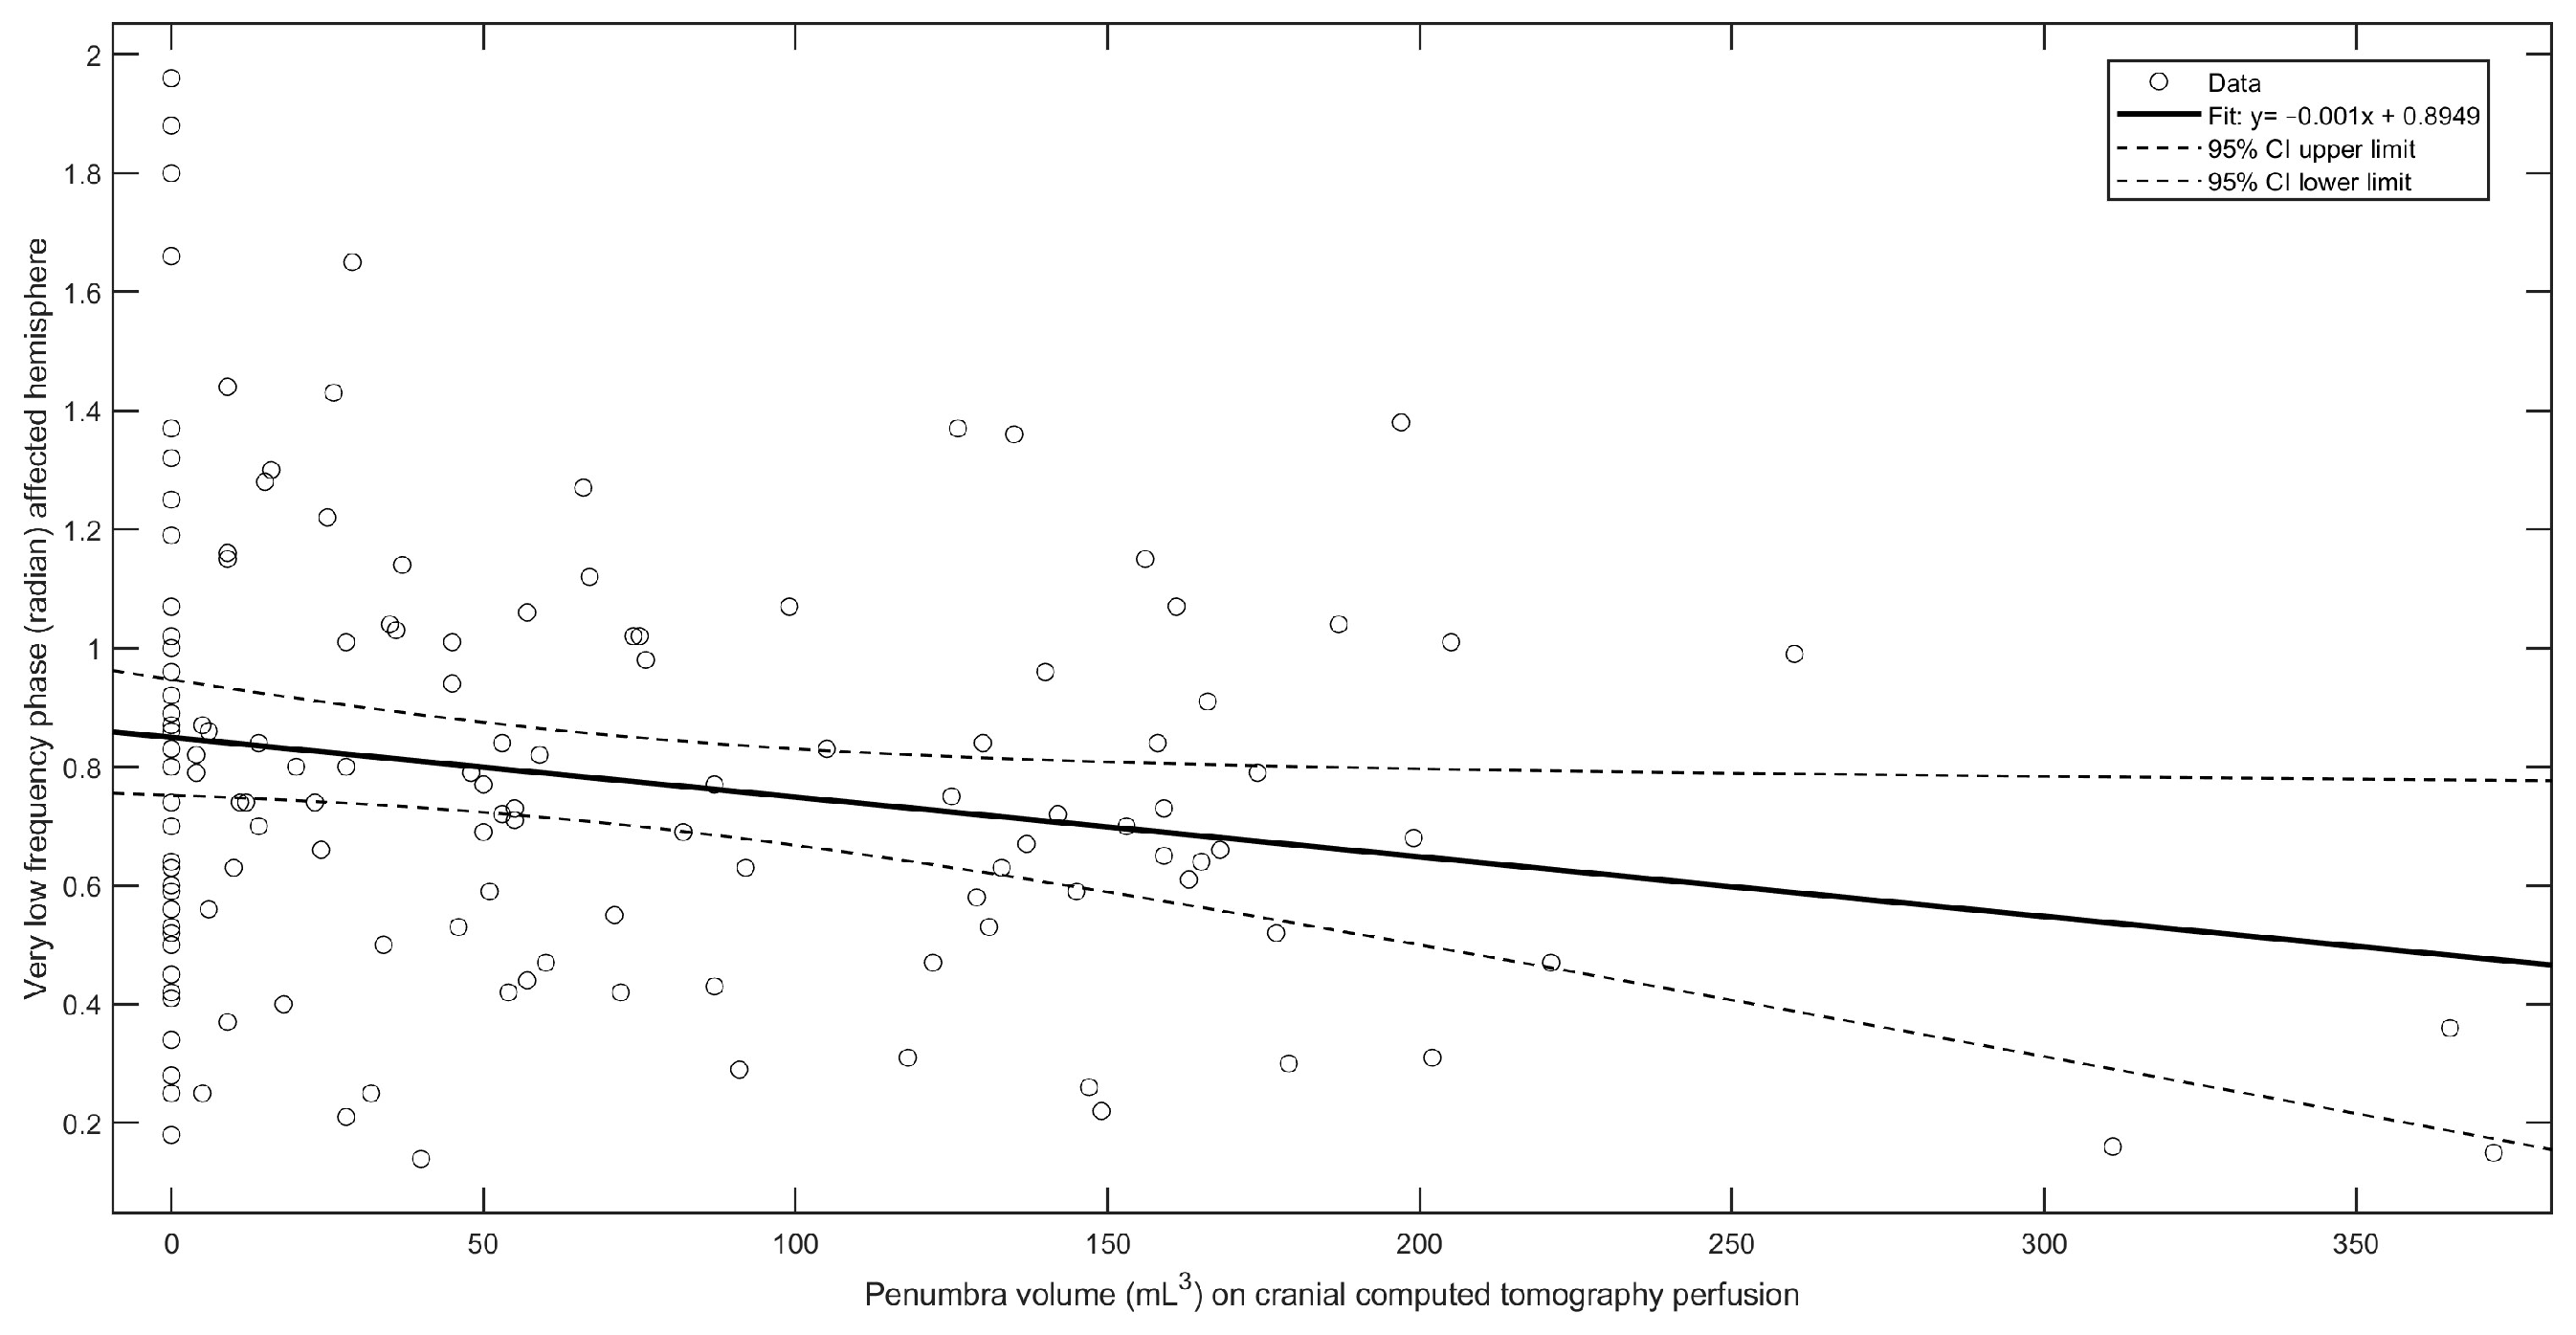
3.3.2. VLF Phase in the Affected Hemisphere
3.3.3. LF Phase in the Affected Hemisphere
3.3.4. VLF Gain in the Affected Hemisphere
3.3.5. LF Gain in the Affected Hemisphere
3.3.6. Unaffected Hemisphere
4. Discussion
Study Limitations
5. Conclusions
Author Contributions
Funding
Institutional Review Board Statement
Informed Consent Statement
Data Availability Statement
Conflicts of Interest
Abbreviations
| AIS | acute ischemic stroke |
| BP | arterial blood pressure |
| CBFV | cerebral blood flow velocity in the middle cerebral artery |
| CTP | computed tomography perfusion |
| NIHSS | National Institute of Health Stroke Scale |
| mRs | modified Rankin scale |
| MT | mechanical thrombectomy |
| MRI | magnetic resonance imaging with diffusion-weighted imaging (DWI); T2 sequences and susceptibility-weighted imaging (SWI) |
| IQR | interquartile range |
| ETCO2 | end-tidal carbon dioxide tension |
| LVEF (%) | left ventricular ejection fraction (percentage) |
| VLF | very low frequencies (0.02–0.07 Hz) |
| LF | low frequencies (0.07–0.20 Hz) |
| HF | high frequencies (>0.20–0.50 Hz) |
References
- Saver, J.L.; Goyal, M.; Bonafe, A.; Diener, H.-C.; Levy, E.I.; Pereira, V.M.; Albers, G.W.; Cognard, C.; Cohen, D.J.; Hacke, W.; et al. Stent-retriever thrombectomy after intravenous t-PA vs. t-PA alone in stroke. N. Engl. J. Med. 2015, 372, 2285–2295. [Google Scholar] [CrossRef] [PubMed]
- Campbell, B.C.; Mitchell, P.J.; Kleinig, T.J.; Dewey, H.M.; Churilov, L.; Yassi, N.; Yan, B.; Dowling, R.J.; Parsons, M.W.; Oxley, T.J.; et al. Endovascular therapy for ischemic stroke with perfusion-imaging selection. N. Engl. J. Med. 2015, 372, 1009–1018. [Google Scholar] [CrossRef] [PubMed]
- Goyal, M.; Menon, B.K.; Van Zwam, W.H.; Dippel, D.W.J.; Mitchell, P.J.; Demchuk, A.M.; Dávalos, A.; Majoie, C.B.L.M.; Van Der Lugt, A.; De Miquel, M.A.; et al. Endovascular thrombectomy after large-vessel ischaemic stroke: A meta-analysis of individual patient data from five randomised trials. Lancet 2016, 387, 1723–1731. [Google Scholar] [CrossRef] [PubMed]
- Albers, G.W.; Marks, M.P.; Kemp, S.; Christensen, S.; Tsai, J.P.; Ortega-Gutierrez, S.; McTaggart, R.A.; Torbey, M.T.; Kim-Tenser, M.; Leslie-Mazwi, T.; et al. Thrombectomy for stroke at 6 to 16 h with selection by perfusion imaging. N. Engl. J. Med. 2018, 378, 708–718. [Google Scholar] [CrossRef] [PubMed] [PubMed Central]
- Nogueira, R.G.; Jadhav, A.P.; Haussen, D.C.; Bonafe, A.; Budzik, R.F.; Bhuva, P.; Yavagal, D.R.; Ribo, M.; Cognard, C.; Hanel, R.A.; et al. Thrombectomy 6 to 24 h after stroke with a mismatch between deficit and infarct. N. Engl. J. Med. 2018, 378, 11–21. [Google Scholar] [CrossRef] [PubMed]
- Zhu, G.; Michel, P.; Aghaebrahim, A.; Patrie, J.T.; Xin, W.; Eskandari, A.; Zhang, W.; Wintermark, M. Prediction of recanalization trumps prediction of tissue fate: The penumbra: A dual-edged sword. Stroke 2013, 44, 1014–1019. [Google Scholar] [CrossRef] [PubMed]
- Seners, P.; Oppenheim, C.; Turc, G.; Albucher, J.; Guenego, A.; Raposo, N.; Christensen, S.; Calvière, L.; Viguier, A.; Darcourt, J.; et al. Perfusion imaging and clinical outcome in acute ischemic stroke with large core. Ann. Neurol. 2021, 90, 417–427. [Google Scholar] [CrossRef] [PubMed]
- Lansberg, M.G.; Christensen, S.; Kemp, S.; Mlynash, M.; Mishra, N.; Federau, C.; Tsai, J.P.; Kim, S.; Nogueria, R.G.; Jovin, T.; et al. Computed tomographic perfusion to Predict Response to Recanalization in ischemic stroke. Ann. Neurol. 2017, 81, 849–856. [Google Scholar] [CrossRef] [PubMed] [PubMed Central]
- Broocks, G.; Kemmling, A.; Kniep, H.; Meyer, L.; Faizy, T.D.; Hanning, U.; Rimmele, L.D.; Klapproth, S.; Schön, G.; Zeleňák, K.; et al. Edema Reduction versus Penumbra Salvage: Investigating Treatment Effects of Mechanical Thrombectomy in ischemic Stroke. Ann. Neurol. 2023, 95, 137–145. [Google Scholar] [CrossRef] [PubMed]
- Kneihsl, M.; Niederkorn, K.; Deutschmann, H.; Enzinger, C.; Poltrum, B.; Fischer, R.; Thaler, D.; Hermetter, C.; Wünsch, G.; Fazekas, F.; et al. Increased middle cerebral artery mean blood flow velocity index after stroke thrombectomy indicates increased risk for intracranial hemorrhage. J. Neurointerv. Surg. 2018, 10, 882–887. [Google Scholar] [CrossRef] [PubMed]
- Lu, S.; Cao, Y.; Su, C.; Xu, X.; Zhao, L.; Jia, Z.; Liu, Q.; Hsu, Y.; Liu, S.; Shi, H.; et al. Hyperperfusion on arterial spin labeling MRI predicts the 90-day functional outcome after mechanical thrombectomy in ischemic stroke. J. Magn. Reson. Imaging 2021, 53, 1815–1822. [Google Scholar] [CrossRef] [PubMed]
- Luijten, S.P.; Bos, D.; van Doormaal, P.-J.; Goyal, M.; Dijkhuizen, R.M.; Dippel, D.W.; Roozenbeek, B.; van der Lugt, A.; Warnert, E.A. Cerebral blood flow quantification with multi-delay arterial spin labeling in ischemic stroke and the association with early neurological outcome. NeuroImage Clin. 2023, 37, 103340. [Google Scholar] [CrossRef] [PubMed] [PubMed Central]
- Anadani, M.; Orabi, M.Y.; Alawieh, A.; Goyal, N.; Alexandrov, A.V.; Petersen, N.; Kodali, S.; Maier, I.L.; Psychogios, M.-N.; Swisher, C.B.; et al. Blood pressure and outcome after mechanical thrombectomy with successful revascularization. Stroke 2019, 50, 2448–2454. [Google Scholar] [CrossRef] [PubMed]
- Jafari, M.; Desai, A.; Damani, R. Blood pressure management after mechanical thrombectomy in stroke patients. J. Neurol. Sci. 2020, 418, 117140. [Google Scholar] [CrossRef] [PubMed]
- Morris, N.A.; Jindal, G.; Chaturvedi, S. Intensive blood pressure control after mechanical thrombectomy for acute ischemic stroke. Stroke 2023, 54, 1457–1461. [Google Scholar] [CrossRef] [PubMed]
- Zhou, J.; Samara, H.; Ebrahim, A.; Kinariwala, J.; Mohamed, W. Blood pressure variability and short-term outcomes after mechanical thrombectomy in patients with acute ischemic stroke. J. Stroke Cerebrovasc. Dis. 2023, 32, 107197. [Google Scholar] [CrossRef] [PubMed]
- Brasil, S.; Caldas, J.; Beishon, L.; Minhas, J.S.; Nogueira, R.C. Cerebral autoregulation monitoring: A guide while navigating in troubled waters. Neurocrit. Care 2023, 39, 736–737. [Google Scholar] [CrossRef] [PubMed]
- Nogueira, R.C.; Aries, M.; Minhas, J.S.; HPetersen, N.; Xiong, L.; Kainerstorfer, J.M.; Castro, P. Review of studies on dynamic cerebral autoregulation in the acute phase of stroke and the relationship with clinical outcome. J. Cereb. Blood Flow Metab. 2022, 42, 430–453. [Google Scholar] [CrossRef]
- Beishon, L.; Vasilopoulos, T.; Salinet, A.S.; Levis, B.; Barnes, S.; Hills, E.; Ramesh, P.; Gkargkoula, P.; Minhas, J.S.; Castro, P.; et al. Individual patient data meta-analysis of dynamic cerebral autoregulation and functional outcome after ischemic stroke. Stroke 2024, 55, 1235–1244. [Google Scholar] [CrossRef] [PubMed]
- Lakatos, L.B.; Shin, D.C.; Müller, M.; Österreich, M.; Marmarelis, V.; Bolognese, M. Impaired dynamic cerebral autoregulation measured in the middle cerebral artery in patients with vertebrobasilar ischemia is associated with autonomic failure. J. Stroke Cerebrovasc. Dis. 2024, 33, 107454. [Google Scholar] [CrossRef] [PubMed] [PubMed Central]
- Lakatos, L.-B.; Bolognese, M.; Österreich, M.; Weichsel, L.; Müller, M.M. Pre-Stroke antihypertensive therapy affects stroke severity and 3-month outcome of ischemic MCA-territory stroke. Diseases 2024, 12, 53. [Google Scholar] [CrossRef] [PubMed] [PubMed Central]
- Lyden, P.; Brott, T.; Tilley, B.; Welch, K.M.; Mascha, E.J.; Levine, S.; Haley, E.C.; Grotta, J.; Marler, J. Improved reliability of the NIH Stroke Scale using video training. NINDS TPA Stroke Study Group. Stroke 1994, 25, 2220–2226. [Google Scholar] [CrossRef] [PubMed]
- van Swieten, J.C.; Koudstaal, P.J.; Visser, M.C.; Schouten, H.J.; van Gijn, J. Interobserver agreement for the assessment of handicap in stroke patients. Stroke 1988, 19, 604–607. [Google Scholar] [CrossRef] [PubMed]
- Adams, H.P., Jr.; Bendixen, B.H.; Kappelle, L.J.; Biller, J.; Love, B.B.; Gordon, D.L.; Marsh, E.E., 3rd. Classification of subtype of acute ischemic stroke. Definitions for use in a multicenter clinical trial. TOAST. Trial of Org 10172 in acute stroke treatment. Stroke 1993, 24, 35–41. [Google Scholar] [CrossRef] [PubMed]
- Müller, M.; Österreich, M.; von Hessling, A.; Smith, R.S. Incomplete recovery of cerebral blood flow dynamics in sufficiently treated high blood pressure. J. Hypertens. 2019, 37, 372–379. [Google Scholar] [CrossRef] [PubMed] [PubMed Central]
- Panerai, R.B.; Brassard, P.; Burma, J.S.; Castro, P.; Claassen, J.A.; van Lieshout, J.J.; Liu, J.; Lucas, S.J.; Minhas, J.S.; Mitsis, G.D.; et al. Transfer function analysis of dynamic cerebral autoregulation: A CARNet white paper 2022 update. J. Cereb. Blood Flow Metab. 2023, 43, 3–25. [Google Scholar] [CrossRef] [PubMed] [PubMed Central]
- Konstas, A.A.; Goldmakher, G.V.; Lee, T.Y.; Lev, M.H. Theoretic basis and technical implementations of CT perfusion in acute ischemic stroke, part 1: Theoretic basis. AJNR Am. J. Neuroradiol. 2009, 30, 662–668. [Google Scholar] [CrossRef] [PubMed] [PubMed Central]
- Higashida, R.T.; Furlan, A.J.; Roberts, H.; Tomsick, T.; Connors, B.; Barr, J.; Dillon, W.; Warach, S.; Broderick, J.; Tilley, B.; et al. Technology Assessment Committee of the American Society of Interventional and Therapeutic Neuroradiology, Technology Assessment Committee of the Society of Interventional Radiology. Trial design and reporting standards for intra-arterial cerebral thrombolysis for acute ischemic stroke. Stroke 2003, 34, e109–e137, Erratum in Stroke 2003, 34, e109–e137. [Google Scholar] [CrossRef] [PubMed]
- North American Symptomatic Carotid Endarterectomy Trial Collaborators. Beneficial effect of endarterectomy in symptomatic patients with high-grade stenosis. N. Engl. J. Med. 1991, 325, 445–453. [Google Scholar] [CrossRef]
- Reinhard, M.; Rutsch, S.; Lambeck, J.; Wihler, C.; Czosnyka, M.; Weiller, C.; Hetzel, A. Dynamic cerebral autoregulation associates with infarct size and outcome after ischemic stroke. Acta Neurol. Scand. 2012, 125, 156–162. [Google Scholar] [CrossRef]
- Xing, C.Y.; Tarumi, T.; Meijers, R.L.; Turner, M.; Repshas, J.; Xiong, L.; Ding, K.; Vongpatanasin, W.; Yuan, L.J.; Zhang, R. Arterial pressure, heart rate, and cerebral hemodynamics across the adult life span. Hypertension 2017, 69, 712–720. [Google Scholar] [CrossRef] [PubMed] [PubMed Central]
- Wang, Y.; Payne, S.J. Static autoregulation in humans. J. Cereb. Blood Flow Metab. 2024, 44, 1191–1207. [Google Scholar] [CrossRef] [PubMed]
- Sanders, M.L.; Claassen, J.A.H.R.; Aries, M.; Bor-Seng-Shu, E.; Caicedo, A.; Chacon, M.; Gommer, E.D.; Van Huffel, S.; Jara, J.L.; Kostoglou, K.; et al. Reproducibility of dynamic cerebral autoregulation parameters: A multi-centre, multi-method study. Physiol. Meas. 2018, 39, 125002. [Google Scholar] [CrossRef] [PubMed]
- Sanders, M.L.; Elting, J.W.J.; Panerai, R.B.; Aries, M.; Bor-Seng-Shu, E.; Caicedo, A.; Chacon, M.; Gommer, E.D.; Van Huffel, S.; Jara, J.L.; et al. Dynamic cerebral autoregulation reproducibility is affected by physiological variability. Front. Physiol. 2019, 10, 865. [Google Scholar] [CrossRef] [PubMed] [PubMed Central]
- Elting, J.W.; Sanders, M.L.; Panerai, R.B.; Aries, M.; Bor-Seng-Shu, E.; Caicedo, A.; Chacon, M.; Gommer, E.D.; Van Huffel, S.; Jara, J.L.; et al. Assessment of dynamic cerebral autoregulation in humans: Is reproducibility dependent on blood pressure variability? PLoS ONE 2020, 15, e0227651. [Google Scholar] [CrossRef] [PubMed] [PubMed Central]
- Fainardi, E.; Busto, G.; Rosi, A.; Scola, E.; Casetta, I.; Bernardoni, A.; Saletti, A.; Arba, F.; Nencini, P.; Limbucci, N.; et al. Tmax volumes predict final infarct size and functional outcome in ischemic stroke patients receiving endovascular treatment. Ann. Neurol. 2022, 91, 878–888. [Google Scholar] [CrossRef] [PubMed] [PubMed Central]
- Katyal, A.; Calic, Z.; Killingsworth, M.; Bhaskar, S.M.M. Diagnostic and prognostic utility of computed tomography perfusion imaging in posterior circulation acute ischemic stroke: A systematic review and meta-analysis. Eur. J. Neurol. 2021, 28, 2657–2668. [Google Scholar] [CrossRef] [PubMed]


| IV-Lysis Only (n = 91) | MT Procedure (n = 74) | p-Value | |
|---|---|---|---|
| Age (years) | 71.5 (58–78) | 75 (63–82) | 0.16 |
| Women/men | 20/71 | 24/50 | 0.19 |
| NIHSS at entry | 5 (3–7) | 15 (9–18) | 0.0000 |
| mRs at 3 months | 1 (0–2) | 3 (1–3) | 0.0000 |
| mRs at 3 months | |||
| dichotomized | |||
| ≤2 | 75 | 36 | 0.0000 |
| >2 | 16 | 38 | |
| Arterial hypertension (n) | 50 | 43 | 0.59 |
| Diabetes mellitus (n) | 25 | 20 | 1 |
| Dyslipidemia (n) | 64 | 60 | 0.72 |
| Left ventricular ejection fraction (%) | 59 (55–63) | 58 (50–65) | 0.57 |
| Ischemic heart disease (n) | 19 | 29 | 0.30 |
| Estimated glomerular filtration rate (mL/min/10.72 m2) | 820.5 (67–91) | 79 (59–89) | 0.20 |
| Blood pressure (mm Hg) at admission | |||
| Systolic | 153 (137–172) | 147 (134–164) | 0.10 |
| Mean | 106 (93–117) | 103 (91–113) | 0.22 |
| Diastolic | 85 (74–96) | 81 (71–91) | 0.12 |
| Neuroimaging | |||
| CTP—Penumbra (mL) | 5 (0–28) | 125 (55–162) | 0.0000 |
| CTP—Core (mL) | 0 (0–0) | 9 (0–34) | 0.0000 |
| MRI—infarct volume (mL) on DWI | 20.8 (00.54–110.5) | 150.3 (60.4–500.9) | 0.0000 |
| IV-Lysis Only (n = 91) | MT Procedures (n = 74) | p-Value | |
|---|---|---|---|
| Mean arterial blood pressure (mm Hg) over recording period | 98 (86–104) | 89 (79–102) | 0.06 |
| Heart rate | 68 (60–80) | 70 (62–79) | 0.41 |
| ETCO2 (mm Hg) over recording period | 39.5 (38.1–40.5) | 39.2 (37.6–40.8) | 0.40 |
| Affected Hemisphere | |||
| CBFV (cm/s) | 46 (41–55) | 57 (48–75) | 0.0000 |
| Pulsatility index | 0.95 (0.85–1.12) | 0.98 (0.86–1.08) | 0.45 |
| Coherence | |||
| VLF | 0.57 (0.48–0.64) | 0.62 (0.53–0.70) | 0.04 |
| LF | 0.63 (0.53–0.77) | 0.66 (0.53–0.78) | 0.92 |
| HF | 0.68 (0.58–0.76) | 0.64 (0.55–0.70) | 0.15 |
| Gain (mmHg/cm/s) | |||
| VLF | 0.25 (0.15–0.38) | 0.36 (0.23–0.55 | 0.001 |
| LF | 0.39 (0.28–0.52) | 0.49 (0.32–0.66) | 0.01 |
| HF | 0.51 (0.38–0.64) | 0.56 (0.40–0.86) | 0.06 |
| Phase (radian) | |||
| VLF | 0.83 (0.59–1.06) | 0.67 (0.46–0.85) | 0.002 |
| LF | 0.68 (0.50–0.91) | 0.53 (0.36–0.76) | 0.001 |
| HF | 0.25 (0.06–0.49) | 0.19 (0.03–0.39) | 0.16 |
| Unaffected Hemisphere | |||
| CBFV (cm/s) | 47 (41–56) | 49 (42–50) | 0.32 |
| Pulsatility Index | 0.93 (0.84–1.11) | 0.97 (0.85–1.10) | 0.46 |
| Coherence | |||
| VLF | 0.57 (0.50–0.65) | 0.59 (0.48–0.67) | 0.95 |
| LF | 0.62 (0.52–0.75) | 0.61 (0.52–0.76) | 0.71 |
| HF | 0.62 (0.52–0.77) | 0.64 (0.49–0.72) | 0.77 |
| Gain (mm Hg/cm/s) | |||
| VLF | 0.26 (0.15–0.41) | 0.33 (0.17–0.48) | 0.17 |
| LF | 0.44 (0.26–0.56) | 0.55 (0.37–0.77) | 0.01 |
| HF | 0.48 (0.38–0.68) | 0.62 (0.47–0.80) | 0.01 |
| Phase (radian) | |||
| VLF | 0.80 (0.61–1.04) | 0.82 (0.52–1.08) | 0.86 |
| LF | 0.64 (0.49–0.81) | 0.56 (0.39–0.76) | 0.045 |
| HF | 0.27 (0.04–0.48) | 0.19 (0–0.32) | 0.13 |
| Variable | |
|---|---|
| Left ventricular ejection fraction (LVEF, %) | β = 0.019 (95%CI −0.2202 to 0.2583), r2 = 0.0002, F(2,163) = 0.02, p = 0.80 |
| Mean BP (mm Hg) over the recording period | β = −0.116 (95%CI −0.3001 to 0.0664), r2 = 0.009, F(2,163) = 1.58, p = 0.20 |
| Mean ETCO2 (mm Hg) over the recording period | β = −0.044 (95%CI −1.0060 to 0.9163), r2 = 0.001, F(2,163) = 0.008, p = 0.92 |
| Penumbra (mL3) | β = 0.047 (95%CI 0.0108 to 0.0840), r2 = 0.043, (F(2,163) = 6.54, p = 0.01 |
| Core (mL3) | β = 0.208 (95%CI 0.0968 to 0.3198), r2 = 0.085, F(2,163) = 13.64, p = 0.0003 |
| Age (years) | β = −0.168 (95%CI −0.3447 to 0.00859), r2 = 0.021, F(2,163) = 3.53, p = 0.06 |
| Arterial hypertension | β = −3.063 (95%CI −8.4308 to 2.3030), r2= 0.007, F(2,163) = 1.27, p = 0.26 |
| Variable | Very Low Frequency Range |
|---|---|
| CBFV (cm/s) | β = −0.004 (95%CI −0.0074 to −0.0008), r2 = 0.03, F(2,163) = 5.98, p = 0.01 |
| LVEF (%) | β = 0.0032 (95%CI −0.0021 to 0.0084), r2 = 0.009, F(2,163) = 1.43, p = 0.23 |
| Mean BP (mm Hg) over recording period | β = 0.002 (95%CI −0.0021 to 0.0060), r2 = 0.005, F(2,163) = 0.88, p = 0.34 |
| Mean ETCO2 (mm Hg) over recording period | β = 0.003 (95%CI −0.0176 to 0.0241), r2 = 0.0007, F(2,163) = 0.09, p = 0.75 |
| Penumbra (mL3) | β = −0.001 (95%CI −0.0018 to −0.0002), r2 = 0.042, F(2,163) = 6.76, p = 0.01 |
| Core (mL3) | β = −0.003 (95%CI −0.0054 to −0.0005), r2 = 0.038, F(2,163) = 5.62, p = 0.01 |
| Age (years) | β = 0.0002 (95%CI −0.0037 to 0.0041), r2 = 0.0001, F(2,163) = 0.009, p = 0.92 |
| Arterial hypertension | β = 0.05 (95%CI −0.0653 to 0.1713), r2 = 0.005, F(2,163) = 0.78, p = 0.37 |
| Variable | Low Frequency Range |
| CBFV (cm/s) | β = −0.005 (95%CI −0.0058 to 0.0002), r2 = 0.02, F(2,163) = 3.30, p = 0.07 |
| LVEF (%) | β = 0.004 (95%CI −0.0001 to 0.0089), r2 = 0.023, F(2,163) = 3.67, p = 0.06 |
| Mean BP (mm Hg) over recording period | β = 0.004 (95%CI 0.0004 to 0.0075), r2 = 0.029, F(2,163) = 4.80, p = 0.02 |
| Mean ETCO2 (mm Hg) over recording period | β = 0.015 (95%CI −0.0011 to 0.0329), r2 = 0.022, F(2,163) = 3.39, p = 0.06 |
| Penumbra (mL3) | β = −0.0009 (95%CI −0.0016 to −0.0002), r2 = 0.040, F(2,163) = 6.01, p = 0.01 |
| Core (mL3) | β = −0.0008 (95%CI −0.0030 to 0.0014), r2 = 0.003, F(2,163) = 0.55, p = 0.45 |
| Age (years) | β = 0.001 (95%CI −0.0018 to 0.0051), r2 = 0.005, F(2,163) = 0.86, p = 0.35 |
| Arterial hypertension | β = 0.051 (95%CI −0.0503 to 0.1591), r2 = 0.006, F(2,163) = 1.05, p = 0.30 |
| Variable | Very Low Frequency Range |
|---|---|
| CBFV (cm/s) | β = 0.006 (95%CI 0.0050 to 0.0087), r2 = 0.24, F(2,163) = 51.64, p = 0.0000 |
| LVEF (%) | β = −0.001 (95%CI −0.0050 to 0.0018), r2 = 0.006, F(2,163) = 0.91, p = 0.34 |
| Mean BP (mm Hg) over recoding period | β = −0.002 (95%CI −0.0052 to −0.0000), r2 = 0.02, F(2,163) = 3.97, p = 0.04 |
| Mean ETCO2 (mm Hg) over recording period | β = 0.002 (95%CI −0.0112 to 0.0156), r2 = 0.007, F(2,163) = 0.10, p = 0.74 |
| Penumbra (mL3) | β = 0.0005 (95%CI 0.0000 to 0.0010), r2 = 0.02, F(2,163) = 3.94, p = 0.04 |
| Core (mL3) | β = 0.002 (95%CI 0.0011 to 0.0041), r2 = 0.07, F(2,163) = 11.73, p = 0.0008 |
| Age (years) | β = −0.001 (95%CI −0.0040 to 0.0010), r2 = 0.008, F(2,163) = 1.38, p = 0.24 |
| Arterial hypertension | β = −0.02 (95%CI −0.1006 to 0.0508), r2 = 0.002, F(2,163) = 0.42, p = 0.51 |
| Variable | Low frequency range |
| CBFV (cm/s) | β = 0.003 (95%CI 0.0034 to 0.0074), r2 = 0.15, (F(2,163) = 29.05, p = 0.0000 |
| LVEF (%) | β = −0.003 (95%CI −0.0065 to 0.0000), r2 = 0.02, F(2,163) = 3.84, p = 0.05 |
| Mean BP (mm Hg) over recording period | β = −0.004 (95%CI −0.0073 to −0.0024), r2 = 0.08, F(2,163) = 15.42, p = 0.0001 |
| Mean ETCO2 (mm Hg) over recording period | β = −0.01 (95%CI −0.0234 to 0.0026), r2 = 0.01, F(2,163) = 2.51, p = 0.11 |
| Penumbra (mL3) | β = 0.0004 (95%CI −0.0001 to 0.0008), r2 = 0.01, F(2,163) = 2.16, p = 0.14 |
| Core (mL3) | β = 0.0001 (95%CI −0.0014 to 0.0016), r2 = 0.0001, F(2,163) = 0.01, p = 0.90 |
| Age (years) | β = 0.001 (95%CI −0.0014 to 0.0036), r2 = 0.005, F(2,163) = 0.79, p = 0.37 |
| Hypertension | β = 0.006 (95%CI −0.0678 to 0.0807), r2 = 0.002, F(2,163) = 0.02, p = 0.86 |
| Variable | |
|---|---|
| CBFV (cm/s) | β = −0.002 (95%CI −0.0061 to 0.0018), r2 = 0.009, F(2,163) = 1.13, p = 0.24 |
| LVEF (%) | β = 0.002 (95%CI −0.0036 to 0.0088), r2 = 0.005, F(2,163) = 0.66, p = 0.41 |
| Mean BP (mm Hg) over recording period | β = 0.003 (95%CI −0.0010 to 0.0085), r2 = 0.01, F(2,163) = 2.49, p = 0.11 |
| Mean ETCO2 (mm Hg) over recording period | β = −0.009 (95%CI −0.0362 to 0.0164), r2 = 0.004, F(2,163) = 0.55, p = 0.45 |
| Penumbra (mL3) | β = 0.000 (95%CI −0.001 to 0.001), r2 = 0.000, F(2,163) = 0.000, p = 0.98 |
| Core (mL3) | β = −0.001 (95%CI −0.0044 to 0.0016), r2 = 0.007, F (2,72) = 0.87, p = 0.35 |
| Age (years) | β = 0.0004 (95%CI −0.0041 to 0.0048), r2 = 0.0002, F (2,72) = 0.02, p = 0.86 |
| Arterial hypertension | β = −0.026 (95%CI −0.1646 to 0.1111), r2 = 0.001, F (2,72) = 0.14, p = 0.70 |
| Variable | |
|---|---|
| CBFV (cm/s) | β = −0.006 (95%CI −0.0060 to 0.0010), r2 = 0.01, F(2,163) = 1.97, p = 0.16 |
| LVEF (%) | β = 0.004 (95%CI −0.0009 to 0.0102), r2 = 0.02, F(2,163) = 2.78, p = 0.09 |
| Mean BP (mm Hg) over recording period | β = 0.007 (95%CI 0.0038 to 0.0118), r2 = 0.10, F(2,163) = 14.8, p = 0.0002 |
| Mean ETCO2 (mm Hg) over recording period | β = −0.001 (95%CI −0.0241 to 0.0221), r2 = 0.000, F(2,163) = 0.007, p = 0.93 |
| Penumbra (mL3) | β = 0.000 (95%CI −0.0008 to 0.0009), r2 = 0.0001, F(2,163) = 0.006, p = 0.93 |
| Core (mL3) | β = 0.001 (95%CI −0.0013 to 0.0039), r2 = 0.009, F(2,163) = 1.03, p = 0.31 |
| Age (years) | β = 0.0004 (95%CI −0.0036 to 0.0043), r2 = 0.0003, F(2,163) = 0.03, p = 0.85 |
| Arterial hypertension | β = 0.096 (95%CI −0.0244 to 0.2181), r2 = 0.01, F(2,163) = 2.49, p = 0.11 |
| Variable | |
|---|---|
| CBFV (cm/s) | β = 0.002 (95%CI −0.0005 to 0.0049), r2 = 0.02, F(2,163) = 2.65, p = 0.10 |
| LVEF (%) | β = −0.007 (95%CI −0.0051 to 0.0036), r2 = 0.000, F(2,163) = 0.11, p = 0.73 |
| Mean BP (mm Hg) over recording period | β = −0.003 (95%CI −0.0064 to 0.0001), r2 = 0.02, F(2,163) = 3.71, p = 0.05 |
| Mean ETCO2 (mm Hg) over recording period | β = −0.0003 (95%CI −0.0188 to 0.0182), r2 = 0.000, F(2,163) = 0.001, p = 0.97 |
| Penumbra (mL3) | β = 0.0005 (95%CI −0.0002 to 0.0011), r2 = 0.01, F (2,72) = 2.00, p = 0.15 |
| Core (mL3) | β = 0.002 (95%CI 0.0005 to 0.0044), r2 = 0.05, F(2,163) = 5.91, p = 0.01 |
| Age (year) | β = −0.004 (95%CI −0.0072 to −0.0013), r2 = 0.06, F(2,163) = 8.07, p = 0.005 |
| Arterial hypertension | β = −0.04 (95%CI −0.1424 to 0.0463), r2 = 0.008, F(2,163) = 1.01, p = 0.31 |
| Variable | |
|---|---|
| CBFV (cm/s) | β = 0.004 (95%CI 0.0012 to 0.0070), r2 = 0.06, F(2,163) = 7.92, p = 0.005 |
| LVEF (%) | β = −0.004 (95%CI −0.0087 to 0.0004), r2 = 0.02, F(2,163) = 3.23, p = 0.07 |
| Mean BP (mm Hg) over recording period | β = −0.005 (95%CI −0.0090 to −0.0022), r2 = 0.07, F(2,163) = 10.6, p = 0.001 |
| Mean ETCO2 (mm Hg) over recording period | β = 0.0005 (95%CI −0.0188 to 0.0199), r2 = 0.000, F(2,163) = 0.003, p = 0.95 |
| Penumbra (mL3) | β = 0.001 (95%CI 0.0004 to 0.0018), r2 = 0.07, F(2,163) = 9.37, p = 0.002 |
| Core (mL3) | β = 0.003 (95%CI 0.0013 to 0.0057), r2 = 0.08, F(2,163) = 10.07, p = 0.001 |
| Age (years) | β = −0.001 (95%CI −0.0044 to 0.0022), r2 = 0.003, F(2,163) = 0.44, p = 0.50 |
| Arterial hypertension | β = 0.01 (95%CI −0.0863 to 0.1192), r2 = 0.008, F(2,163) = 0.10, p = 0.75 |
Disclaimer/Publisher’s Note: The statements, opinions and data contained in all publications are solely those of the individual author(s) and contributor(s) and not of MDPI and/or the editor(s). MDPI and/or the editor(s) disclaim responsibility for any injury to people or property resulting from any ideas, methods, instructions or products referred to in the content. |
© 2024 by the authors. Licensee MDPI, Basel, Switzerland. This article is an open access article distributed under the terms and conditions of the Creative Commons Attribution (CC BY) license (https://creativecommons.org/licenses/by/4.0/).
Share and Cite
Lakatos, L.-B.; Bolognese, M.; Österreich, M.; Müller, M.; Karwacki, G.M. Pretreatment Cranial Computed Tomography Perfusion Predicts Dynamic Cerebral Autoregulation Changes in Acute Hemispheric Stroke Patients Having Undergone Recanalizing Therapy: A Retrospective Study. Neurol. Int. 2024, 16, 1636-1652. https://doi.org/10.3390/neurolint16060119
Lakatos L-B, Bolognese M, Österreich M, Müller M, Karwacki GM. Pretreatment Cranial Computed Tomography Perfusion Predicts Dynamic Cerebral Autoregulation Changes in Acute Hemispheric Stroke Patients Having Undergone Recanalizing Therapy: A Retrospective Study. Neurology International. 2024; 16(6):1636-1652. https://doi.org/10.3390/neurolint16060119
Chicago/Turabian StyleLakatos, Lehel-Barna, Manuel Bolognese, Mareike Österreich, Martin Müller, and Grzegorz Marek Karwacki. 2024. "Pretreatment Cranial Computed Tomography Perfusion Predicts Dynamic Cerebral Autoregulation Changes in Acute Hemispheric Stroke Patients Having Undergone Recanalizing Therapy: A Retrospective Study" Neurology International 16, no. 6: 1636-1652. https://doi.org/10.3390/neurolint16060119
APA StyleLakatos, L.-B., Bolognese, M., Österreich, M., Müller, M., & Karwacki, G. M. (2024). Pretreatment Cranial Computed Tomography Perfusion Predicts Dynamic Cerebral Autoregulation Changes in Acute Hemispheric Stroke Patients Having Undergone Recanalizing Therapy: A Retrospective Study. Neurology International, 16(6), 1636-1652. https://doi.org/10.3390/neurolint16060119