Taxation of Electric Vehicles in Europe: A Methodology for Comparison

Abstract
1. Introduction
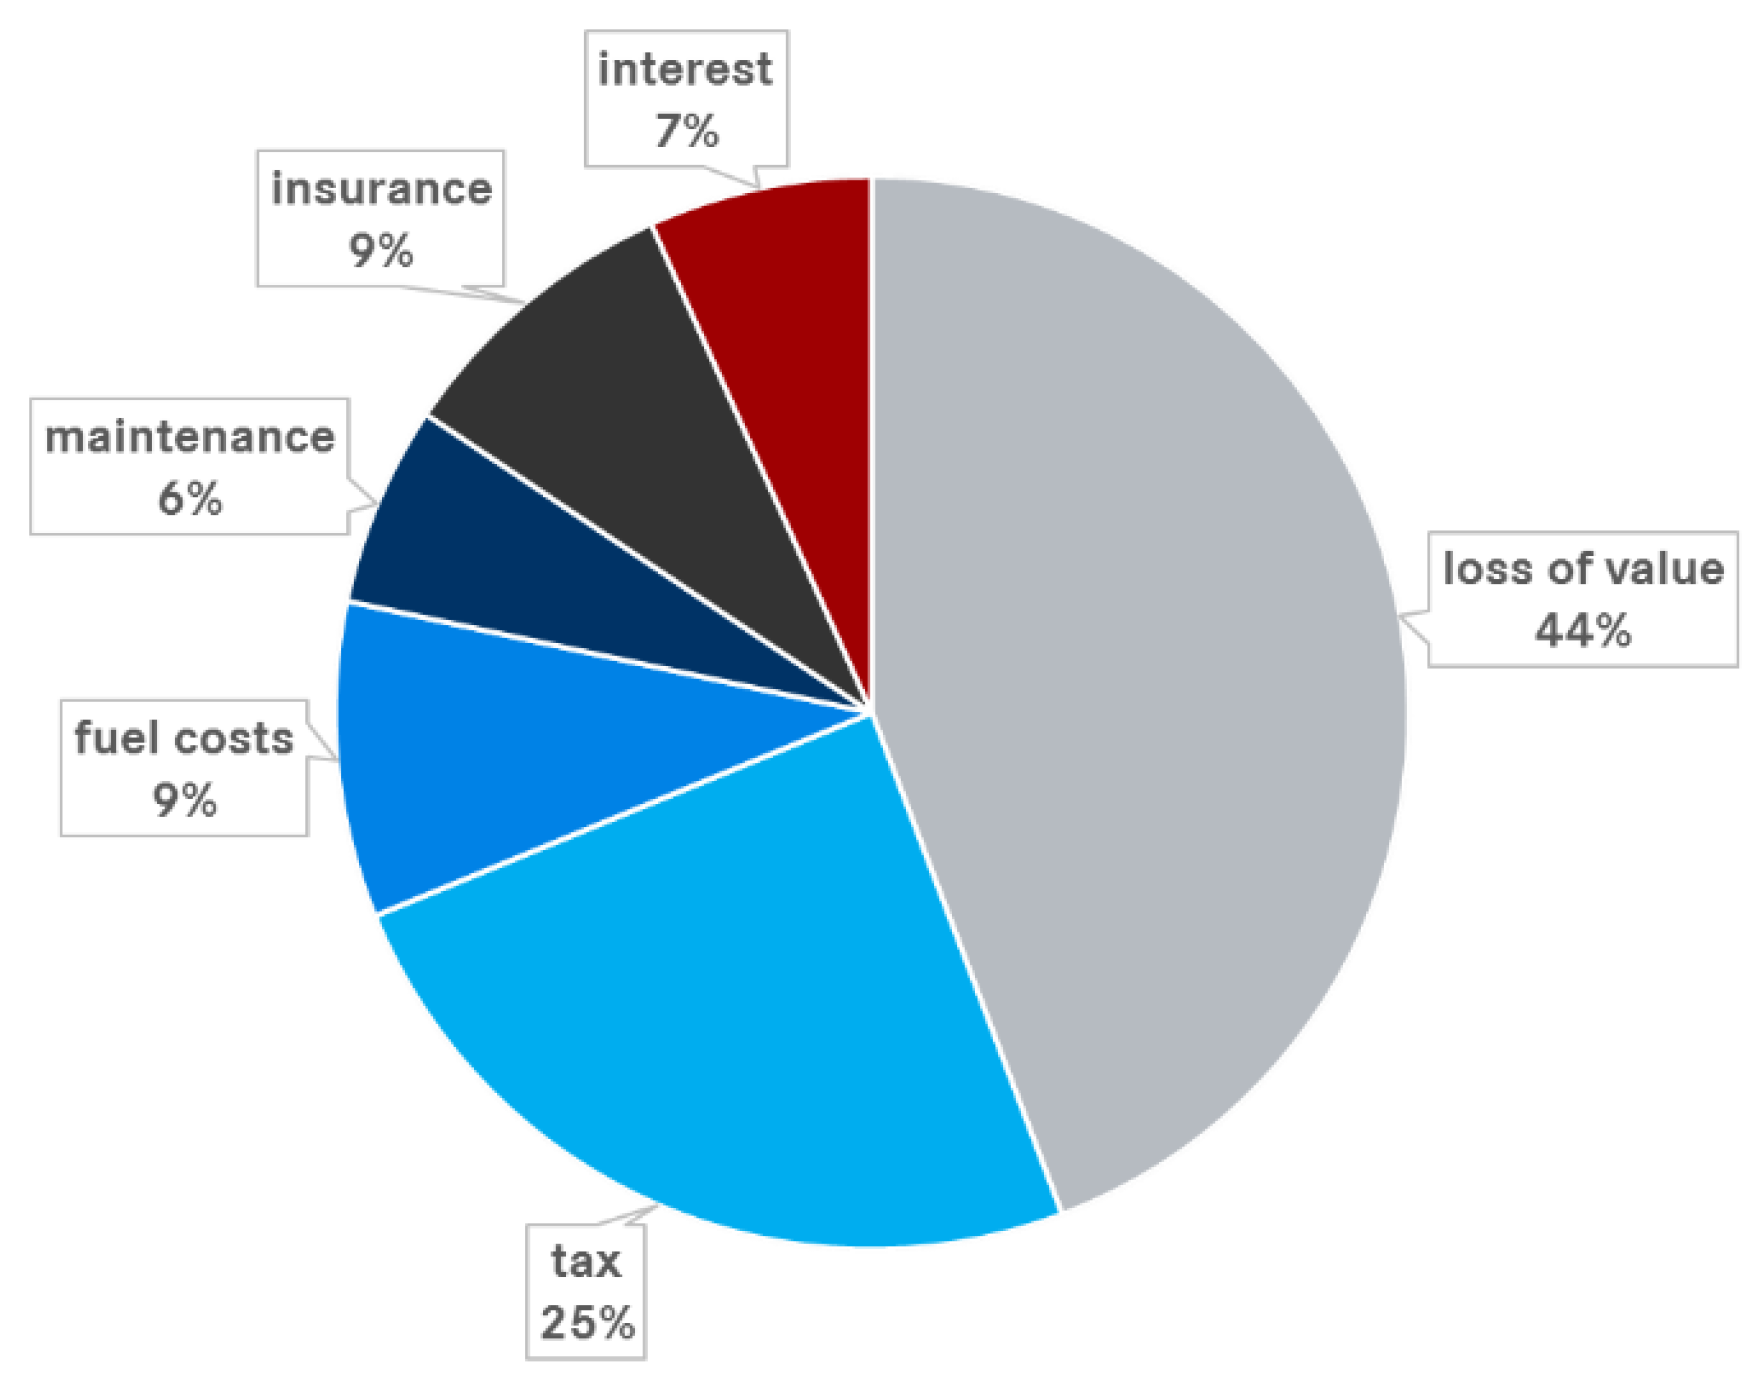
1.1. Total Cost of Ownership
1.2. Vehicle Taxation in Europe
1.2.1. Germany
1.2.2. The Netherlands
1.2.3. Italy
1.2.4. Norway
1.2.5. The United Kingdom
- Category 1 = €5230 (CO2 emissions less than 50 g/km, zero emission range of at least 70 miles)
- Category 2 = €2910 (CO2 emissions less than 50 g/km, zero emission range between 10 and 69 miles)
- Category 3 = €2910 (CO2 emissions between 50 and 75 g/km, zero emission range of at least 20 miles)
1.2.6. France
1.3. Additional xEV Benefits
2. Methodology for a Comparison of Vehicle Taxation Schemes
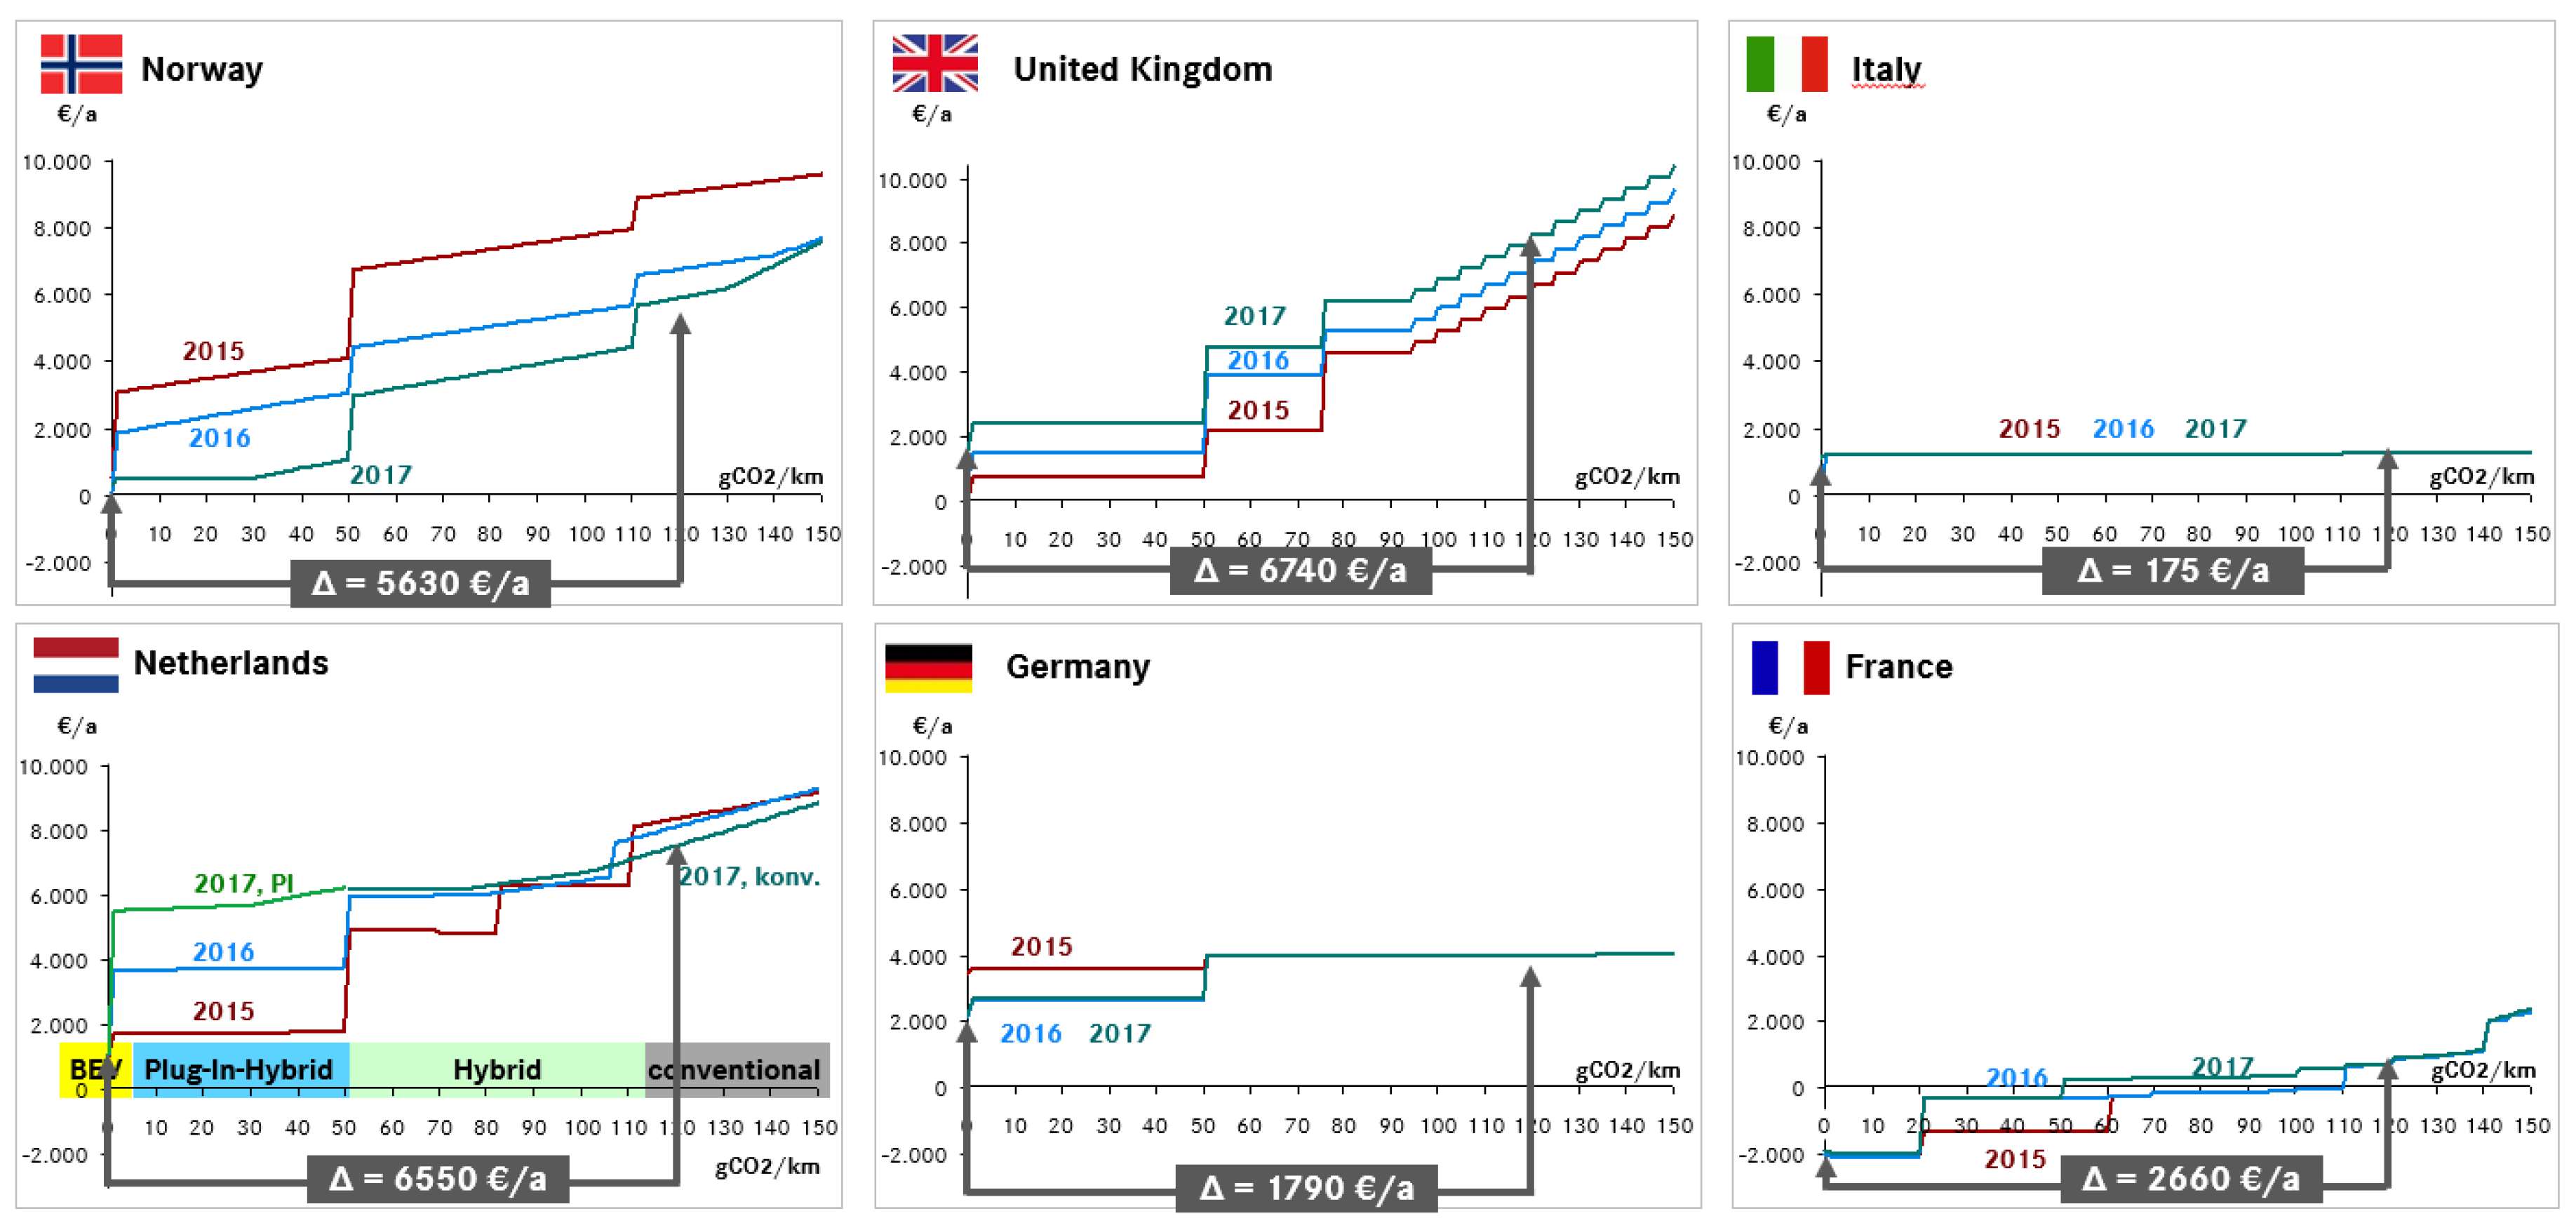
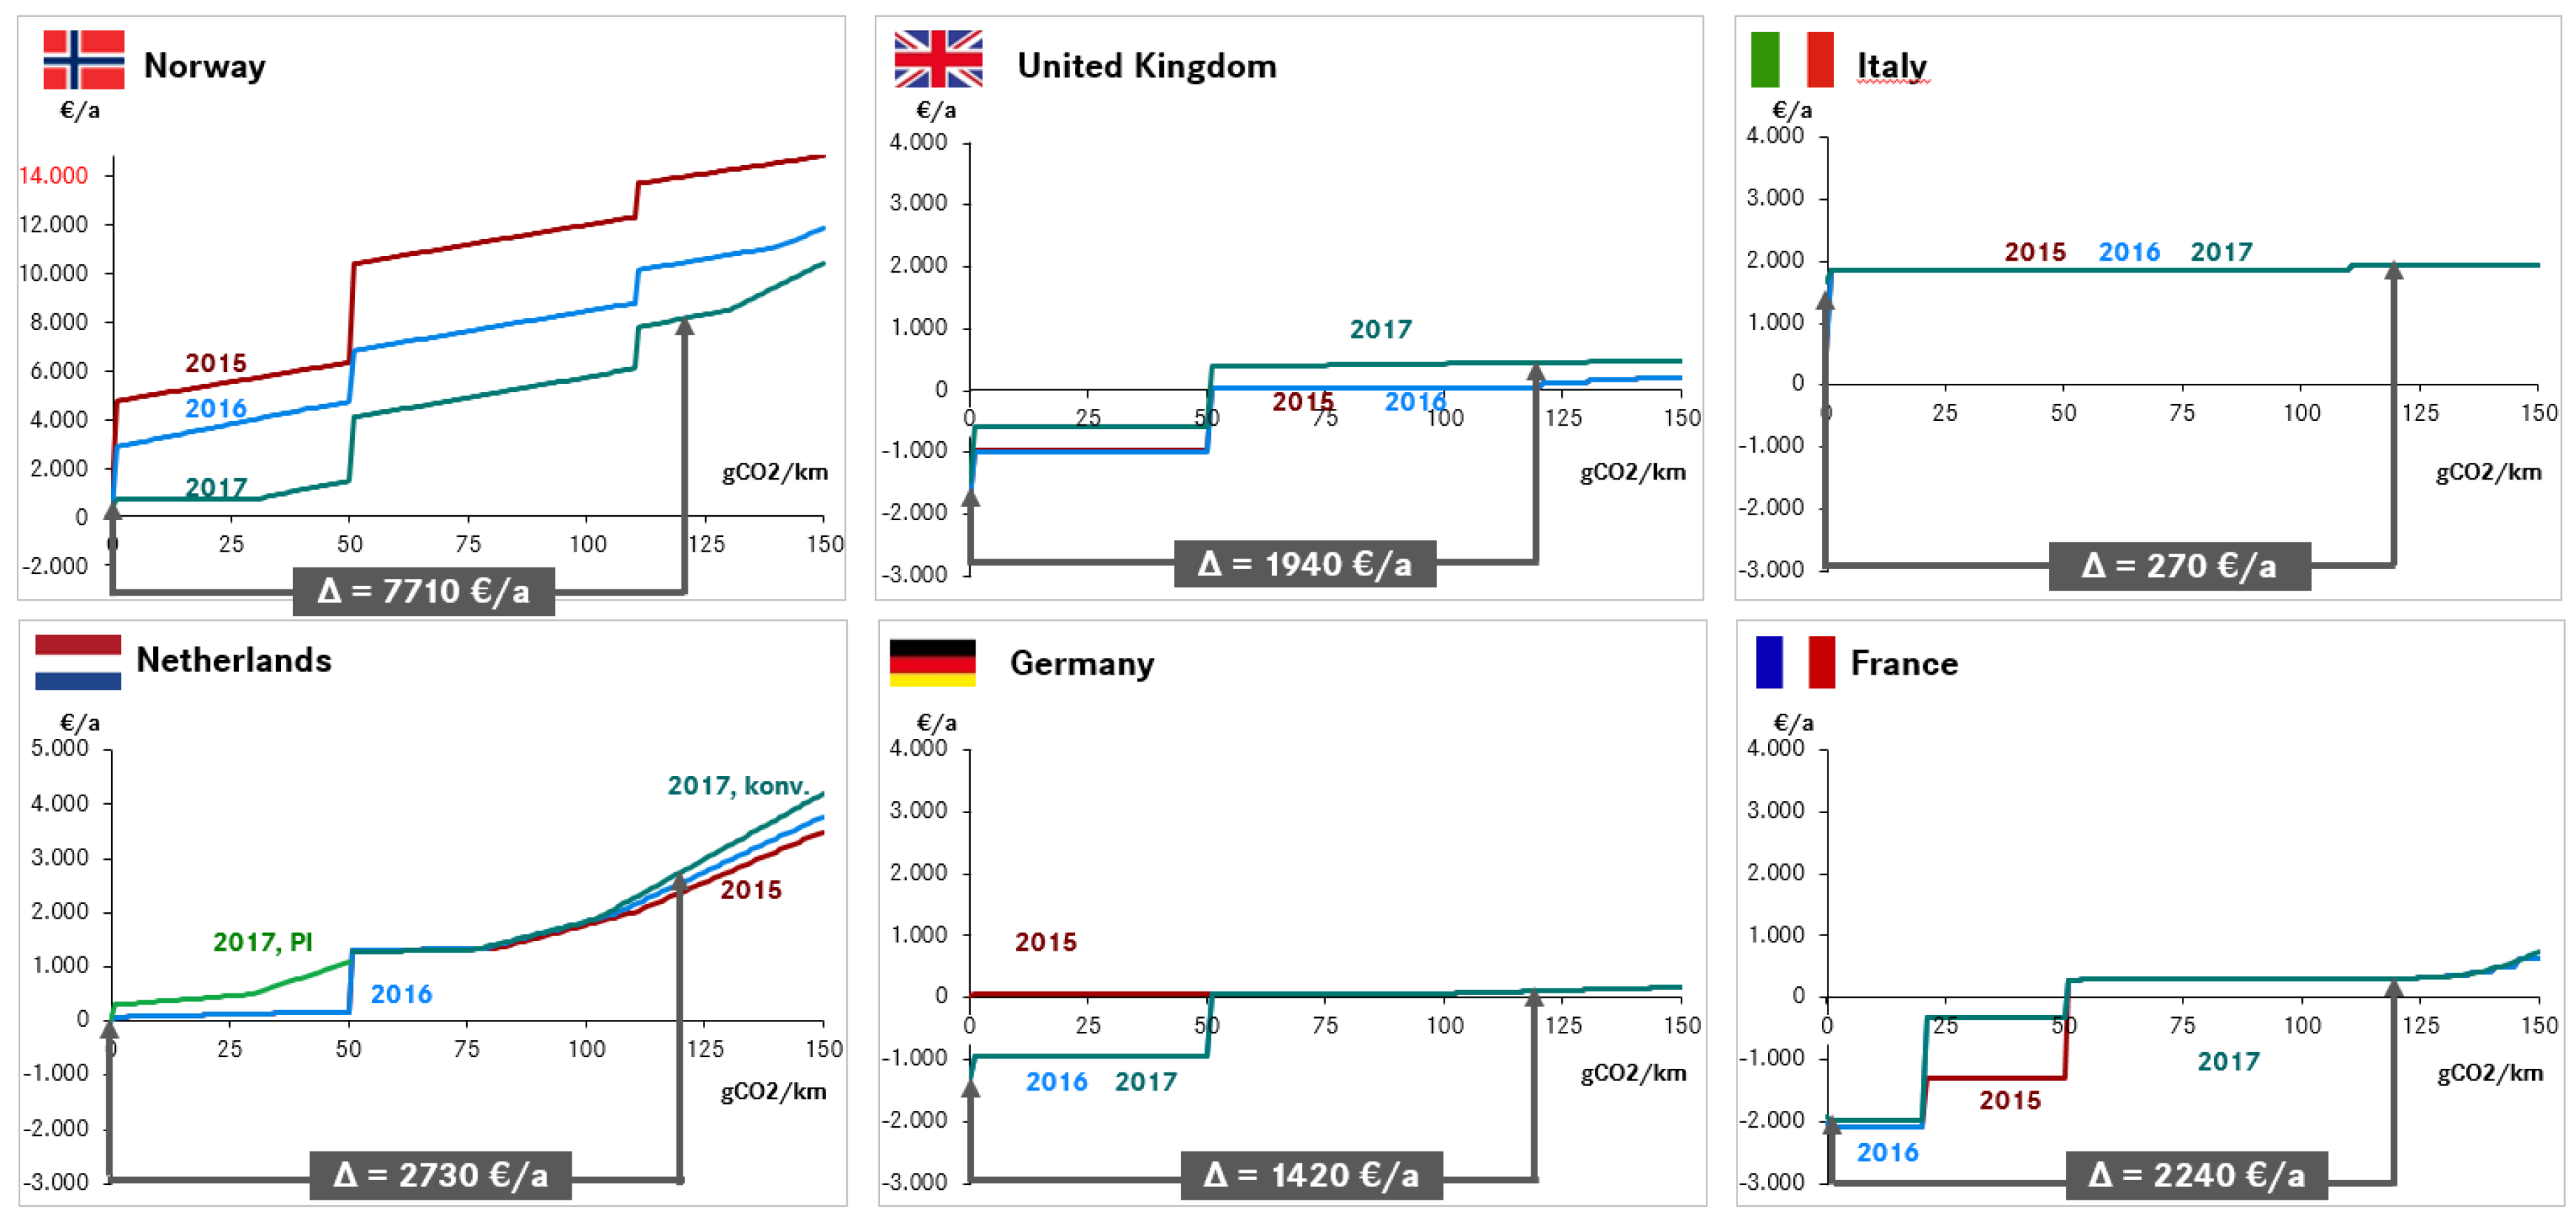
3. Results
4. Outlook
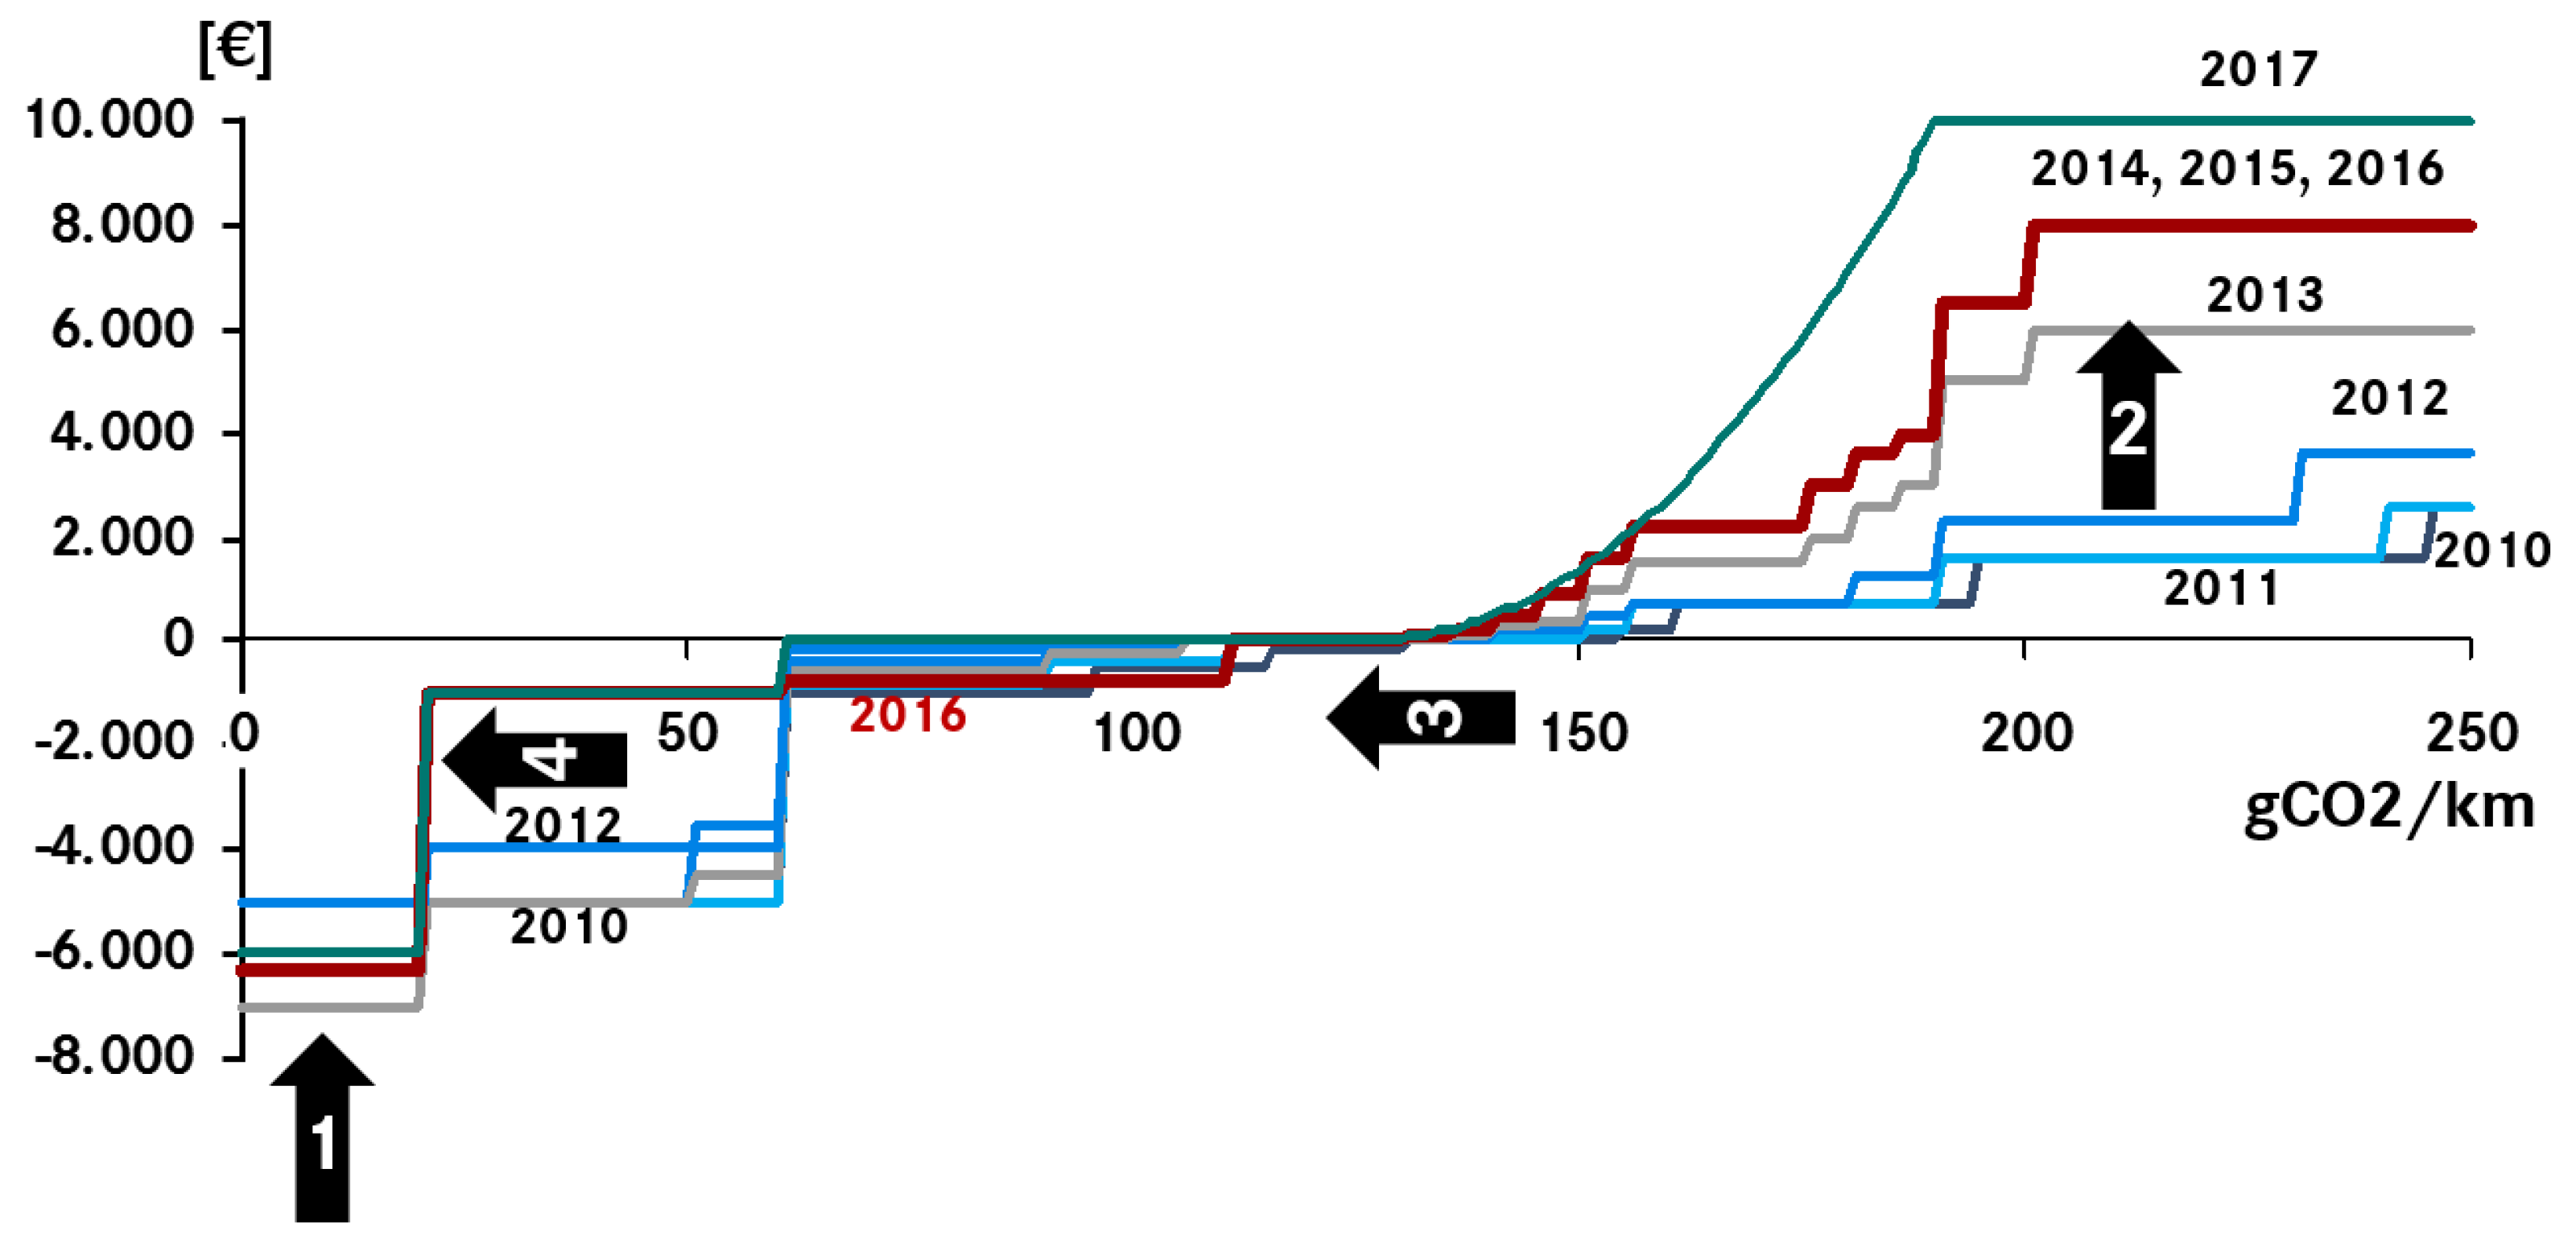
4.1. France
- Decreasing bonus level,
- Increasing malus level,
- The starting point of the malus is shifted to lower CO2 values,
- CO2 limits for subsidies are lowered.
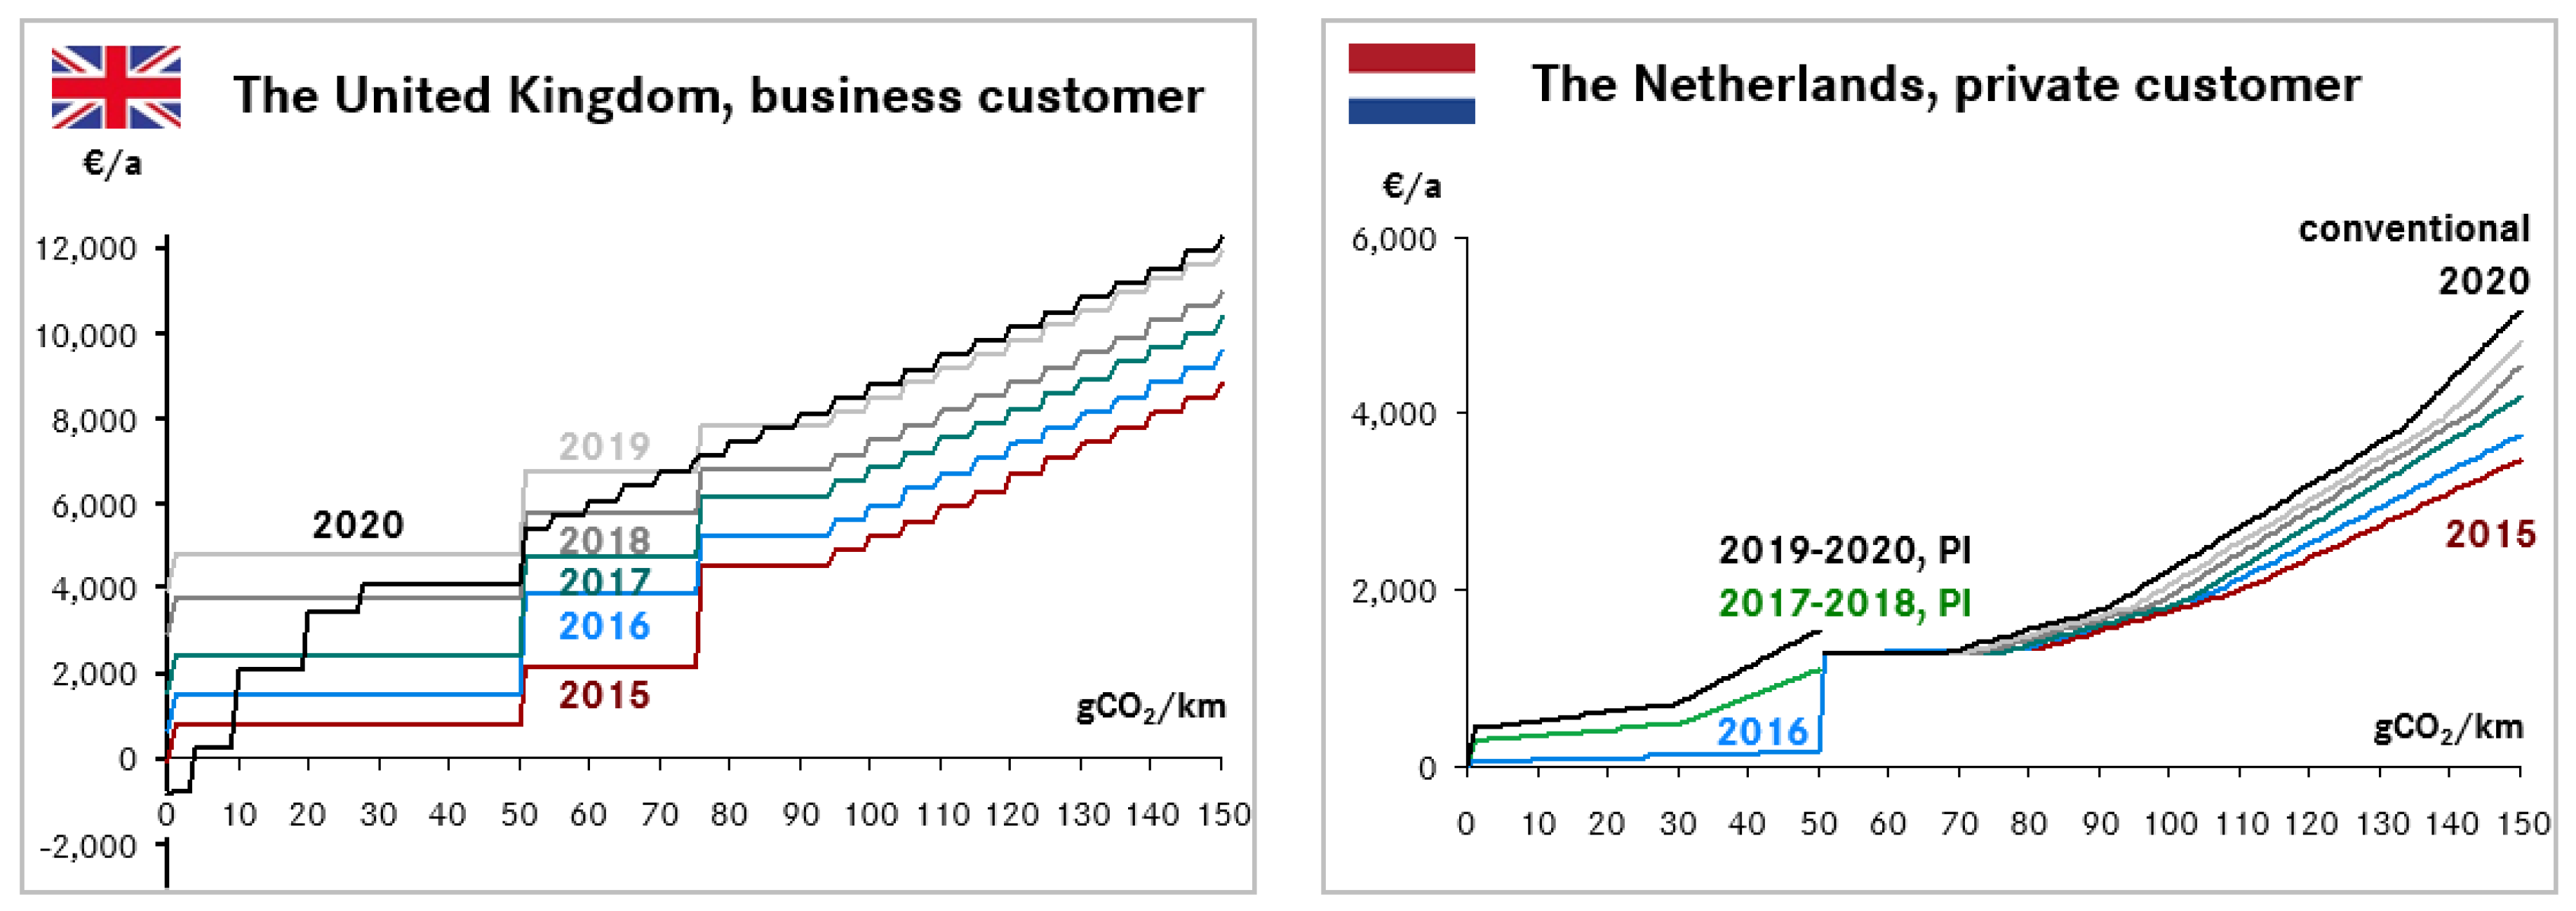
4.2. The United Kingdom
4.3. The Netherlands
4.4. Discussion
5. Conclusions
Author Contributions
Funding
Conflicts of Interest
References
- Al-Alawi, B.M.; Bradly, T.H. Total cost of ownership, payback, and consumer preference modeling of plug-in hybrid electric vehicles. Appl. Energy 2013, 103, 488–506. [Google Scholar] [CrossRef]
- Bubeck, S.; Tomascheck, J.; Fahl, U. Perspectives of electric mobility: Total cost of ownership of electric vehicles in Germany. Transp. Policy 2016, 50, 63–77. [Google Scholar] [CrossRef]
- Pfahl, S.; Jochem, P.; Fichtner, W. When Will Electric Vehicles Capture the German Market? And why? In Proceedings of the 2013 World Electric Vehicle Symposium and Exhibition (EVS27), Barcelona, Spain, 17–20 November 2013. [Google Scholar]
- Chandra, A.; Gulati, S.; Kandlikar, M. Green drivers or free riders? An analysis of tax rebates for hybrid vehicles. J. Environ. Econ. Manag. 2010, 60, 78–93. [Google Scholar] [CrossRef]
- Figenbaum, E.; Kobenstvedt, M. Learning from Norwegian Battery Electric and Plug-in Hybrid Vehicle Users: Results from a Survey of Vehicle Owners; TØI Report 1492/2016; Institute of Transport Economics (TØI): Oslo, Norway, 2016. [Google Scholar]
- Kunert, U.; Kuhfeld, H. The diverse structures of passenger car taxation in Europe and the EU Commissions proposal for reform. Transp. Policy 2007, 14, 306–316. [Google Scholar] [CrossRef]
- ACEA. European Automobile Manufacturers Association. Available online: http://www.acea.be/statistics/tag/category/by-country-registrations (accessed on 8 June 2018).
- European Alternative Fuels Observatory (EAFO). Available online: http://www.eafo.eu/eu (accessed on 8 June 2018).
- HM Revenue & Customs. Benefits in Kind Statistics. Available online: https://www.gov.uk/government/collections/taxable-benefits-in-kind-and-expenses-payments-statistics (accessed on 8 June 2018).
- KBA. Kraftfahrt-Bundesamt. Available online: https://www.kba.de/DE/Statistik/Fahrzeuge/Neuzulassungen/Halter/2016_n_halter_dusl.html?nn=652344 (accessed on 8 June 2018).
- ACEA. ACEA Tax Guide; ACEA: Brussels, Belgium, 2017. [Google Scholar]
- Gallagher, K.S.; Muehlegger, E. Giving green to get green? Incentives and consumer adoption of hybrid vehicle technology. J. Environ. Econ. Manag. 2011, 61, 1–15. [Google Scholar] [CrossRef]
- International Energy Agency. Global EV Outlook 2017; International Energy Agency: Paris, France, 2017; Available online: www.iea.org (accessed on 8 June 2018).
- Zhang, Y.; Qian, Z.S.; Sprei, F.; Li, B. The impact of car specifications, prices and incentives for battery electric vehicles in Norway: Choices of heterogeneous consumers. Transp. Res. Part C Emerg. Technol. 2016, 69, 386–401. [Google Scholar] [CrossRef]
- Service, GDS Government Digital. Available online: https://www.gov.uk/government/publications/budget-2016-documents/budget-2016 (accessed on 8 June 2018).
- GOV.UK. Available online: https://www.gov.uk/government/publications/income-tax-cars-appropriate-percentage-increasing-the-diesel-supplement/income-tax-cars-appropriate-percentage-increasing-the-diesel-supplement (accessed on 12 June 2018).
- European Comission. Guidelines on Financial Incentives for Clean end Energy Efficient Vehicles; European Comission: Brussels, Belgium, 2013. [Google Scholar]
- Plötz, P.; Funke, S.A.; Jochem, P.; Wietschel, M. CO2 Mitigation Potential of Plug-in Hybrid Electric Vehicles larger than expected. Sci. Rep. 2017, 7, 16493. [Google Scholar] [CrossRef] [PubMed]
- ICCT. CO2 Emissions from New Passenger Cars in the EU: Car Manufacturers’ Performance in 2016; ICCT: Washington, DC, USA, 2017. [Google Scholar]


| Private customer in the Netherlands | ||||||
| year | 2015 | 2016 | 2017 | 2018 | 2019 | 2020 |
| vehicle emission (gCO2/km) | 116.4 | 112.5 | 109.5 | 106.0 | 103.5 | 100.0 |
| delta vs. previous year (%) | 3.3 | 2.6 | 3.2 | 2.4 | 3.4 | |
| Business customer in UK | ||||||
| year | 2015 | 2016 | 2017 | 2018 | 2019 | 2020 |
| vehicle emission (gCO2/km) | 140 | 130 | 120 | 110 | 95 | 90 |
| delta vs. previous year (%) | 7.1 | 7.7 | 8.3 | 13.6 | 5.3 | |
© 2018 by the authors. Licensee MDPI, Basel, Switzerland. This article is an open access article distributed under the terms and conditions of the Creative Commons Attribution (CC BY) license (http://creativecommons.org/licenses/by/4.0/).
Share and Cite
Hauff, K.; Pfahl, S.; Degenkolb, R. Taxation of Electric Vehicles in Europe: A Methodology for Comparison. World Electr. Veh. J. 2018, 9, 30. https://doi.org/10.3390/wevj9020030
Hauff K, Pfahl S, Degenkolb R. Taxation of Electric Vehicles in Europe: A Methodology for Comparison. World Electric Vehicle Journal. 2018; 9(2):30. https://doi.org/10.3390/wevj9020030
Chicago/Turabian StyleHauff, Karin, Stefan Pfahl, and Rolf Degenkolb. 2018. "Taxation of Electric Vehicles in Europe: A Methodology for Comparison" World Electric Vehicle Journal 9, no. 2: 30. https://doi.org/10.3390/wevj9020030
APA StyleHauff, K., Pfahl, S., & Degenkolb, R. (2018). Taxation of Electric Vehicles in Europe: A Methodology for Comparison. World Electric Vehicle Journal, 9(2), 30. https://doi.org/10.3390/wevj9020030